
Analysis of Change in Maize Plantation Distribution and Its Driving Factors in Heilongjiang Province, China


1
Key Laboratory of Environmental Change and Natural Disaster, Ministry of Education, Beijing Normal University, Beijing 100875, China
2
Institute of Remote Sensing Science and Engineering, Faculty of Geographical Science, Beijing Normal University, Beijing 100875, China
3
State Key Laboratory of Remote Sensing Science, Jointly Sponsored by Beijing Normal University and Institute of Remote Sensing and Digital Earth of Chinese Academy of Sciences, Beijing 100875, China
4
Lancaster Environment Centre, Lancaster University, Lancaster LA1 4YQ, UK
5
UK Centre for Ecology & Hydrology, Library Avenue, Bailrigg, Lancaster LA1 4AP, UK
6
Center for Geodata and Analysis, Faculty of Geographical Science, Beijing Normal University, Beijing 100875, China
*
Author to whom correspondence should be addressed.
Remote Sens. 2022, 14(15), 3590; https://doi.org/10.3390/rs14153590
Submission received: 31 May 2022
/
Revised: 16 July 2022
/
Accepted: 19 July 2022
/
Published: 27 July 2022
(This article belongs to the Special Issue Monitoring Climate Impacts on Agriculture Using Remote Sensing Techniques)
Abstract
:Accurate identification of maize plantation distribution and timely examination of key spatial-temporal drivers is a practice that can support agricultural production estimates and development decisions. Previous studies have rarely used efficient cloud processing methods to extract crop distribution, and meteorological and socioeconomic factors were often considered independently in driving force analysis. In this paper, we extract the spatial distribution of maize using classification and regression tree (CART) and random forest (RF) algorithms based on the Google Earth Engine (GEE) platform. Combining remote sensing, meteorological and statistical data, the spatio-temporal variation characteristics of maize plantation proportion (MPP) at the county scale were analyzed using trend analysis, kernel density estimation, and standard deviation ellipse analysis, and the driving forces of MPP spatio-temporal variation were explored using partial correlation analysis and geodetectors. Our empirical results in Heilongjiang province, China showed that (1) the CART algorithm achieved higher classification accuracy than the RF algorithm; (2) MPP showed an upward trend in more than 75% of counties, especially in high-latitude regions; (3) the main climatic factor affecting the inter-annual fluctuation of MPP was relative humidity; (4) the impact of socioeconomic factors on MPP spatial distribution was significantly larger than meteorological factors, the temperature was the most important meteorological factor, and the number of rural households was the most important socioeconomic factor affecting MPP spatial distribution. The interaction between different factors was greater than a single factor alone; (5) the correlation between meteorological factors and MPP differed across different latitudinal regions and landforms. This research provides a key reference for the optimal adjustment of crop cultivation distribution and agricultural development planning and policy.
1. Introduction
Agricultural production is an important sector for socio-economic development. Timely and accurate extraction of crop plantation distribution is important for obtaining agricultural information [1,2]. In addition, agricultural production is highly dependent on climatic conditions and natural resources [3,4]. Therefore, exploring the changes in agricultural plantation distribution and their drivers are essential for managing crop production, formulating rational agricultural policies, and ensuring food security under changing climates [5].
There are two major ways to obtain spatial distribution information of crops: (1) the spatial information of crop area statistics and (2) the extraction of crop spatial distribution based on remote sensing image classification. Spatial information in statistics is advantageous due to its simple data processing and good integrability with other types of data. However, the spatial scale of statistics is limited by administrative units, and the reliability of data is limited by statistical methods. In addition, the process of obtaining statistics is labor-intensive and time-consuming, resulting in poor timeliness of the information [6,7]. Remote sensing data has the advantages of high spatial resolution, high timeliness, objectivity, and reliability. Moreover, they are widely used in crop plantation distribution extraction [8,9,10,11,12]. However, the data processing for long time series and large-scale remote sensing data is complicated both in terms of methods and computations.
At present, Google Earth Engine (GEE) provides high-resolution remote sensing data, meteorological data, advanced computing functions, and flexible user interfaces. It has become a new trend to extract high-resolution crop distributions quickly based on the GEE platform. For example, based on the GEE platform, Ref. [13] extracted farmland products at 30-m resolution for Australia and China with an overall accuracy of over 94%; Ref. [14] applied an automated arable land mapping algorithm using MODIS data to obtain the extent of arable land in Africa; Ref. [15] integrated Landsat-8 and Sentinel-2 time series data to extract cropping distribution maps for each China agro-climatic zone. The majority of these studies showed that multi-source remote sensing data extracted using the GEE platform could achieve highly accurate crop plantation distribution for supporting further analyses, whether on temporal changes or their driving forces.
Many studies have focused on the influencing factors of crop distribution. Some studies explored the influence of natural meteorological factors on changes in crop distribution. For example, Ref. [16] analyzed the impact of meteorological indicators changes on rice plantation areas in historical and future periods. Ref. [17] studied the effects of temperature increases on maize plantation distribution in Northeast China. Some studies explored the influence of socioeconomic factors. For example, Ref. [18] suggested crop distribution area will increase more in developing countries than in developed countries, and the trends of crop distribution changes coincide with the trends of population changes. Ref. [19] pointed out that the concentration of agricultural laborers and the level of mechanization could explain more than 60% of the spatial differences in China’s crop distribution. However, meteorological and socioeconomic factors were often considered independently in driving force analysis and few studies have considered the interaction between socioeconomic factors and natural meteorological factors. In addition, the analysis scale of the influence of socioeconomic factors is commonly coarse, such as at the provincial levels, due to the lack of fine-scale data.
The Northeast China maize belt, the U.S. maize belt, and the Ukrainian maize belt are known as the three golden maize belts around the world, in which the speed of climate warming is faster than the global average [20], and they are all located near 45N. Many studies have found that climate factors have a significant impact on agricultural production in this latitude zone. Global warming leads to the maize yield in high-latitude areas increasing, the plantation range moving northward [21], and the growth period shortening [22]. The maize production in Heilongjiang Province, China, accounts for 60% of the total maize production in the northeast maize plantation belt. Climate change has increased the frequency of extreme weather events in this region.
This study takes Heilongjiang Province as the case study area, based on the GEE platform, and uses remote sensing, meteorological and statistical data comprehensively to carry out the following research: (1) extracting the spatial distribution of maize in Heilongjiang Province; (2) exploring the temporal and spatial variation characteristics of maize plantation distribution at the county level; (3) analyzing the factors in relation to temporal and spatial variation of maize plantation distribution at the county level using both meteorological and socioeconomic factors; and (4) comparing and analyzing the differences of influencing factors across different latitudes and landform regions. This study can provide concrete evidence to understand the changes and driving forces of maize plantation in Heilongjiang, China, and serve as a key reference for other relevant studies and in other regions, particularly the maize growing belts in the same latitudinal zone.
2. Study Area and Data
2.1. Study Area
The study area is located in Heilongjiang Province, Northeast China (Figure 1). The region is in the mid-high latitudes of China (43N–53.5N and 121E–135.5E), with extensive arable land and fertile soils. It has a mid-cold temperate continental monsoon climate, with high summer temperatures, high precipitation, and abundant solar radiation throughout the year, providing natural resources for crop growth. Heilongjiang Province is a strategic food security base for China, and its arable land is mainly located in the Songnen Plain in the southwest, which accounts for 41.7% of the province’s arable land, and in the Sanjiang Plain in the northeast, which accounts for 32.4% of the arable land. The crops planted in the region mainly include maize, rice, soybeans, and wheat, with maize accounting for over 40% of all crops. Meanwhile, the region has a typical dryland-rainfed agricultural farming system, which is highly dependent on climatic conditions. This region is representative of studying the impact of meteorological factors on crop cultivation in mid-high latitudes, with the prominent response of global climate change [21] and the increase in the extreme weather event [23].
2.2. Data
The data used in this study mainly include remote sensing and meteorological and statistical data. Landsat 8 OLI and Landsat 7 ETM+ surface reflectance (SR) data were from GEE’s public data archive. The above data can be accessed via ‘LANDSAT/LC08/C01/T1_SR’ and ‘LANDSAT/LE07/C01/T1_SR’ in the GEE platform. The spatial resolution of the data is 30 m, the temporal resolution is 16 days, and the time series covers the period from 2013 to 2020. Chinese land use and land cover (CNLULC) data with a 1-km spatial resolution and Chinese landform type distribution data at a scale of 1 to 1 million were provided by the Resource and Environmental Science Data Center of the Chinese Academy of Sciences (http://www.resdc.cn, accessed on 1 September 2021). Among them, the CNLULC dataset, which is published every five years, was used to extract the range of farmland in 2015 and 2020; the Chinese landform type distribution data published in 2009 were used to classify the landform of the study area into three types: mountainous, hills and plains. The meteorological data were daily data from surface meteorological stations in China provided by the China Meteorological Data Service Center (http://data.cma.cn/, accessed on 1 September 2021). The indicators of precipitation amount, sunshine duration, temperature, atmospheric pressure, wind speed, and relative humidity in this dataset were used in this study. The statistical data mainly included agricultural production and socioeconomic statistics at the municipal level in Heilongjiang Province from 2013 to 2020 provided by the China Bureau of Statistics.
3. Methodology
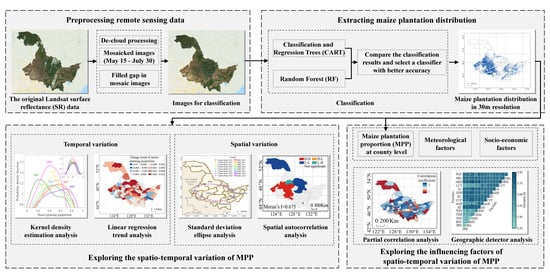
Figure 2 is the technical flowchart of this study. It mainly includes four steps: (1) remote sensing data preprocessing; (2) extraction of maize spatial distribution; (3) analysis of spatio-temporal variation characteristics of maize plantation proportion (MPP) at the county level, and (4) analysis of influencing factors of spatio-temporal variation in MPP.
3.1. Preprocessing Remote Sensing Data
This study extracted the maize plantation distribution based on Landsat SR data provided by the GEE public data archive, with Landsat 8 OLI data as the primary data and Landsat 7 ETM+ data as the secondary data. The data were pre-processed with decloud processing, image mosaics, and composition. First, the pixels in Landsat 8 OLI data with clouds, cloud shadows, and medium cloud confidence of cloud contamination were removed using the quality assessment (QA) band calculated by the C Function of Mask (CFMASK) algorithm [24]. Then, the Landsat 8 OLI images between 15 May and 30 July of each year were selected, the reflectivity values of multi-phase images were extracted pixel by pixel, their median values were calculated to obtain a median image, and then the average deviation between each phase image and the median image was further calculated. The original image corresponding to the minimum average deviation was then mosaicked to form the data to be classified, covering the whole study area. If there were still gaps in the mosaic data, the gaps were filled by the bilinear interpolation method [25] using the filled Landsat 7 ETM+ SLC-off images. The filled Landsat 7 ETM+ SLC-off images were obtained by declouding as described above first and then filling SLC-off gaps using neighboring Landsat 7 ETM+ images on close dates by constructing a linear regression relationship based on the images’ overlapping parts [26,27].
3.2. Extracting the Maize Planting Distribution
The ee.Classifier.smileCart algorithm and the ee.Classifier.smileRandomForest algorithm provided by the GEE cloud infrastructure API were used for maize plantation distribution extraction. The ee.Classifier.smileCart algorithm is based on the classification and regression trees (CART) method. The CART method is a decision tree classification method used in machine learning proposed by [28]. It can make full use of spatial information to combine multiple feature variables of images and to identify useful information in complicated data to realize classification, prediction, and mining of unknown data. The ee.Classifier.smileRandomForest algorithm is based on the random forest (RF) method. The RF method is an ensemble classifier based on multiple decision trees for training and prediction proposed by [29,30]. In the RF classifier, each decision tree works as an independent base learner voting for sample predictions, which enables improved generalization and makes the classification results more reliable. In this study, the ‘maxNodes’ parameter of smileRandomForest algorithm was set to 13, and the ‘numberOfTrees’ was set to 35 and retained the default values for other parameters after careful consideration of model accuracy and efficiency. Then, more than 500 samples of maize plantation distribution were selected each year from 2013 to 2020 by the visual interpretation method, 80% were used as the training dataset, and 20% were left as the validation dataset. Based on the training dataset, the above two classification methods were used to extract the maize plantation distribution at the 30 m resolution, and the accuracy of extraction results was assessed according to OA and Kappa based on the validation dataset.
3.3. Exploring the Spatio-Temporal Variation in Maize Plantation Distribution
We analyzed the temporal and spatial variation characteristics of maize plantation distribution from two aspects: on the one hand, we analyzed the change of MPP with time using the kernel density function and univariate linear regression; on the other hand, we analyzed the change of MPP in spatial distribution with time using standard deviation ellipse analysis (SDE) and spatial autocorrelation analysis. The specific steps are as follows:
First, we calculated the MPP in each county in terms of Equation (1), in which and refer to the maize plantation area and the farmland area in each county, respectively. The of each county was calculated based on the maize plantation distribution data derived from Section 3.2. The of each county from 2013 to 2017 was calculated from CNLULC in 2015, while the of each county from 2018 to 2020 was calculated from CNLULC in 2020.
Second, through kernel density estimation (KDE), the probability density distribution of MPP in the study area was calculated year by year, and the inter-annual change in the probability density distribution was analyzed to explore the overall change characteristics of maize distribution in the study area from 2013 to 2020. KDE is a non-parametric method to estimate the probability density function (PDF) of a limited number of random variables [31,32]. It can explore the distribution characteristics of the data without requiring a priori hypothesis about the data distribution and is independent of the selected interval length, which provides better continuity of the probability distribution than the conventional histogram method.
Third, the MPP from 2013 to 2020 was fitted county by county using univariate linear regression. The slope of the univariate linear regression equation reflects the change in direction and intensity of county-level MPP in the study area from 2013 to 2020 [33].
Fourth, the spatial variation characteristics of MPP in each county with time were analyzed by SDE. The SDE proposed can reveal the spatial distribution of geographical elements from multiple perspectives, including the range, shape, direction, and gravity center of the distribution [34,35]. For example, the gravity center of the ellipse reflects the core of the spatial element distribution, the axis length of the ellipse represents the direction of the spatial element distribution, and the shape of the ellipse indicates the level of dispersion of the spatial element.
Finally, for each study year, we analyzed the overall spatial agglomeration characteristics of MPP through the global Moran’s I index and determined the location of high/low-value agglomeration of MPP in the study area through the local Moran’s I index. The inter-annual changes in aggregation characteristics were then compared and analyzed.
3.4. Exploring the Influencing Factors of Maize Plantation Distribution Spatio-Temporal Variation
This study selected a number of influencing indicators to explore the causes of spatio-temporal variation in MPP through partial correlation analysis and geographic detectors. Among them, the meteorologic indicators include precipitation (PRE), atmospheric pressure (PRS), relative humidity (RHU), sunshine duration (SSD), temperature (TEM), and wind speed (WIN); the socioeconomic indicators include agriculture employees (AE), agriculture gross product (AGP), consumption of chemical fertilizers (CCF), electricity consumed in rural areas (EC), gross regional product (GDP), irrigated area (IA), land use-land cover transformation (LUT), number of rural households (NRH), number of rural laborers (NRL), and percentage of area with flood prevention measures (PAF). Partial correlation analysis explored the correlation between influencing factors and MPP from a temporal perspective and only analyzed meteorological factors. The geographical detector explored the spatially stratified heterogeneity of MPP and the influence of each factor on MPP from a spatial perspective, and the geographical detector analyzed both meteorological factors and socioeconomic factors. The specific steps are as follows:
First, the average value of the meteorological factor in the growing season (April to September) was calculated year by year for each station, and then the grid data (30-m spatial resolution) of the meteorological factor were generated by inverse distance weighted interpolation. On this basis, the mean values of each meteorological factor were calculated in each county. After that, partial correlation analysis was used to explore the degree of correlation between each meteorological factor and MPP at the county level in the study area. Partial correlation analysis is the process that analyzes the correlation degree between two variables only ( and Y) when multiple variables () are all correlated with a particular variable (Y), taking the other variables as control variables. When the number of control variables is n, the partial correlation coefficient is called the derivative partial correlation coefficient. In the process of partial correlation analysis, for the six meteorological factors of rainfall, atmospheric pressure, relative humidity, sunshine duration, temperature, and wind speed, we calculate the fifth-order partial correlation coefficient between one of the meteorological factors and the MPP in each county by controlling the other five meteorological factors.
Second, based on the geographic detector, we analyzed the effects of different meteorological factors on the MPP year by year and per month (only in the months of the growth period, i.e., April to September), and we also analyzed the effects of different meteorological factors and socioeconomic factors comprehensively on the MPP. We refer to the above three types of analysis as annual analysis, monthly analysis, and comprehensive analysis. The geographical detector, i.e., geodetector, is a statistical tool for detecting spatial heterogeneity (SH), exploring the determinants behind SH, and analyzing the interaction relationships between determinants [36]. It has been widely used in natural and socioeconomic fields at different scales [37,38]. In a factor detector, the q-statistic value is used to measure the spatial heterogeneity of variable Y and how much of the spatial heterogeneity of variable Y is explained by factor X, with a high q-statistic value indicating a strong explanatory ability. The q-statistic value is calculated using the following Equation (2):
where is the strata (classification or partition) of variable Y or factor X; and N are the numbers of units in layer h and the whole region, respectively; and and are the variance values of Y for layer h and the whole region, respectively.
The interaction detector can be used to evaluate the interaction between different factors and reveals whether the interactive influence of factors and will increase or decrease the driving force on variable Y. Similar to the factor detector, the high q statistic value of the interaction factor indicates its high explanatory ability for the dependent variable Y. The details are as follows:
- Calculate the q statistic values of two factors and : and .
- Overlay the two layers and to obtain the composite layer .
- Calculate the q statistic values of composite layer :
- Compare , and
For the annual analysis, the input data were the average values of meteorological factors in the maize growing season. The annual analysis was carried out year by year from 2013 to 2020. For the monthly analysis, the input driving factor was the multiyear average of the meteorological factor for a given month from 2013 to 2020. The monthly analysis was carried out month by month during the growing season. For a comprehensive analysis, the input data included meteorological and socioeconomic factors. Meteorological factors were the same as those used in the annual analysis. Socioeconomic factors were reported at the municipal level. For each socioeconomic factor, we calculated its average value from 2013 to 2020 in each city.
4. Results
4.1. Maize Plantation Distribution
The CART algorithm has better classification accuracy than the RF algorithm, with overall accuracy ranging from 0.9444 to 0.9882 and Kappa coefficients ranging from 0.8849 to 0.9761, and the maize is widely planted in both the Songnen and Sanjiang Plain areas. The detailed classification accuracy and the maize plantation distribution from 2013 to 2020 extracted by the CART algorithm are shown in Table A1 and Figure A1 in Appendix A.
4.2. Spatio-Temporal Variation in Maize Plantation Distribution
4.2.1. Temporal Variation of Maize Plantation
According to the expectations of the kernel density estimation function (Figure 3a), the MPP between 2013 and 2020 showed a trend of ’double peaks,’ in which the peaks were reached in 2015 and 2019, and the lowest value was shown in 2017. According to the kernel density estimation function between 2013 and 2020 (Figure 3b), the peaks of the PDF curve in 2019 were mainly distributed in the high-value zone, i.e., the counties with high MPP were more widely distributed in 2019 than in other years. The curve in 2015 shows a standard normal distribution, with the center peak at 50%, i.e., the MPP in a large number of counties was approximately 50%. In 2017, the PDF curve showed a ‘double peak’ feature, and the main peak was distributed in the low-value zone, i.e., the MPP in 2017 was lower than those in other years, and there was a significant value gap since a few counties had significantly lower MPP values than the average in the study area.
Figure 4 shows the trend analysis results. Overall, the MPP values in over 75% of the counties showed increasing trends. First, the higher the latitude, the larger the proportion of counties showing an increasing trend in the maize plantation distribution. Among them, all counties located at latitudes between 50N–53.5N showed increasing trends in MPP, and the percentage of counties with increasing trends in MPP of the 46.5N–50N latitude range was 77%, while this percentage in the 43.5N–46.5N latitude range was lower than the study area average. Second, the MPP showed similar variation trends in different landform regions, and the influence of latitude was stronger than that of landform on the maize plantation distribution.
4.2.2. Spatial Distribution Characteristics and Changes in Maize Plantation
The standard deviation ellipse and ellipse center of the maize plantation distribution in the study area from 2013 to 2020 are shown in Figure 5. Overall, the spatial distribution pattern of the maize planted has a northwest-southeast direction. First, the length of the ellipse long axis (i.e., northwest-southeast direction) changed insignificantly, while the length of the ellipse short axis (i.e., northeast-southwest direction) increased continuously from 2013–2017. The ellipse flatness varied at approximately 0.6, and the lowest ellipse flatness was 0.5936 in 2017. These changes indicate that the maize plantation distribution in the study area from 2013 to 2017 had a trend of expanding in the northeast-southwest direction. Among them, the maize planting range was the widest and most dispersed in 2017. Second, the ellipse center was located at 127.8E, 47N, and the ellipse center repeatedly shifted in the northeast-southwest direction. For 2013 and 2017, when the MPP was lower than in other years, the ellipse center was more towards the western side than in other years; for 2015 and 2019, when the MPP was higher than in other years, the ellipse center was more towards the southern side than in other years.
The results of the spatial autocorrelation analysis are shown in Figure 6. The Moran’s I index of global spatial autocorrelation analysis for MPP from 2013 to 2020 ranged from 0.661 to 0.669, which indicated that the maize plantation distribution in the study area had obvious spatial clustering characteristics. The results of local spatial autocorrelation analysis showed that the high-high value clusters of MPP were mainly distributed in the Songnen and Sanjiang Plains. The counties and cities belonging to the high-high value clusters were essentially stable, and the MPP values in most of them were higher than 0.80. The low-low value clusters were mainly located in the southeastern areas of the lesser Khingan mountains and the northern areas of the Greater Khingan Mountains. The MPP values in most counties and cities in low-low value clusters were less than 0.1. It is worth noting that Wudalianchi city fluctuated between high-high value clusters and high-low clusters, with the MPP increasing from 0.38 to 0.43 from 2013 to 2020. Wudalianchi city is located in the transition zone between the Lesser Khingan Mountains and the Songnen Plain and is potentially a new maize planting area. In contrast, some counties in Mudanjiang city located in the western Changbai Mountains have been transformed into unstable low-value clusters, with the MPP values in this area falling from 58% to 49% and may become a new maize plantation ‘depression’.
4.3. Spatio-Temporal Variation in Influencing Factors of Maize Plantation Distribution
4.3.1. Results of the Partial Correlation Analysis
Figure 7 shows the correlation coefficients between different meteorological factors and MPP inter-annual fluctuation in each county and the proportions of counties with positive/negative correlations in different latitudes and landform regions. First, the precipitation and atmospheric pressure factors showed negative correlations with the MPP in more than 60% of counties, the relative humidity factor showed a positive correlation with the MPP in more than 70% of counties, and the rest of the factors showed positive or negative correlations with MPP in almost equal percentages of counties. Second, the correlation between meteorological factors and the MPP differed obviously in different latitudinal regions and landform regions. As the landform varies from plains to mountains, the proportions of counties with positive correlations between MPP and precipitation, atmospheric pressure, and wind speed gradually increased, while the proportions of counties with positive correlations between MPP and relative humidity, sunshine duration, and the temperature gradually decreased. At latitudes of 50N–53.5N, the number of counties with a positive correlation between MPP and meteorological factors (excluding sunshine durations) was higher than the number of counties with a negative correlation. In most counties at 46.5N–50N latitude, MPP is positively correlated with relative humidity, sunshine duration, and temperature and negatively correlated with precipitation and atmospheric pressure. In most counties at 43N–46.5N latitude, MPP is positively correlated with relative humidity and negatively correlated with atmospheric pressure and wind speed.
In addition, the proportion of counties with a positive correlation between MPP and meteorological factors (excluding sunshine durations) is higher in the 50N–53.5N latitude than in the other two regions.
Figure 8 shows the meteorological factor with the largest partial correlation coefficient with MPP in each county and the frequency of these most relevant factors in different landform and latitude regions. In the whole study area, the most relevant meteorological factor with MPP is relative humidity, followed by sunshine durations. The meteorological factors most related to the MPP vary in different latitudes and topographic areas. In plains areas, the meteorological factor most related to the MPP is relative humidity, while in mountainous areas, it is rainfall. The frequency of precipitation and wind speed factors, as the most relevant meteorological factors, increased significantly with increasing altitude, while the sunshine duration factor showed the opposite trend. The relative humidity factor, as the most relevant meteorological factor, mainly appeared in the 43N–50N latitude region but did not appear in the 50N–53.5N latitude region.
4.3.2. Results of Geographic Detector Analysis
The annual, monthly, and comprehensive analysis results based on the geodetector are shown in Figure 9. The annual analysis (Figure 9a) reflects the influencing factors of the spatial difference in MPP in different counties for each year. Overall, the q statistic value of temperature was the highest, followed by wind speed, and the q statistic value of wind speed increased along with time. This indicates that temperature was the most important meteorological factor affecting the MPP spatial distribution, and the impact of wind speed increased gradually. In addition, there were significant inter-annual differences in the effects of sunshine duration, relative humidity, and precipitation on the MPP spatial distribution. Sunshine duration and relative humidity both showed much stronger effects in 2013, 2016, 2017, and 2019 than those in other years, while the influence of precipitation was much weaker in 2013 and 2015 than in other years.
Monthly analysis was used to reflect the impact of meteorological factors in different months of the maize growing season on the MPP spatial distribution (Figure 9b). The q statistic value of the temperature factor was the highest among all meteorological factors from April to July, with the highest value of 0.484 in June, indicating that temperature had the strongest influence on maize plantation in the early and middle stages of maize growth. Among all meteorological factors, the q statistic value of wind speed in August was the highest (0.359), and the q statistic value of sunshine duration in September was the highest (0.396), indicating that wind speed and sunshine duration had a stronger impact on maize plantation in the middle and late stages of maize growth. The influence of relative humidity and precipitation differed in each month of the growing season. The q statistic values of relative humidity were higher than 0.25 in May–June and below 0.15 in the other months. The q statistic values for precipitation were 0.328 in June and 0.279 in August, significantly higher than in other months.
The comprehensive analysis results (Figure 9c,d) reflect the effects of different meteorological and socioeconomic factors on the spatial distribution of MPP. Socioeconomic factors had a significantly higher driving effect than meteorological factors. The number of rural households and the gross regional product were the strongest drivers of socioeconomic factors. Meanwhile, the temperature remained the most important meteorological factor affecting maize plantations after excluding the influence of socioeconomic factors. In addition, the interaction between PAF and RHU had the most significant impact on maize plantation, followed by the interaction between AGP and RHU and the interaction between AGP and SSD.
5. Discussion
A number of studies have shown that the maize plantation distribution in the study area is highly correlated with temperature change [17,39,40], and agricultural production in this area is more sensitive to global climate annual variability [21,22,41,42,43,44,45], as shown in the results of this study. For the middle- and high-latitude crop plantation belt, on one land, climate warming increases the heat resources in these areas and widens the area suitable for crop plantation, which tends to expand to high-dimensional and high-altitude areas. On the other hand, the respiration of crops will increase with the increase in temperature, which will accelerate the consumption of nutrients, impact the maturity of crops and limit the growth of crop yield. Therefore, it is still uncertain whether the gain effect of climate change on crop distribution in this region can increase crop yield and whether the gain effect can be sustained or expanded [46,47]. The benefit of increasing temperatures needs to be used rationally to capture the right timing for sowing and harvesting and to extend the maize growing season appropriately, which will help to increase maize yields per unit area. In addition, the negative impact of meteorological factors such as extreme precipitation and windstorm events on the major maize growing areas suggests that farmers need to actively apply disaster prevention and reduction measures to face the increasing frequency of flooding and wind damage and avoid the impact of extreme meteorological events on crop production.
In contrast to previous studies, we analyzed both the factors affecting the inter-annual change in maize plantation and the factors affecting the spatial distribution of maize plantation at the same time. Partial correlation analysis showed that among various climatic factors, the main climatic factor affecting the inter-annual fluctuation of maize plantations was relative humidity. Geographic detector analysis shows that among various climatic factors, the main factor affecting the spatial difference of maize plantation was temperature. In addition, the interaction between different factors was greater than that of a single factor, and the impact of socioeconomic factors was greater than that of meteorological factors. These findings indicate that the impact of climate factors on maize plantations is extremely complex. The factors that affect the inter-annual change of maize plantations and the spatial distribution of maize plantations may be different. The method used in this paper can provide a reference for analyzing the impact factors of inter-annual variation and spatial distribution of other regions or other crop types.
This study comprehensively uses multi-source data to explore the temporal and spatial distribution changes and driving forces of maize planting from multiple scales and angles, which provides a methodological reference for other related studies. However, there are still shortcomings in this study. Firstly, due to the limitations of data acquisition, some factors are difficult to capture for quantitative analysis, especially on a fine spatial scale. For example, many studies have shown that maize price is an important factor affecting maize plantations [48,49]. In our study area, only provincial data on the maize price index can be collected. We calculated the average value of annual MPP in Heilongjiang Province, China, and compared it with the maize price index (Figure 10). There is a significant lag correlation between the inter-annual fluctuation of maize price and the fluctuation of MPP. However, it is difficult to use provincial price index data to support the analysis at a fine spatial scale (such as at the county level). Second, the Heilongjiang land reclamation administration farm, one of China’s state-owned farms, manages approximately 10% of arable land in the study area. It is guided by the national agricultural production plan in its production and management and provides a reference for the professionalization, commercialization, and modernization of China’s agricultural production. Some studies show that state-owned farms respond more rapidly and flexibly to changes in agricultural policies and have more advanced agricultural mechanization and scientific agricultural management so that human activities (e.g., socioeconomic factors and agricultural policies) have a more significant impact on their plantation distribution than on smallholder/scattered private farmland [50,51]. Third, the production of maize is determined by two factors: plantation area and yield per unit area. This study only focused on the influencing factors of the distribution of maize planting but did not consider the influencing factors of maize yield per unit area. Given the limitations mentioned above, we plan to collect more available climate and socio-economic data to explore further the factors affecting maize planting, especially the analysis of the factors affecting the maize yield per unit area, to have a more comprehensive understanding of the factors affecting the fluctuation of maize production in the region.
6. Conclusions
Based on the GEE platform, this study combined remote sensing, meteorological and statistical data to extract the spatial distribution of maize and explore the spatio-temporal variation characteristics and driving forces of the maize plantation distribution in Heilongjiang Province, China, from 2013 to 2020. The main conclusions are as follows: First, the CART algorithm achieved higher classification accuracy than the RF algorithm. Second, the proportion of maize plantations in more than 75% of counties showed an upward trend. Maize plantations had obvious spatial clustering characteristics in the Songnen Plain. Third, partial correlation analysis showed that amongst various climatic factors, the main climatic factor affecting the inter-annual fluctuation of maize planting was relative humidity. Fourth, geographic detector analysis showed that the impact of socioeconomic factors on MPP spatial distribution was significantly greater than meteorological factors. The interaction between different factors was greater than a single factor. Among the meteorological factors, the temperature was the most important factor affecting MPP spatial distribution, especially in the early stage of the growing season. Among the socioeconomic factors, the number of rural households was the most important factor affecting MPP spatial distribution. The interaction between flood control measures and relative humidity was greater than between other factors. This study provides a key reference for the optimal adjustment of crop plantation distribution and agricultural development.
Author Contributions
X.Z.: Conceptualization, Data curation, funding acquisition, visualization, writing—review & editing; R.G.: conceptualization, formal analysis, investigation, methodology, software, validation, visualization, writing—original draft, writing—review & editing; C.Z.: writing—review & editing; C.C.: writing—review & editing. All authors have read and agreed to the published version of the manuscript.
Funding
This work was supported by the National Key R&D Program of China (Grant No. 2019YFA0606901) and the National Natural Science Foundation of China (Grant No. 42077436). Ce Zhang was supported by the Natural Environment Research Council [grant number NE/T004002/1].
Data Availability Statement
Not applicable.
Conflicts of Interest
The authors declare that they have no known competing financial interests or personal relationships that could have appeared to influence the work reported in this paper. The funders had no role in the work of this paper.
Abbreviations
The following abbreviations are used in this manuscript:
| AE | Agriculture Employees |
| AGP | Agriculture Gross Product |
| CART | Classification And Regression Tree |
| CCF | Consumption of Chemical Fertilizers |
| CFMASK | C Function of Mask |
| CNLULC | Chinese Land Use And Land Cover |
| EC | Electricity Consumed in rural areas |
| IA | Irrigated Area |
| GDP | Gross Regional Product |
| GEE | Google Earth Engine |
| KDE | Kernel Density Estimation |
| LUT | Land Cover Transformation |
| MPP | Maize Plantation Proportion |
| NRH | Number of Rural Households |
| NRL | Number of Rural Laborers |
| PAF | Percentage of Area with Flood prevention measures |
| Probability Density Function | |
| PRE | Precipitation |
| PRS | Atmospheric Pressure |
| QA | Quality Assessment |
| RF | Random Forest |
| RHU | Relative Humidity |
| SDE | Standard Ellipse analysis |
| SH | Spatial Heterogeneity |
| SR | Surface Reflectance |
| SSD | Sunshine Duration |
| TEM | Temperature |
| WIN | Wind Speed |
Appendix A

Table A1.
Maize planting distribution extraction accuracy.
| Year | smileCart | smileRandomForest | ||
|---|---|---|---|---|
| Overall Accuracy | Kappa | Overall Accuracy | Kappa | |
| 2013 | 0.9724 | 0.9436 | 0.9628 | 0.9107 |
| 2014 | 0.9444 | 0.8849 | 0.9328 | 0.9045 |
| 2015 | 0.9882 | 0.9761 | 0.9784 | 0.9478 |
| 2016 | 0.9592 | 0.9183 | 0.9652 | 0.9246 |
| 2017 | 0.9870 | 0.9739 | 0.9723 | 0.9548 |
| 2018 | 0.9783 | 0.9563 | 0.9457 | 0.9369 |
| 2019 | 0.9643 | 0.9245 | 0.9367 | 0.8974 |
| 2020 | 0.9800 | 0.9584 | 0.9124 | 0.8753 |
Figure A1.
The maize plantation distribution from 2013 to 2020 (a1–h1) and the maize plantation proportion at the county level from 2013 to 2020 (a2–h2).
Figure A1.
The maize plantation distribution from 2013 to 2020 (a1–h1) and the maize plantation proportion at the county level from 2013 to 2020 (a2–h2).

References
- Li, Z.; Yang, P.; Wu, W.; Li, Z.; You, L. Spatio-temporal changes in Chinese crop patterns over the past three decades. Acta Geogr. Sin. 2016, 71, 840–851. [Google Scholar] [CrossRef]
- Verburg, P.H.; Chen, Y.; Veldkamp, T.A. Spatial explorations of land use change and grain production in China. Agric. Ecosyst. Environ. 2000, 82, 333–354. [Google Scholar] [CrossRef]
- Hatfield, J.L.; Boote, K.J.; Kimball, B.A.; Ziska, L.H.; Izaurralde, R.C.; Ort, D.; Thomson, A.M.; Wolfe, D. Climate Impacts on Agriculture: Implications for Crop Production. Agron. J. 2011, 103, 351–370. [Google Scholar] [CrossRef] [Green Version]
- Ray, D.K.; Gerber, J.S.; MacDonald, G.K.; West, P.C. Climate variation explains a third of global crop yield variability. Nat. Commun. 2015, 6, 5989. [Google Scholar] [CrossRef] [PubMed] [Green Version]
- Godfray, H.C.J.; Beddington, J.R.; Crute, I.R.; Haddad, L.; Lawrence, D.; Muir, J.F.; Pretty, J.; Robinson, S.; Thomas, S.M.; Toulmin, C. Food Security: The Challenge of Feeding 9 Billion People. Science 2010, 327, 812–818. [Google Scholar] [CrossRef] [Green Version]
- You, L.; Wood, S.; Wood-Sichra, U. Generating plausible crop distribution maps for Sub-Saharan Africa using a spatially disaggregated data fusion and optimization approach. Agric. Syst. 2009, 99, 126–140. [Google Scholar] [CrossRef]
- You, L.; Wood, S. Assessing the spatial distribution of crop areas using a cross-entropy method. Int. J. Appl. Earth Obs. Geoinf. 2005, 7, 310–323. [Google Scholar] [CrossRef]
- Xiao, G.; Zhu, X.; Hou, C.; Liu, Y.; Xu, K. A Spatialization Method for Grain Yield Statistical Data: A Study on Winter Wheat of Shandong Province, China. Agron. J. 2019, 111, 1892–1903. [Google Scholar] [CrossRef]
- Zhu, X.; Xiao, G.; Wen, P.; Zhang, J.; Hou, C. Mapping Tobacco Fields Using UAV RGB Images. Sensors 2019, 19, 1791. [Google Scholar] [CrossRef] [Green Version]
- Zhang, L.; Liu, Z.; Ren, T.; Liu, D.; Ma, Z.; Tong, L.; Zhang, C.; Zhou, T.; Zhang, X.; Li, S. Identification of Seed Maize Fields With High Spatial Resolution and Multiple Spectral Remote Sensing Using Random Forest Classifier. Remote Sens. 2020, 12, 362. [Google Scholar] [CrossRef] [Green Version]
- Hao, P.; Di, L.; Zhang, C.; Guo, L. Transfer Learning for Crop classification with Cropland Data Layer data (CDL) as training samples. Sci. Total Environ. 2020, 733, 138869. [Google Scholar] [CrossRef] [PubMed]
- Izquierdo-Verdiguier, E.; Zurita-Milla, R. An evaluation of Guided Regularized Random Forest for classification and regression tasks in remote sensing. Int. J. Appl. Earth Obs. Geoinf. 2020, 88, 102051. [Google Scholar] [CrossRef]
- Teluguntla, P.; Thenkabail, P.S.; Oliphant, A.; Xiong, J.; Gumma, M.K.; Congalton, R.G.; Yadav, K.; Huete, A. A 30-m landsat-derived cropland extent product of Australia and China using random forest machine learning algorithm on Google Earth Engine cloud computing platform. ISPRS J. Photogramm. Remote Sens. 2018, 144, 325–340. [Google Scholar] [CrossRef]
- Xiong, J.; Thenkabail, P.S.; Gumma, M.K.; Teluguntla, P.; Poehnelt, J.; Congalton, R.G.; Yadav, K.; Thau, D. Automated cropland mapping of continental Africa using Google Earth Engine cloud computing. ISPRS J. Photogramm. Remote Sens. 2017, 126, 225–244. [Google Scholar] [CrossRef] [Green Version]
- Liu, L.; Xiao, X.; Qin, Y.; Wang, J.; Xu, X.; Hu, Y.; Qiao, Z. Mapping cropping intensity in China using time series Landsat and Sentinel-2 images and Google Earth Engine. Remote Sens. Environ. 2020, 239, 111624. [Google Scholar] [CrossRef]
- Ye, Q.; Yang, X.; Dai, S.; Chen, G.; Li, Y.; Zhang, C. Effects of climate change on suitable rice cropping areas, cropping systems and crop water requirements in southern China. Agric. Water Manag. 2015, 159, 35–44. [Google Scholar] [CrossRef]
- Liu, Z.; Yang, X.; Chen, F.; Wang, E. The effects of past climate change on the northern limits of maize planting in Northeast China. Clim. Chang. 2013, 117, 891–902. [Google Scholar] [CrossRef]
- Fischer, G.; Shah, M.; Tubiello, F.N.; van Velhuizen, H. Socio-economic and climate change impacts on agriculture: An integrated assessment, 1990–2080. Philos. Trans. R. Soc. Biol. Sci. 2005, 360, 2067–2083. [Google Scholar] [CrossRef]
- Fanfani, R.; Brasili, C. Regional differences in Chinese agriculture: Results from the 1997 First National Agricultural Census. J. Peasant. Stud. 2003, 30, 18–44. [Google Scholar] [CrossRef]
- IPCC. Climate Change 2021: The Physical Science Basis. Contribution of Working Group I to the Sixth Assessment Report of the Intergovernmental Panel on Climate Change; Cambridge University Press: Cambridge, UK, 2021. [Google Scholar]
- Meng, Q.; Hou, P.; Lobell, D.B.; Wang, H.; Cui, Z.; Zhang, F.; Chen, X. The benefits of recent warming for maize production in high latitude China. Clim. Chang. 2014, 122, 341–349. [Google Scholar] [CrossRef]
- Liu, Y.; Xie, R.; Hou, P.; Li, S.; Zhang, H.; Ming, B.; Long, H.; Liang, S. Phenological responses of maize to changes in environment when grown at different latitudes in China. Field Crop. Res. 2013, 144, 192–199. [Google Scholar] [CrossRef]
- Ge, G.; Chaoying, H. Climate Change and Its Impact on Water Resources in North China. Adv. Atmos. Sci. 2001, 18, 718–732. [Google Scholar] [CrossRef]
- Foga, S.; Scaramuzza, P.L.; Guo, S.; Zhu, Z.; Dilley, R.D.; Beckmann, T.; Schmidt, G.L.; Dwyer, J.L.; Hughes, M.J.; Laue, B. Cloud detection algorithm comparison and validation for operational Landsat data products. Remote Sens. Environ. 2017, 194, 379–390. [Google Scholar] [CrossRef] [Green Version]
- Smith, P. Bilinear interpolation of digital images. Ultramicroscopy 1981, 6, 201–204. [Google Scholar] [CrossRef]
- Scaramuzza, P.; Micijevic, E.; Chander, G. SLC-Off Gap-Filled Products Gap-Fill Algorithm Methodology Phase 2 Gap-Fill Algorithm; US Geological Survey Earth Resources Observation and Science (EROS) Center: Sioux Falls, SD, USA, 2004. [Google Scholar]
- Chen, J.; Zhu, X.; Vogelmann, J.E.; Gao, F.; Jin, S. A simple and effective method for filling gaps in Landsat ETM+ SLC-off images. Remote Sens. Environ. 2011, 115, 1053–1064. [Google Scholar] [CrossRef]
- Breiman, L.; Friedman, J.H.; Olshen, R.A.; Stone, C.J. Classification and Regression Trees; Wadsworth and Brooks: Belmont, CA, USA, 1984. [Google Scholar]
- Ho, T.K. Random decision forests. In Proceedings of the 3rd International Conference on Document Analysis and Recognition, Montreal, QC, Canada, 14–16 August 1995; Volume 1, pp. 278–282. [Google Scholar] [CrossRef]
- Breiman, L. Random Forests. Mach. Learn. 2001, 45, 5–32. [Google Scholar] [CrossRef] [Green Version]
- Rosenblatt, M. Remarks on Some Nonparametric Estimates of a Density Function. Ann. Math. Stat. 1956, 27, 832–837. [Google Scholar] [CrossRef]
- Parzen, E. On Estimation of a Probability Density Function and Mode. Ann. Math. Stat. 1962, 33, 1065–1076. [Google Scholar] [CrossRef]
- Bianchi, M.; Boyle, M.; Hollingsworth, D. A comparison of methods for trend estimation. Appl. Econ. Lett. 1999, 6, 103–109. [Google Scholar] [CrossRef]
- Lefever, D.W. Measuring Geographic Concentration by Means of the Standard Deviational Ellipse. Am. J. Sociol. 1926, 32, 88–94. [Google Scholar] [CrossRef]
- Yuill, R.S. The Standard Deviational Ellipse; An Updated Tool for Spatial Description. Geogr. Ann. Ser. Hum. Geogr. 1971, 53, 28–39. [Google Scholar] [CrossRef]
- Wang, J.; Xu, C. Geodetector: Principle and prospective. Acta Geogr. Sin. 2017, 72, 116–134. [Google Scholar] [CrossRef]
- Li, Q.; Zhou, Y.; Wang, L.; Zuo, Q.; Yi, S.; Liu, J.; Su, X.; Xu, T.; Jiang, Y. The Link between Landscape Characteristics and Soil Losses Rates over a Range of Spatiotemporal Scales: Hubei Province, China. Int. J. Environ. Res. Public Health 2021, 18, 11044. [Google Scholar] [CrossRef] [PubMed]
- Su, Y.; Li, T.; Cheng, S.; Wang, X. Spatial distribution exploration and driving factor identification for soil salinisation based on geodetector models in coastal area. Ecol. Eng. 2020, 156, 105961. [Google Scholar] [CrossRef]
- Yang, X.; Liu, Z.; Chen, F. The Possible Effect of Climate Warming on Northern Limits of Cropping System and Crop Yield in China. Agric. Sci. China 2011, 10, 585–594. [Google Scholar] [CrossRef]
- Lesk, C.; Coffel, E.; Winter, J.; Ray, D.; Zscheischler, J.; Seneviratne, S.I.; Horton, R. Stronger temperature–moisture couplings exacerbate the impact of climate warming on global crop yields. Nat. Food 2021, 2, 683–691. [Google Scholar] [CrossRef]
- Rosenzweig, C.; Elliott, J.; Deryng, D.; Ruane, A.C.; Müller, C.; Arneth, A.; Boote, K.J.; Folberth, C.; Glotter, M.; Khabarov, N.; et al. Assessing agricultural risks of climate change in the 21st century in a global gridded crop model intercomparison. Proc. Natl. Acad. Sci. USA 2014, 111, 3268–3273. [Google Scholar] [CrossRef] [Green Version]
- Pan, T.; Du, G.; Dong, J.; Kuang, W.; Maeyer, P.D.; Kurban, A. Divergent changes in cropping patterns and their effects on grain production under different agro-ecosystems over high latitudes in China. Sci. Total Environ. 2019, 659, 314–325. [Google Scholar] [CrossRef]
- Baloch, N.; Liu, W.; Hou, P.; Ming, B.; Xie, R.; Wang, K.; Liu, Y.; Li, S. Effect of latitude on maize kernel weight and grain yield across China. Agron. J. 2021, 113, 1172–1182. [Google Scholar] [CrossRef]
- Ouyang, W.; Gao, X.; Hao, Z.; Liu, H.; Shi, Y.; Hao, F. Farmland shift due to climate warming and impacts on temporal-spatial distributions of water resources in a middle-high latitude agricultural watershed. J. Hydrol. 2017, 547, 156–167. [Google Scholar] [CrossRef]
- Qi, P.; Xia, Z.; Zhang, G.; Zhang, W.; Chang, Z. Effects of climate change on agricultural water resource carrying capacity in a high-latitude basin. J. Hydrol. 2021, 597, 126328. [Google Scholar] [CrossRef]
- Wang, N.; Wang, E.; Wang, J.; Zhang, J.; Zheng, B.; Huang, Y.; Tan, M. Modelling maize phenology, biomass growth and yield under contrasting temperature conditions. Agric. For. Meteorol. 2018, 250–251, 319–329. [Google Scholar] [CrossRef]
- Kim, S.; Gitz, D.C.; Sicher, R.C.; Baker, J.T. Temperature dependence of growth, development, and photosynthesis in maize under elevated CO2. Environ. Exp. Bot. 2007, 61, 224–236. [Google Scholar] [CrossRef]
- Yang, J.; Qiu, H.; Huang, J.; Rozelle, S. Fighting global food price rises in the developing world: The response of China and its effect on domestic and world markets. Agric. Econ. 2008, 39, 453–464. [Google Scholar] [CrossRef]
- Mose, L.O.; Burger, K.; Kuvyenhoven, A. Aggregate supply response to price incentives: The case of smallholder maize production in Kenya. Afr. Crop. Sci. Conf. Proc. 2007, 8, 1271–1275. [Google Scholar]
- Lardy, N.R. Prospects and Some Policy Problems of Agricultural Development in China. Am. J. Agric. Econ. 1986, 68, 451–457. [Google Scholar] [CrossRef]
- Zhou, Y.; Li, X.; Liu, Y. Rural land system reforms in China: History, issues, measures and prospects. Land Use Policy 2020, 91, 104330. [Google Scholar] [CrossRef]
Figure 1.
Location of the study area.

Figure 2.
Technical flowchart of the study.

Figure 3.
The expectations of the kernel density estimation function from 2013 to 2020 (a) and the kernel density estimation function from 2013 to 2020 (b).
Figure 3.
The expectations of the kernel density estimation function from 2013 to 2020 (a) and the kernel density estimation function from 2013 to 2020 (b).

Figure 4.
Linear regression trend of MPP at the county level (a) and the proportion of counties with increasing or decreasing trend across different latitudes and landform regions (b).
Figure 4.
Linear regression trend of MPP at the county level (a) and the proportion of counties with increasing or decreasing trend across different latitudes and landform regions (b).

Figure 5.
Standard deviation ellipse and ellipse center of MPP.

Figure 6.
Spatial autocorrelation analysis of MPP from 2013 to 2020 (a–h).

Figure 7.
Correlation coefficient between maize plantation proportion (MPP) and meteorological factors including precipitation ((a) PRE), atmospheric pressure ((b) PRS), relative humidity ((c) RHU), sunshine duration ((d) SSD), temperature ((e) TEM), wind speed ((f) WIN) and the proportion of counties with positive or negative correlation across different latitudes and landform regions.

Figure 8.
Dominant relevant meteorological factors (a) and the proportion of meteorological factors as each county’s most relevant factor across different latitudes and landform regions (b).
Figure 8.
Dominant relevant meteorological factors (a) and the proportion of meteorological factors as each county’s most relevant factor across different latitudes and landform regions (b).

Figure 9.
Annual (a), monthly (b), comprehensive (c) geographic factor detector analysis and comprehensive geographic interactive detector analysis (d).
Figure 9.
Annual (a), monthly (b), comprehensive (c) geographic factor detector analysis and comprehensive geographic interactive detector analysis (d).

Figure 10.
MPP expectation and maize price index from 2013 to 2020.

Publisher’s Note: MDPI stays neutral with regard to jurisdictional claims in published maps and institutional affiliations. |
© 2022 by the authors. Licensee MDPI, Basel, Switzerland. This article is an open access article distributed under the terms and conditions of the Creative Commons Attribution (CC BY) license (https://creativecommons.org/licenses/by/4.0/).
Share and Cite
MDPI and ACS Style
Guo, R.; Zhu, X.; Zhang, C.; Cheng, C. Analysis of Change in Maize Plantation Distribution and Its Driving Factors in Heilongjiang Province, China. Remote Sens. 2022, 14, 3590. https://doi.org/10.3390/rs14153590
AMA Style
Guo R, Zhu X, Zhang C, Cheng C. Analysis of Change in Maize Plantation Distribution and Its Driving Factors in Heilongjiang Province, China. Remote Sensing. 2022; 14(15):3590. https://doi.org/10.3390/rs14153590
Chicago/Turabian StyleGuo, Rui, Xiufang Zhu, Ce Zhang, and Changxiu Cheng. 2022. "Analysis of Change in Maize Plantation Distribution and Its Driving Factors in Heilongjiang Province, China" Remote Sensing 14, no. 15: 3590. https://doi.org/10.3390/rs14153590
Note that from the first issue of 2016, this journal uses article numbers instead of page numbers. See further details here.