Article

Assessment of Human-Induced Effects on Sea/Brackish Water Chlorophyll-a Concentration in Ha Long Bay of Vietnam with Google Earth Engine

1
Vietnam National Space Center (VNSC), Vietnam Academy of Science and Technology (VAST), 18 Hoang Quoc Viet, Hanoi 100000, Vietnam
2
Land and Water, Commonwealth Scientific and Industrial Research Organisation (CSIRO), Canberra 2601, Australia
3
Oceans and Atmosphere, Commonwealth Scientific and Industrial Research Organisation (CSIRO), Canberra 2601, Australia
4
Department of Space and Applications, University of Science and Technology of Hanoi (USTH), Vietnam Academy of Science & Technology (VAST), 18 Hoang Quoc Viet, Cau Giay, Hanoi 100000, Vietnam
5
Department of Hydrology and Hydrodynamics, Institute of Geophysics, Polish Academy of Sciences, 01-452 Warsaw, Poland
*
Author to whom correspondence should be addressed.
Remote Sens. 2022, 14(19), 4822; https://doi.org/10.3390/rs14194822
Submission received: 25 August 2022 / Revised: 19 September 2022 / Accepted: 22 September 2022 / Published: 27 September 2022
(This article belongs to the Special Issue Remote Sensing and GIS in Freshwater Environments)

Abstract

:
Chlorophyll-a is one of the most important water quality parameters that can be observed by satellite imagery. It plays a significant function in the aquatic environments of rapidly developing coastal cities such as Ha Long City, Vietnam. Urban population growth, coal mining, and tourist activities have affected the water quality of Ha Long Bay. This work uses Sentinel-2/Multispectral Instrument (MSI) imagery data to a calibrated ocean chlorophyll 2-band (OC-2) model to retrieve chlorophyll-a (chl-a) concentration in the bay from 2019 to 2021. The variability of chlorophyll-a during seasons over the study area was inter-compared. The chlorophyll-a concentration was mapped by analyzing the time series of water cover on the Google Earth Engine platform. The results show that the OC-2 model was calibrated well to the conditions of the study areas. The calibrated model accuracy increased nearly double compared with the uncalibrated OC-2 model. The seasonal assessment of chl-a concentration showed that the phytoplankton (algae) developed well in cold weather during fall and winter. Spatially, algae grew densely inside and in the surroundings of aquaculture, urban, and tourist zones. In contrast, coal mining activities did not result in algae development. We recommend using the Sentinel-2 data for seawater quality monitoring and assessment. Future work might focus on model calibration with a longer time simulation and more in situ measured data. Moreover, manual atmospheric correction of optical remote sensing is crucial for coastal environmental studies.

1. Introduction

Many stressors are putting pressure on aquatic ecosystems, including land-use change, climate change, human activities, and pollution [1]. More than half of the world’s population lives adjacently to water bodies and carries out activities that increase aquatic stressors, such as anthropogenic eutrophication and algal blooms [2]. Due to urban population growth, increasing industrial, agricultural and urbanization activities, and global climate change, many challenges confront aquatic ecosystems such as lakes, reservoirs, estuaries, and oceans [3]. The most significant challenges are nutrients and sediment concentrations [4]. According to numerous studies, deterioration in water quality is one of the most pressing threats to society in the future [2]. Physical, chemical, and biological parameters are often used to describe water quality and identify the source of any pollution or contamination that could cause water quality degradation [5].
Water quality can be routinely assessed using satellite-based remote sensing, which has shown to be an effective and efficient approach [5,6,7]. The application of remote sensing technology in water quality assessment has been widely applied and gained many important achievements over the past 40 years [8]. Some of these studies exploited the relationship between the optical properties of water and water quality parameters such as optical depth, total suspended solids, or chlorophyll content [9,10,11], where empirical (simple statistical relationships were developed), semi-analytical (physical relationships between the inherent optical properties and satellite data) models, and machine learning algorithms (e.g., artificial neural networks) were typically used [12,13]. All particulates (suspended solids and phytoplankton) in the water column scatter and absorb light, with the amount depending on their size and shape. Chlorophyll-a is the main pigment in phytoplankton, with absorption peaks at 438 nm and 676 nm, which can be used for its detection. Chlorophyll-a concentration is generally used to assess the primary productivity or eutrophication level of water bodies because it indicates the health of aquatic ecosystems [14]. Chlorophyll-a is a parameter routinely tested in aquatic ecosystems to determine phytoplankton or algal levels. Although algae are a natural part of aquatic ecosystems, excessive algal growth can cause aesthetic problems, such as surface scum, bad odors, and decreased dissolved oxygen levels [15]. Some algae also produce toxins that can cause public health concerns when found in high concentrations [16]. Accordingly, chlorophyll-a concentration retrieval at a synoptic scale is crucial for water quality assessment and management [17].
The Multispectral Instrument (MSI) installed on Sentinel-2 satellites is an auspicious tool for studying and assessing the aquatic environment [18]. It has been used to establish relationships between water quality parameters and spectral reflectance in water bodies. Some studies have also used it to assess inland water quality [19,20], although the main purpose of Sentinel-2 is global land monitoring [21]. Several algorithms have been developed from different multispectral satellites using either individual or ratios of spectral channels to calculate chlorophyll-a in water [7]. Typically, simple ratio-based algorithms, such as green/blue spectral channels [22], green/red [23], or near-infrared (NIR)/red spectrum channels [24], are applied to coastal water or inland lakes for water quality assessment. Where ratio-based algorithms are used, they usually require some ‘tuning’ or refinement for regional applications and derived quantitative results [25]. Most empirical algorithms for water quality parameter retrieval require regional calibration for the appropriate optical characteristics of the different sites. Thus, their performance across broader scales and waters with unique and varying optical properties can be limited. However, where chlorophyll-a algorithms are tuned for MSI against the Sentinel-3 Ocean and Land Color Instrument (OLCI) concurrently, significant improvements in the algorithm performance can be achieved, as the retrieval precision for OLCI is better than MSI [12].
This work investigates the variation of chlorophyll-a content in Ha Long Bay of Ha Long City from 1 January 2019 to 30 June 2021 using Sentinel-2 MSI images on the Google Earth Engine (GEE) platform. The study applied the algorithm based on the OC-2 band developed by Poddar et al. [26] for Bengal Bay and calibrated it for chl-a concentration estimation in Cua Luc Bay. Applying the OC-2 algorithm to Cua Luc Bay is justifiable, as both bays have similar geography and climatic conditions, i.e., at the latitude of 21 degrees in the tropical monsoon climate of Vietnam.

2. Materials and Methods
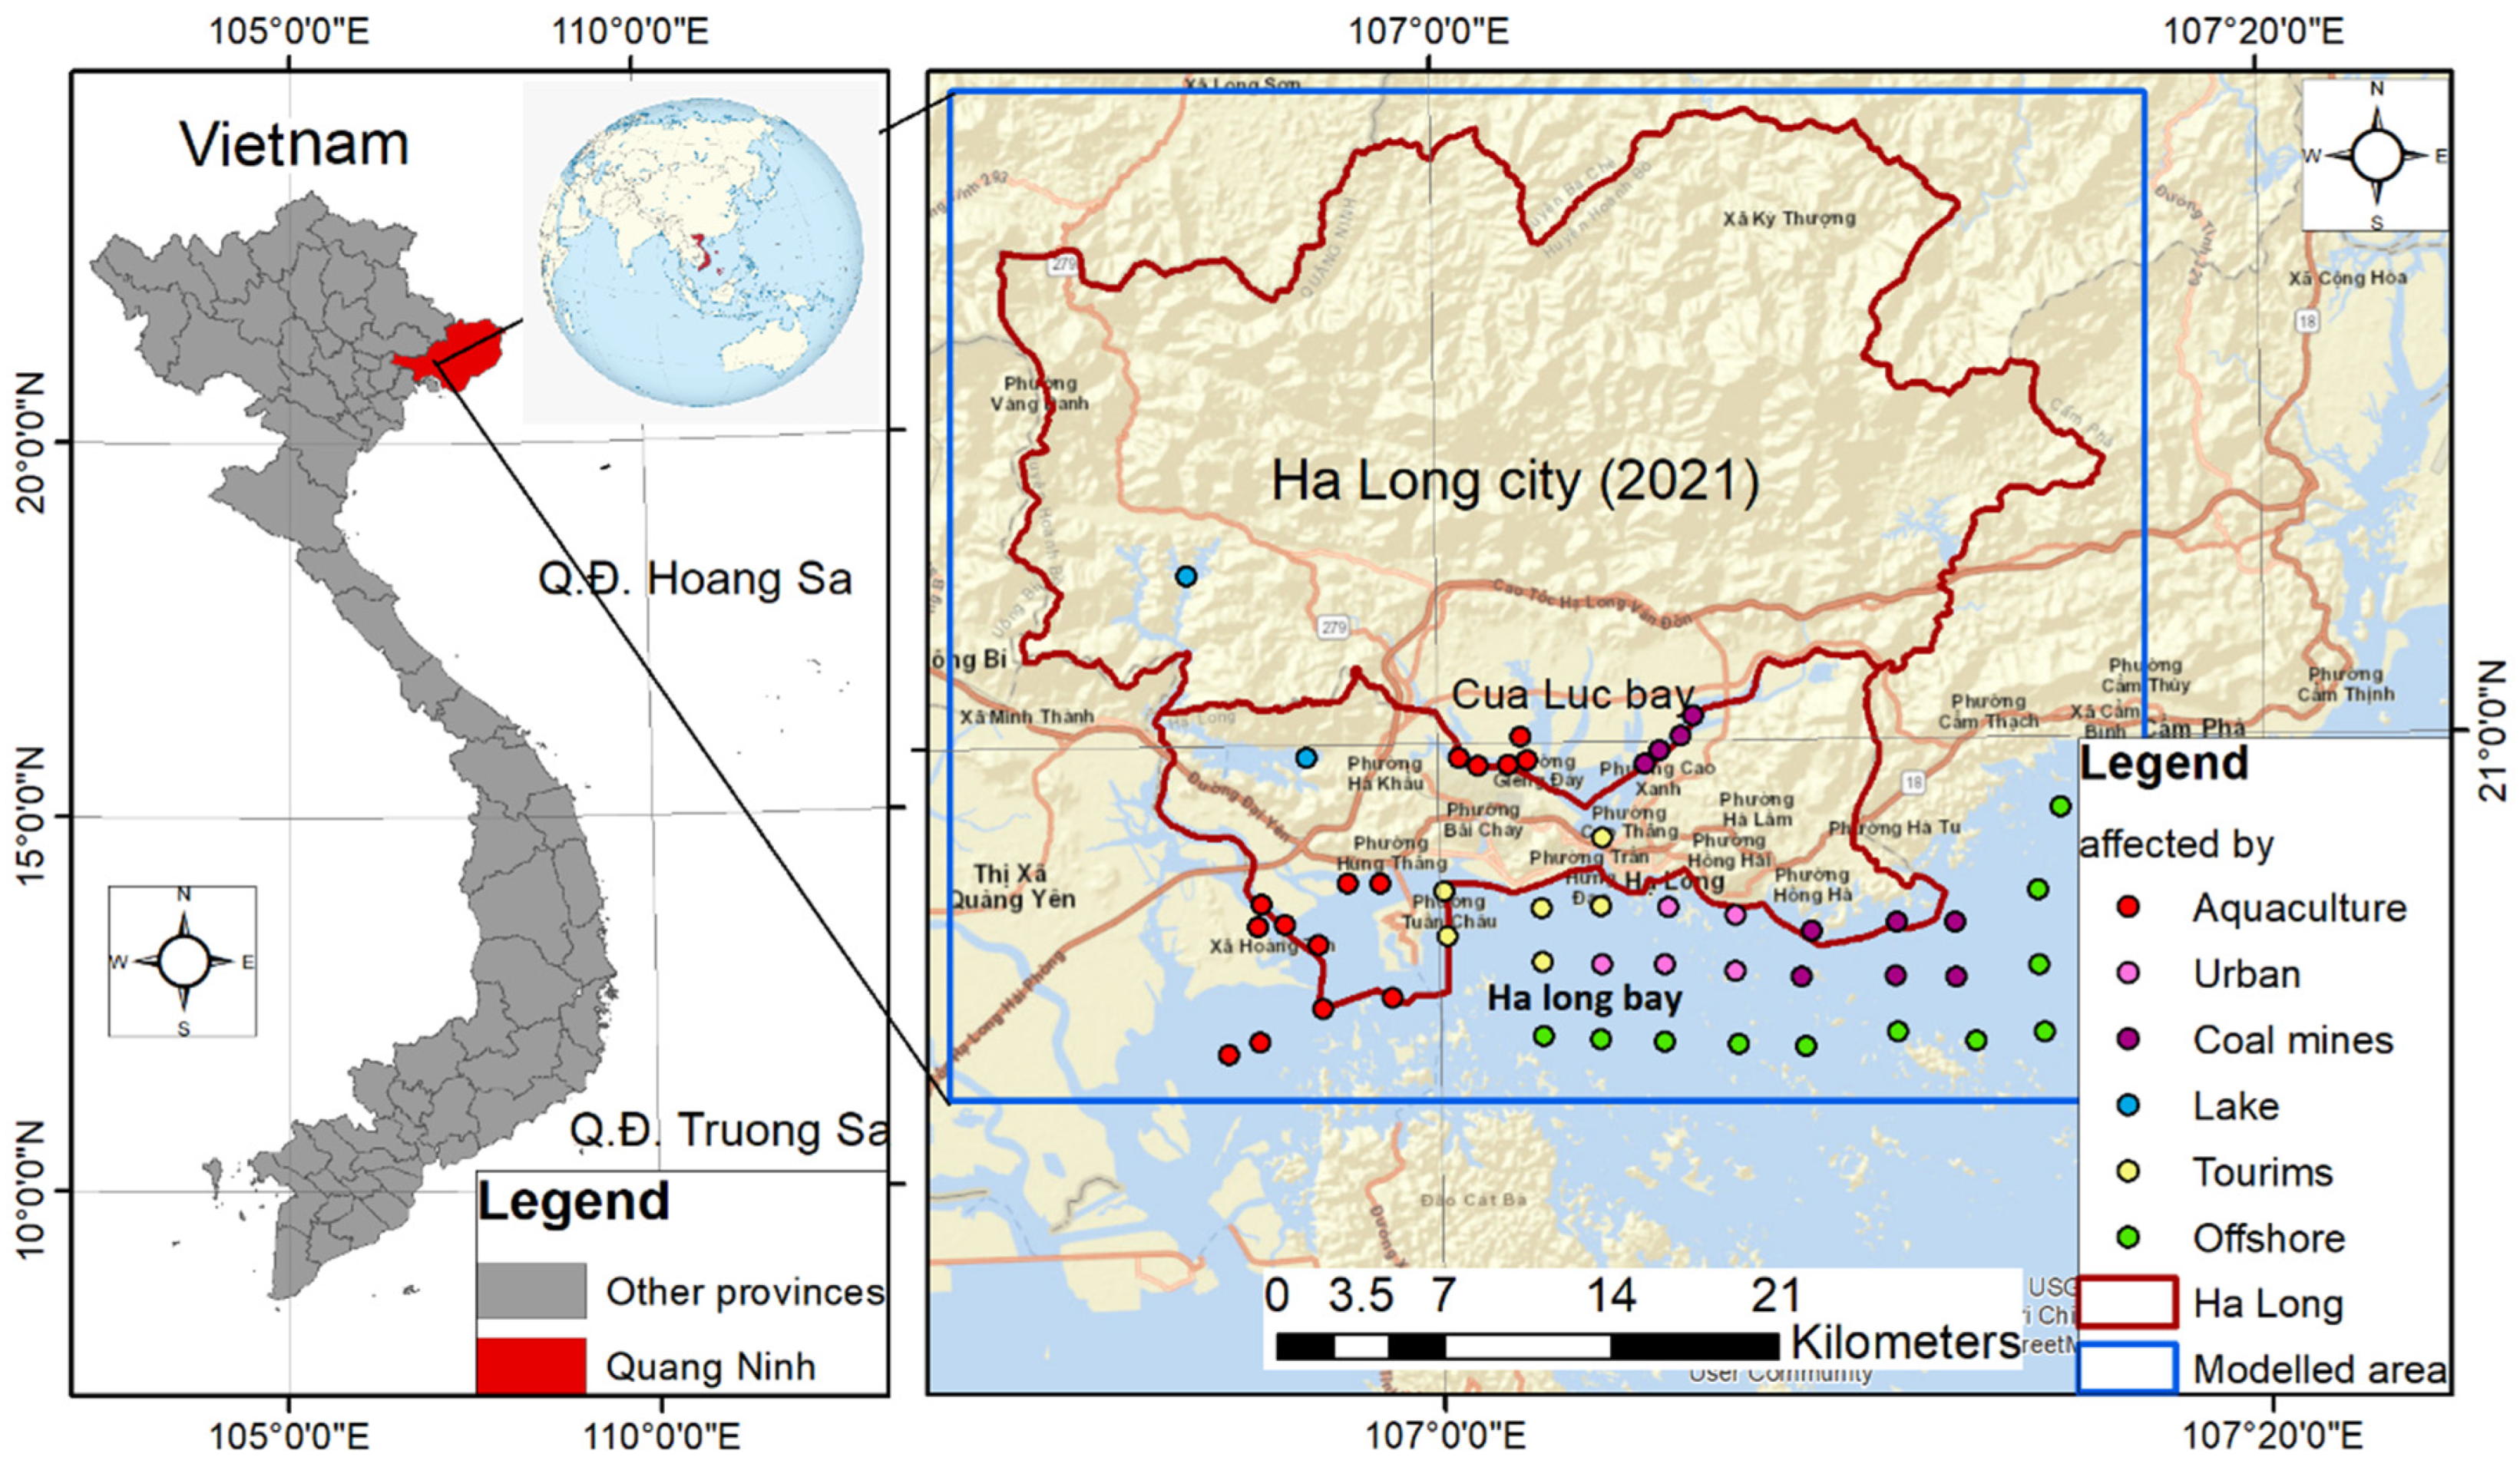
2.1. Study Area

Ha Long is the largest city in the Quang Ninh province, North Vietnam. Ha Long Bay and Cua Luc Bay are part of the city (Figure 1). Cua Luc Bay has the water’s deepest point of approximately 17 m and an area of 18 km2 and receives freshwater from many small streams and rivers before discharging the water to Ha Long Bay through the narrow Bai Chay Strait. Therefore, Cua Luc Bay also acts as a typical funnel-shaped estuary. As a result of the rapid development, the bay receives most of the wastewater and solid waste from the catchment’s mining activities, industrial zones, and residential areas around the bay [27]. Domestic wastewater contains many organic compounds and a small number of inorganic compounds in the form of residues, suspended compounds, dissolved minerals, etc. The increasing catchment activities have negatively impacted water quality in Cua Luc Bay, with increasing chlorophyll-a concentration and decreasing water clarity being reported. Besides receiving the discharge water from Cua Luc Bay, Ha Long Bay water is additionally affected by the domestic wastewater from rapidly developing urban, tourist activities, aquaculture (fish cages), and coal mines.
The selected study area lies between 20°51′37.7928″–21°14′58.1316″N and 106° 48′8.2044″–107°17′20.6988″E. In this study area, 49 assessment points were selected and divided into six groups, indicating the predominant anthropogenic influence on water quality. The points were selected based on their likelihood of anthropogenic impacts (based on their proximity to urban areas, tourist attractions, etc.) and current and tide information [28,29]. Each group potentially represents a different chlorophyll-a concentration and is depicted by distinguishable colored circles in Figure 1.

2.2. Data Collection

2.2.1. Remote Sensing Data

Sentinel-2, launched as part of the European Commission’s Copernicus program, includes two satellites: Sentinel-2A (23 June 2015) and Sentinel-2B (7 March 2017), both carrying multispectral instruments (MSI) measuring reflected radiance in 13 bands from the visible to short wave infrared. They were designed to give a high revisit frequency of 5 days at the equator for acquiring optical imagery at high spatial resolution from 10 m to 60 m over land and coastal water. The Sentinel-2 mission aims to ensure that Sentinel-2 makes significant contributions to the Copernicus themes such as climate change, land monitoring, emergency management, and security [30,31].
In this study, 81 Sentinel-2 Level-2A images were processed directly in the GEE data storage [31]. The GEE Sentinel-2 Level-2A images are provided (available from 28 March 2017) and maintained by the European Space Agency (ESA). The images were filtered based on the percentage of cloud cover less than 50% and checked manually to ensure the cloud cover and their shadows did not affect the study areas. The surface reflectance Level 2A data was processed for the Bottom of the Atmosphere (BOA) by the provider using the Sentinel-2 Toolbox [32]. All the Sentinel-2 images contain 13 spectral bands representing spectral reflectance with their central wavelength and spatial resolution (in m) described in Table 1.

2.2.2. NOAA Chlorophyll-a Data

Chlorophyll-a data from the National Oceanic and Atmospheric Administration (NOAA) for Cua Luc Bay were collected for calibration. The data are near real-time, provided for a global scale, processed at level 3, and calibrated weekly using the Visible and Infrared Imager/Radiometer Suite/Suomi-NPP (VIIRS) by NOAA [33]. The data were downloaded in GeoTIFF format during the periods of the Sentinel-2 data for the whole study area.

2.3. Methodology

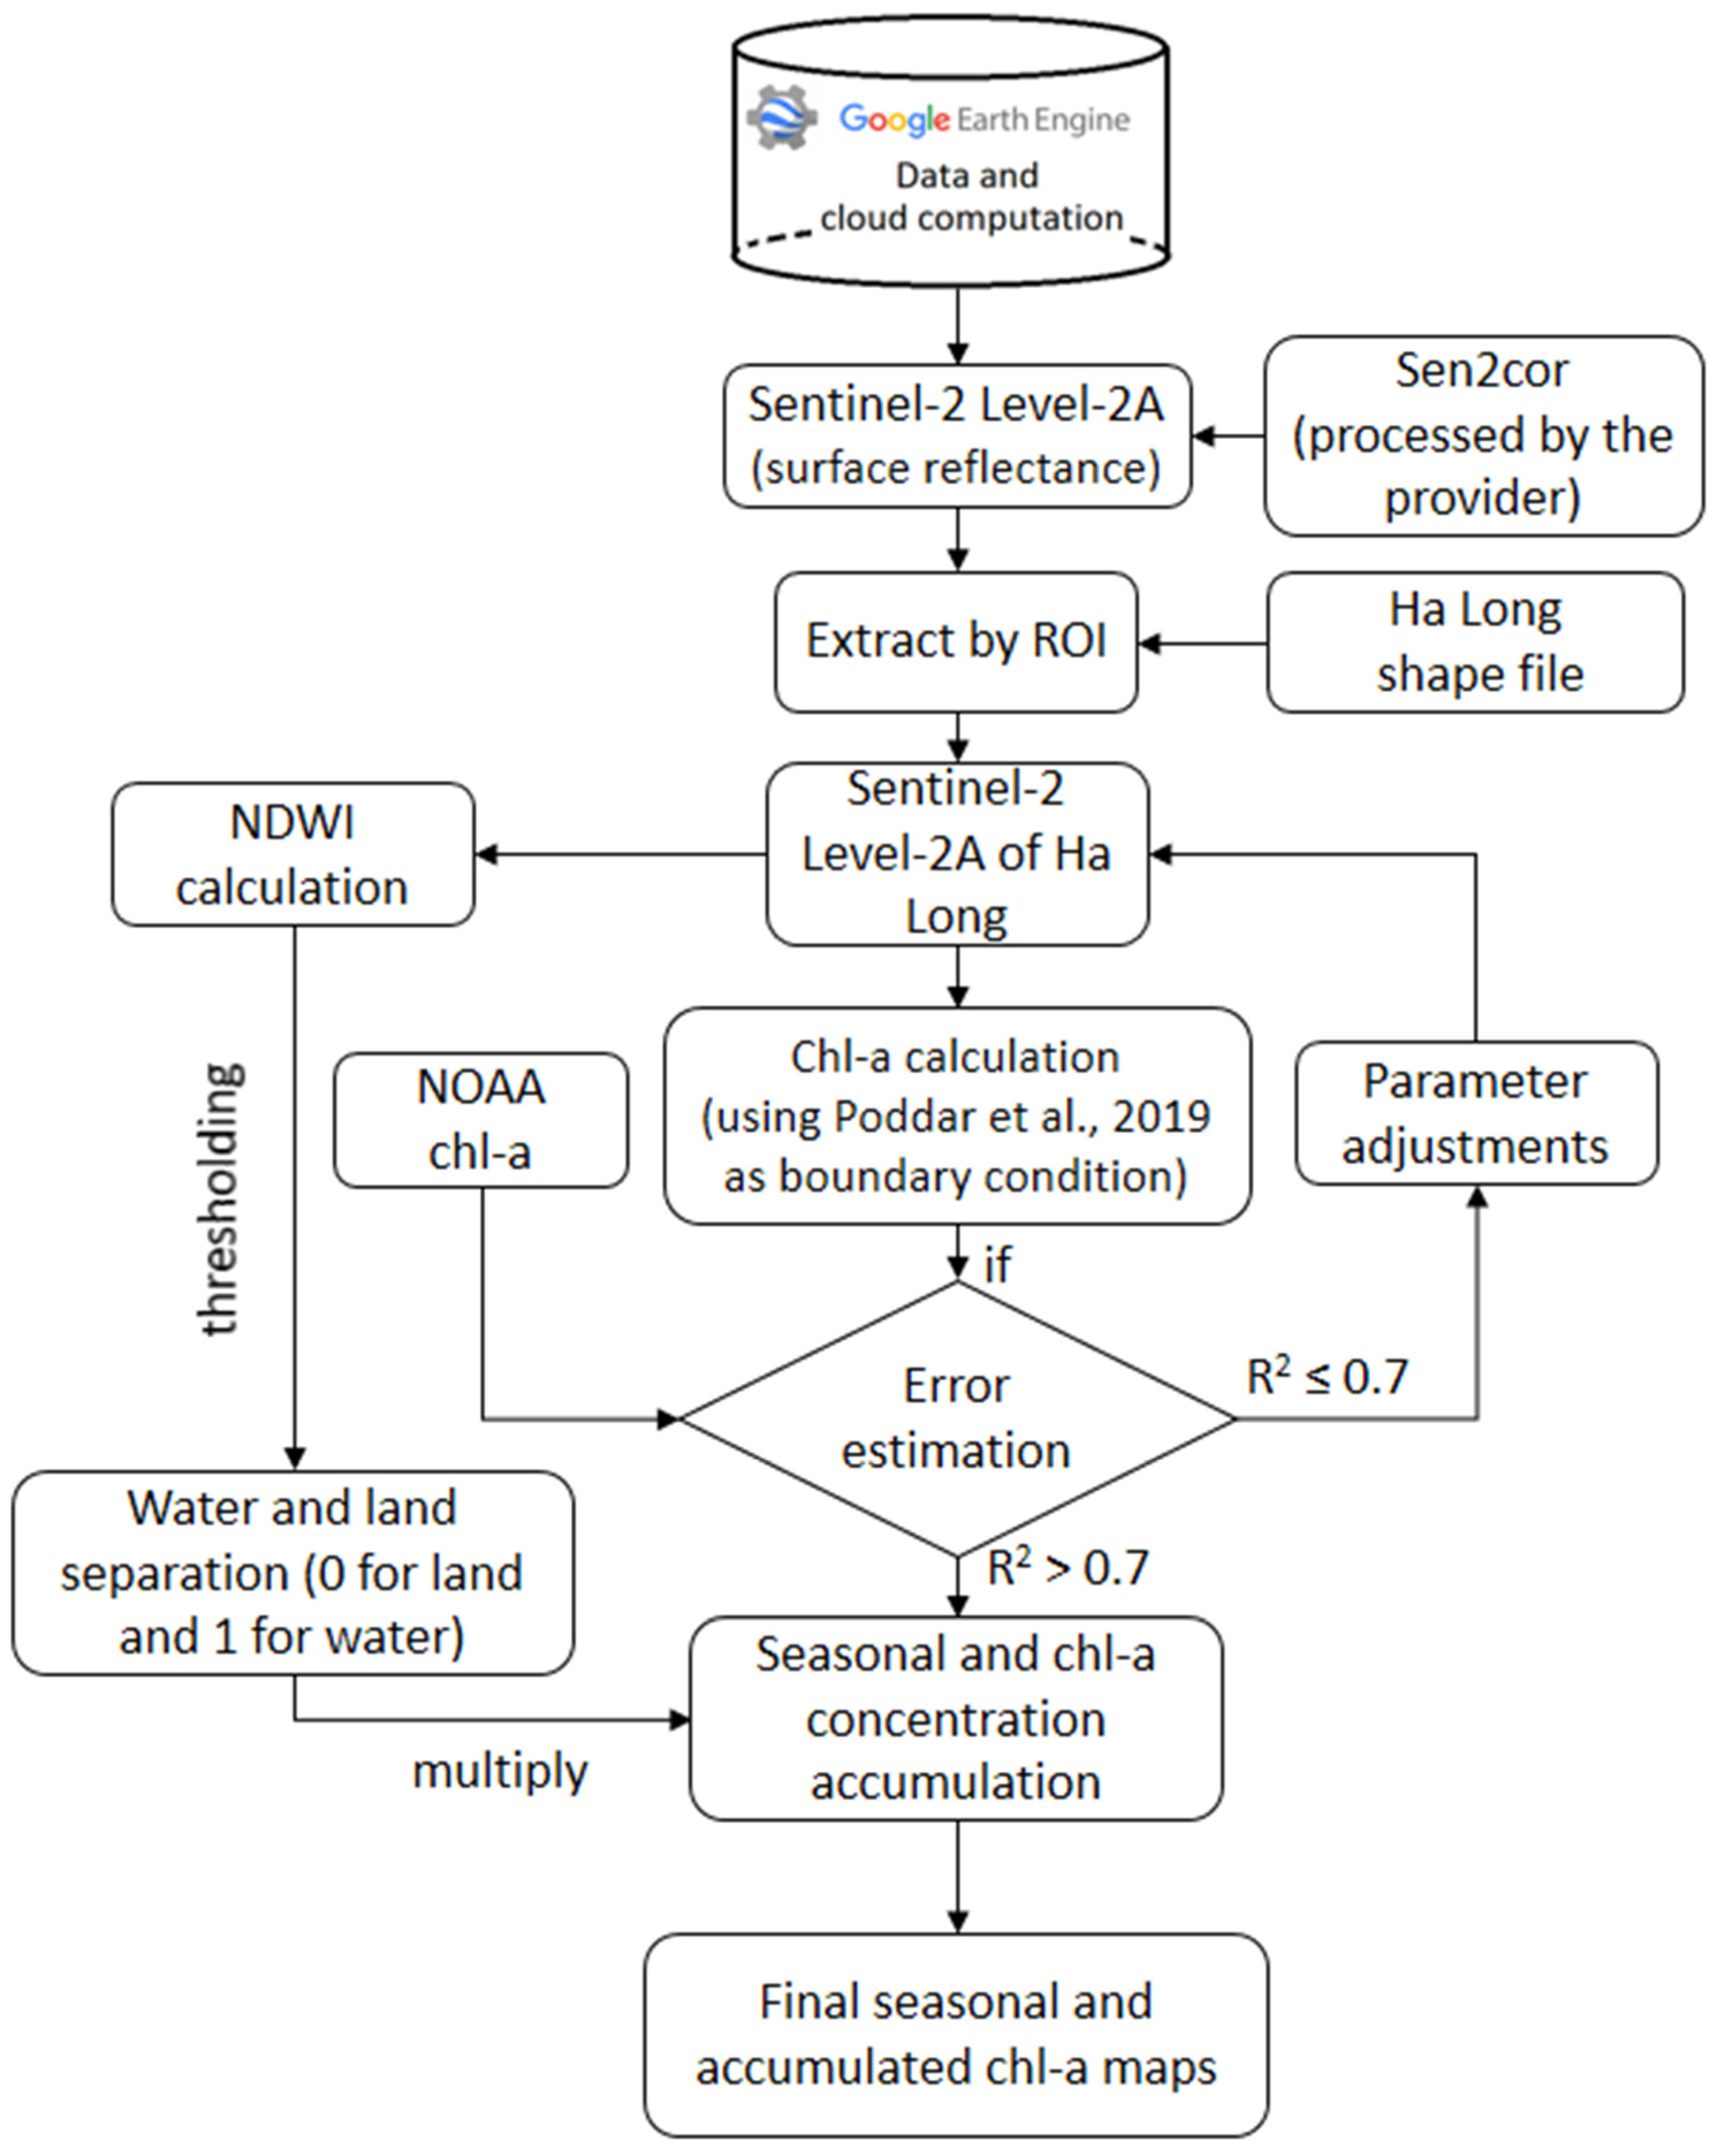
2.3.1. Workflow Chart

The workflow chart (Figure 2) describes the steps in the method. First, the Sentinel-2 surface reflectance processed at level-2A was retrieved from the GEE database and extracted for the region of interest (ROI). Then, the Normalized Difference Index (NDWI) was calculated for each image and used to separate water and land areas by applying a threshold. NDWI was calculated as the ratio between Green and Near-Infrared bands to highlight water bodies. In the case of Sentinel-2 images, NDWI was computed (using Equation (1)) after thresholds were applied for the NDWI.
NDWI = B 3 B 8 B 3 + B 8   ( where   B 3   is   the   green   band ;   B 8   is   the   NIR   band )
This layer was multiplied by the chl-a layers subsequently. For chl-a determination, chl-a layers were at first computed using the model developed by Poddar et al. [26] as the initial conditions. The accuracy was evaluated by comparing values of random points of NOAA with corresponding points in the chl-a layer. In this process, the coefficient of determination (R2) was computed, and the process was repeated with manual parameter adjustments until the R2 value became greater than 0.7 and the root mean square errors were calculated for the final chl-a layers. The final chl-a layers were accumulated and then masked for land by multiplying the original NDWI mask layer.

2.3.2. The Chlorophyll-a Model

Based on the findings provided by Poddar et al. [26], this study used the ocean chlorophyll 2-band (OC-2) algorithm, one of the Sea-Viewing Wide Field-of-View Sensor (SeaWiFS) chlorophyll algorithms [26,34], which were shown to be retrieved with “chl-a with the correlation of 0.795 and least bias of 0.35 mg/m3” when compared with the OC-3. The OC-2 was adopted for estimating the chl-a concentration in Ha Long Bay, Vietnam. The OC-2 is an empirical equation relating remote sensing reflectances (Rrs) in the 490 and 555 nm bands to chlorophyll-a concentration ( C ). The OC-2 algorithm was tuned to SeaBAM data, representing a range of marine water types with chl-a concentrations of 0.05 > chl-a > 3 mg/m3. Previous versions of OC-2 underestimated chl-a at higher concentrations. This would be greatly improved with acquired in situ chl-a concentrations and corresponding land surface reflectance (Rrs) from either surface radiometry or satellite images. The cubic polynomial OC-2 algorithm is shown in Equation (2) below:
C = 10 a 0 + a 1 × R + a 2 × R 2 + a 3 × R 2 + a 4  
where R = l o g (Rrs(490)/Rrs(555)); a 0 = 0.341, a1 = −3.0010, a 2 = 2.811, a 3 = −2.041 and a 4 = 0.0400 [26].
Rrs is obtained from the Land Surface Reflectance [35], computed by:
R r s λ = ρ π
where lamda ( λ ) is the central wavelength, ρ is the surface reflectance and π equals 3.142.
The Rrs obtained for the bands were then used in the OC-2 algorithm to retrieve chlorophyll-a in the Google Earth Engine platform and QGIS software for MSI sensors of Sentinel-2. The model was applied in the training and testing phase. In the training phase, the model parameters were adjusted until the error indicators (R2) reached an accepted value of 0.7, and then RMSE was computed. The calibration of the model was tuned manually based on an analysis of the trend and slopes of linear regression. This manual tuning procedure established appropriate values using the previous literature and experience of the modeler.

2.3.3. Coding in GEE, Result Presentation and Analyses

The JavaScript program language was used for coding in GEE computational platform to perform all these tasks in the study workflow. Other spatial visualization and chl-a map trends were made using the QGIS software. Assessment of chl-a concentration was assessed at selected locations of aquaculture, coal mines, estuaries, lakes, urban activities, and 5–8 km offshore (to represent water’s where effects of human activities are minimal), graphed and analyzed in Microsoft Excel software.

2.3.4. Error Estimation

We used the coefficient of determination (R2) computed by Equation (4) and the root-mean-square error (RMSE) calculated by Equation (5) to evaluate the goodness of fit between the model estimated and the NOAA chl-a. The greater R2 values indicated greater agreement of the model with the validated data. On the other hand, larger RMSE values indicated higher errors in the model. In addition, a scatter diagram was plotted to graphically show the correlation between model prediction and the NOAA data. Both R2 and RMSE were calculated in the training and testing phase.
R 2 = 1 i = 1 n y i y ^ i 2 i = 1 n y i y ¯ i 2
R M S E = i = 1 n y i y ^ i 2 n
where y ^ i represents the predicted value of y i , y ¯ i is the mean of observed data, and n is the number of predicted values.

3. Results

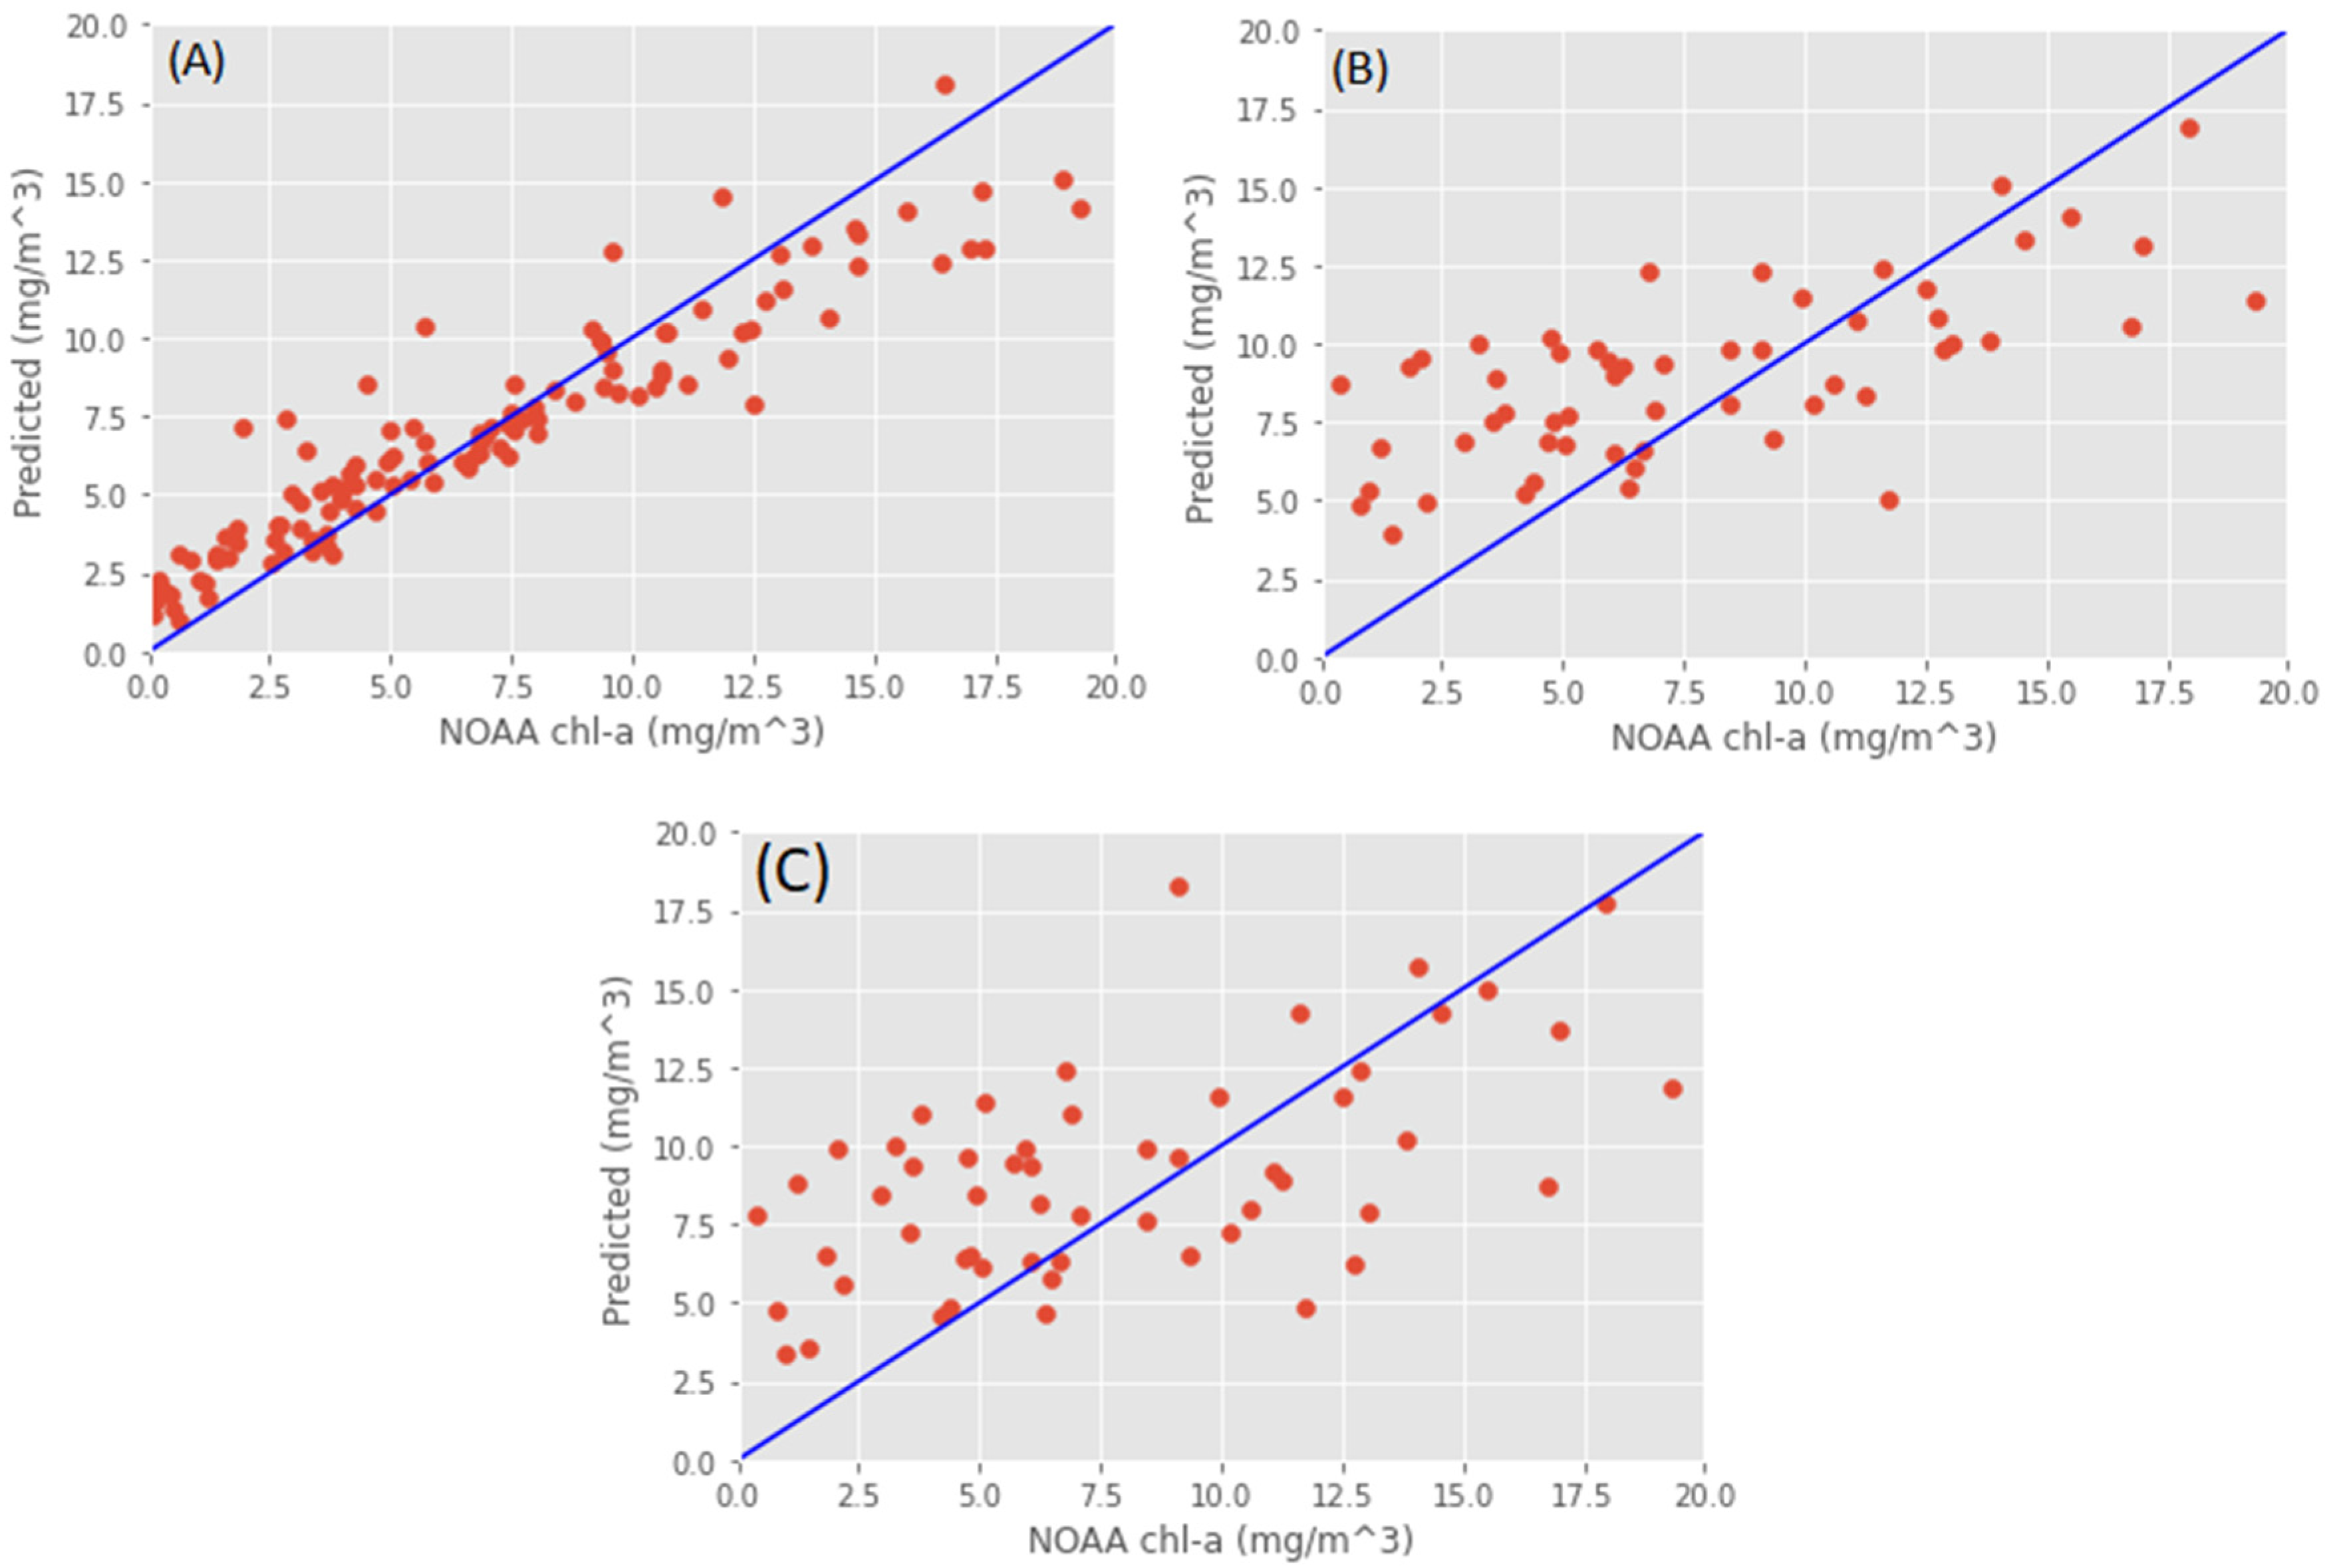
3.1. Model Calibration

It was clearly shown that the scatter plots between the calibrated OC-2 predicted versus the NOAA chl-a data were more convergent to the linear diagonal line (the blue line) in the training phase (Figure 3A) than the scattered plots in the testing phase (Figure 3B). In both phases, the calibrated OC-2 estimated lower chl-a values than the NOAA chl-a data in the value range from 12.5 mg/m3 to 20 mg/m3. The opposite trend was shown with the chl-a values under 5 mg/m3. In comparison, the initial uncalibrated OC-2 model predictions showed a large extent of divergent chl-a values compared to the NOAA data (Figure 3C). Therefore, the calibration by changing the coefficients in Equation (2), as shown in Table 2, made the OC-2 model adapt to the region of Ha Long City.
The coefficient of determination (R2) values of 0.85 and 0.81 were obtained for the model training and testing phases, respectively (Table 2), indicating that the model fit well with the NOAA reference data. On the other hand, the root mean square errors (RMSE) of 2.30 and 2.85 mg/m3 of each phase indicated that the mean of square differences between the model predicted and the NOAA data were small. In the testing phase, the R2 (0.81) and RMSE (2.80 mg/m3) values showed that the model accuracy was slightly degraded compared to the training phase, and the model seemed to overestimate the small NOAA chl-a values. This overestimation may be the result of the down-scaling of the NOAA resolution (~4 km) to Sentinel-2 (10 m). However, the calibrated model was considered robust enough.

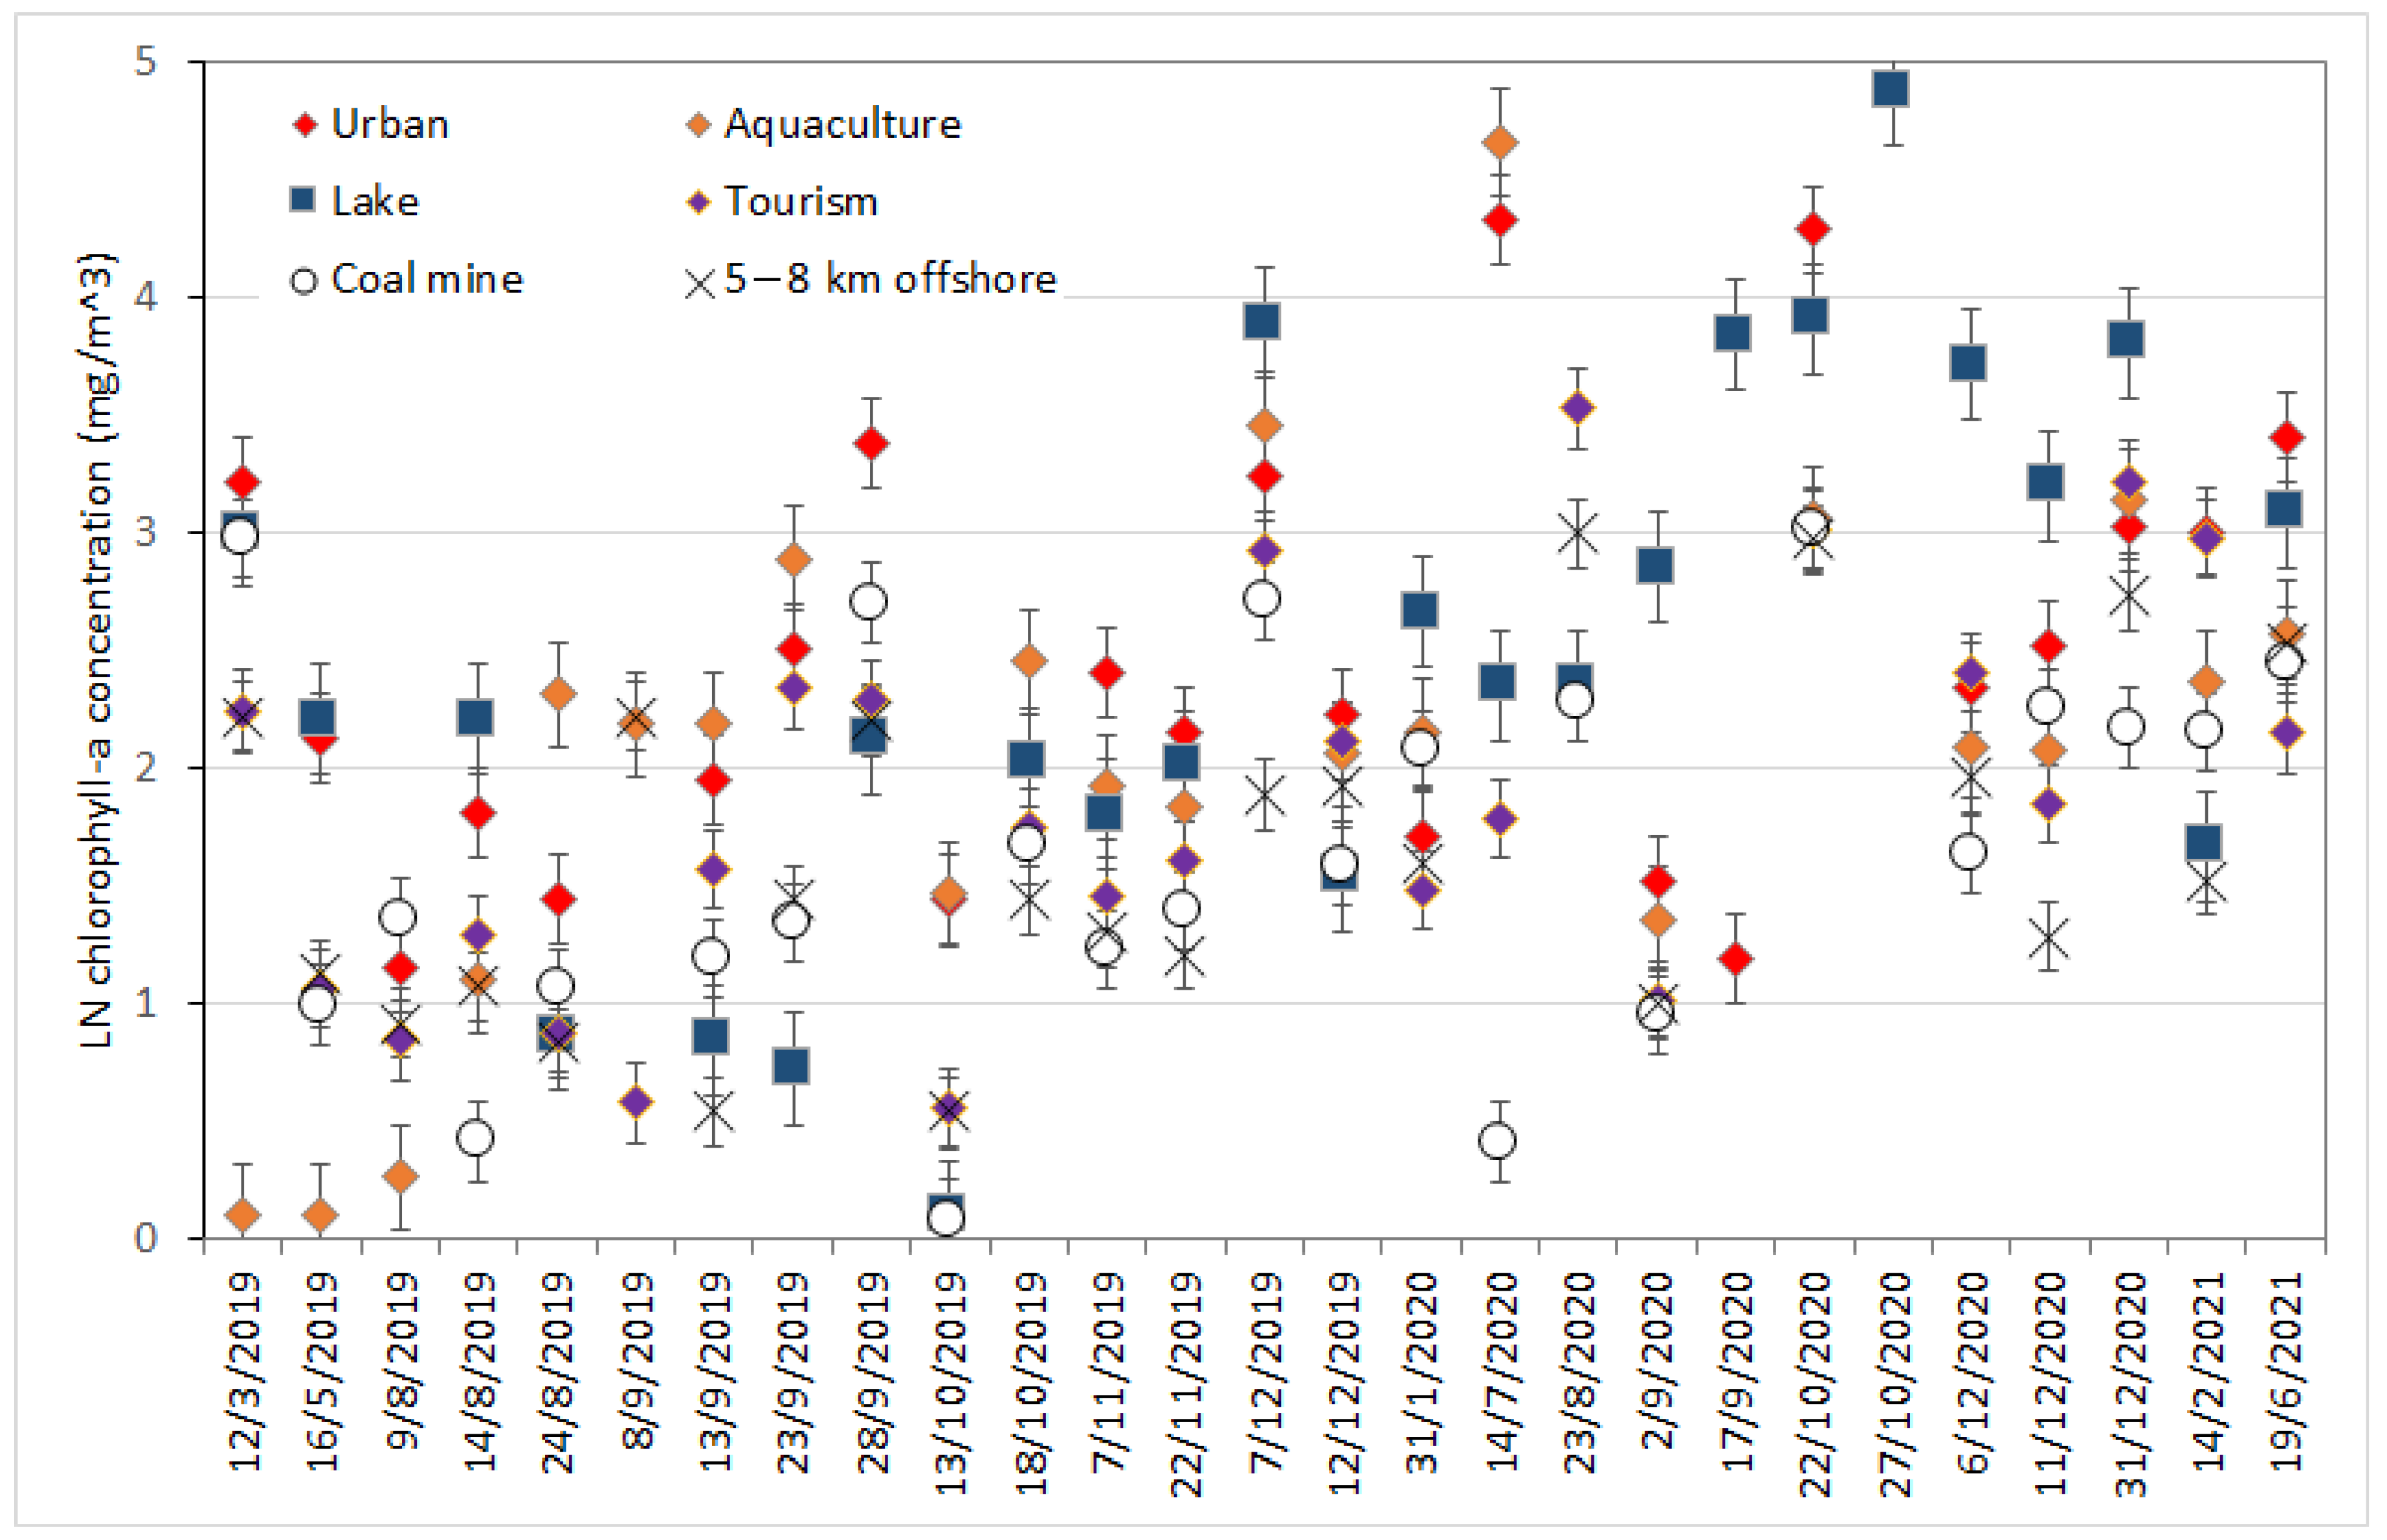
3.2. Change in Chlorophyll-a at Selected Locations

Figure 4 provides a breakdown of the changing chlorophyll-a concentration (at the natural logarithm scale) with its standard deviations at selected locations from 1 January 2019 to 30 June 2021, which are considered to be affected by six impact factors: aquaculture, coal mines, tourism, lakes, urban activities and 5–8 km offshore (considering the effects of the mentioned factors are minimal on the chl-a concentration [36]). The results showed that all selected locations had considerable fluctuations in chlorophyll-a concentration. However, the chlorophyll-a concentration fluctuations in lakes, aquaculture, and urban activities were dominant. Specifically, the chlorophyll-a concentration in lakes increased dramatically from 17 September 2020 and peaked on 27 October 2020 at more than 4.8 (mg/m3). In addition, the plots show some seasonality, with high rainfall typically falling between May and September, resulting in a decrease in the chl-a concentration.

3.3. Seasonal Chlorophyll-a Distribution

Seasonal variation of chlorophyll-a distribution in Ha Long Bay and its surroundings in 2019 was estimated from Sentinel-2 Level-2A using the OC-2 algorithm, as shown in Figure 5. The results showed that the water of Yen Lap Lake and the areas around Tuan Chau and Hoang Tan islands had high chlorophyll-a concentrations. The highest values were found in the fall (August to October) and winter (November to January) seasons (>100 mg/m3), followed by the summer (May to July) season and reached the minimum during the spring season. Similarly, high chlorophyll-a concentrations can be found near intensive tourism activities in the summer. In addition, the chlorophyll-a distribution patterns vary unevenly from 0 to 100 mg/m3 near the mouth of the rivers. Offshore has low chl-a concentration, dropping to 0–10 (mg/m3) for all seasons.
The variation of chlorophyll-a concentration over the seasons is closely related to the river discharge. Cua Luc Bay receives a large total river discharge from three tributaries in the summer, the largest being in July and August. Hence, rainfall is a very important factor related to the changes in the amount of chlorophyll-a in Cua Luc Bay. Three large rivers, i.e., Dien Vong River, Man River and Troi River, flow and carry minerals and sediment-rich waters into Cua Luc Bay during the summer season [37]. As a result, more nutrients are transported to the bay, increasing the phytoplankton growth and enhancing the chlorophyll-a concentration.
During the winter and fall seasons, sunlight, temperature, and nutrient levels determine phytoplankton growth in the water around Tuan Chau and Hoang Tan islands and lakes. NOAA reported that water that rises to the surface due to upwelling is typically colder and is rich in nutrients and high biological productivity. These nutrients “fertilize” the surface waters [38]. There is no clear link between upwelling and the abundance of phytoplankton in cold water. On the other hand, the gradual rise of chlorophyll-a concentration is related to industrial wastewater consisting of organic synthetic substances or heavy elements and discharging to the environment, hence increasing chlorophyll-a concentration [39].

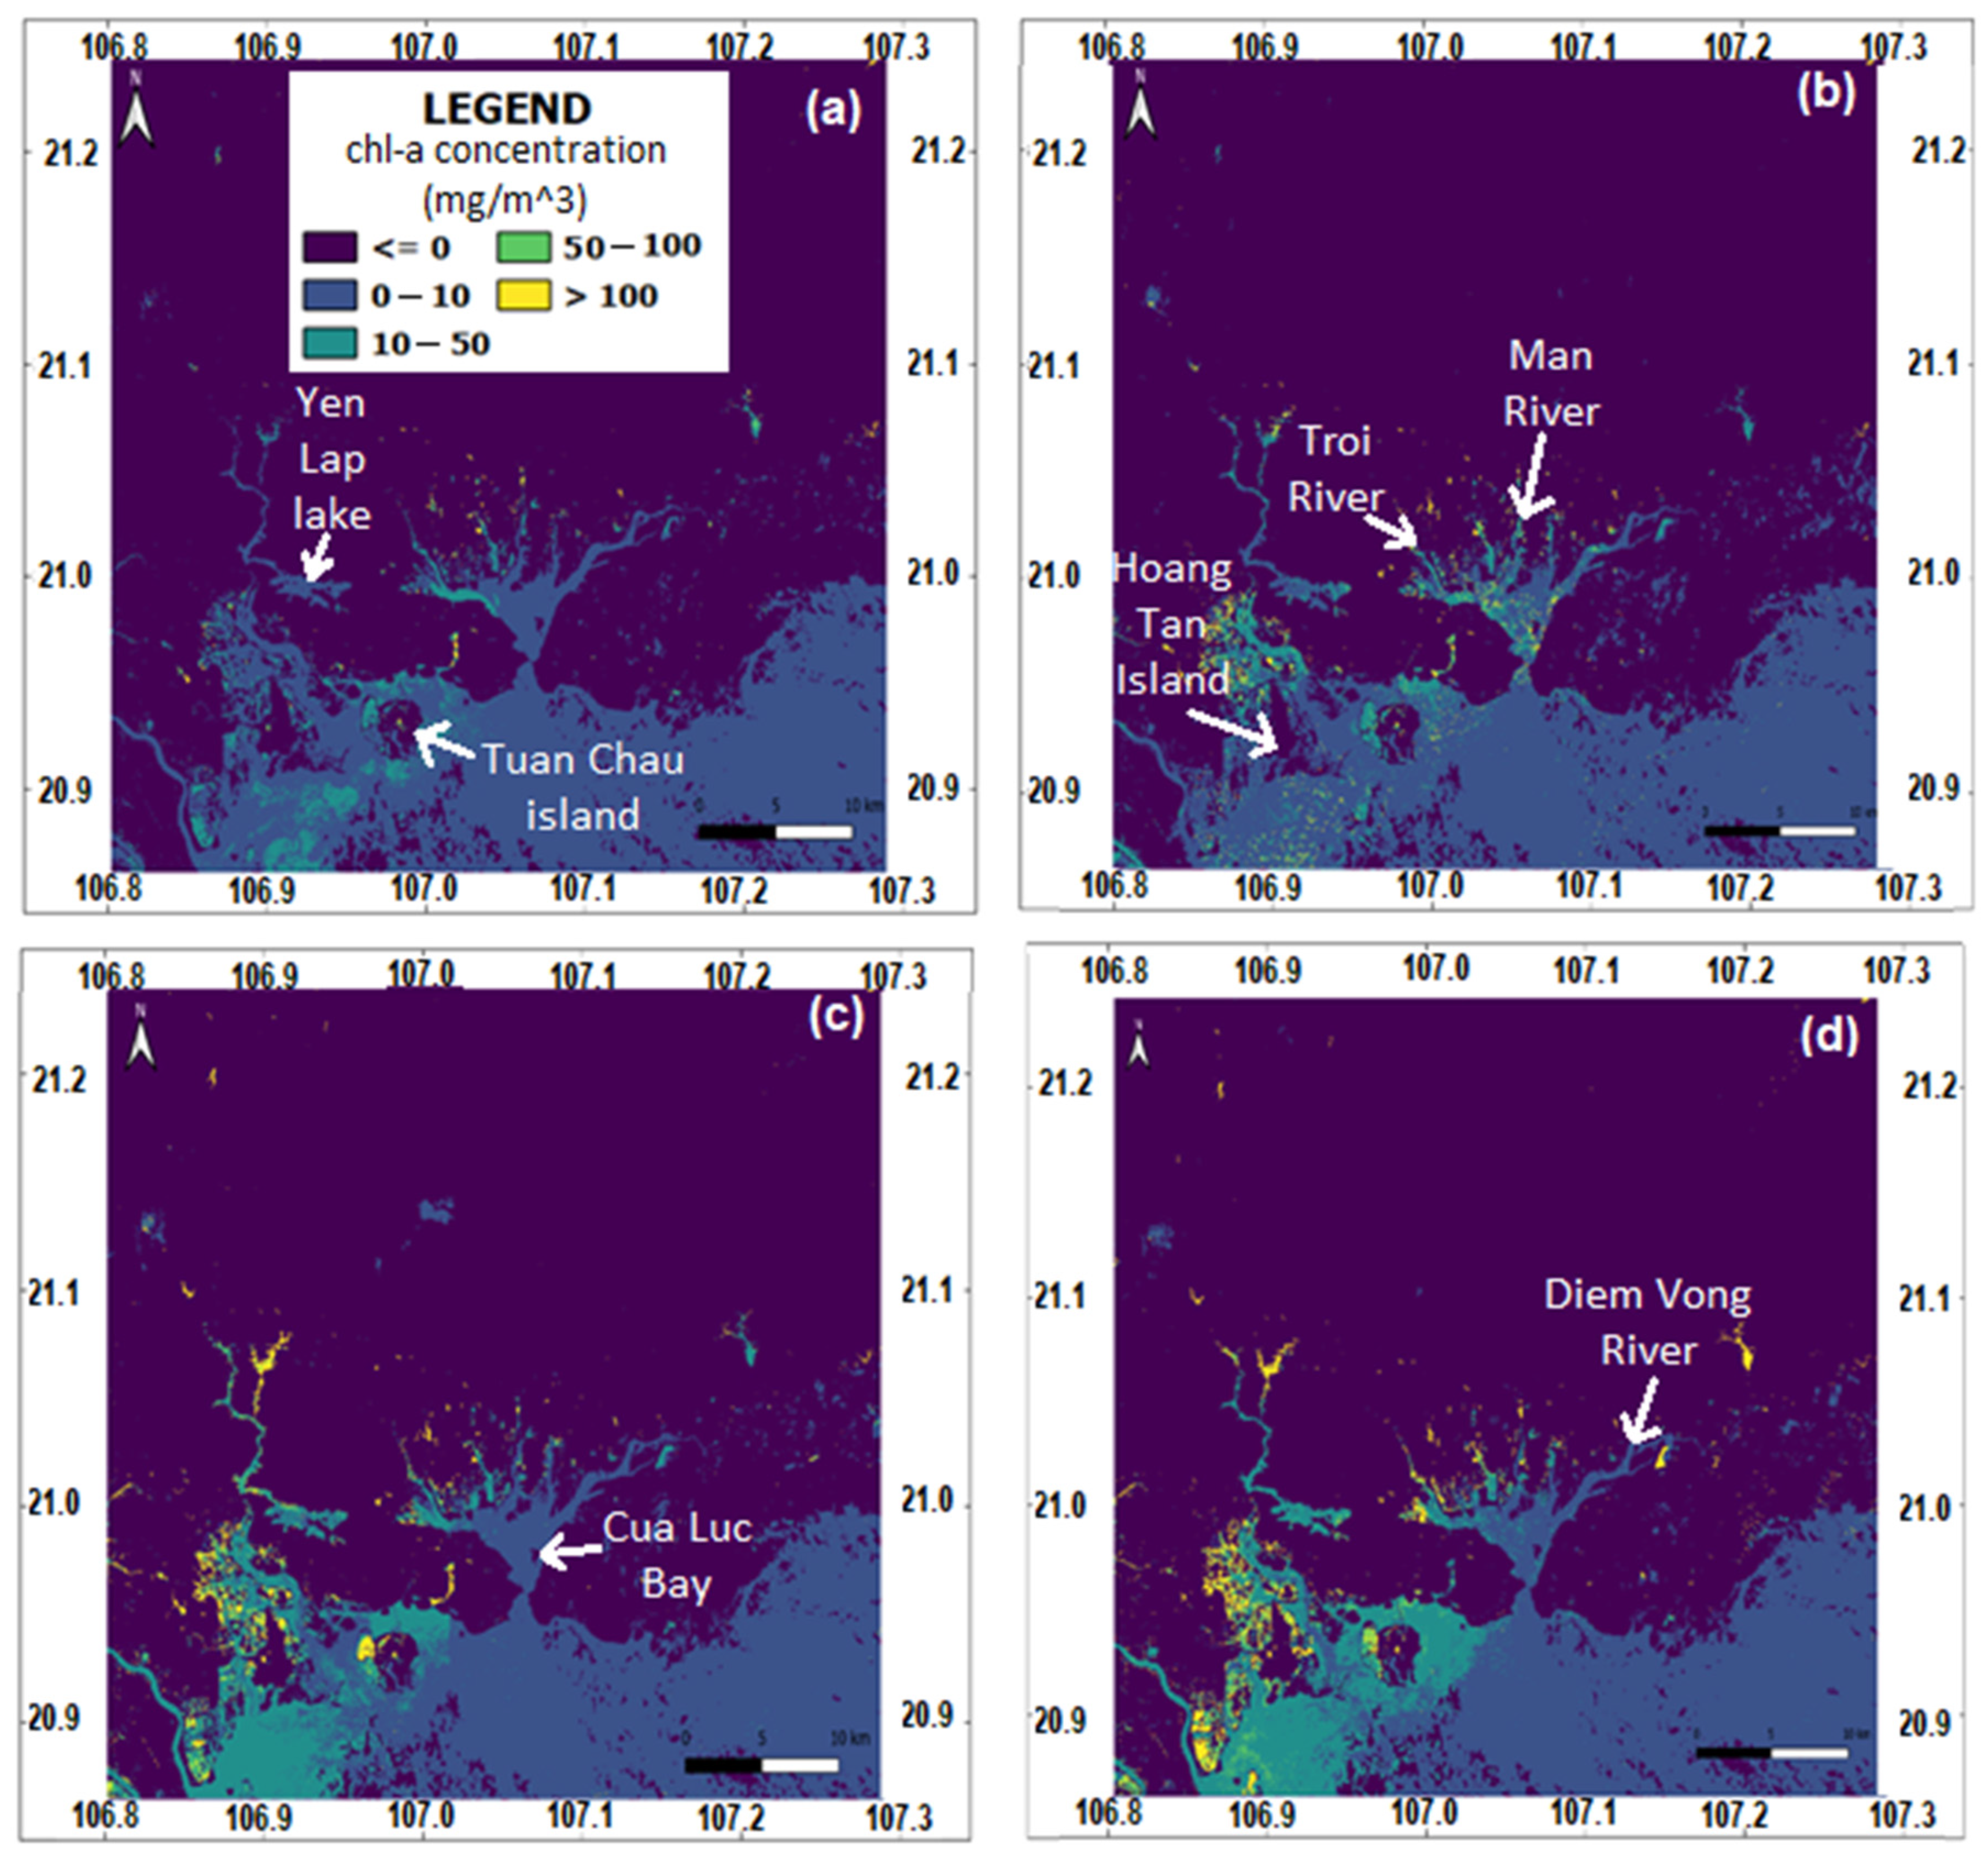
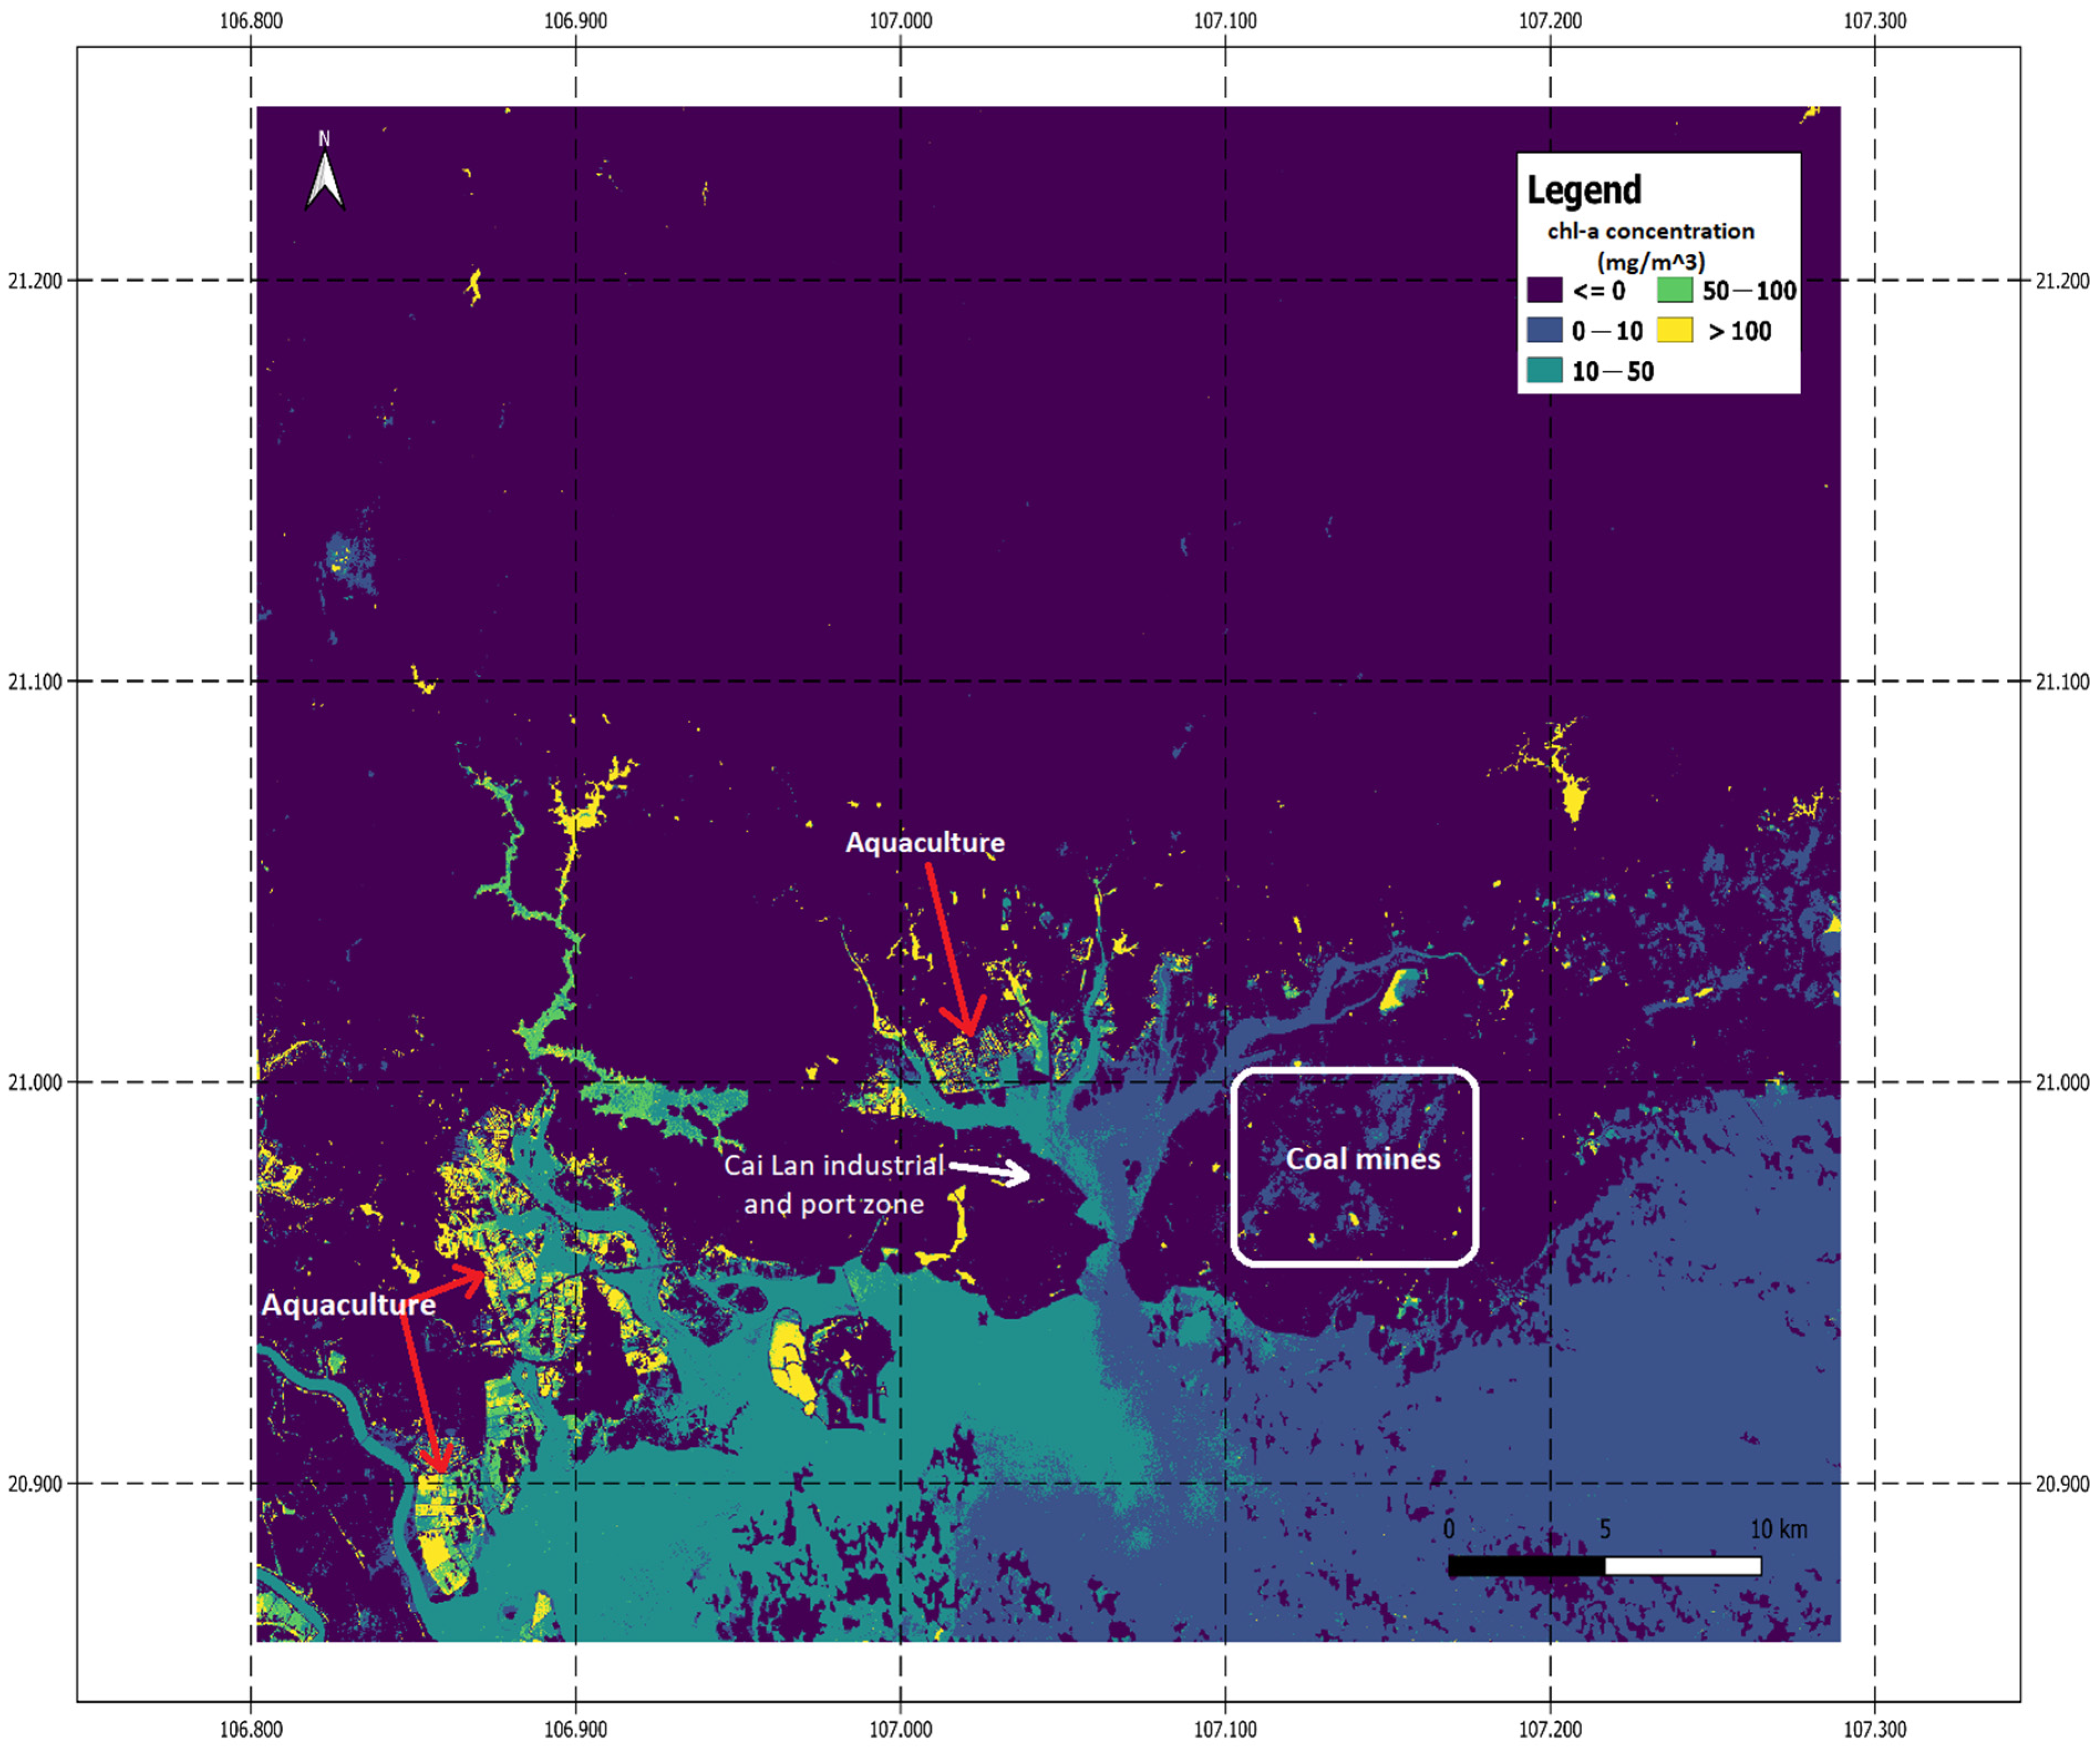
3.4. Mapping Chlorophyll-a Concentration

Figure 6 displays the mean chlorophyll-a concentration from 1 January 2019 to 30 June 2021, showing us a general picture of chl-a concentration in the study regions. The distribution of chl-a tended to focus more on the areas with lakes, aquaculture, and nearby the high intensity urban and tourist activities (near Tuan Chau Island). Particularly, the Cua Luc water was affected by the large Cai Lan industrial and port zone, where disposing of wastewater containing organic matters resulted in high concentrations of chl-a. In addition, residual fish foods from aquaculture produced the highest values of chl-a content in the west of the study area, marked by the red arrows on the map. In contrast, the effects of coal mines on the chl-a concentration of the coastal water were negligible and similar to the offshore areas with chl-a concentrations of less than 10 mg/m3 (southeast region of the map).

4. Discussion

Satellite remote sensing has been used as a valuable tool to support monitoring water quality, especially chlorophyll-a concentration [39,40]. Compared to traditional monitoring methods, remote sensing offers great temporal and spatial coverage and can estimate the water quality of non-accessible water bodies [41]. In this study, we explored those data in the Google Earth Engine (GEE), one of the most popular platforms for large-scale studies of processing satellite data. Hereby, we discuss the state-of-the-art GEE in terms of large open datasets of different sensors (optical and microwave) available. GEE is a geospatial processing service developed to provide an interactive platform for geospatial algorithm development, enabling high-impact, data-driven science and making substantive progress on global challenges dealing with large geospatial datasets. Computationally, GEE is built on top of Google’s tools and service for performing computations at a massive scale using an Earth Engine Compute Unit (EECU), which is a mechanism for representing an amount of instantaneous processing power (https://developers.google.com/earth-engine/guides/computation_overview, accessed on 21 September 2022). Hence, complicated processing can be done on the GEE without the user’s powerful servers or computational stations. That has significantly increased GEE publications during the past few years [42].
There are several algorithms to estimate the chlorophyll-a content in water in general and in ocean water in particular, e.g., OC-2, 4 [26,43] or a machine-learning approach [44]. It is considered to be worth applying existing algorithms rather than developing new ones in terms of cost and time-efficiency. However, algorithms must be adopted with care because differences in geographical, climate, and human-induced conditions between original and applied regions may result in variations of results. This study’s calibration approach significantly reduced the uncalibrated model’s large errors (R2 and RMSE). We used the NOAA chl-a data for the model calibration, which has a high temporal resolution (weekly) but a moderate spatial resolution (4 km). Hence, the calibration results could improve if finer or in situ data were available.
Sentinel-2 satellites with MSI sensors are a good data generator for monitoring variability in land surface conditions [31] but also for studying and assessing aquatic environments [44,45] and all coastal waters up to 20 km from the shore. In this work, we used the Sentinel-2 data processed level-2A from 12 March 2019 to 25 August 2021 directly from the Google Earth Engine data storage. Besides many advantages of fine spatial resolution (10 m), multi-spectral bands (13 bands), and high temporal time (every five days), there are limitations of the optical data for the ocean chl-a application in using GEE. They are cloud covers and cloud shadows, reducing the number of usable scenes, particularly in the rainy season. Even within the 2.5 year period, there were only 81 images with less than 50% cloud coverage. Hence, for better mean and seasonal chl-a maps, a longer assessment time is recommended.
In using optical remote sensing data, atmospheric correction is crucial and challenging [46]. There are several advance atmospheric correction methods for optically complex waters [47,48]. Sen2cor is a well-known tool developed by Telespazio VEGA Deutschland GmbH on behalf of ESA [49]. The main purpose of Sen2Cor is to correct single-date Sentinel-2 Level-1C Top-Of-Atmosphere (TOA) products from the effects of the atmosphere to deliver a Level-2A Bottom-Of-Atmosphere (BOA) reflectance product. This study used this product provided in the GEE globally. Hence, we may need additional information on local conditions such as climate (tropical vs. arid) and a geographic model (urban, forest, or water) when applying for a specific region. The GEE Sentinel-2 level-2A data are ideal for automatic processes and minimal effort for water quality monitoring and can be easily incorporated into operational monitoring programs and are thus highly recommended.
The satellite results of anthropogenic impact on chlorophyll-a concentration might be linked to the timing of the algal bloom surface representation coinciding with the satellite overpass. Although algae have diurnal movements, their cell buoyancy allows for them to move vertically through the water column as well. Winds and tides can also mix algae into the water column [50] therefore if algal blooms do not occur concurrently to satellite overpasses, then it may lead to an underestimation of chl-a. If conditions are suitable in the water, algae can grow and cause a “bloom”, covering lakes with green. Algae blooms can cause serious health effects and even death to the surrounding aquatic ecosystem. Apart from this, urban activities have a considerable impact on the water quality, which causes an increase in the amount of chlorophyll-a. Urban activities have the most consistent and ubiquitous effects on surrounding aquatic ecosystems [51]. Wastewater and waste materials contain many organic compounds that enrich the algae and increase the chlorophyll-a concentration. In addition, aquaculture operations may pollute the surrounding water when solid and soluble waste is generated [52]. Too much nitrogen or phosphorus in fish food can lead to eutrophication and poor water quality. In contrast, 5–8 km offshore (chl-a concentration dropping to 0–10 mg/m3 for all seasons), estuaries, and coal mine activities appear to only slightly affect the chlorophyll-a concentration, and this trend is supported by [36].
Finally, while using optical remote sensing for an ocean chl-a study is popular [53,54,55], an assessment linked to other effects, such as industrial and urban, tourist, coal mining activities, and aquaculture, of this study is still a gap. Rivers, streams, aquaculture, and urban contribute a significant amount of nutrients that promote the phytoplankton (algae) to grow [56,57,58]. It was also found that the effect of coal mining on phytoplankton growth was negligible. The variation maps of chlorophyll-a concentration were the primary result. The work will continue to focus on extracting the in situ data corresponding to the examined points, conducting the regression analysis, and then changing the formula to apply to the region.

5. Conclusions

Chl-a has been shown in many studies to be an important and useful water quality indicator. There are several approaches to measure or estimate the chl-a content in the water, including semi-analytical or empirical methods. However, using remote sensing data has many advantages, such as cost and time efficiency, ability to conduct investigations at a large scale with finer resolution (compared to direct point measurement), and automation in long-time series. In particular, since a wide range of remote sensing data sources are being integrated into the GEE storage with already preprocessed data (levels 2,3), it is a huge support for Earth observation users to research and develop applications. Although the MSI sensor on Sentinel 2 is not optimal for water quality assessment when compared to ocean color sensors such as OLCI, the fine spatial resolution makes it useful for assessment of rivers, estuaries, and coastal embayment, as shown in this study [59]. Concurrent tuning of the chl-a algorithm with MSI and OLCI has demonstrated improved precision of chl-a retrievals from the MSI data [12]. Hence, it is highly recommended to use. This study effectively adopted the OC-2 from the previous research to generate a chl-a concentration map for quickly assessing the impacts of build-up, tourist, aquaculture, and coal mining activities on the chl-a development in the coastal water of Ha Long Bay. This study has successfully demonstrated the use of NOAA chl-a data to calibrate the OC-2 model, but it is recommended that an increased assessment period and integration of in situ gauged information will be essential for follow-up works to improve the model prediction and replication of the result for other similar regions.

Author Contributions

Conceptualization, J.A., N.H.Q., M.N.N. and V.A.T.; methodology, N.H.Q., M.N., N.D.V., M.P. and J.A.; field investigation, N.D.V., N.H.Q. and V.A.T.; data analysis, N.H.Q., M.P., M.N.N., J.A., M.N. and N.D.V.; writing—original draft preparation, N.H.Q.; writing—review and editing, N.H.Q., J.A., M.N.N., M.P. and M.N.; visualization, N.H.Q., N.D.V. and M.N.N.; supervision, V.A.T., M.N. and M.N.N.; project administration, N.H.Q., V.A.T. and M.P.; All authors have read and agreed to the published version of the manuscript.

Funding

This research was funded by the Ministry of Science and Technology (MOST), Vietnam, through the project “Supporting rapid assessment of landscape change to improve planning and decision-making in Vietnam” (grant No. NĐT/AU/21/15). The work of M.N. was supported by statutory activities of the Ministry of Science and Higher Education of Poland.

Acknowledgments

The authors would like to thank all the anonymous reviewers and the assistant editor for their constructive comments and suggestions on this manuscript.

Conflicts of Interest

The authors declare no conflict of interest.

References

  1. Heathwaite, A. Multiple stressors on water availability at global to catchment scales: Understanding human impact on nutrient cycles to protect water quality and water availability in the long term. Freshw. Biol. 2010, 55, 241–257. [Google Scholar] [CrossRef]
  2. Torbick, N.; Hession, S.; Hagen, S.; Wiangwang, N.; Becker, B.; Qi, J. Mapping inland lake water quality across the Lower Peninsula of Michigan using Landsat TM imagery. Int. J. Remote Sens. 2013, 34, 7607–7624. [Google Scholar] [CrossRef]
  3. Kondratyev, K.Y.; Pozdnyakov, D.V.; Pettersson, L. Water quality remote sensing in the visible spectrum. Int. J. Remote Sens. 1998, 19, 957–979. [Google Scholar] [CrossRef]
  4. Bartley, R.; Speirs, W.J.; Ellis, T.W.; Waters, D.K. A review of sediment and nutrient concentration data from Australia for use in catchment water quality models. Mar. Pollut. Bull. 2012, 65, 101–116. [Google Scholar] [CrossRef]
  5. Khattab, M.F.O.; Merkel, B.J. Application of Landsat 5 and Landsat 7 images data for water quality mapping in Mosul Dam Lake, Northern Iraq. Arab. J. Geosci. 2014, 7, 3557–3573. [Google Scholar] [CrossRef]
  6. Ritchie, J.C.; Zimba, P.V.; Everitt, J.H. Remote sensing techniques to assess water quality. Photogramm. Eng. Remote Sens. 2003, 69, 695–704. [Google Scholar] [CrossRef]
  7. Gholizadeh, M.H.; Melesse, A.M.; Reddi, L. A comprehensive review on water quality parameters estimation using remote sensing techniques. Sensors 2016, 16, 1298. [Google Scholar] [CrossRef]
  8. Klein, I.; Oppelt, N.; Kuenzer, C. Application of remote sensing data for locust research and management—A review. Insects 2021, 12, 233. [Google Scholar] [CrossRef]
  9. Mobley, C.D. The optical properties of water. Handb. Opt. 1995, 1, 43.3–43.56. [Google Scholar]
  10. Eid, M.M.M.; El-Bialee, N.M.; Elhegazy, H.; El-Khatib, S.I.; Hassan, H.E. Application of optical properties in water purification quality testing. Water Pract. Technol. 2021, 16, 895–903. [Google Scholar] [CrossRef]
  11. CRCSI. Earth Observation: Data, Processing and Applications. Volume 3B: Applications—Surface Waters; Harrison, B.A., Anstee, J.M., Dekker, A.G., King, E.A., Griffin, D.A., Mueller, N., Phinn, S.R., Kovacs, E., Byrne, G., Eds.; CRCSI: Melbourne, Australia, 2021. [Google Scholar]
  12. Warren, M.A.; Simis, S.G.; Selmes, N. Complementary water quality observations from high and medium resolution Sentinel sensors by aligning chlorophyll-a and turbidity algorithms. Remote Sens. Environ. 2021, 265, 112651. [Google Scholar] [CrossRef]
  13. Blondeau-Patissier, D.; Gower, J.F.R.; Dekker, A.G.; Phinn, S.R.; Brando, V.E. A review of ocean color remote sensing methods and statistical techniques for the detection, mapping and analysis of phytoplankton blooms in coastal and open oceans. Prog. Oceanogr. 2014, 123, 123–144. [Google Scholar] [CrossRef]
  14. Potes, M.; Costa, M.J.; Da Silva, J.C.B.; Silva, A.M.; Morais, M. Remote sensing of water quality parameters over Alqueva reservoir in the south of Portugal. Int. J. Remote Sens. 2011, 32, 3373–3388. [Google Scholar] [CrossRef]
  15. Brooks, B.W.; Lazorchak, J.M.; Howard, M.D.; Johnson, M.V.V.; Morton, S.L.; Perkins, D.A.; Reavie, E.D.; Scott, G.I.; Smith, S.A.; Steevens, J.A. Are harmful algal blooms becoming the greatest inland water quality threat to public health and aquatic ecosystems? Environ. Toxicol. Chem. 2016, 35, 6–13. [Google Scholar] [CrossRef]
  16. EPA. Indicators: Chlorophyll a. 2013. Available online: https://www.epa.gov/national-aquatic-resource-surveys/indicators-chlorophyll (accessed on 4 September 2021).
  17. Chen, J.; Zhu, W.; Tian, Y.Q.; Yu, Q.; Zheng, Y.; Huang, L. Remote estimation of colored dissolved organic matter and chlorophyll-a in Lake Huron using Sentinel-2 measurements. J. Appl. Remote Sens. 2017, 11, 036007. [Google Scholar] [CrossRef]
  18. Drusch, M.; Del Bello, U.; Carlier, S.; Colin, O.; Fernandez, V.; Gascon, F.; Hoersch, B.; Isola, C.; Laberinti, P.; Martimort, P.; et al. Sentinel-2: ESA’s optical high-resolution mission for GMES operational services. Remote Sens. Environ. 2012, 120, 25–36. [Google Scholar] [CrossRef]
  19. Pompêo, M.; Moschini-Carlos, V.; Bitencourt, M.D.; Sòria-Perpinyà, X.; Vicente, E.; Delegido, J. Water quality assessment using Sentinel-2 imagery with estimates of chlorophyll a, Secchi disk depth, and Cyanobacteria cell number: The Cantareira System reservoirs (São Paulo, Brazil). Environ. Sci. Pollut. Res. 2021, 28, 34990–35011. [Google Scholar] [CrossRef]
  20. Maciel, D.A.; Barbosa, C.C.F.; Novo, E.M.L.D.M.; Júnior, R.F.; Begliomini, F.N. Water clarity in Brazilian water assessed using Sentinel-2 and machine learning methods. ISPRS J. Photogramm. Remote Sens. 2021, 182, 134–152. [Google Scholar] [CrossRef]
  21. Molkov, A.A.; Fedorov, S.V.; Pelevin, V.V.; Korchemkina, E.N. Regional models for high-resolution retrieval of chlorophyll a and TSM concentrations in the Gorky Reservoir by Sentinel-2 imagery. Remote Sens. 2019, 11, 1215. [Google Scholar] [CrossRef]
  22. Sudheer, K.; Chaubey, I.; Garg, V. Lake water quality assessment from landsat thematic mapper data using neural network: An approach to optimal band combination selection1. JAWRA J. Am. Water Resour. Assoc. 2006, 42, 1683–1695. [Google Scholar] [CrossRef]
  23. Allan, M.G.; Hicks, B.J.; Brabyn, L. Remote Sensing of Water Quality in the Rotorua Lakes; CBER Contract Report 51; The University of Waikato: Hamilton, New Zealand, 2007; pp. 1–27. [Google Scholar]
  24. Menken, K.D.; Brezonik, P.L.; Bauer, M.E. Influence of chlorophyll and colored dissolved organic matter (CDOM) on lake reflectance spectra: Implications for measuring lake properties by remote sensing. Lake Reserv. Manag. 2006, 22, 179–190. [Google Scholar] [CrossRef] [Green Version]
  25. Sent, G.; Biguino, B.; Favareto, L.; Cruz, J.; Sá, C.; Dogliotti, A.; Palma, C.; Brotas, V.; Brito, A. Deriving Water Quality Parameters Using Sentinel-2 Imagery: A Case Study in the Sado Estuary, Portugal. Remote Sens. 2021, 13, 1043. [Google Scholar] [CrossRef]
  26. Poddar, S.; Chacko, N.; Swain, D. Estimation of Chlorophyll-a in northern coastal Bay of Bengal using Landsat-8 OLI and Sentinel-2 MSI sensors. Front. Mar. Sci. 2019, 6, 598. [Google Scholar] [CrossRef]
  27. Duong, N.D.; Nierynck, E.; Van, T.; Hens, L. Land use changes and gis-database development for strategic environmental assessment in Ha Long Bay, Quang Ninh province, Vietnam. In Proceedings of the Application of Resource Information Technologies (GIS/GPS/RS) in Forest Land and Resources Management Conference, Hanoi, Vietnam, 19 June 1999. [Google Scholar]
  28. Rogowski, P.; Oceanography, S.I.O.; Zavala-Garay, J.; Shearman, K.; Terrill, E.; Wilkin, J.; Lam, T.H. Air-sea-land forcing in the Gulf of Tonkin: Assessing seasonal variability using modern tools. Oceanography 2019, 32, 150–161. [Google Scholar] [CrossRef]
  29. Nguyen-Duy, T.; Ayoub, N.K.; Marsaleix, P.; Toublanc, F.; De Mey-Frémaux, P.; Piton, V.; Herrmann, M.; Duhaut, T.; Tran, M.C.; Ngo-Duc, T. Variability of the Red River plume in the Gulf of Tonkin as revealed by numerical modeling and clustering analysis. Front. Mar. Sci. 2021, 8, 772139. [Google Scholar] [CrossRef]
  30. Kuc, G.; Chormański, J. Sentinel-2 imagery for mapping and monitoring imperviousness in urban areas. The International Archives of Photogrammetry. Remote Sens. Spat. Inf. Sci. 2019, 42, 43–47. [Google Scholar]
  31. ESA. 2021. Available online: https://scihub.copernicus.eu/dhus/#/home (accessed on 30 December 2021).
  32. Toolbox, Sentinel-2 Toolbox. Available online: http://step.esa.int/main/toolboxes/sentinel-2-toolbox (accessed on 15 December 2021).
  33. NOAA. National Oceanic and Atmospheric Administration Archive. Available online: https://data.noaa.gov/dataset/dataset/chlorophyll-noaa-viirs-snpp-near-real-time-global-level-3-2018-present-experimental-weekly (accessed on 15 October 2021).
  34. O’Reilly, J.E.; Maritorena, S.; Mitchell, B.G.; Siegel, D.A.; Carder, K.L.; Garver, S.A.; Kahru, M.; McClain, C. Ocean color chlorophyll algorithms for SeaWiFS. J. Geophys. Res. Ocean 1998, 103, 24937–24953. [Google Scholar] [CrossRef]
  35. Moses, W.J.; Bowles, J.H.; Corson, M.R. Expected improvements in the quantitative remote sensing of optically complex waters with the use of an optically fast hyperspectral spectrometer—A modeling study. Sensors 2015, 15, 6152–6173. [Google Scholar] [CrossRef]
  36. Lessin, G.; Ossipova, V.; Lips, I.; Raudsepp, U. Identification of the Coastal Zone of the Central and Eastern Gulf of Finland by Numerical Modeling, Measurements, and Remote Sensing of Chlorophyll a. In Eutrophication in Coastal Ecosystems; Springer: Berlin/Heidelberg, Germany, 2009; pp. 187–198. [Google Scholar]
  37. Hang, V.T.T. Assessing the Status and Changes of Water Environment in Cua Luc Bay and Propose Solutions to Reduce Pollution (Translated). Đánh giá thực trạng, diễn biến môi trừờng nước vịnh cửa lục và đề xuất giải pháp giảm thiểu ô nhiễm (original Vietnamese version). Master’s Thesis, Resource and Environment Research Center, Hanoi National University, Hanoi, Vietnam, 2013; pp. 1–94. [Google Scholar]
  38. NOAA. Upwelling Is a Process in Which Deep, Cold Water Rises toward the Surface. 2021. Available online: https://oceanservice.noaa.gov/facts/upwelling.html (accessed on 15 February 2021).
  39. Niveditha, S.K.; Haridevi, C.; Hardikar, R.; Ram, A. Phytoplankton assemblage and chlorophyll a along the salinity gradient in a hypoxic eutrophic tropical estuary-Ulhas Estuary, West Coast of India. Mar. Pollut. Bull. 2022, 180, 113719. [Google Scholar] [CrossRef]
  40. Harvey, E.T.; Kratzer, S.; Philipson, P. Satellite-based water quality monitoring for improved spatial and temporal retrieval of chlorophyll-a in coastal waters. Remote Sens. Environ. 2015, 158, 417–430. [Google Scholar] [CrossRef]
  41. Kim, H.G.; Hong, S.; Chon, T.-S.; Joo, G.-J. Spatial patterning of chlorophyll a and water-quality measurements for determining environmental thresholds for local eutrophication in the Nakdong River basin. Environ. Pollut. 2021, 268, 115701. [Google Scholar] [CrossRef]
  42. Amani, M.; Ghorbanian, A.; Ahmadi, S.A.; Kakooei, M.; Moghimi, A.; Mirmazloumi, S.M.; Moghaddam, S.H.A.; Mahdavi, S.; Ghahremanloo, M.; Parsian, S.; et al. Google earth engine cloud computing platform for remote sensing big data applications: A comprehensive review. IEEE J. Sel. Top. Appl. Earth Obs. Remote Sens. 2020, 13, 5326–5350. [Google Scholar] [CrossRef]
  43. Chauhan, P.; Mohan, M.; Nayak, S.R.; Navalgund, R.R. Comparison of ocean color chlorophyll algorithms for IRS-P4 OCM sensor usingin-situ data. J. Indian Soc. Remote Sens. 2002, 30, 87–94. [Google Scholar] [CrossRef]
  44. Pahlevan, N.; Smith, B.; Schalles, J.; Binding, C.; Cao, Z.; Ma, R.; Alikas, K.; Kangro, K.; Gurlin, D.; Nguyen, H.; et al. Seamless retrievals of chlorophyll-a from Sentinel-2 (MSI) and Sentinel-3 (OLCI) in inland and coastal waters: A machine-learning approach. Remote Sens. Environ. 2020, 240, 111604. [Google Scholar] [CrossRef]
  45. Kuhn, C.; De Matos Valerio, A.; Ward, N.; Loken, L.; Sawakuchi, H.O.; Kampel, M.; Richey, J.; Stadler, P.; Crawford, J.; Striegl, R.; et al. Performance of Landsat-8 and Sentinel-2 surface reflectance products for river remote sensing retrievals of chlorophyll-a and turbidity. Remote Sens. Environ. 2019, 224, 104–118. [Google Scholar] [CrossRef]
  46. Toming, K.; Kutser, T.; Laas, A.; Sepp, M.; Paavel, B.; Nõges, T. First experiences in mapping lake water quality parameters with Sentinel-2 MSI imagery. Remote Sens. 2016, 8, 640. [Google Scholar] [CrossRef]
  47. Vanhellemont, Q.; Ruddick, K. Advantages of high quality SWIR bands for ocean colour processing: Examples from Landsat-8. Remote Sens. Environ. 2015, 161, 89–106. [Google Scholar] [CrossRef]
  48. Sterckx, S.; Knaeps, E.; Adriaensen, S.; Reusen, I.; De Keukelaere, L.; Hunter, P.; Giardino, C.; Odermatt, D. OPERA: An atmospheric correction for land and water. In Proceedings of the Sentinel-3 for Science Workshop, Venice, Italy, 2–5 June 2015. [Google Scholar]
  49. Main-Knorn, M.; Pflug, B.; Louis, J.; Debaecker, V.; Müller-Wilm, U.; Gascon, F. Sen2Cor for sentinel-2. In Proceedings of the SPIE 10427, Image and Signal Processing for Remote Sensing XXIII, Warsaw, Poland, 11–14 September 2017. [Google Scholar]
  50. Li, Y.; Yang, D.; Xu, L.; Gao, G.; He, Z.; Cui, X.; Jiang, W.; Feng, X.; Yin, B. Three types of typhoon-induced upwellings enhance coastal algal blooms: A case study. J. Geophys. Res. Ocean 2022, 127, e2022JC018448. [Google Scholar] [CrossRef]
  51. Duan, W.; Cui, H.; Jia, X.; Huang, X. Occurrence and ecotoxicity of sulfonamides in the aquatic environment: A review. Sci. Total Environ. 2022, 820, 153178. [Google Scholar] [CrossRef] [PubMed]
  52. Farmaki, E.G.; Thomaidis, N.S.; Pasias, I.N.; Rousis, N.I.; Baulard, C.; Papaharisis, L.; Efstathiou, C.E. Advanced multivariate techniques for the classification and pollution of marine sediments due to aquaculture. Sci. Total Environ. 2021, 763, 144617. [Google Scholar] [CrossRef]
  53. Asim, M.; Brekke, C.; Mahmood, A.; Eltoft, T.; Reigstad, M. Improving chlorophyll-a estimation from Sentinel-2 (MSI) in the Barents Sea using machine learning. IEEE J. Sel. Top. Appl. Earth Obs. Remote Sens. 2021, 14, 5529–5549. [Google Scholar] [CrossRef]
  54. Tavares, M.H.; Lins, R.C.; Harmel, T.; Fragoso, C.R., Jr.; Martínez, J.M.; Motta-Marques, D. Atmospheric and sunglint correction for retrieving chlorophyll-a in a productive tropical estuarine-lagoon system using Sentinel-2 MSI imagery. ISPRS J. Photogramm. Remote Sens. 2021, 174, 215–236. [Google Scholar] [CrossRef]
  55. Shaik, I.; Mohammad, S.; Nagamani, P.V.; Begum, S.K.; Kayet, N.; Varaprasad, D. Assessment of chlorophyll-a retrieval algorithms over Kakinada and Yanam turbid coastal waters along east coast of India using Sentinel-3A OLCI and Sentinel-2A MSI sensors. Remote Sens. Appl. Soc. Environ. 2021, 24, 100644. [Google Scholar] [CrossRef]
  56. Bui, T.D.; Luong-Van, J.; Austin, C.M. Impact of shrimp farm effluent on water quality in coastal areas of the world heritage-listed Ha Long Bay. Am. J. Environ. Sci. 2012, 8, 104–116. [Google Scholar]
  57. Nguyễn, T.T.N.; Đồng, K.L.; Nguyễn, C.H. Development of Water Quality Index for Coastal Zone and Application in the Hạ Long Bay. VNU J. Sci. Earth Environ. Sci. 2013, 29, 43–52. [Google Scholar]
  58. Bui, D.T. Environmental Impacts of Coastal Shrimp Farming in North Vietnam; Charles Darwin University: Darwin, Australia, 2012. [Google Scholar]
  59. Hestir, E.L.; Brando, V.E.; Bresciani, M.; Giardino, C.; Matta, E.; Villa, P.; Dekker, A.G. Measuring freshwater aquatic ecosystems: The need for a hyperspectral global mapping satellite mission. Remote Sens. Environ. 2015, 167, 181–195. [Google Scholar] [CrossRef] [Green Version]
Figure 1. Location of the study area of Ha Long City in Quang Ninh Province of Vietnam with 49 points divided into six groups (distinguished using colored circles) of anthropogenic impact on chlorophyll-a concentration.
Remotesensing 14 04822 g001
Figure 2. Method workflow chart for estimating and generating chlorophyll-a (chl-a) maps; NDWI is the normalized difference water index, NOAA is the short form of National Oceanic and Atmospheric Administration (USA), R2 is the coefficient of determination, and ROI stands for the region of interest.
Remotesensing 14 04822 g002
Figure 3. Scatter diagram of model predicted chl-a versus NOAA data; (A) in the training stage, (B) in the testing phase of the calibrated OC-2, and (C) of the uncalibrated OC-2.
Remotesensing 14 04822 g003
Figure 4. Comparison of different locations representative of anthropogenic activities with chlorophyll-a concentrations retrieved from Sentinel-2 data presented at the natural logarithm (Ln) scale.
Remotesensing 14 04822 g004
Figure 5. Distribution of chl-a concentration (mg/m3) retrieved from Sentinel-2 using the OC-2 algorithm in Ha Long Bay in 2019 in (a) spring, (b) summer, (c) fall, and (d) winter.
Remotesensing 14 04822 g005
Figure 6. Map of the mean chlorophyll-a concentration from 2019 to 2021.
Remotesensing 14 04822 g006
Table 1. Spatial resolution bands of Sentinel-2 Level 2A; NIR stands for near-infrared, and SWIR is short-wave infrared.
Sentinel-2 Bands Central   Wavelength   ( μ m ) Bandwidth   ( μ m ) Spatial Resolution (m)
Band 1—Coastal aerosol0.4430.02060
Band 2—Blue0.4900.06610
Band 3—Green0.5600.03510
Band 4—Red0.6650.03010
Band 5—Vegetation red edge0.7050.01520
Band 6—Vegetation red edge0.7400.01520
Band 7—Vegetation red edge0.7830.02020
Band 8—NIR0.8420.01210
Band 8A—Vegetation red edge0.8650.02020
Band 9—Water vapor0.9450.02060
Band 10—SWIR—Cirrus1.3750.03060
Band 11—SWIR 1.6100.09020
Band 12—SWIR 2.1900.01820
Table 2. Coefficient of determination (R2) and root mean square error (RMSE) computed for training and testing phases, and a comparison of coefficients of the original OC-2 [26] and the calibrated model of this study.
ParametersOriginal OC-2 [26]Calibrated Model
Training Phase
Calibrated Model
Testing Phase
R20.300.850.81
RMSE (mg/m3)4.152.302.80
Coefficients of Equation (2)a0 = 0.341
a1 = −3.0010
a2 = 2.811
a3 = −2.041
a4 = 0.0400
a0 = 0.354
a1 = −2.8009
a2 = 2.902
a3 = −1.977
a4 = 0.0750
Publisher’s Note: MDPI stays neutral with regard to jurisdictional claims in published maps and institutional affiliations.

