
Evaluation of Aerosol Typing with Combination of Remote Sensing Techniques with In Situ Data during the PANACEA Campaigns in Thessaloniki Station, Greece

 ,
,
Abstract
:1. Introduction
2. Instrumentation and Products
2.1. Thessaloniki LIdar SYStem (THELISYS)
2.2. Cimel Sunphotometer
2.3. Aethalometer
2.4. MP101M
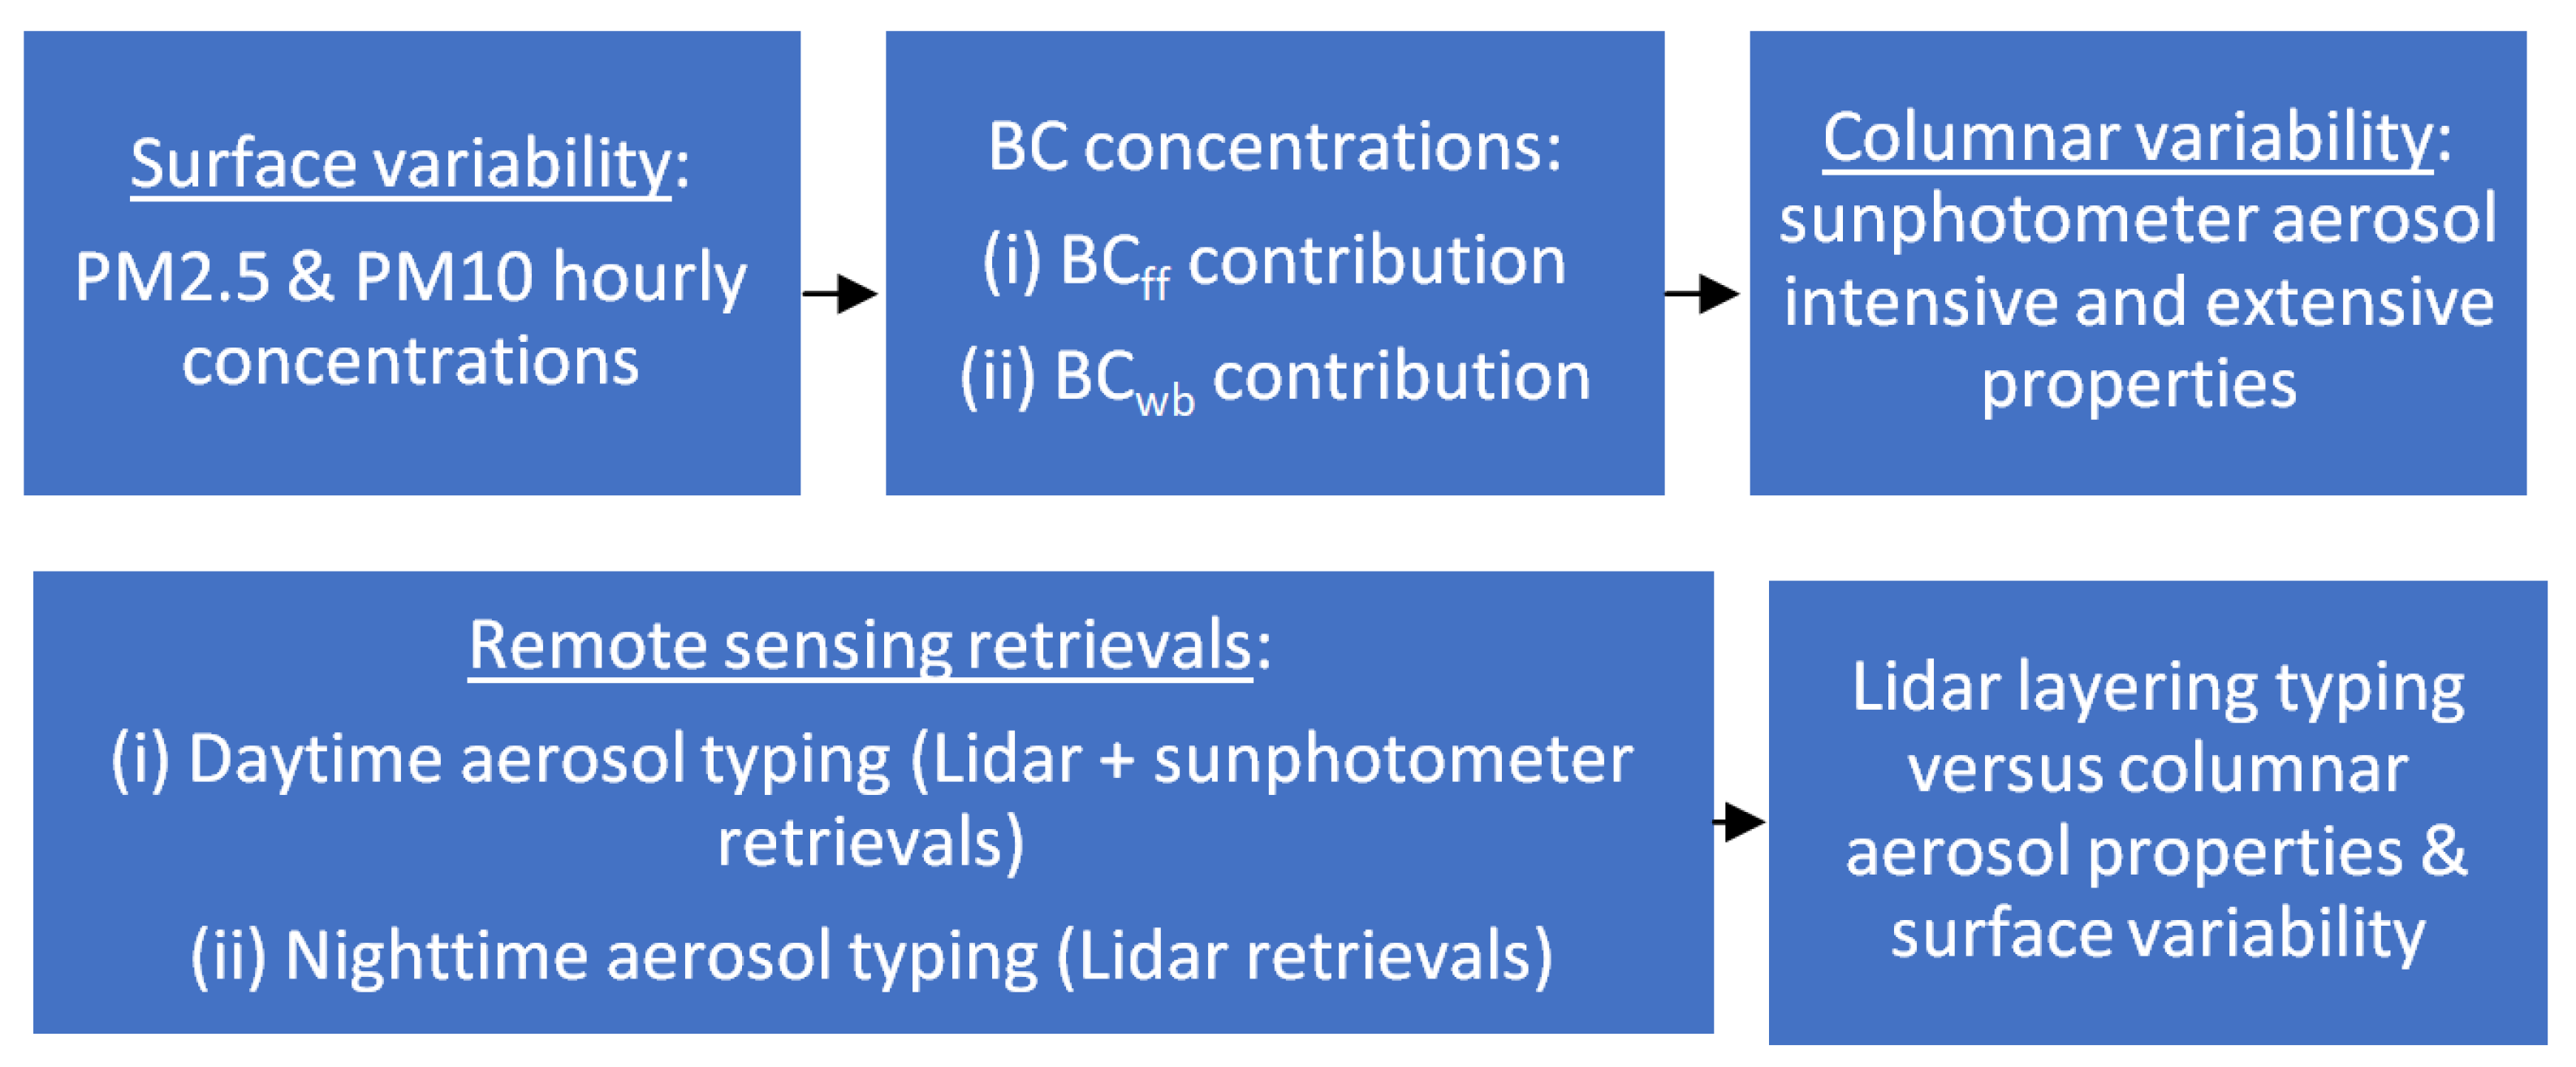
3. Methodology
3.1. In Situ and Columnar Properties
3.2. Layering Properties
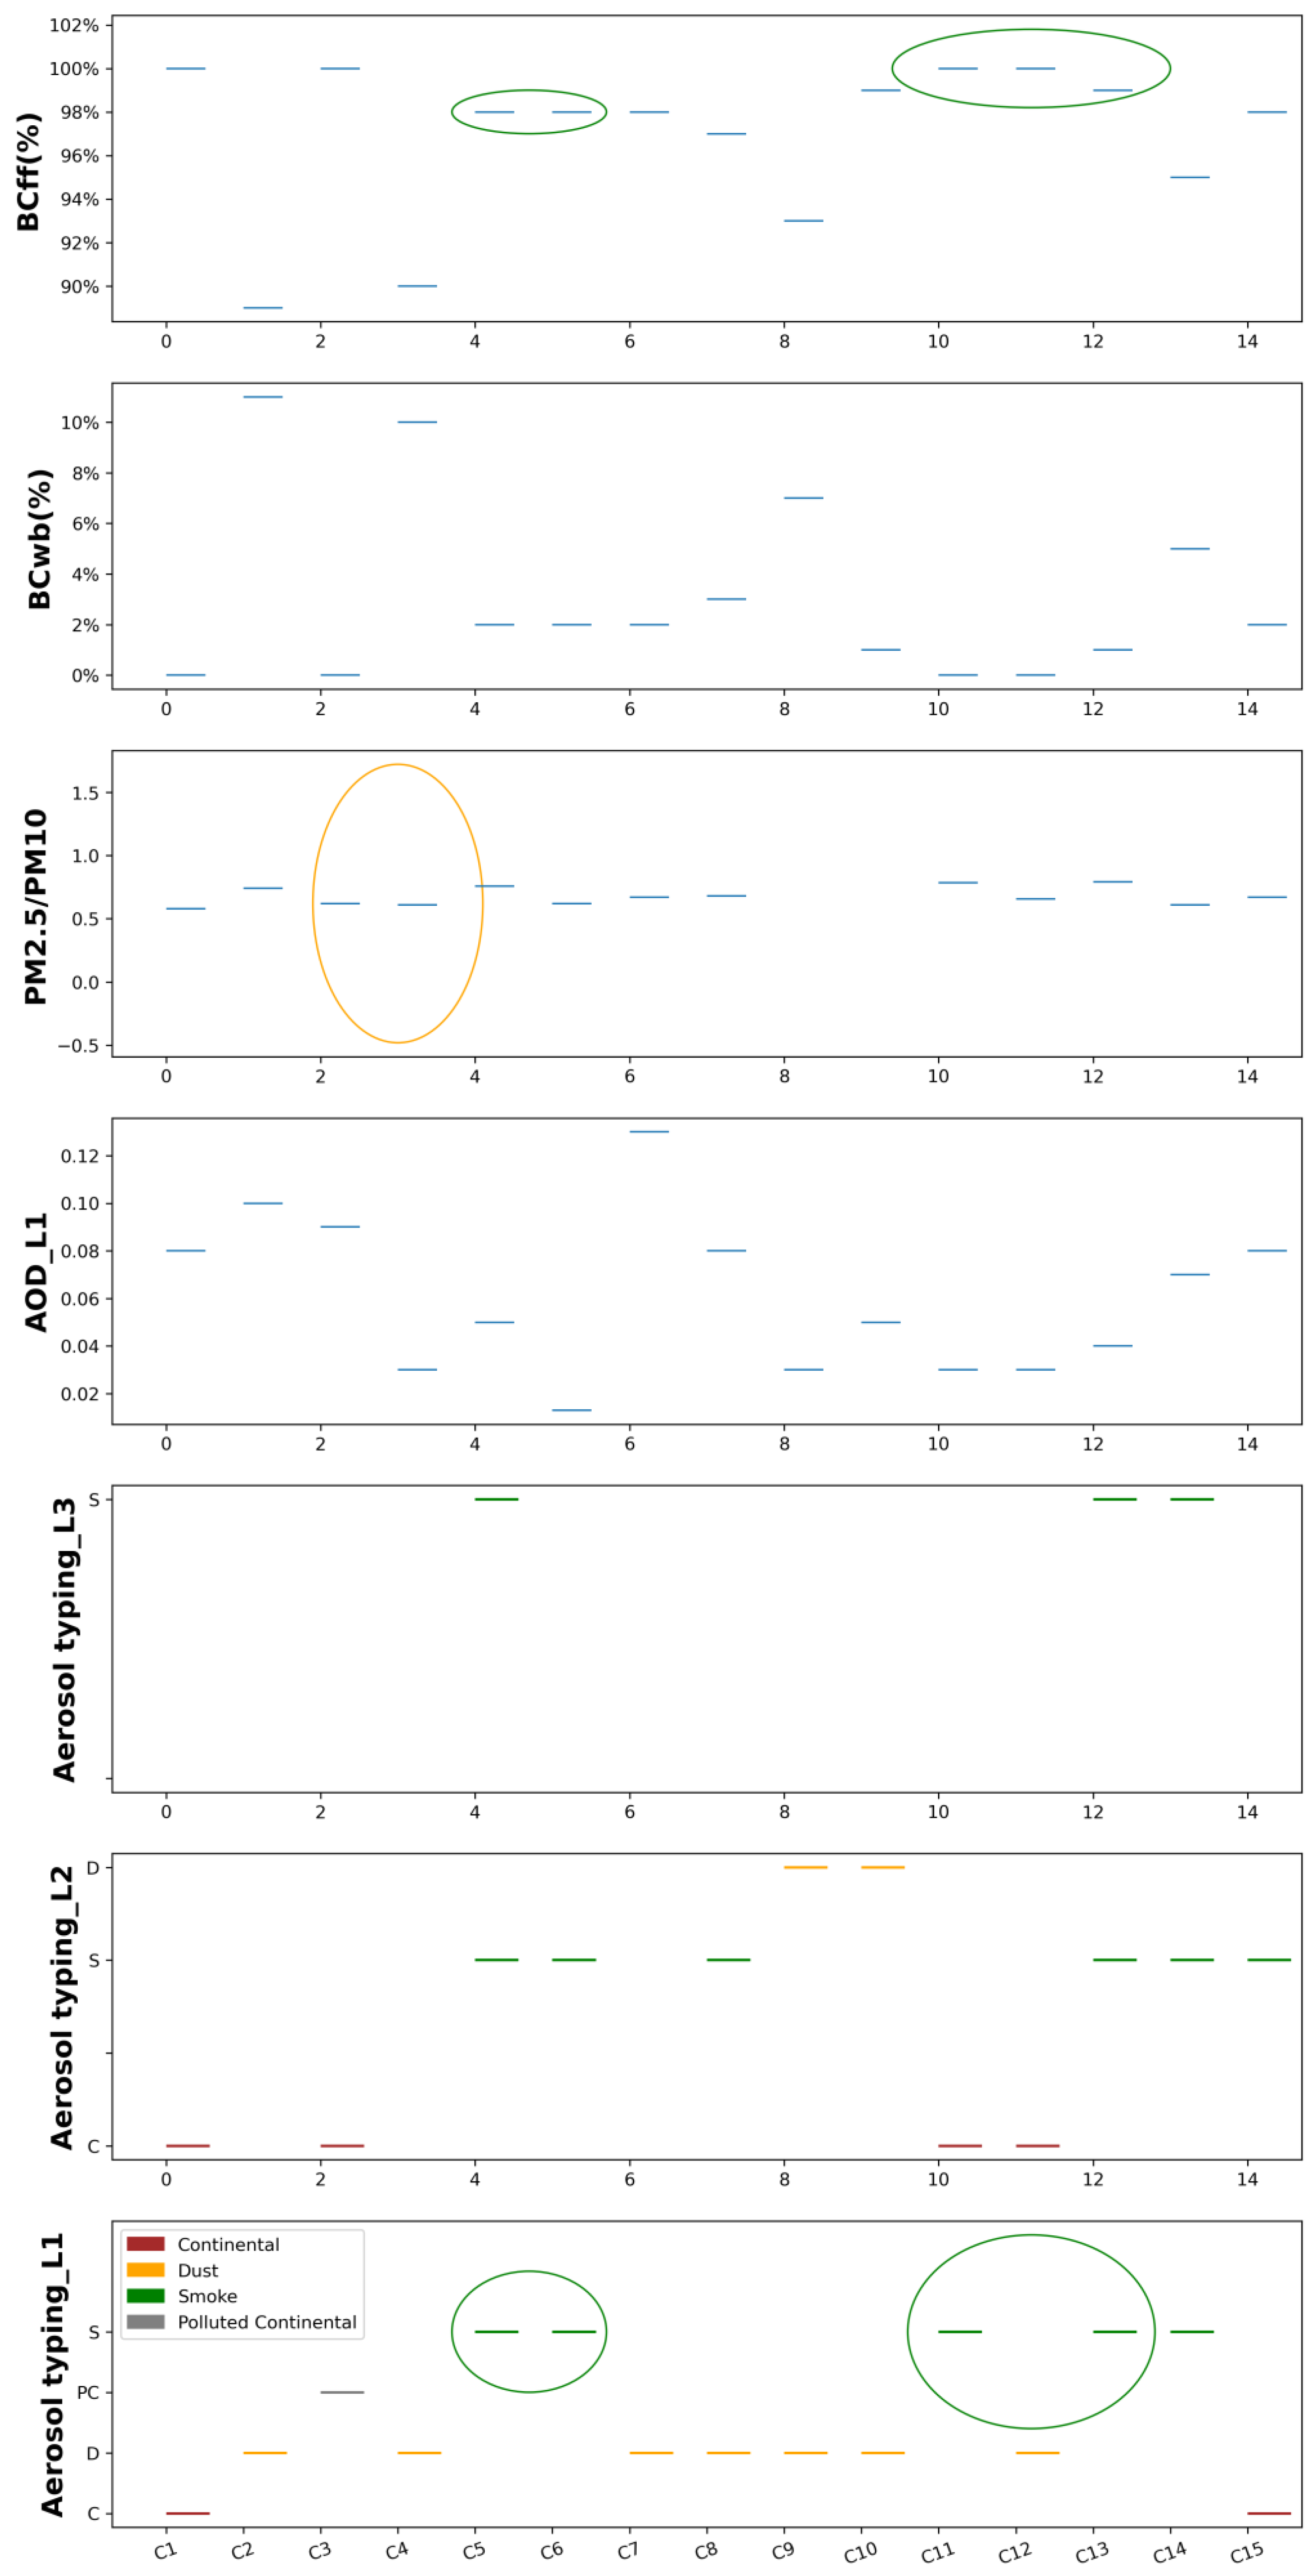
3.3. Typing Procedures
4. Results
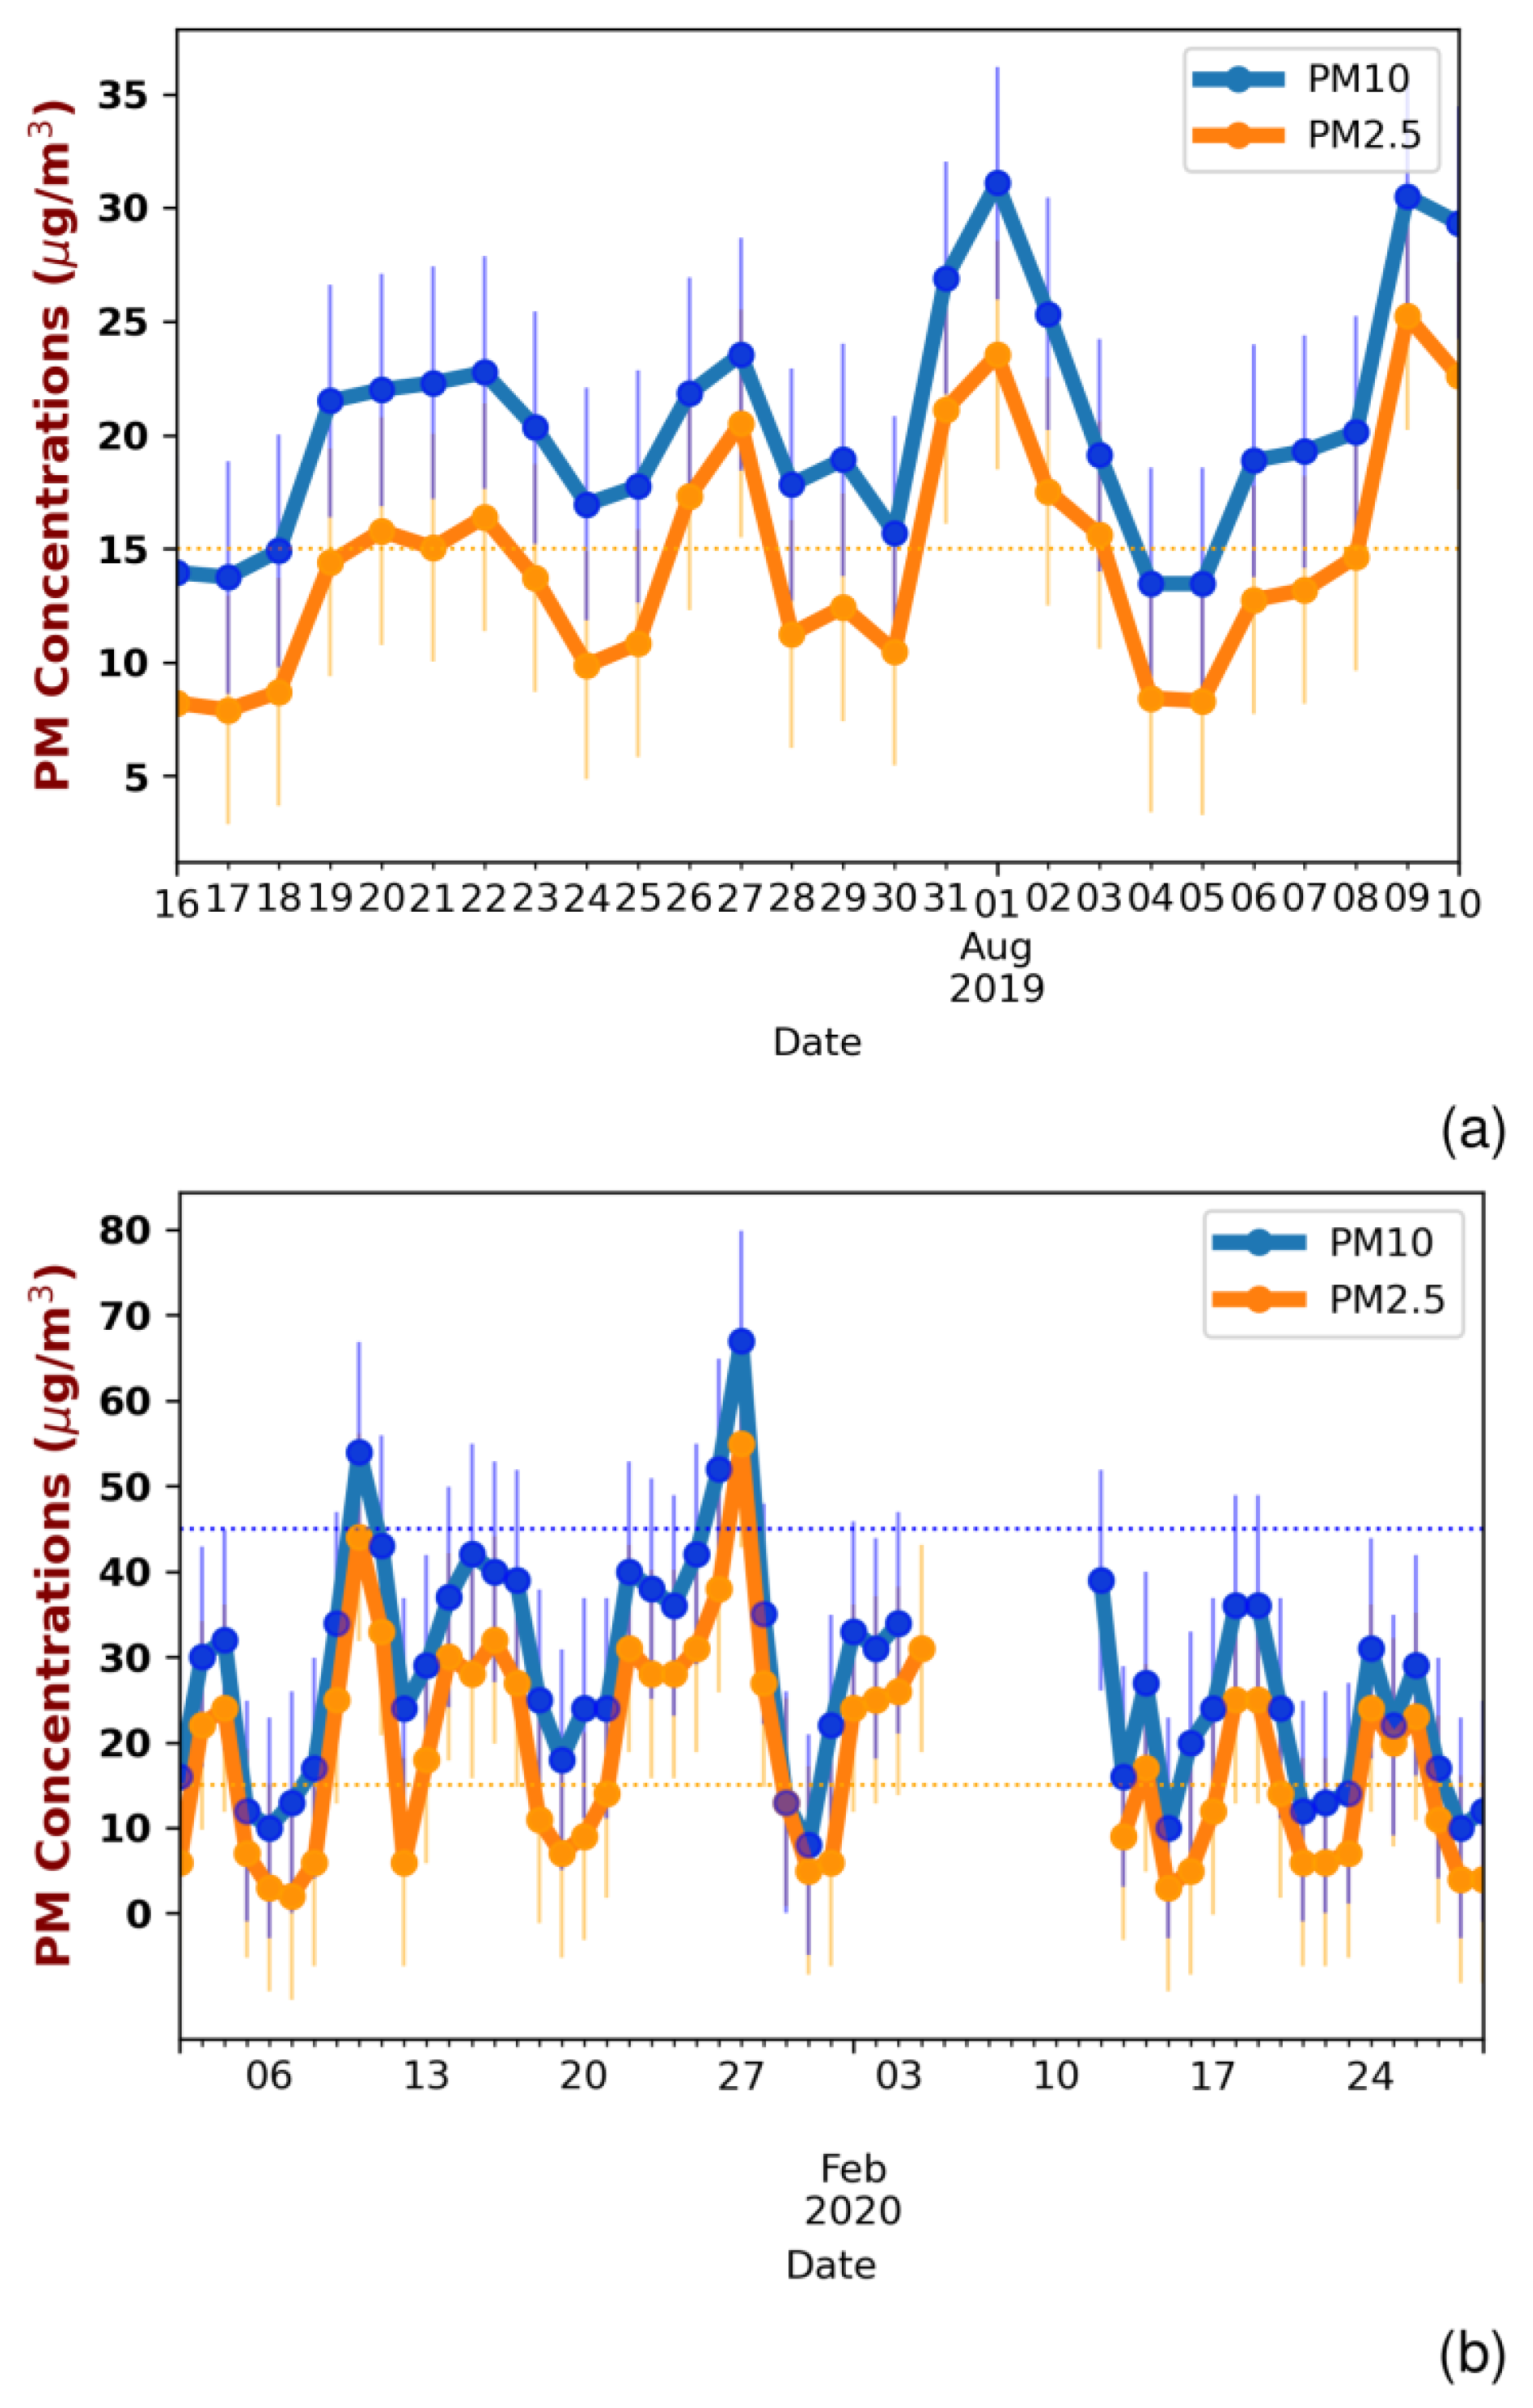
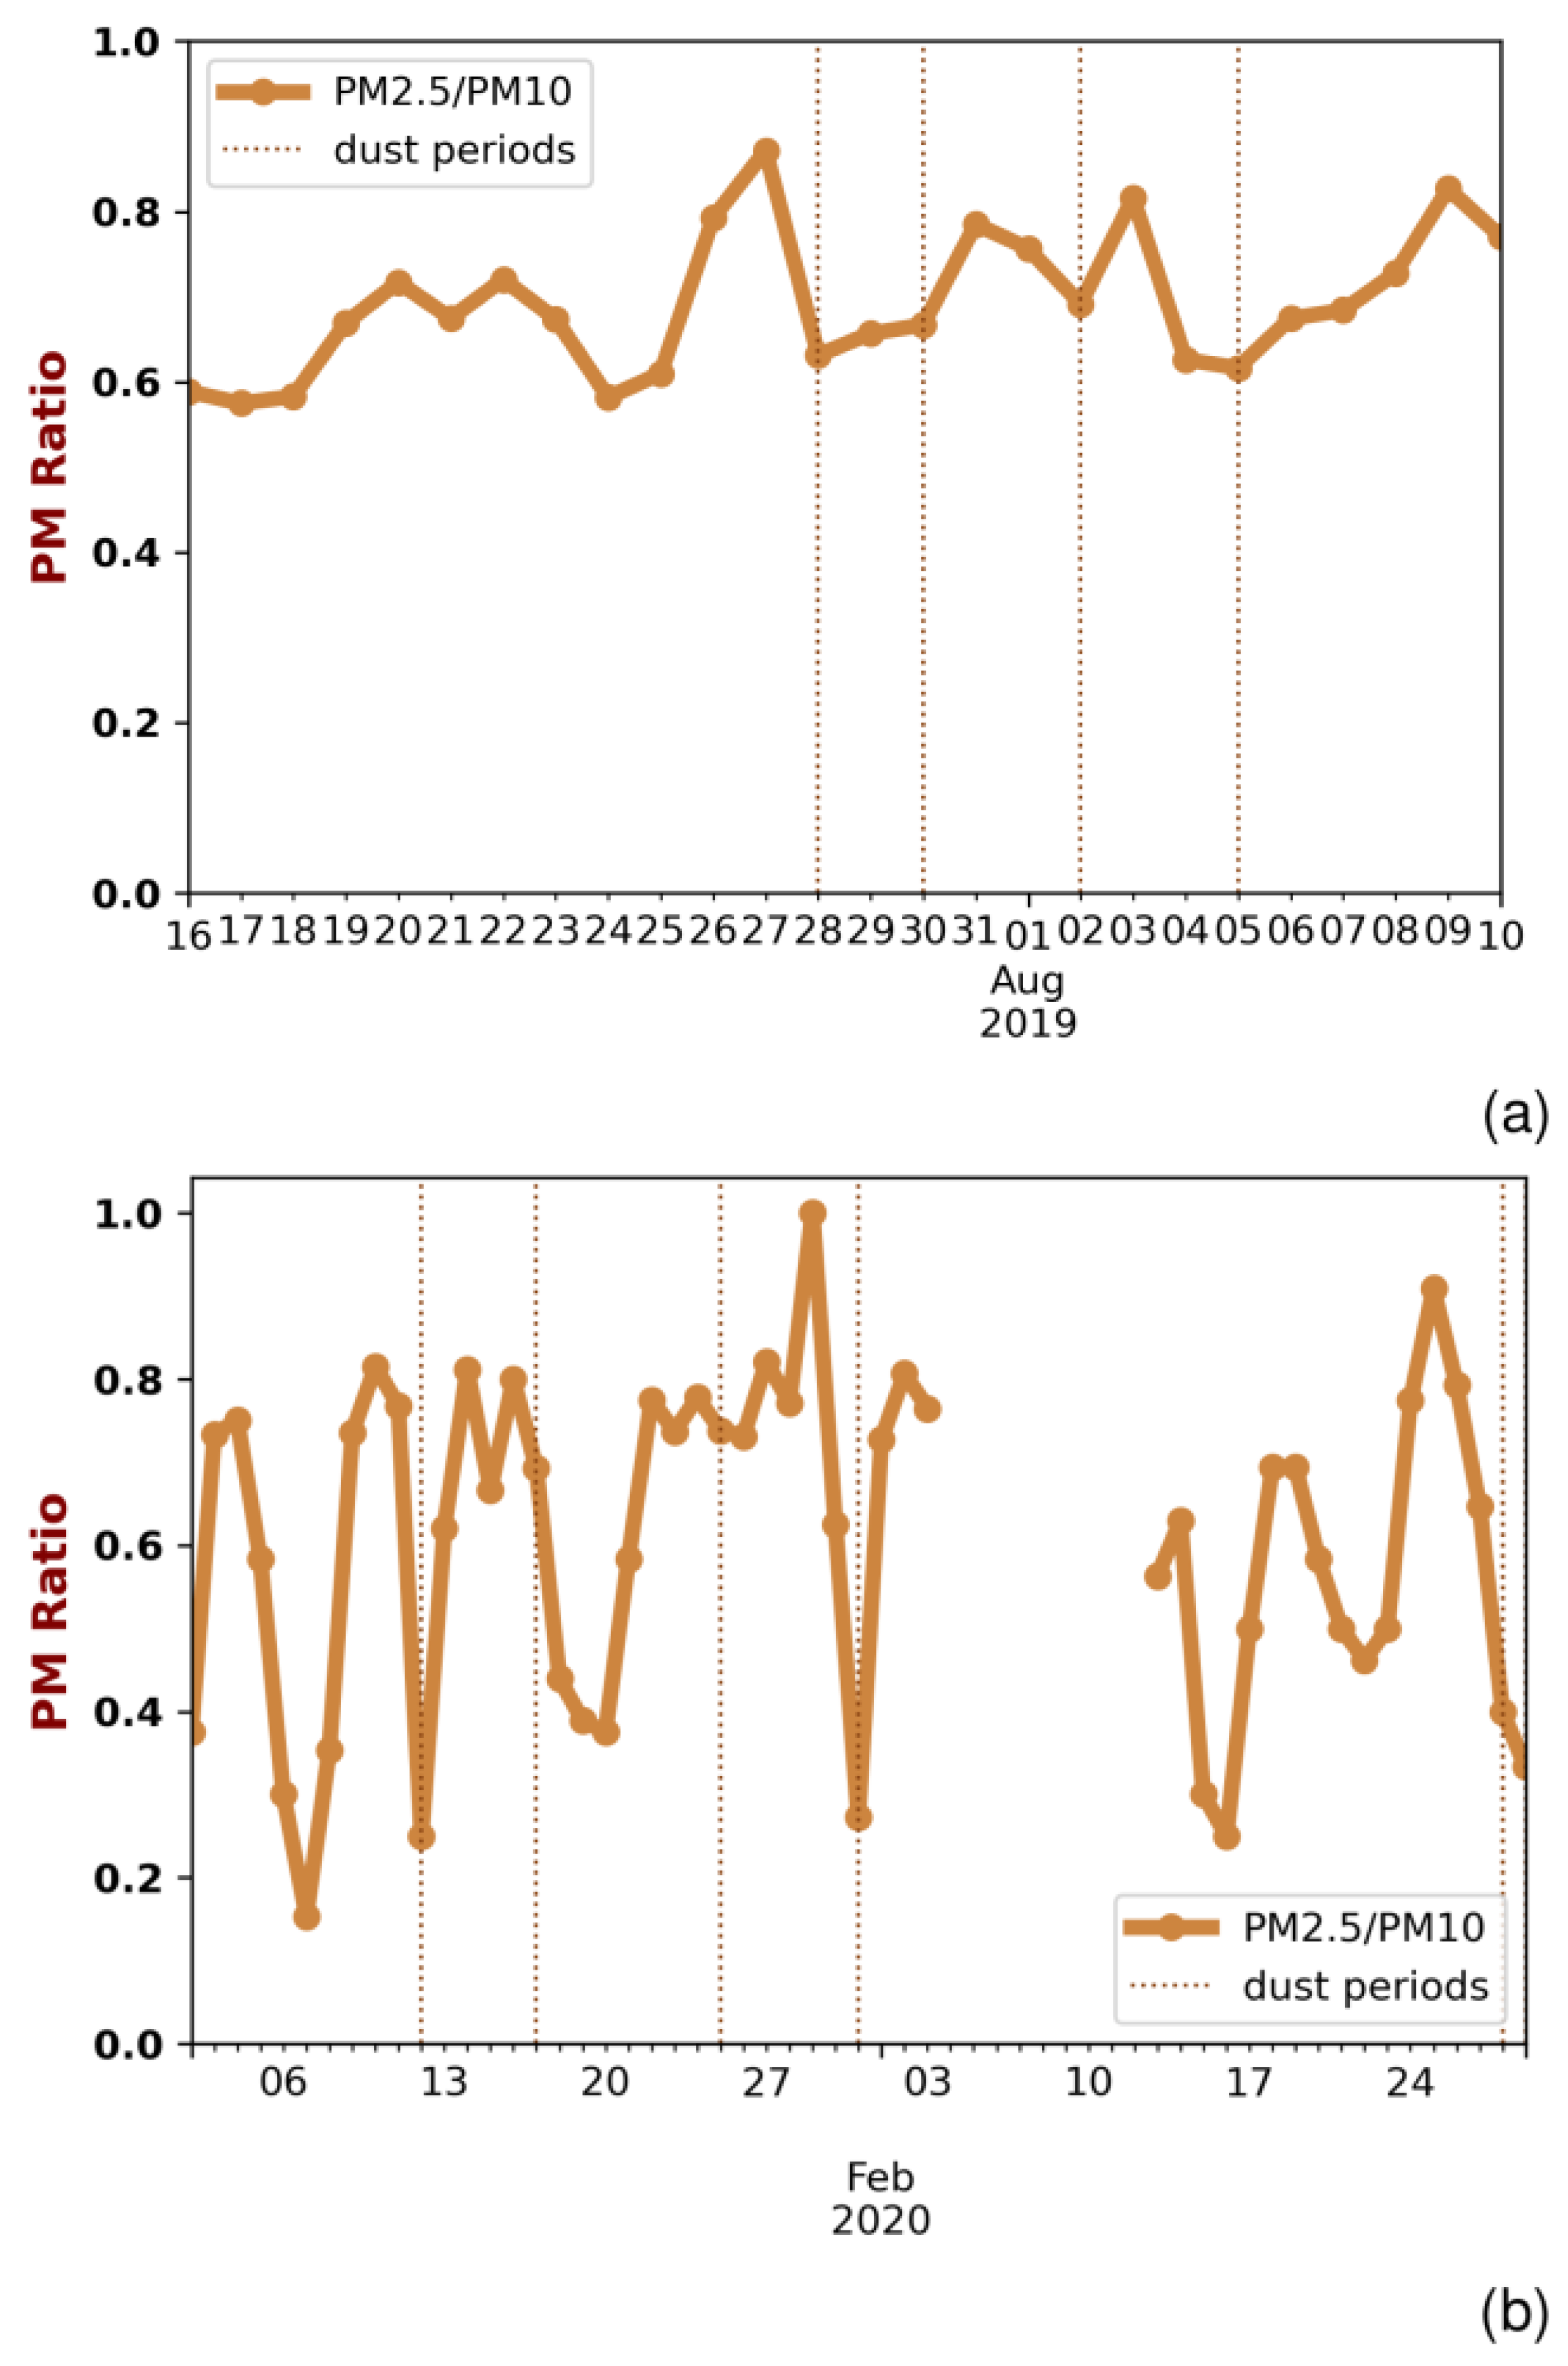
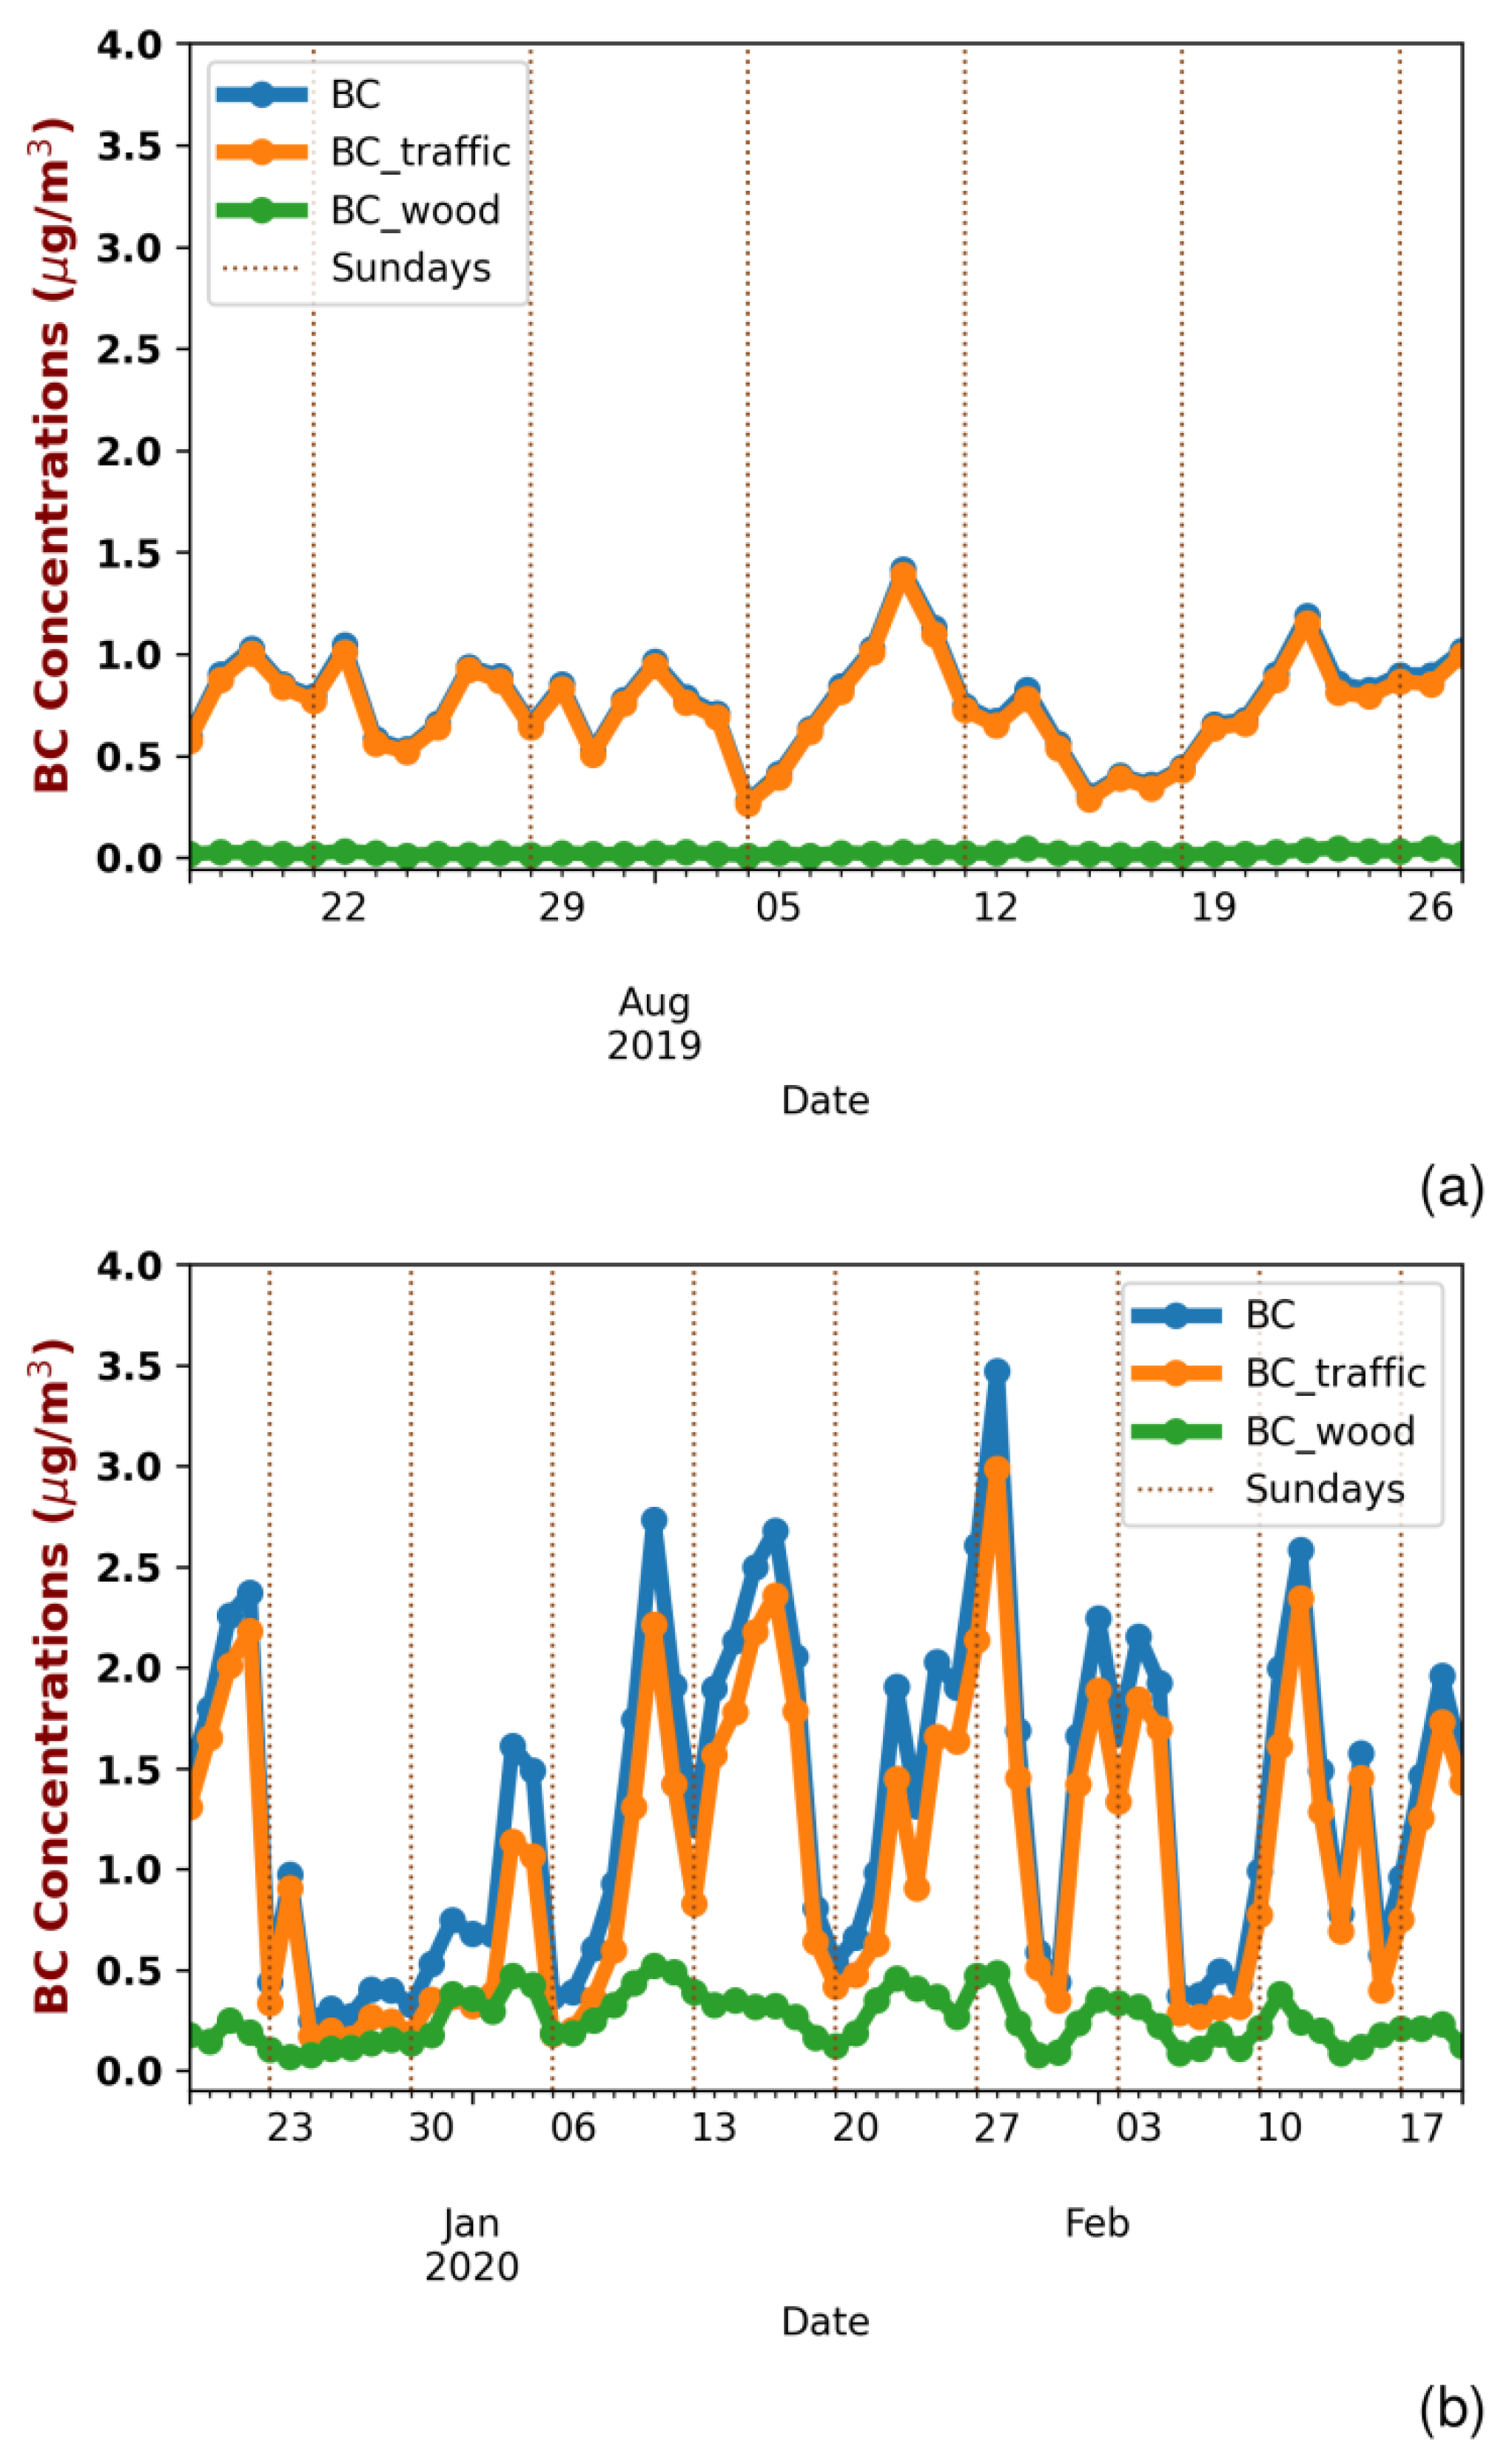
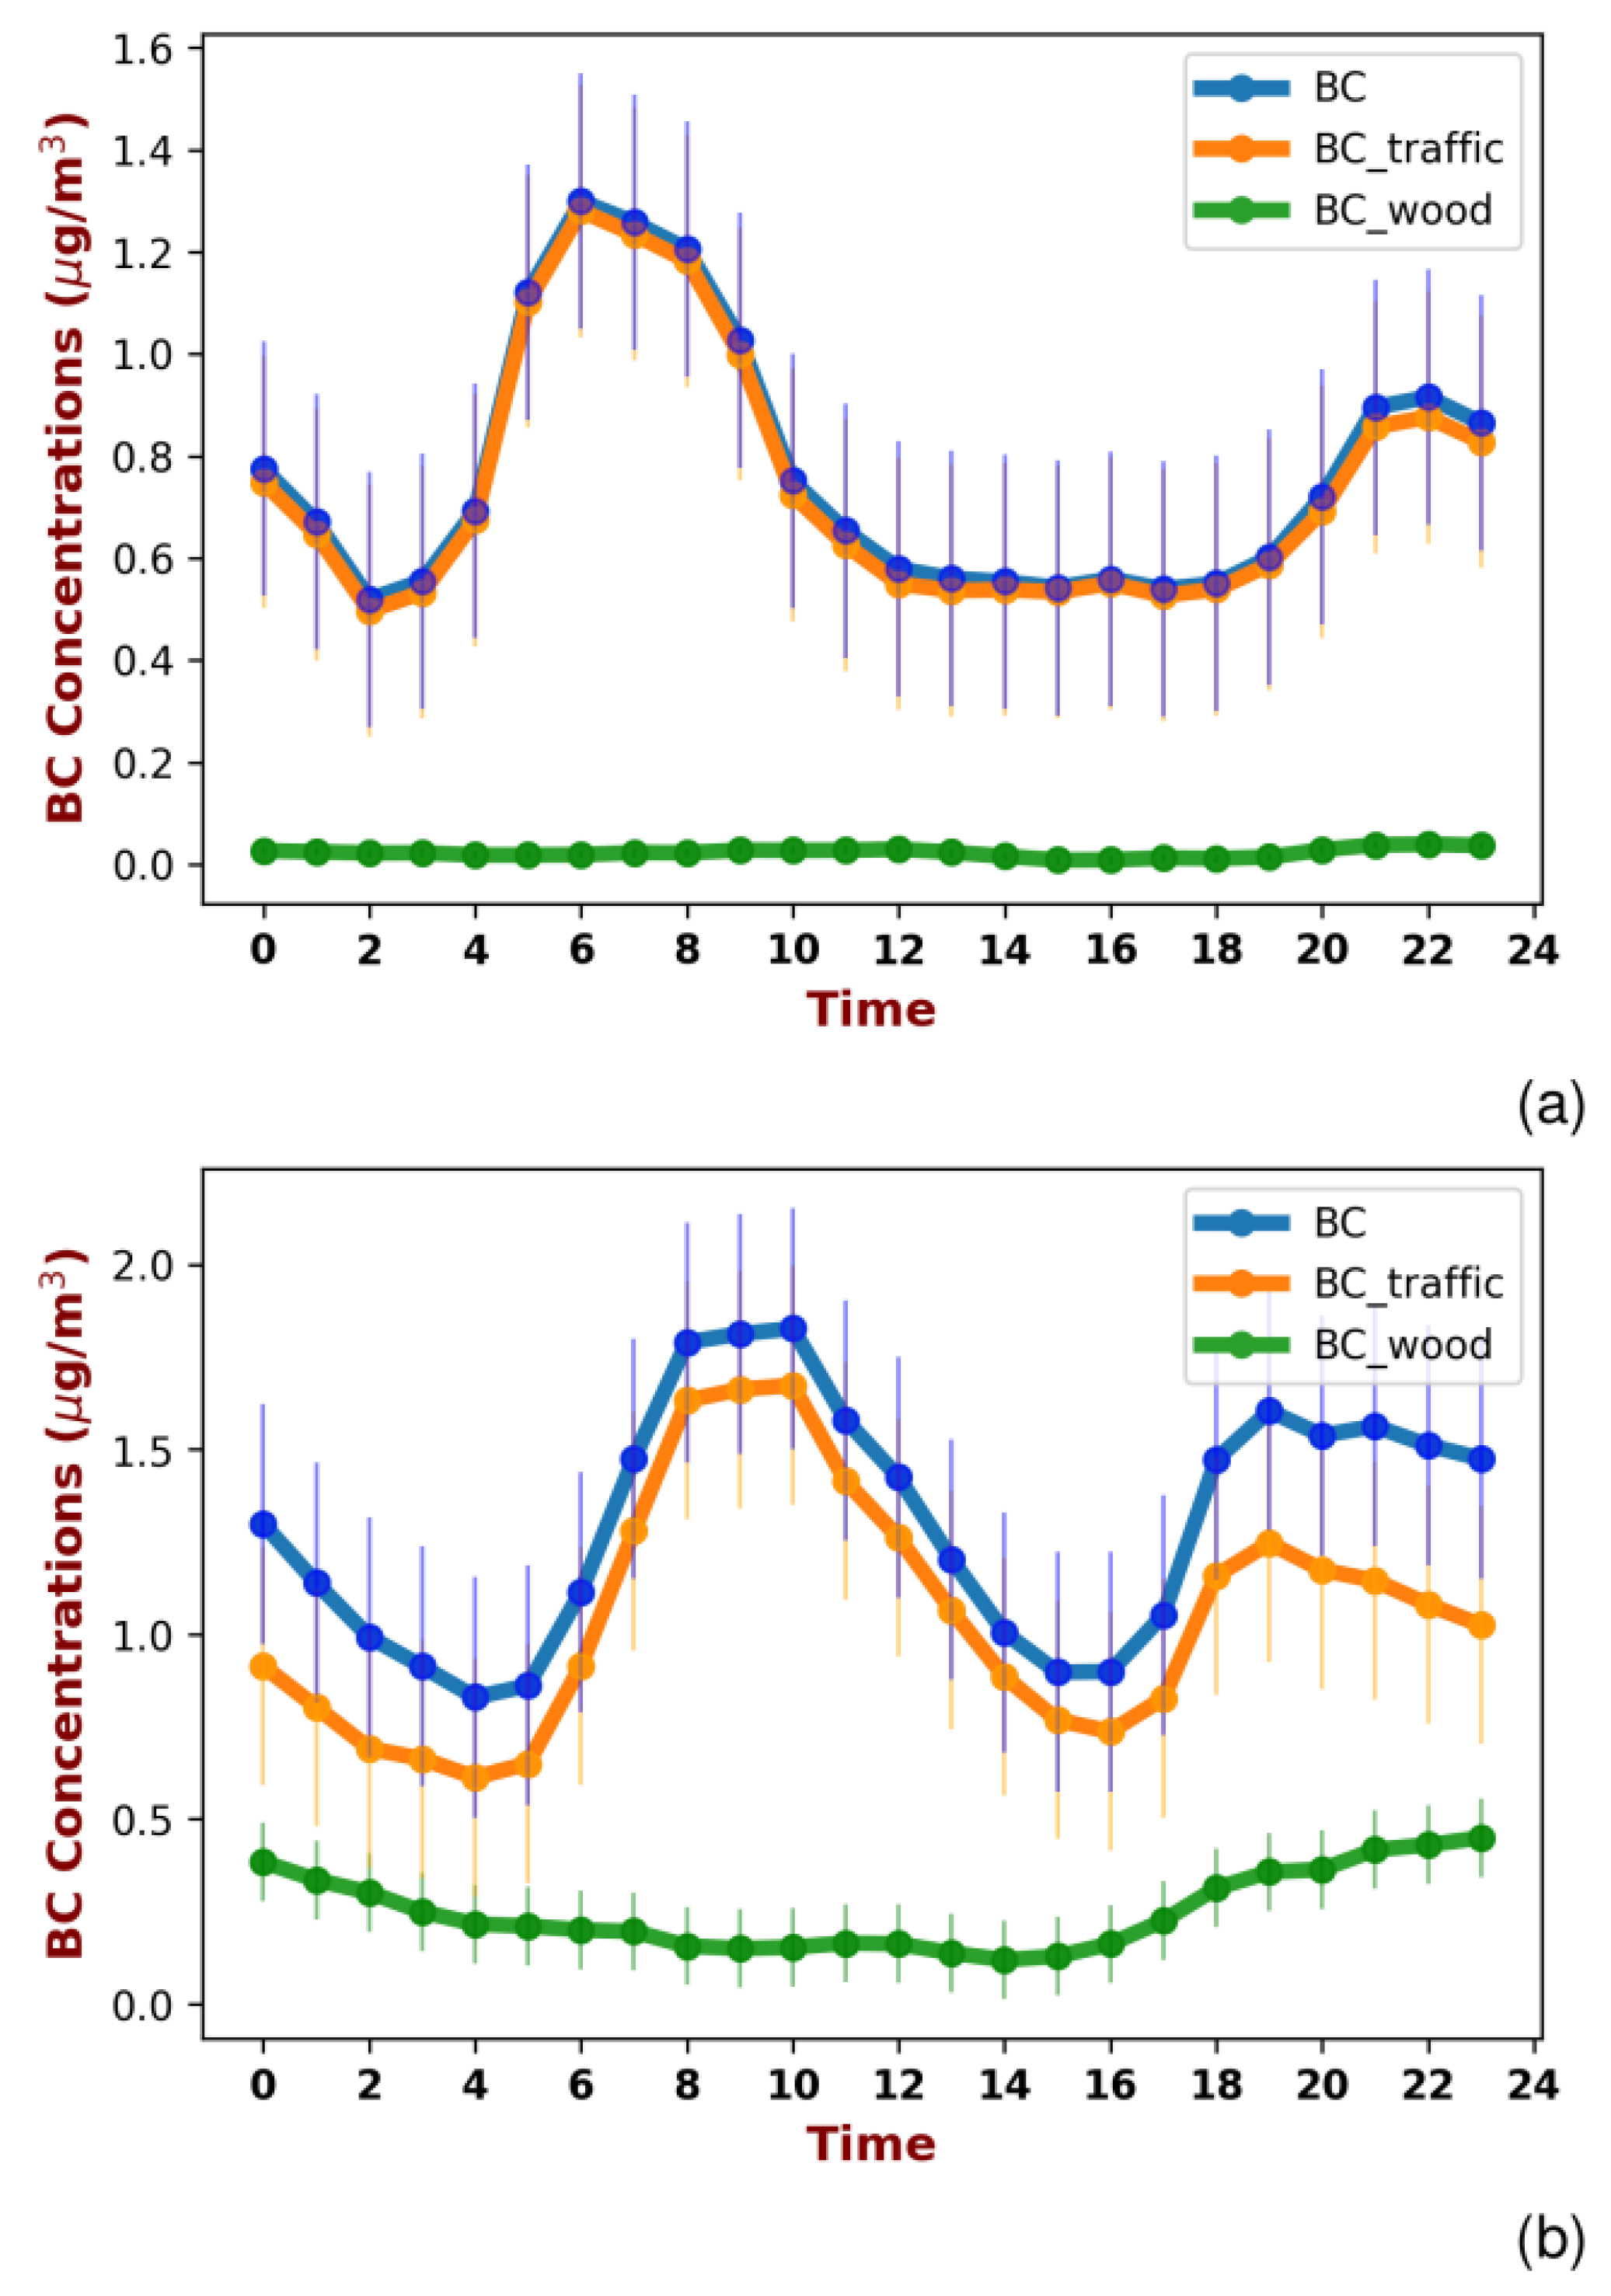
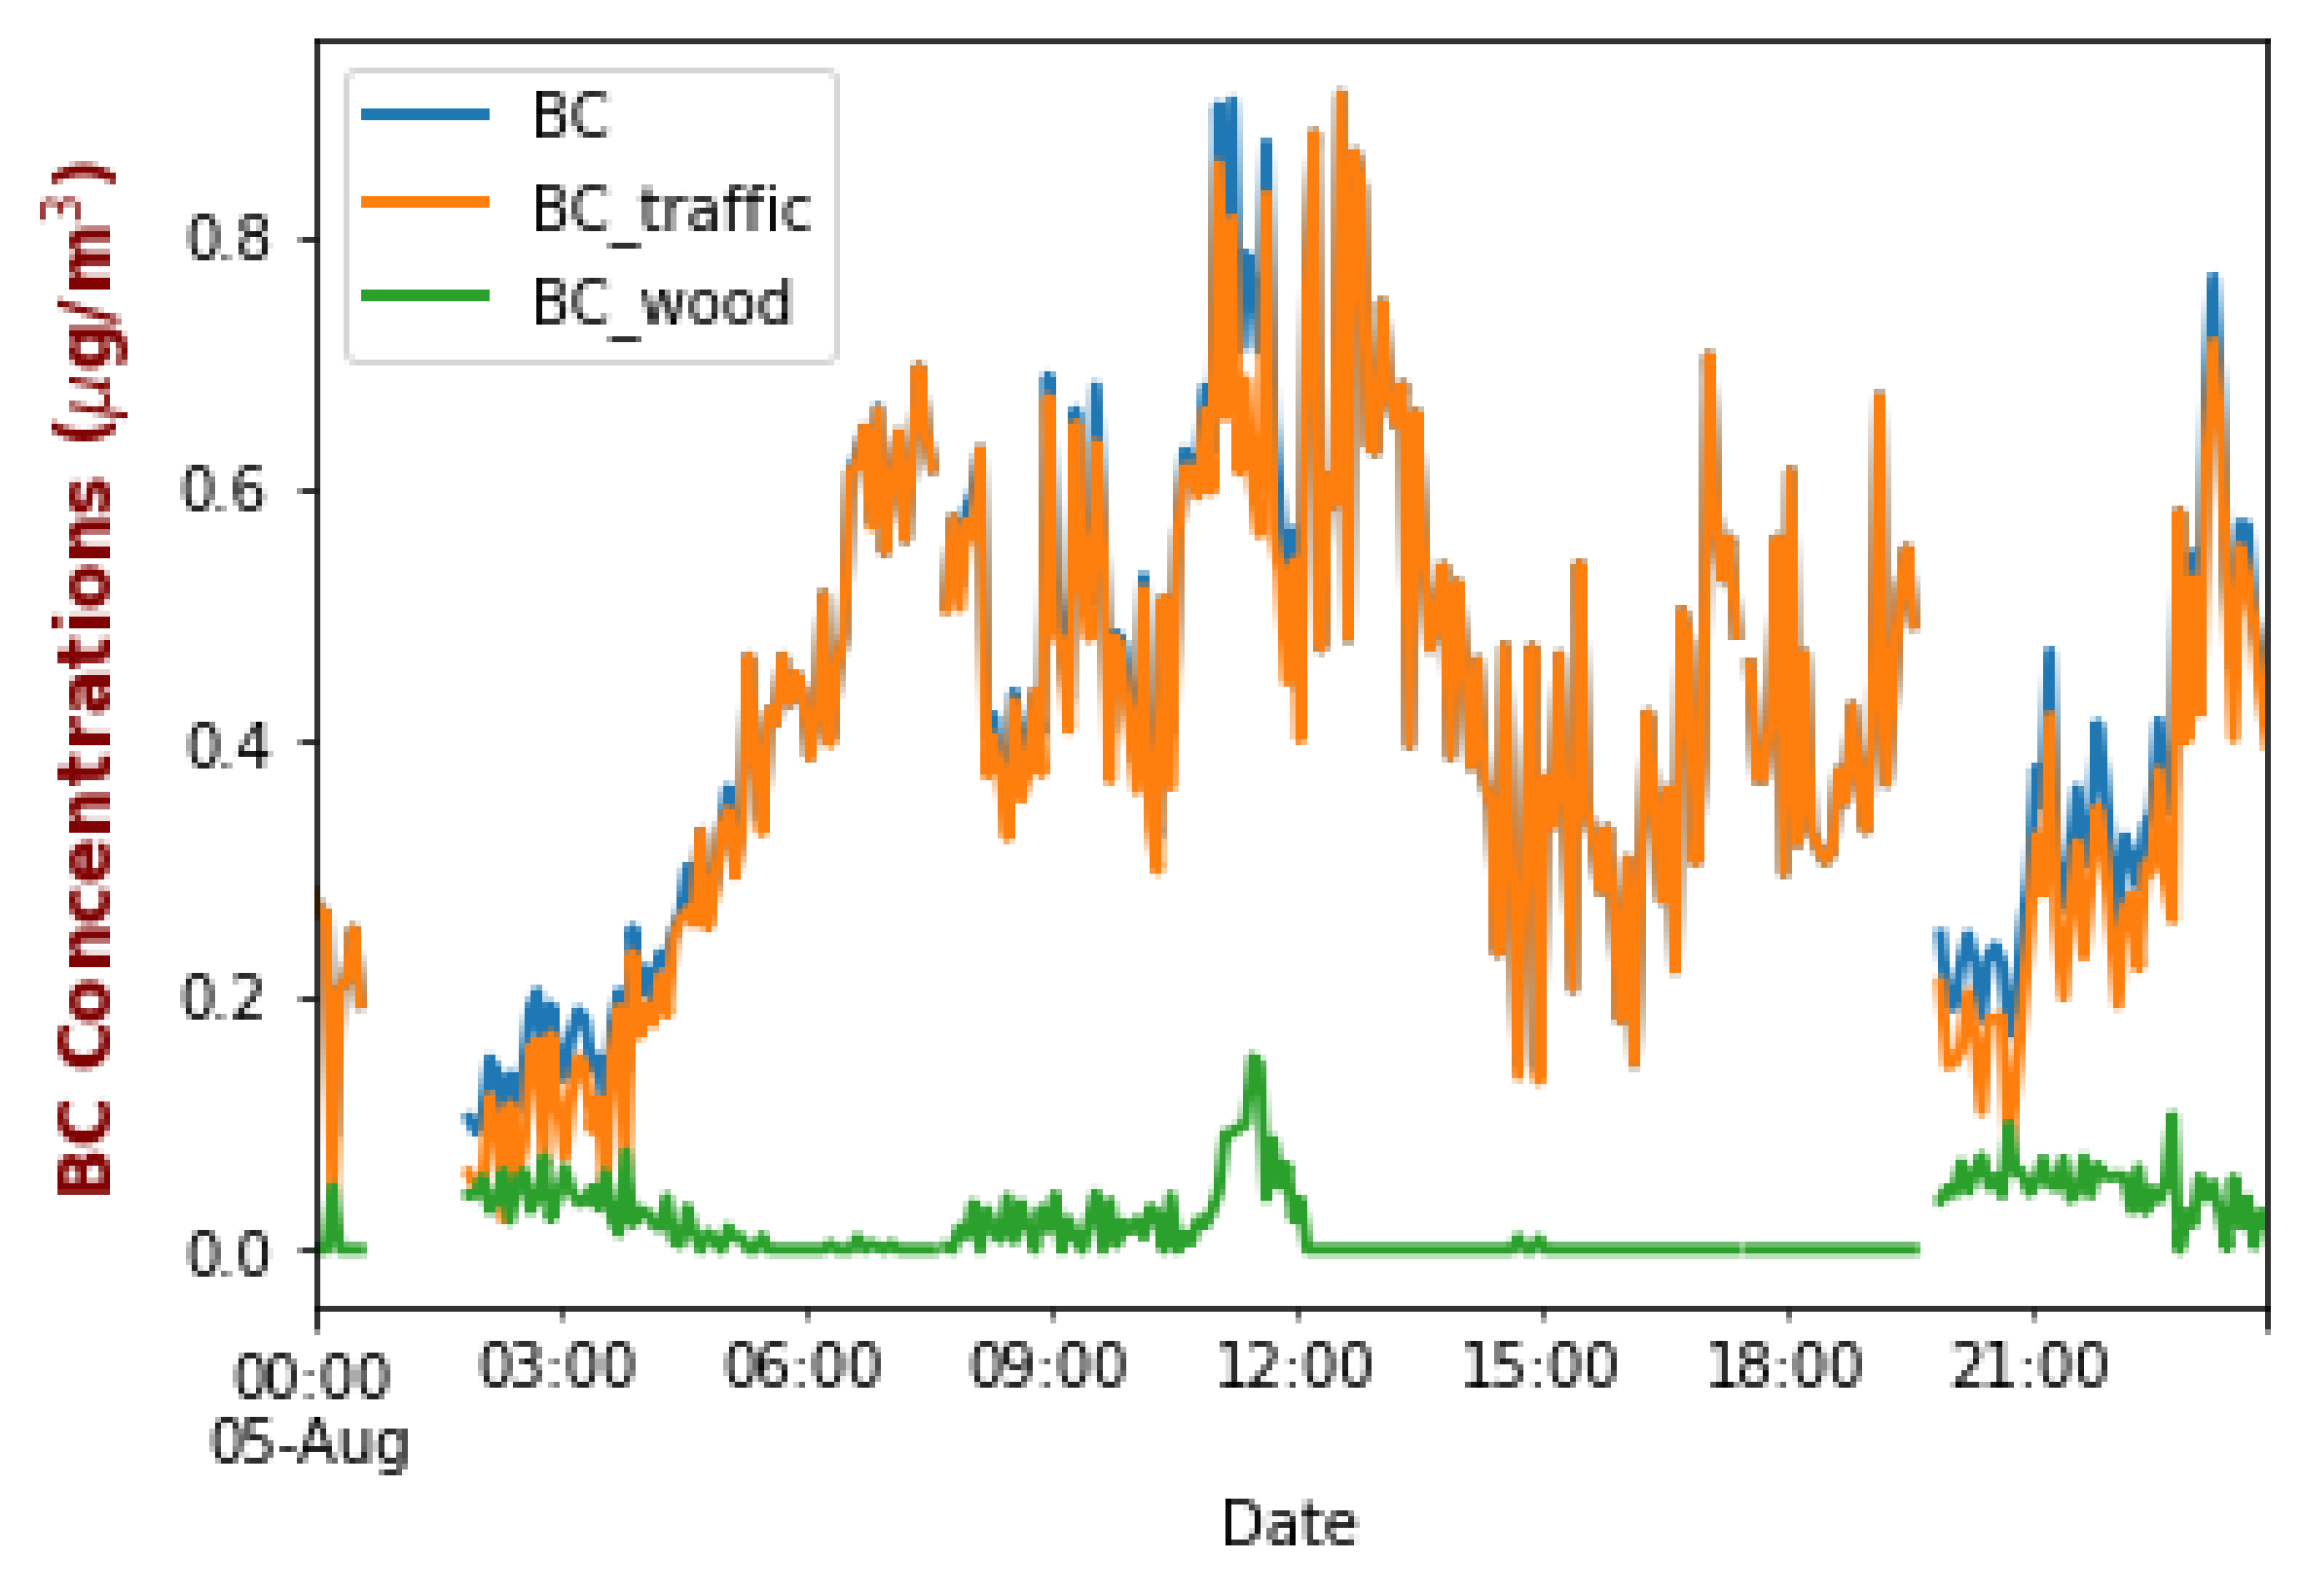
4.1. Surface Variability
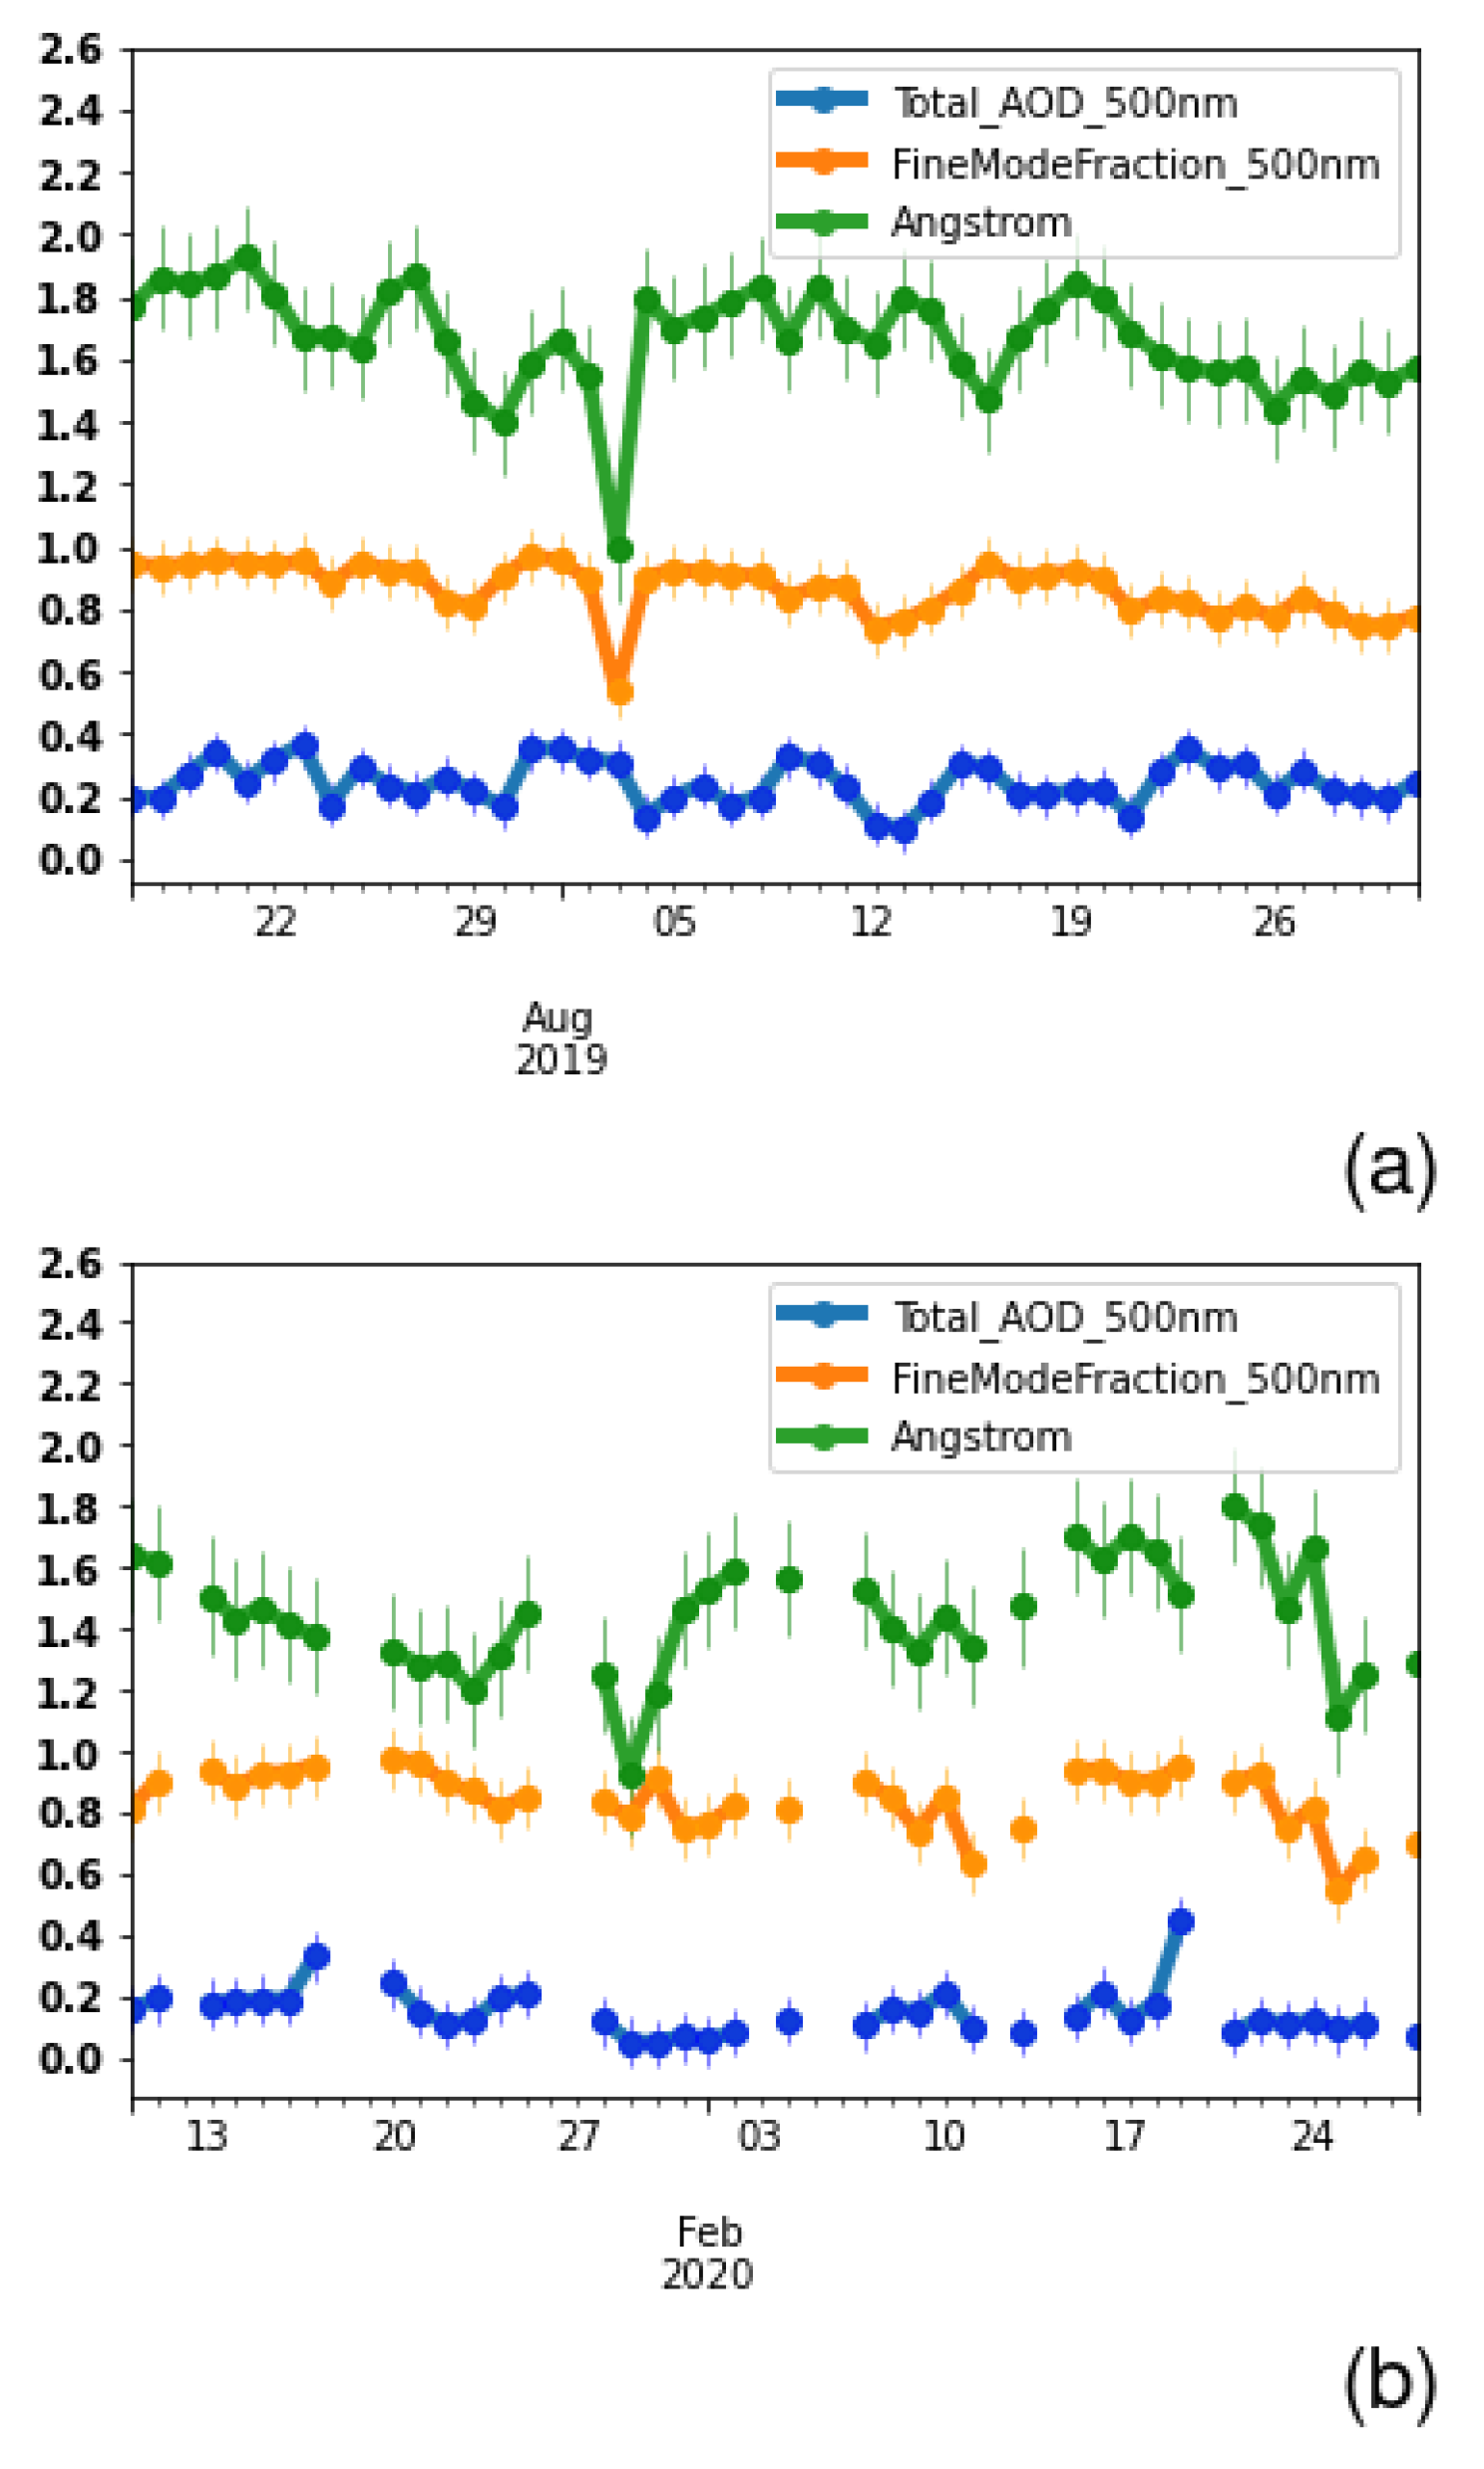
4.2. Columnar Variability
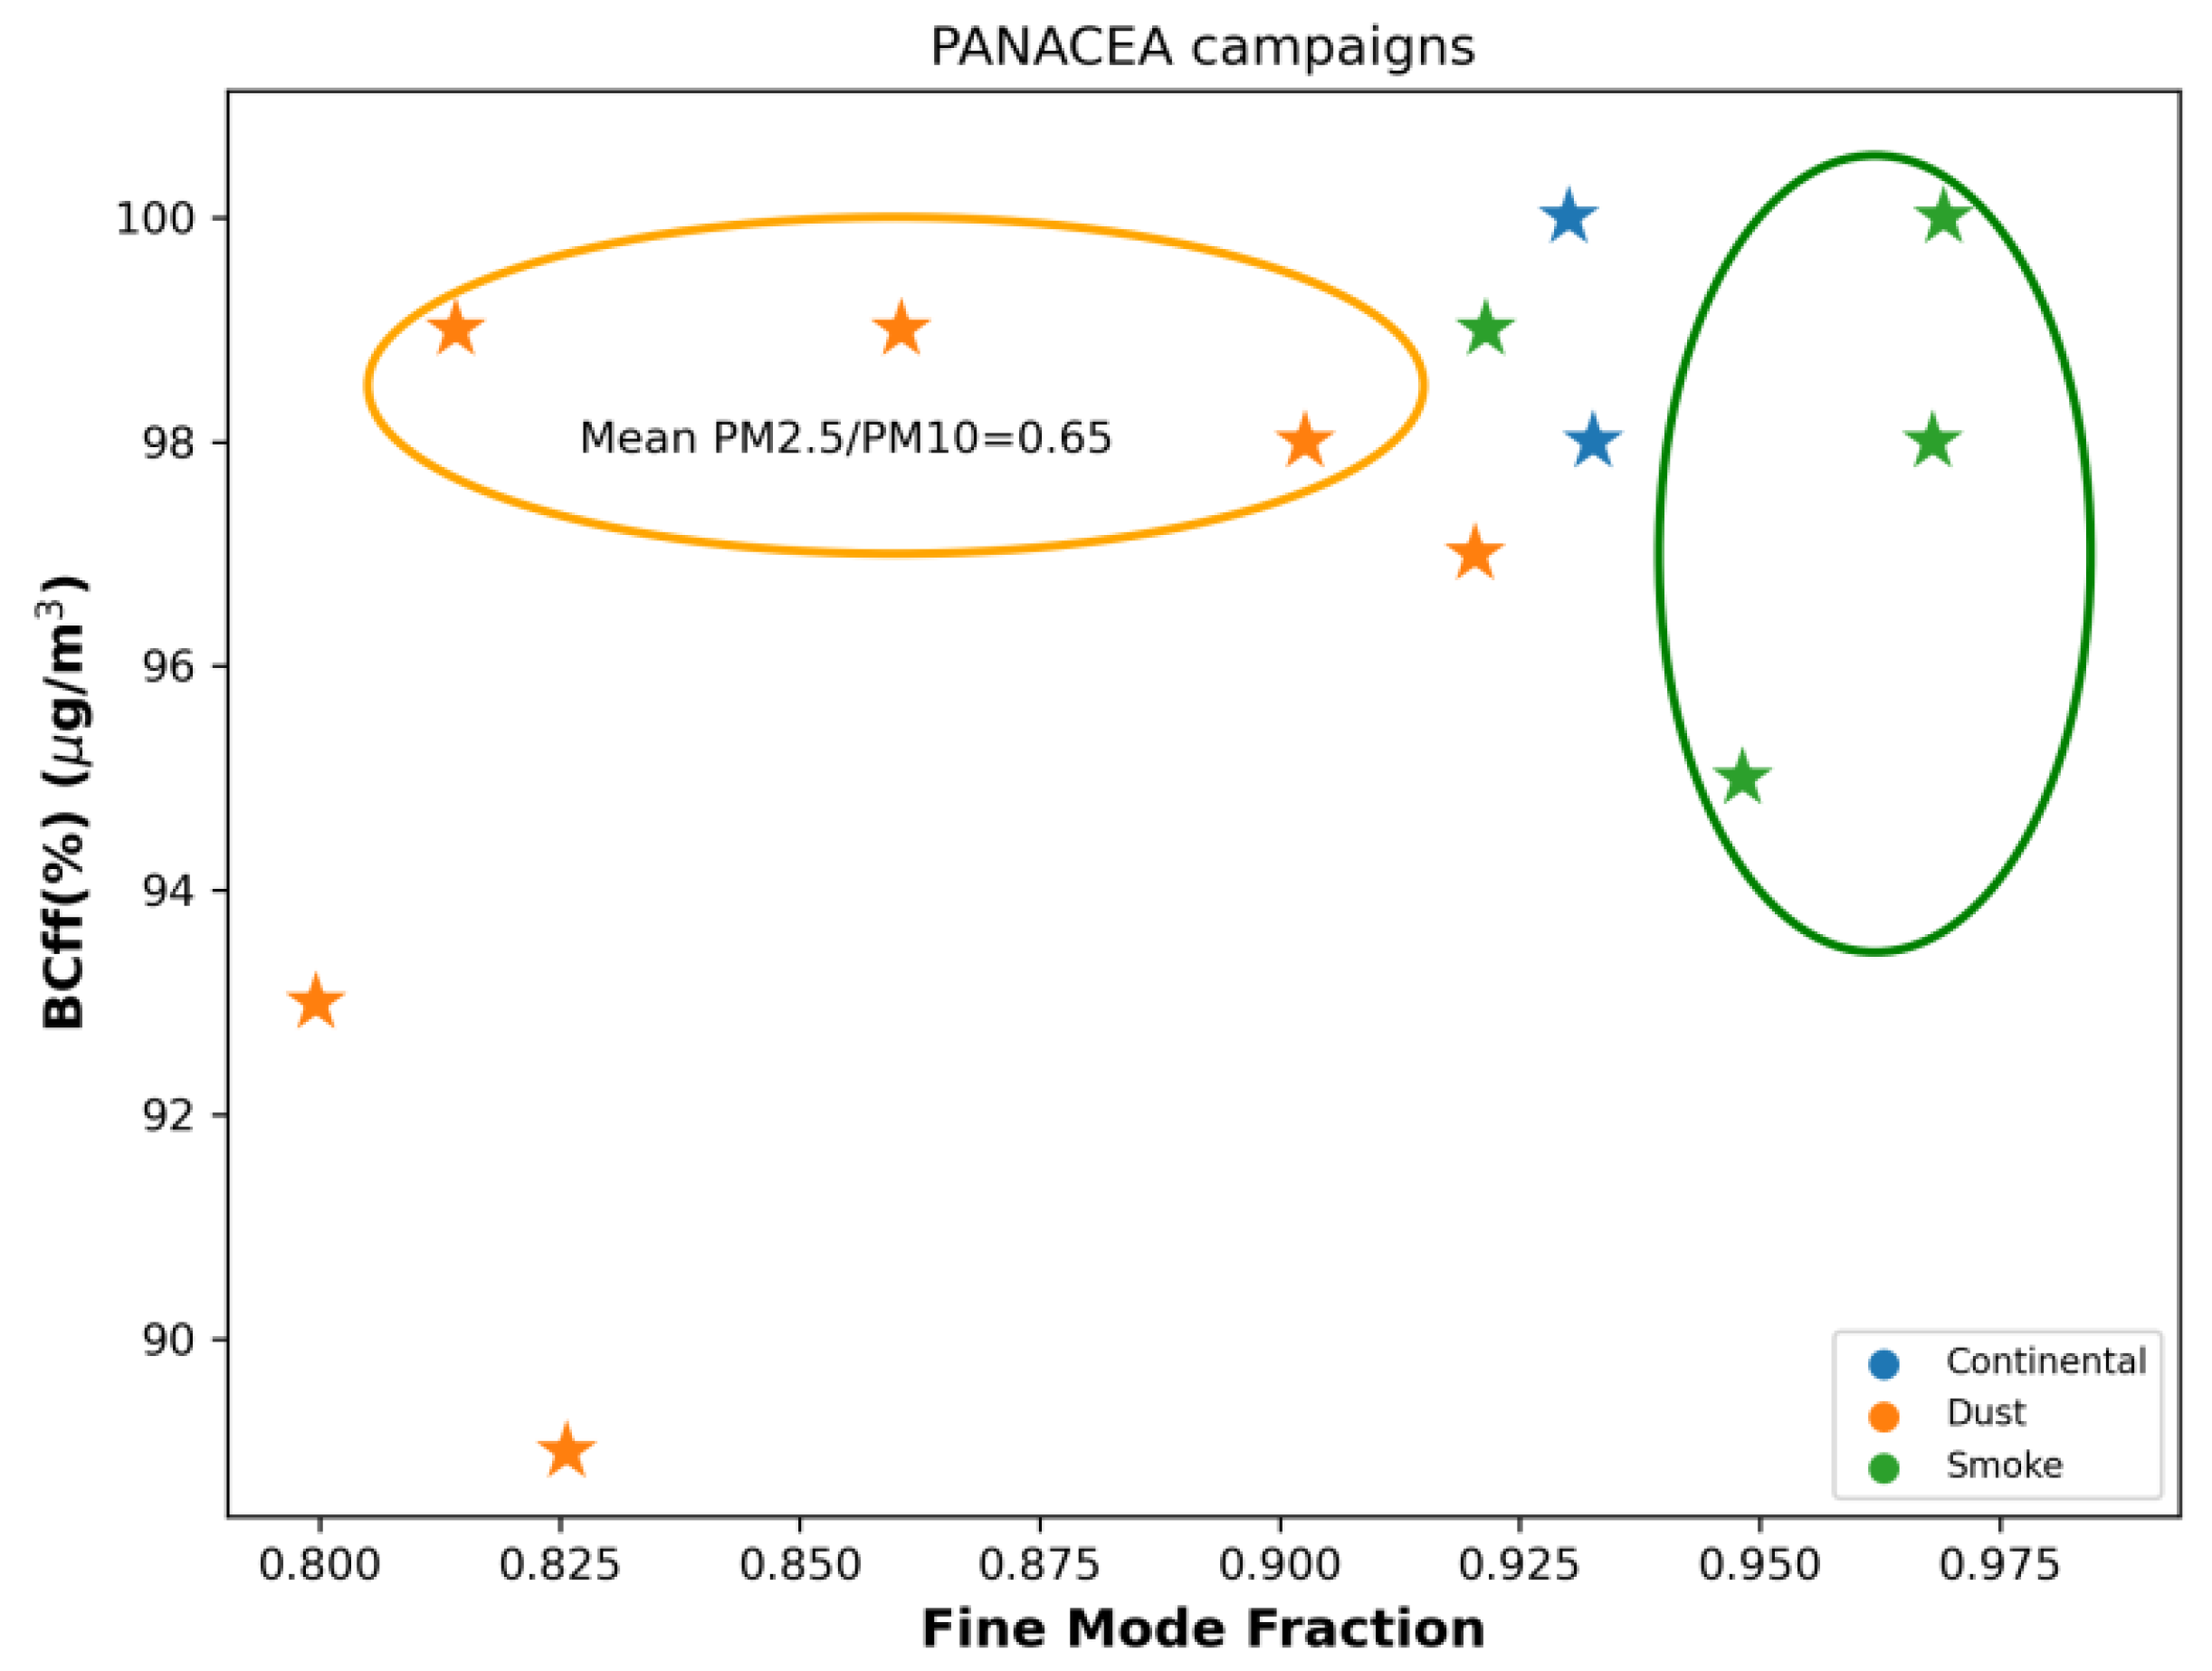
4.3. Aerosol Typing
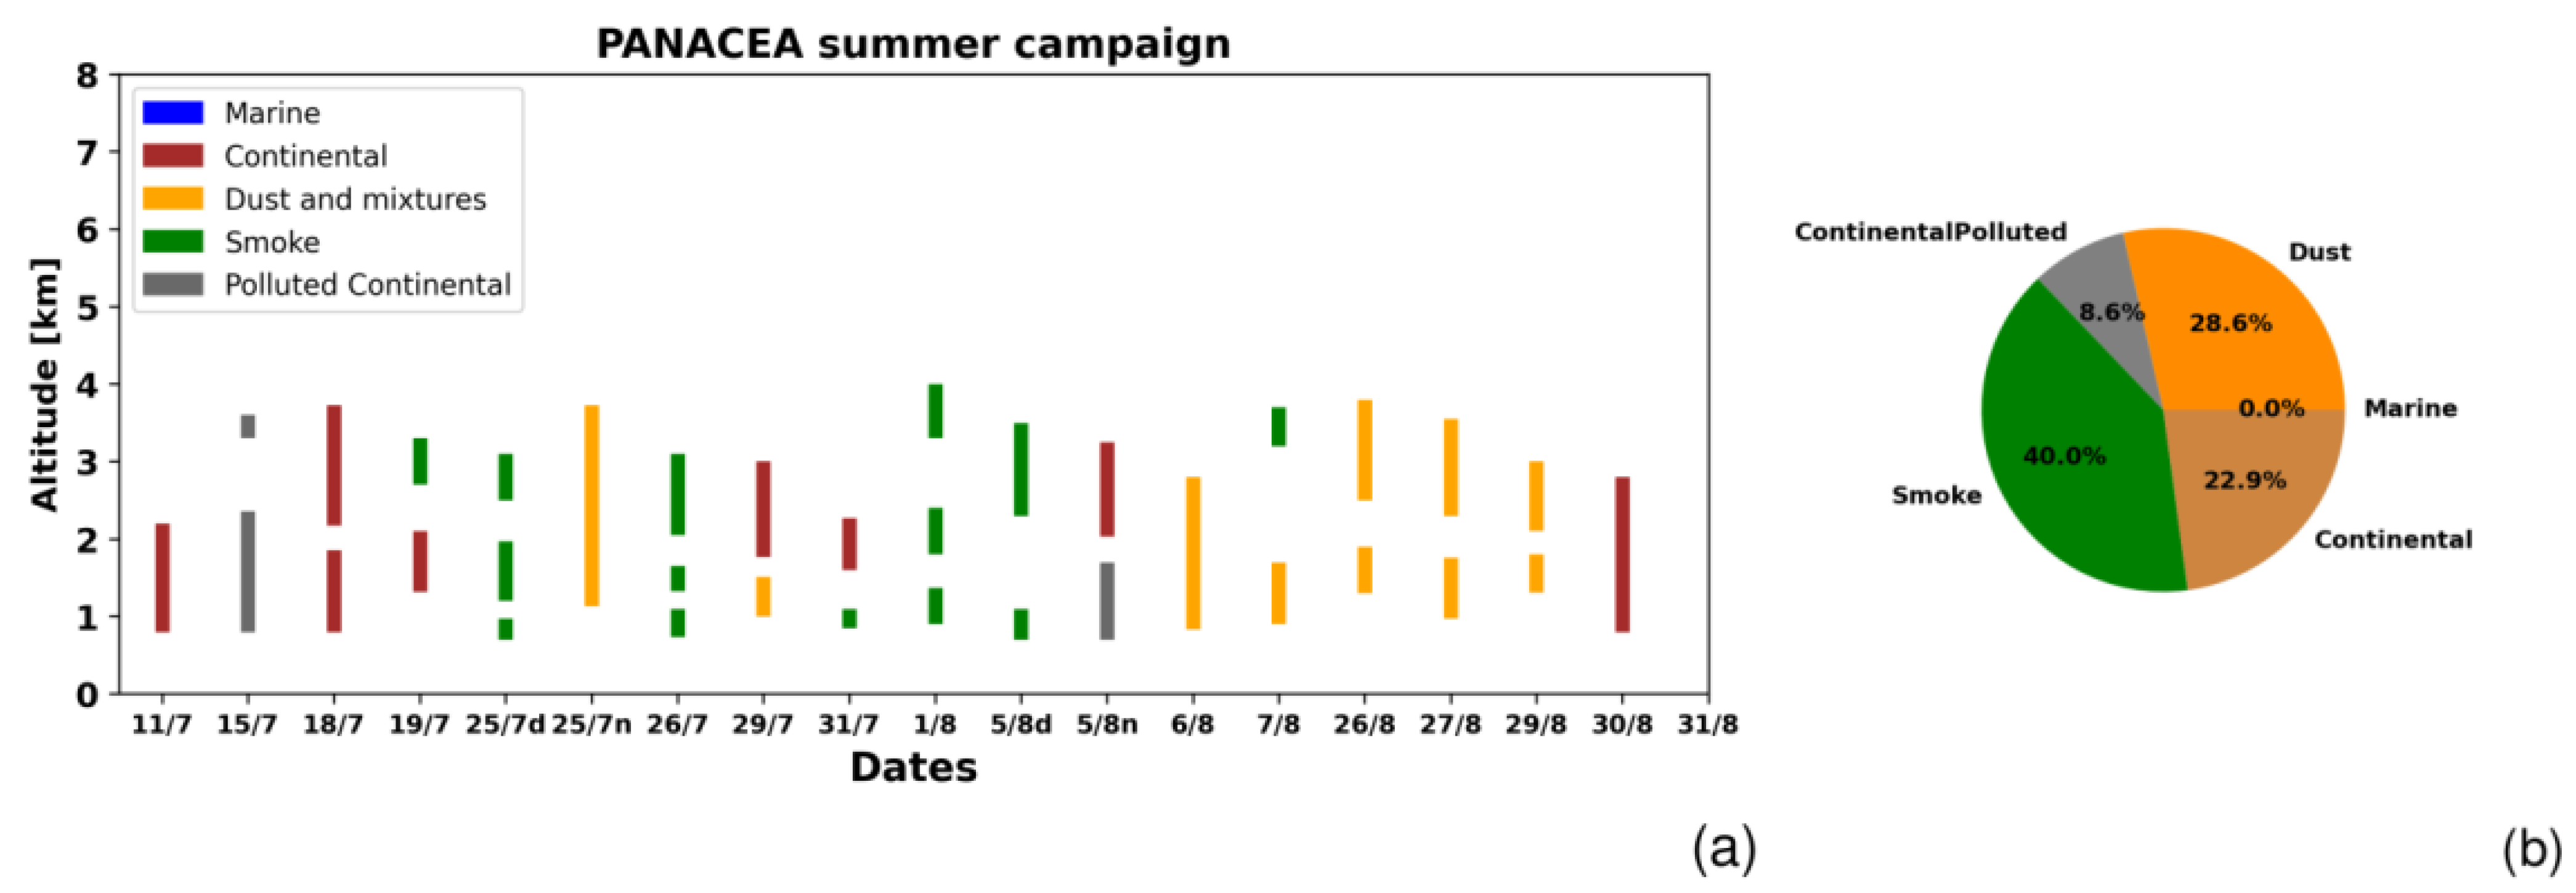
4.3.1. Dominant Aerosol Types Observed over Thessaloniki during the Summer and Winter PANACEA Campaigns
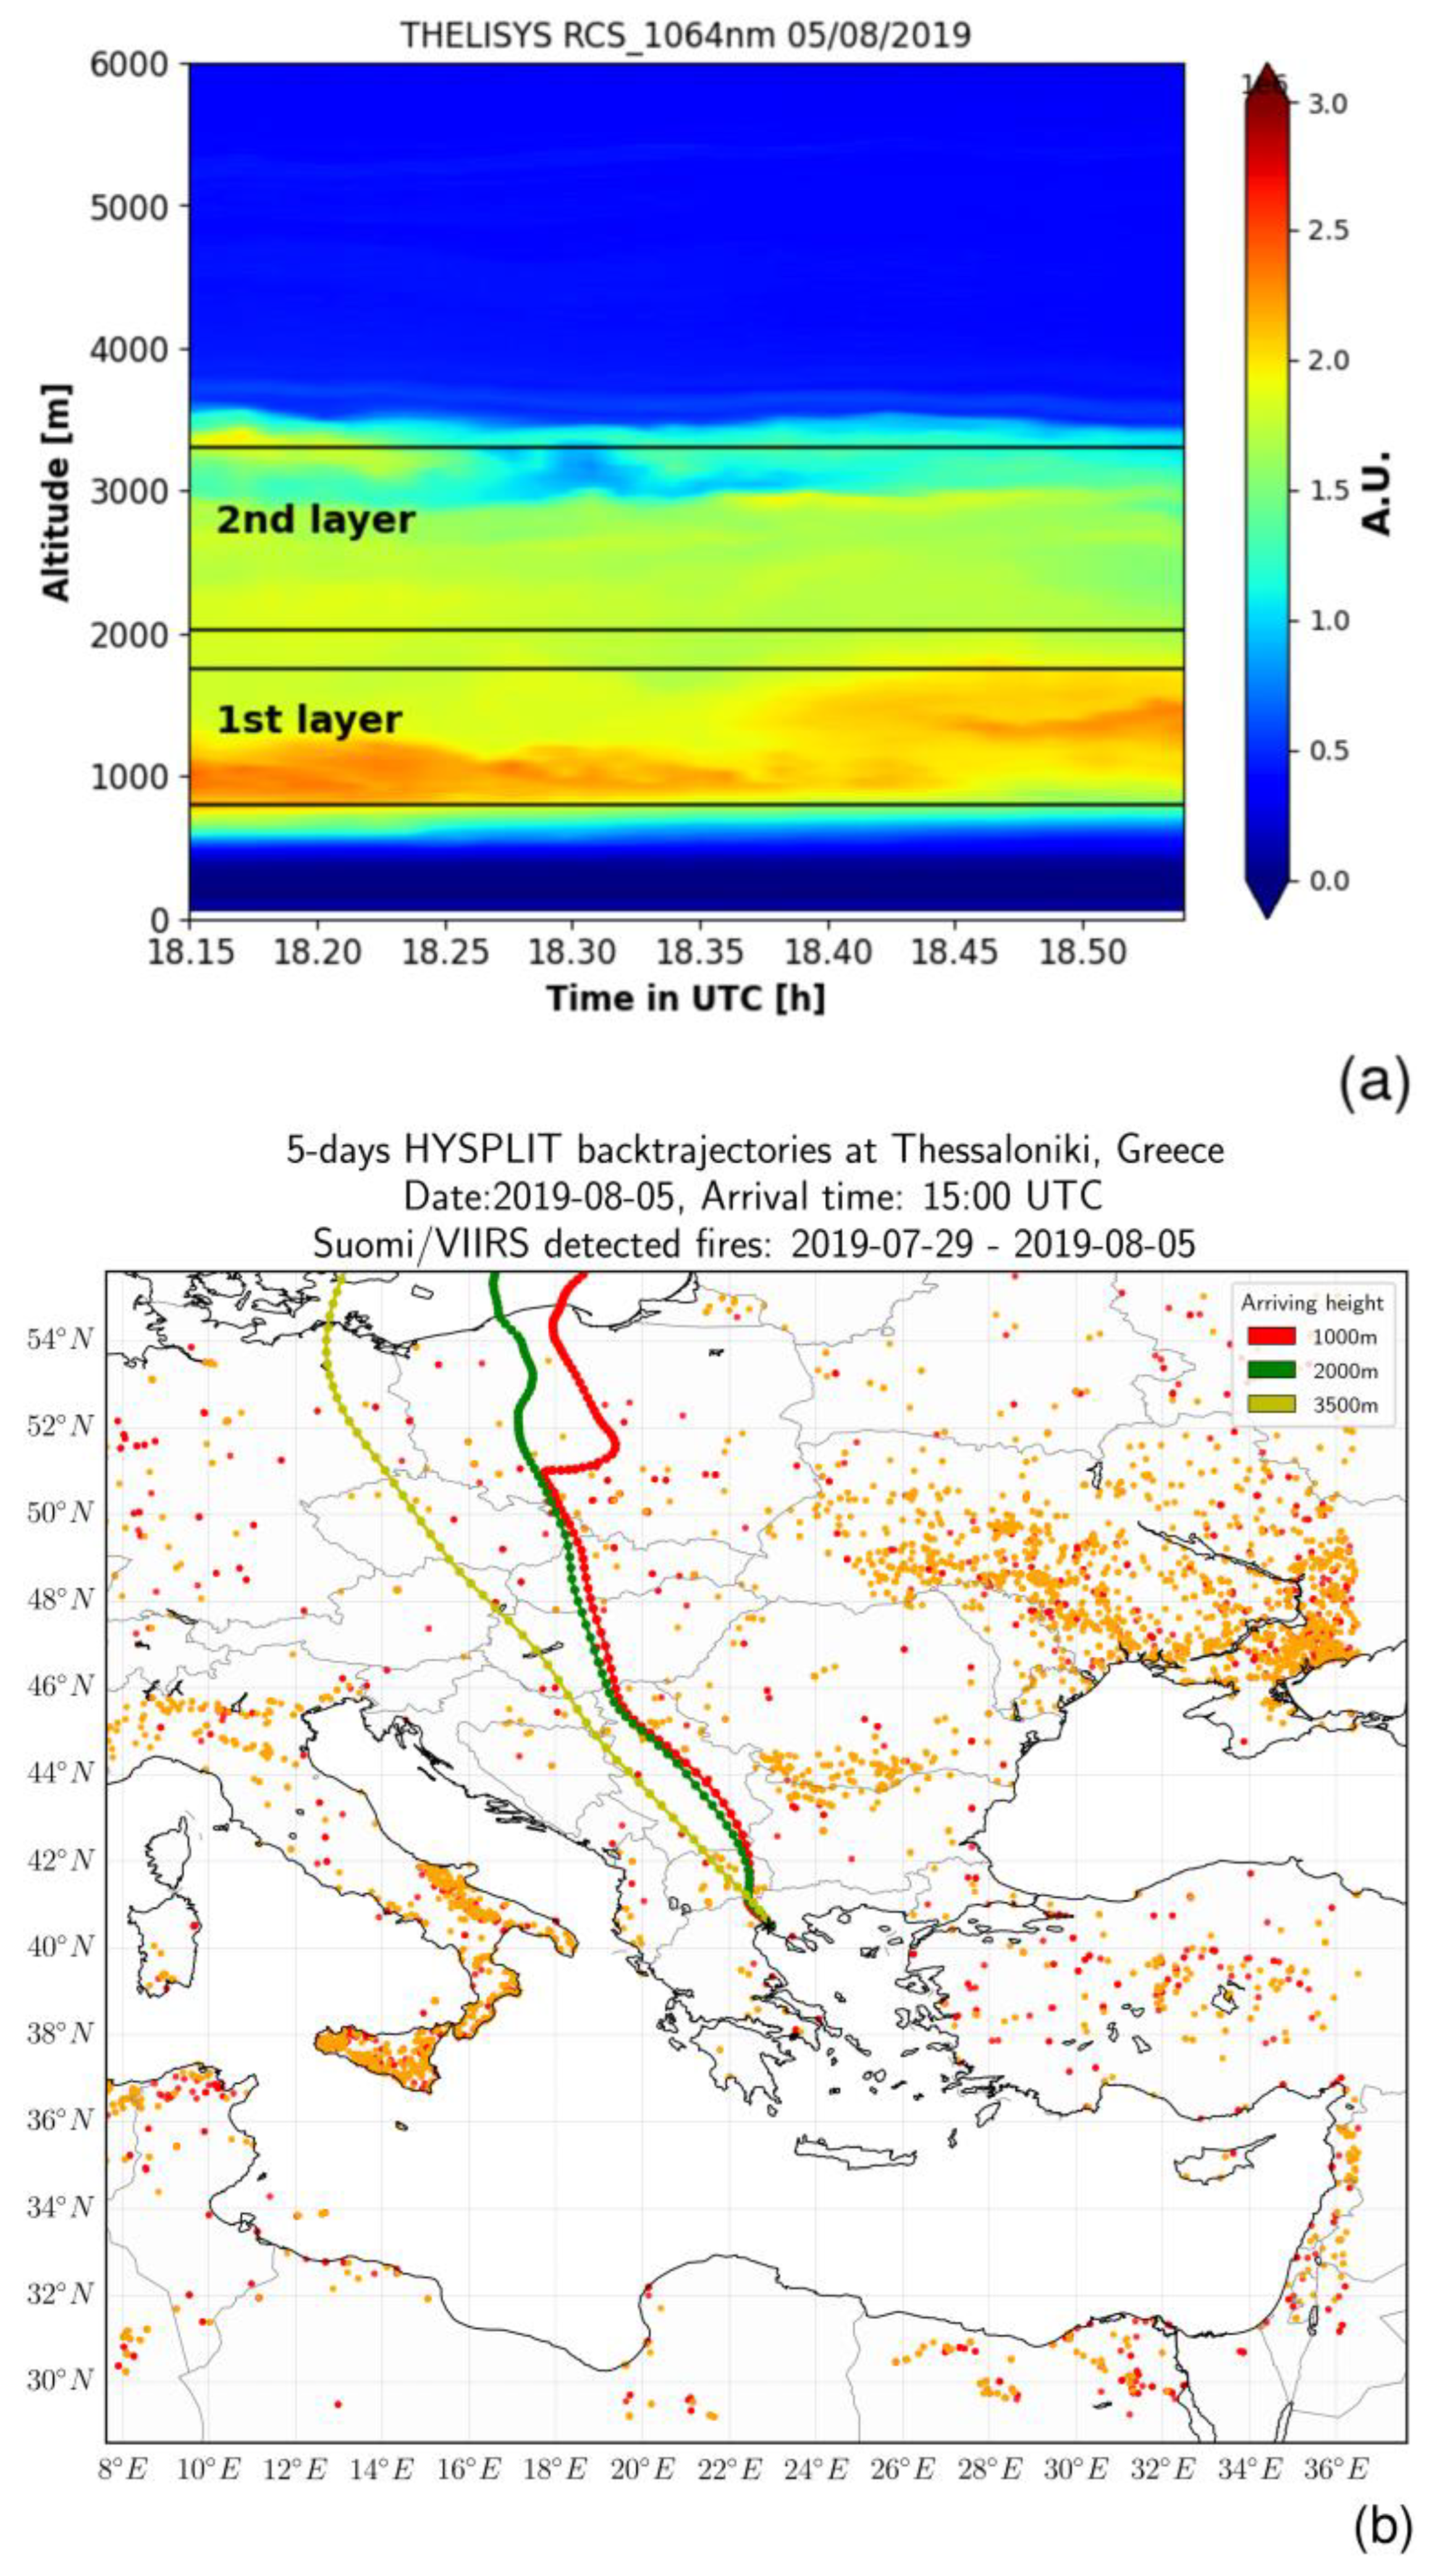
4.3.2. Nighttime Retrievals of Transported Pollution, on 5 of August 2019: Case Ι
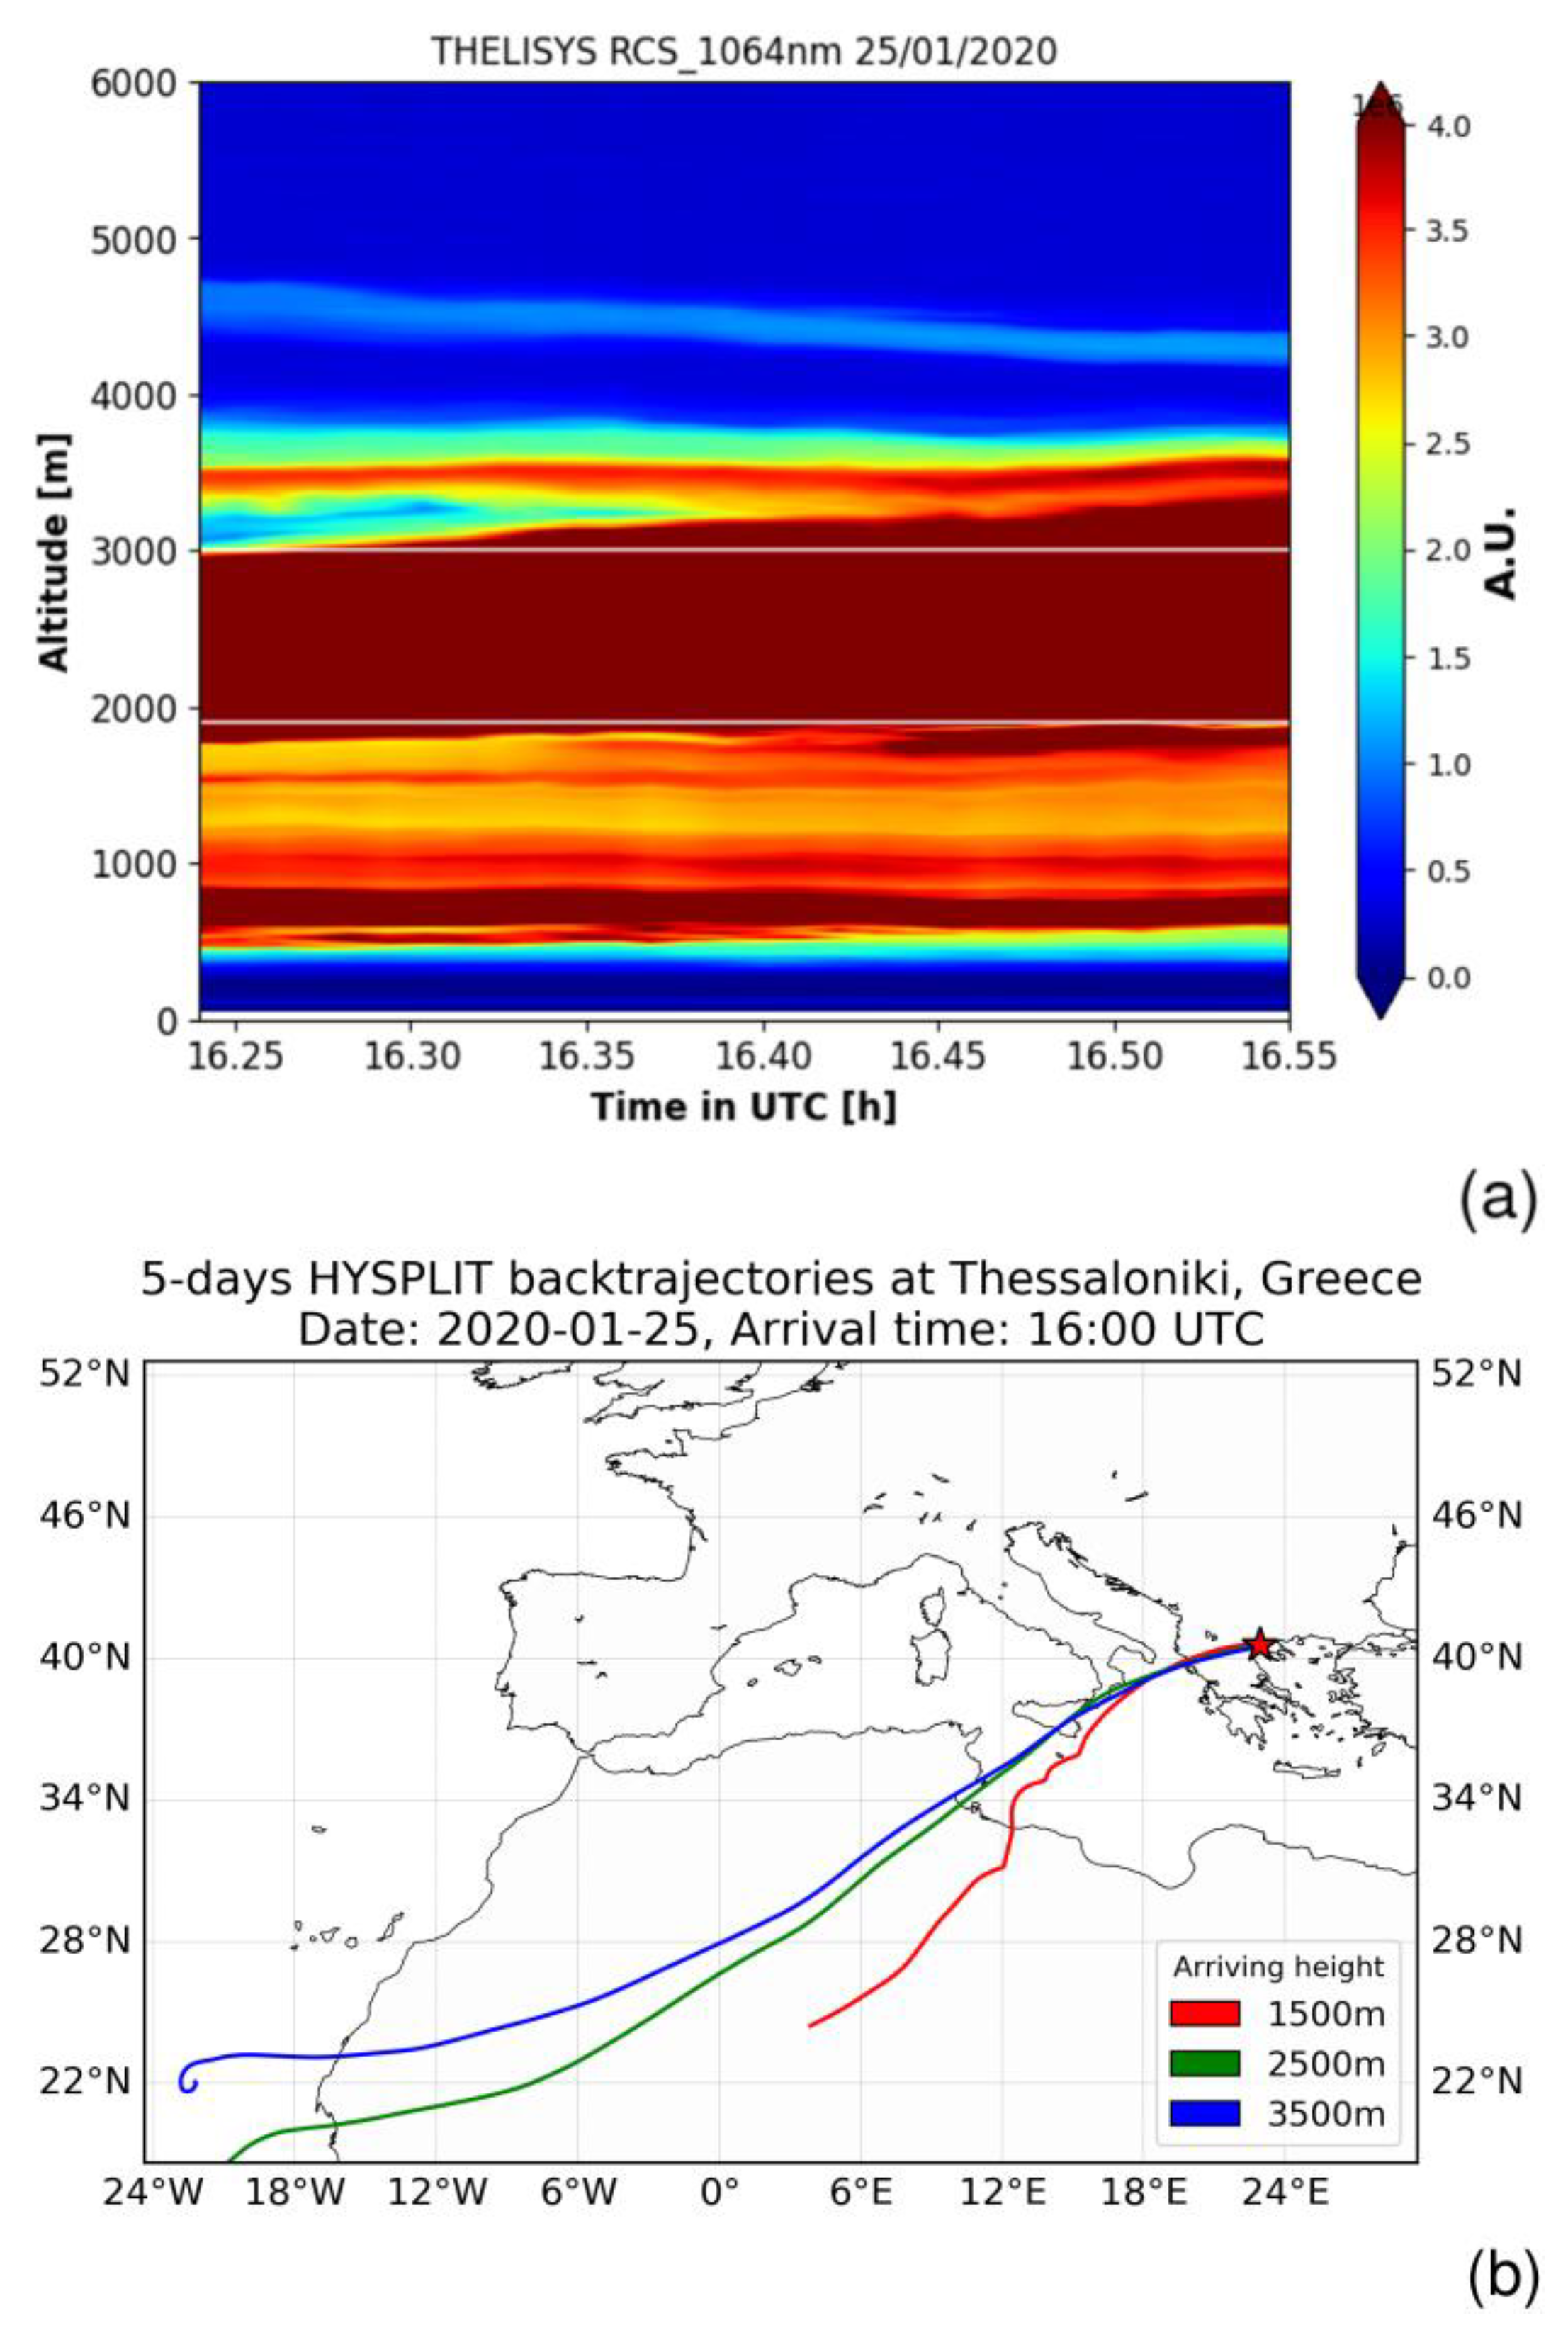
4.3.3. Daytime Retrievals of a Transported Dust Episode on 25 of January 2020: Case ΙI
5. Conclusions
Author Contributions
Funding
Data Availability Statement
Conflicts of Interest
References
- Seinfeld, J.H.; Bretherton, C.; Carslaw, K.S.; Coe, H.; DeMott, P.J.; Dunlea, E.J.; Feingold, G.; Ghan, S.; Guenther, A.B.; Kahn, R.; et al. Improving our fundamental understanding of the role of aerosol-cloud interactions in the climate system. Proc. Natl. Acad. Sci. USA 2016, 113, 5781–5790. [Google Scholar] [CrossRef] [PubMed] [Green Version]
- Marinescu, P.J.; van den Heever, S.; Saleeby, S.M.; Kreidenweis, S.M.; DeMott, P.J. The microphysical roles of lower-tropospheric versus midtropospheric aerosol particles in mature-stage MCS precipitation. J. Atmos. Sci. 2017, 74, 3657–3678. [Google Scholar] [CrossRef]
- Fuzzi, S.; Baltensperger, U.; Carslaw, K.; Decesari, S.; Van Der Gon, H.D.; Facchini, M.C.; Fowler, D.; Koren, I.; Langford, B.; Lohmann, U.; et al. Particulate matter, air quality and climate: Lessons learned and future needs. Atmos. Chem. Phys. 2015, 15, 8217–8299. [Google Scholar] [CrossRef] [Green Version]
- Mahowald, N.M.; Scanza, R.; Brahney, J.; Goodale, C.L.; Hess, P.G.; Moore, J.K.; Neff, J. Aerosol Deposition Impacts on Land and Ocean Carbon Cycles. Curr. Clim. Chang. Rep. 2017, 3, 16–31. [Google Scholar] [CrossRef] [Green Version]
- Trippetta, S.; Sabia, S.; Caggiano, R. Fine aerosol particles (PM1): Natural and anthropogenic contributions and health risk assessment. Air Qual. Atmos. Health 2016, 9, 621–629. [Google Scholar] [CrossRef]
- Benavent-Oltra, J.A.; Casquero-Vera, J.A.; Román, R.; Lyamani, H.; Pérez-Ramírez, D.; Granados-Muñoz, M.J.; Herrera, M.; Cazorla, A.; Titos, G.; Ortiz-Amezcua, P.; et al. Overview of the SLOPE I and II campaigns: Aerosol properties retrieved with lidar and sun–sky photometer measurements. Atmos. Chem. Phys. 2021, 21, 9269–9287. [Google Scholar] [CrossRef]
- Lionello, P.; Scarascia, L. The relation between climate change in the Mediterranean region and global warming. Reg. Environ. Chang. 2018, 18, 1481–1493. [Google Scholar] [CrossRef]
- Zittis, G.; Hadjinicolaou, P.; Klangidou, M.; Proestos, Y.; Lelieveld, J. A multi-model, multi-scenario, and multi-domain analysis of regional climate projections for the Mediterranean. Reg. Environ. Chang. 2019, 19, 2621–2635. [Google Scholar] [CrossRef] [Green Version]
- Mylonaki, M.; Papayannis, A.; Papanikolaou, C.-A.; Foskinis, R.; Soupiona, O.; Maroufidis, G.; Anagnou, D.; Kralli, E. Tro-pospheric vertical profiling of the aerosol backscatter coefficient and the particle linear depolarization ratio for different aerosol mixtures during the PANACEA campaign in July 2019 at Volos, Greece. Atmos. Environ. 2021, 247, 118184. [Google Scholar] [CrossRef]
- Papanikolaou, C.-A.; Papayannis, A.; Mylonaki, M.; Foskinis, R.; Kokkalis, P.; Liakakou, E.; Stavroulas, I.; Soupiona, O.; Hatzianastassiou, N.; Gavrouzou, M.; et al. Vertical Profiling of Fresh Biomass Burning Aerosol Optical Properties over the Greek Urban City of Ioannina, during the PANACEA Winter Campaign. Atmosphere 2022, 13, 94. [Google Scholar] [CrossRef]
- Amiridis, V.; Balis, D.S.; Giannakaki, E.; Stohl, A.; Kazadzis, S.; Koukouli, M.E.; Zanis, P. Optical characteristics of biomass burning aerosols over Southeastern Europe determined from UV-Raman lidar measurements. Atmos. Chem. Phys. 2009, 9, 2431–2440. [Google Scholar] [CrossRef] [Green Version]
- Giannakaki, E.; Balis, D.S.; Amiridis, V.; Zerefos, C. Optical properties of different aerosol types: Seven years of combined Raman-elastic backscatter lidar measurements in Thessaloniki, Greece. Atmos. Meas. Tech. 2010, 3, 569–578. [Google Scholar] [CrossRef] [Green Version]
- Siomos, N.; Balis, D.S.; Voudouri, K.A.; Giannakaki, E.; Filioglou, M.; Amiridis, V.; Papayannis, A.; Fragkos, K. Are EARLINET and AERONET climatologies consistent? The case of Thessaloniki, Greece. Atmos. Chem. Phys. 2018, 18, 11885–11903. [Google Scholar] [CrossRef] [Green Version]
- Voudouri, K.A.; Siomos, N.; Michailidis, K.; Papagiannopoulos, N.; Mona, L.; Cornacchia, C.; Nicolae, D.; Balis, D. Comparison of two automated aerosol typing methods and their application to an EARLINET station. Atmos. Chem. Phys. 2019, 19, 10961–10980. [Google Scholar] [CrossRef] [Green Version]
- Marinou, E.; Amiridis, V.; Binietoglou, I.; Tsikerdekis, A.; Solomos, S.; Proestakis, E.; Konsta, D.; Papagiannopoulos, N.; Tsekeri, A.; Vlastou, G.; et al. Three-dimensional evolution of Saharan dust transport towards Europe based on a 9-year EARLINET-optimized CALIPSO dataset. Atmos. Chem. Phys. 2017, 17, 5893–5919. [Google Scholar] [CrossRef] [Green Version]
- Siomos, N.; Balis, D.S.; Poupkou, A.; Liora, N.; Dimopoulos, S.; Melas, D.; Giannakaki, E.; Filioglou, M.; Basart, S.; Chaikovsky, A. Investigating the quality of modeled aerosol profiles based on combined lidar and sunphotometer data. Atmos. Chem. Phys. 2017, 17, 7003–7023. [Google Scholar] [CrossRef] [Green Version]
- Fountoulakis, I.; Natsis, A.; Siomos, N.; Drosoglou, T.; Bais, A.F. Deriving Aerosol Absorption Properties from Solar Ultraviolet Radiation Spectral Measurements at Thessaloniki, Greece. Remote Sens. 2019, 11, 2179. [Google Scholar] [CrossRef] [Green Version]
- Pappalardo, G.; Amodeo, A.; Apituley, A.; Comeron, A.; Freudenthaler, V.; Linné, H.; Ansmann, A.; Bösenberg, J.; D’Amico, G.; Mattis, I.; et al. EARLINET: Towards an advanced sustainable European aerosol lidar network. Atmos. Meas. Tech. 2014, 7, 2389–2409. [Google Scholar] [CrossRef] [Green Version]
- Pappalardo, G.; Wandinger, U.; Mona, L.; Hiebsch, A.; Mattis, I.; Amodeo, A.; Ansmann, A.; Seifert, P.; Linné, H.; Apituley, A.; et al. EARLINET correlative measurements for CALIPSO: First intercomparison results. J. Geophys. Res. 2010, 115, D00H19. [Google Scholar] [CrossRef] [Green Version]
- Stoffelen, A.; Pailleux, J.; Källén, E.; Vaughan, J.M.; Isaksen, L.; Flamant, P.; Wergen, W.; Andersson, E.; Schyberg, H.; Culoma, A.; et al. The atmospheric dynamics mission for global wind field measurement. Bull. Am. Meteorol. Soc. 2005, 86, 73–88. [Google Scholar] [CrossRef]
- Voudouri, K.A.; Siomos, N.; Michailidis, K.; D’Amico, G.; Mattis, I.; Balis, D. Consistency of the Single Calculus Chain Optical Products with Archived Measurements from an EARLINET Lidar Station. Remote Sens. 2020, 12, 3969. [Google Scholar] [CrossRef]
- Holben, B.N.; Eck, T.F.; Slutsker, I.; Tanré, D.; Buis, J.P.; Setzer, A.; Vermote, E.; Reagan, J.A.; Kaufman, Y.J.; Nakajima, T.; et al. AERONET—A Federated Instrument Network and Data Archive for Aerosol Characterization. Remote Sens. Environ. 1998, 66, 1–16. [Google Scholar] [CrossRef]
- O’Neill, N.T.; Dubovik, O.; Eck, T.F. Modified Ångström exponent for the characterization of submicrometer aerosols. Appl. Opt. 2001, 40, 2368–2375. [Google Scholar] [CrossRef] [PubMed]
- O’Neill, N.T.; Eck, T.F.; Holben, B.N.; Smirnov, A.; Dubovik, O.; Royer, A. Bimodal size distribution influences on the variation of Angstrom derivatives in spectral and optical depth space. J. Geophys. Res. Atmos. 2001, 106, 9787–9806. [Google Scholar] [CrossRef]
- O’Neill, N.T.; Eck, T.F.; Smirnov, A.; Holben, B.N.; Thulasiraman, S. Spectral discrimination of coarse and fine mode optical depth. J. Geophys. Res. 2003, 108, 4559–4573. [Google Scholar] [CrossRef]
- Giles, D.M.; Sinyuk, A.; Sorokin, M.G.; Schafer, J.S.; Smirnov, A.; Slutsker, I.; Eck, T.F.; Holben, B.N.; Lewis, J.R.; Campbell, J.R.; et al. Advancements in the Aerosol Robotic Network (AERONET) Version 3 database—Automated near-real-time quality control algorithm with improved cloud screening for Sun photometer aerosol optical depth (AOD) measurements. Atmos. Meas. Tech. 2019, 12, 169–209. [Google Scholar] [CrossRef] [Green Version]
- Voudouri, K.A.; Siomos, N.; Giannakaki, E.; Amiridis, V.; D’Amico, G.; Balis, D. Long-Term Comparison of Lidar Derived Aerosol Optical Depth Between Two Operational Algorithms and Sun Photometer Measurements for Thessaloniki, Greece. In Perspectives on Atmospheric Sciences; Springer: Cham, Switzerland, 2017; Available online: https://link.springer.com/chapter/10.1007/978-3-319-35095-0_113 (accessed on 6 October 2022).
- Bond, T.C.; Doherty, S.J.; Fahey, D.W.; Forster, P.M.; Berntsen, T.; DeAngelo, B.J.; Flanner, M.G.; Ghan, S.; Kärcher, B.; Koch, D.; et al. Bounding the role of black carbon in the climate system: A scientific assessment. J. Geophys. Res. Atmos. 2013, 118, 5380–5552. [Google Scholar] [CrossRef]
- Kaskaoutis, D.; Grivas, G.; Stavroulas, I.; Bougiatioti, A.; Liakakou, E.; Dumka, U.; Gerasopoulos, E.; Mihalopoulos, N. Apportionment of black and brown carbon spectral absorption sources in the urban environment of Athens, Greece, during winter. Sci. Total Environ. 2021, 801, 149739. [Google Scholar] [CrossRef]
- Dubovik, O.; King, M.D. A flexible inversion algorithm for retrieval of aerosol optical properties from Sun and sky radiance measurements. J. Geophys. Res. Atmos. 2000, 105, 20673–20696. [Google Scholar] [CrossRef] [Green Version]
- Ansmann, A.; Wandinger, U.; Riebesell, M.; Weitkamp, C.; Michaelis, W. Independent measurement of extinction and backscatter profiles in cirrus clouds by using a combined Raman elastic-backscatter lidar. Appl. Opt. 1992, 31, 7113–7131. [Google Scholar] [CrossRef] [PubMed]
- Chaikovsky, A.; Dubovik, O.; Goloub, P.; Balashevich, N.; Lopatsin, A.; Karol, Y.; Denisov, S.; Lapyonok, T. Software Package for the Retrieval of Aerosol Microphysical Properties in the Vertical Column Using Combined Lidar/Photometer Data (Test Version); Technical Report; Institute of Physics, National Academy of Sciences of Belarus: Minsk, Belarus, 2008. [Google Scholar]
- Chaikovsky, A.; Dubovik, O.; Holben, B.; Bril, A.; Goloub, P.; Tanré, D.; Pappalardo, G.; Wandinger, U.; Chaikovskaya, L.; Denisov, S.; et al. Lidar-Radiometer Inversion Code (LIRIC) for the retrieval of vertical aerosol properties from combined lidar/radiometer data: Development and distribution in EARLINET. Atmos. Meas. Tech. 2016, 9, 1181–1205. [Google Scholar] [CrossRef] [Green Version]
- Tsekeri, A.; Amiridis, V.; Kokkalis, P.; Basart, S.; Chaikovsky, A.; Dubovik, O.; Mamouri, R.E.; Papayannis, A.; Baldasano, J.M. Application of a Synergetic Lidar and Sunphotometer Algorithm for the Characterization of a Dust Event Over Athens, Greece. Br. J. Environ. Clim. Chang. 2013, 3, 531–546. [Google Scholar] [CrossRef] [Green Version]
- Kokkalis, P.; Amiridis, V.; Allan, J.D.; Papayannis, A.; Solomos, S.; Binietoglou, I.; Bougiatioti, A.; Tsekeri, A.; Nenes, A.; Rosenberg, P.D.; et al. Validation of {LIRIC} aerosol concentration retrievals using airborne measurements during a biomass burning episode over Athens. Atmos. Res. 2017, 183, 255–267. [Google Scholar] [CrossRef]
- Binietoglou, I.; Basart, S.; Alados-Arboledas, L.; Amiridis, V.; Argyrouli, A.; Baars, H.; Baldasano, J.M.; Balis, D.; Belegante, L.; Bravo-Aranda, J.A.; et al. A methodology for investigating dust model performance using synergistic EARLINET/AERONET dust concentration retrievals. Atmos. Meas. Tech. 2015, 8, 3577–3600. [Google Scholar] [CrossRef] [Green Version]
- Mahalanobis, P.C. On the Generalized Distance in Statistics; National Institute of Science of India: Odisha, IN, USA, 1936; Volume 12, pp. 49–55. [Google Scholar]
- Siomos, N.; Fountoulakis, I.; Natsis, A.; Drosoglou, T.; Bais, A. Automated Aerosol Classification from Spectral UV Measurements Using Machine Learning Clustering. Remote Sens. 2020, 12, 965. [Google Scholar] [CrossRef] [Green Version]
- Papagiannopoulos, N.; Mona, L.; Amodeo, A.; D’Amico, G.; Claramunt, P.G.; Pappalardo, G.; Alados-Arboledas, L.; Guerrero-Rascado, J.L.; Amiridis, V.; Kokkalis, P.; et al. An automatic observation-based aerosol typing method for EARLINET. Atmos. Chem. Phys. 2018, 18, 15879–15901. [Google Scholar] [CrossRef] [Green Version]
- Saliba, N.A.; El Jam, F.; El Tayar, G.; Obeid, W.; Roumie, M. Origin and variability of particulate matter (PM10 and PM2.5) mass concentrations over an Eastern Mediterranean city. Atmos. Res. 2010, 97, 106–114. [Google Scholar] [CrossRef]
- Pikridas, M.; Vrekoussis, M.; Sciare, J.; Kleanthous, S.; Vasiliadou, E.; Kizas, C.; Savvides, C.; Mihalopoulos, N. Spatial and temporal (short and long-term) variability of submicron, fine and sub-10 μm particulate matter (PM1, PM2.5, PM10) in Cyprus. Atmos. Environ. 2018, 191, 79–93. [Google Scholar] [CrossRef]
- Diapouli, E.; Manousakas, M.; Vratolis, S.; Vasilatou, V.; Maggos, T.; Saraga, D.; Grigoratos, T.; Argyropoulos, G.; Voutsa, D.; Samara, C.; et al. Evolution of air pollution source contributions over one decade, derived by PM10 and PM2.5 source apportionment in two metropolitan urban areas in Greece. Atmos. Environ. 2017, 164, 416–430. [Google Scholar] [CrossRef]
- Theodosi, C.; Tsagkaraki, M.; Zarmpas, P.; Grivas, G.; Liakakou, E.; Paraskevopoulou, D.; Lianou, M.; Gerasopoulos, E.; Mihalopoulos, N. Multi-year chemical composition of the fine-aerosol fraction in Athens, Greece, with emphasis on wintertime residential heating. Atmos. Chem. Phys. 2018, 18, 14371–14391. [Google Scholar] [CrossRef]
- Liakakou, E.; Stavroulas, I.; Kaskaoutis, D.; Grivas, G.; Paraskevopoulou, D.; Dumka, U.; Tsagkaraki, M.; Bougiatioti, A.; Oikonomou, K.; Sciare, J.; et al. Long-term variability, source apportionment and spectral properties of black carbon at an urban background site in Athens, Greece. Atmos. Environ. 2020, 222, 117137. [Google Scholar] [CrossRef]
- Gerasopoulos, E.; Kouvarakis, G.; Babasakalis, P.; Vrekoussis, M.; Putaud, J.-P.; Mihalopoulos, N. Origin and variability of particulate matter (PM10) mass concentrations over the Eastern Mediterranean. Atmos. Environ. 2006, 40, 4679–4690. [Google Scholar] [CrossRef]
- Conte, M.; Merico, E.; Cesari, D.; Dinoi, A.; Grasso, F.M.; Donateo, A.; Guascito, M.R.; Contini, D. Long-term characterisation of African dust advection in south-eastern Italy: Influence on fine and coarse particle concentrations, size distributions, and carbon content. Atmos. Res. 2020, 233, 104690. [Google Scholar] [CrossRef]
- Samara, C.; Voutsa, D.; Kouras, A.; Eleftheriadis, K.; Maggos, T.; Saraga, D.; Petrakakis, M. Organic and elemental carbon associated to PM10 and PM2.5 at urban sites of northern Greece. Environ. Sci. Pollut. Res. 2014, 21, 1769–1785. [Google Scholar] [CrossRef] [PubMed]
- Paraskevopoulou, D.; Liakakou, E.; Gerasopoulos, E.; Mihalopoulos, N. Sources of atmospheric aerosol from long-term measurements (5 years) of chemical composition in Athens, Greece. Sci. Total Environ. 2015, 527–528, 165–178. [Google Scholar] [CrossRef]
- Diapouli, E.; Kalogridis, A.-C.; Markantonaki, C.; Vratolis, S.; Fetfatzis, P.; Colombi, C.; Eleftheriadis, K. Annual Variability of Black Carbon Concentrations Originating from Biomass and Fossil Fuel Combustion for the Suburban Aerosol in Athens, Greece. Atmosphere 2017, 8, 234. [Google Scholar] [CrossRef] [Green Version]
- Kalogridis, A.-C.; Vratolis, S.; Liakakou, E.; Gerasopoulos, E.; Mihalopoulos, N.; Eleftheriadis, K. Assessment of wood burning versus fossil fuel contribution to wintertime black carbon and carbon monoxide concentrations in Athens, Greece. Atmos. Chem. Phys. 2018, 18, 10219–10236. [Google Scholar] [CrossRef] [Green Version]
- Becerril-Valle, M.; Coz, E.; Prévôt, A.S.H.; Močnik, G.; Pandis, S.; de la Campa, A.M.S.; Alastuey, A.; Díaz, E.; Pérez, R.; Artíñano, B. Characterization of atmospheric black carbon and co-pollutants in urban and rural areas of Spain. Atmos. Environ. 2017, 169, 36–53. [Google Scholar] [CrossRef]
- Basart, S.; Pérez, C.; Nickovic, S.; Cuevas, E.; Baldasano, J.M. Development and evaluation of the BSC-DREAM8b dust regional model over Northern Africa, the Mediterranean and the Middle East. Tellus B Chem. Phys. Meteorol. 2012, 64, 18539. [Google Scholar] [CrossRef]


| Instrumentation | Summer PANACEA Campaign | Winter PANACEA Campaign |
|---|---|---|
| Aethalometer | 17 July–27 August | 18 December–19 February |
| Sunphotometer | 18 July–26 August | 10 January–26 February |
| MP101M | 15 July–10 August | 1 January–29February |
| Lidar | Daytime and nighttime measurements, according to the weather conditions | Daytime and nighttime measurements, according to the weather conditions |
| Aerosol Properties | Summer | Winter |
|---|---|---|
| PBL | 1.6 ± 0.8 km | 1.3 ± 0.3 km |
| Aerosol thickness | 1.5 km | 0.9 km |
| AOD500 | 0.24 ± 0.07 | 0.14 ± 0.06 |
| FMF500 | 0.86 ± 0.08 | 0.84 ± 0.1 |
| PM2.5 | 14 ± 5 μg/m3 | 18 ± 12 μg/m3 |
| PM10 | 20 ± 5 μg/m3 | 28 ± 13 μg/m3 |
| Total BC | 0.8 ± 0.5 μg/m3 | 1.6 ± 1 μg/m3 |
| Predominant type | Smoke | Smoke |
Publisher’s Note: MDPI stays neutral with regard to jurisdictional claims in published maps and institutional affiliations. |
© 2022 by the authors. Licensee MDPI, Basel, Switzerland. This article is an open access article distributed under the terms and conditions of the Creative Commons Attribution (CC BY) license (https://creativecommons.org/licenses/by/4.0/).
Share and Cite
Voudouri, K.A.; Michailidis, K.; Siomos, N.; Chatzopoulou, A.; Kouvarakis, G.; Mihalopoulos, N.; Tzoumaka, P.; Kelessis, A.; Balis, D. Evaluation of Aerosol Typing with Combination of Remote Sensing Techniques with In Situ Data during the PANACEA Campaigns in Thessaloniki Station, Greece. Remote Sens. 2022, 14, 5076. https://doi.org/10.3390/rs14205076
Voudouri KA, Michailidis K, Siomos N, Chatzopoulou A, Kouvarakis G, Mihalopoulos N, Tzoumaka P, Kelessis A, Balis D. Evaluation of Aerosol Typing with Combination of Remote Sensing Techniques with In Situ Data during the PANACEA Campaigns in Thessaloniki Station, Greece. Remote Sensing. 2022; 14(20):5076. https://doi.org/10.3390/rs14205076
Chicago/Turabian StyleVoudouri, Kalliopi Artemis, Konstantinos Michailidis, Nikolaos Siomos, Anthi Chatzopoulou, Georgios Kouvarakis, Nikolaos Mihalopoulos, Paraskevi Tzoumaka, Apostolos Kelessis, and Dimitrios Balis. 2022. "Evaluation of Aerosol Typing with Combination of Remote Sensing Techniques with In Situ Data during the PANACEA Campaigns in Thessaloniki Station, Greece" Remote Sensing 14, no. 20: 5076. https://doi.org/10.3390/rs14205076