Introducing Low-Cost Sensors into the Classroom Settings: Improving the Assessment in Agile Practices with Multimodal Learning Analytics

 , ,
, ,  , , and
Abstract
:1. Introduction
2. Related Work
3. Materials and Methods
3.1. Definition of Goals
- To define a method that allows the conducting of Scrum retrospectives facilitating the interaction between the members of a team.
- To record and analyze the individual and group behavior of the work carried out by agile teams.
- Evaluate the effectiveness of MMLA as a technique to measure and evaluate skills in agile teams.
3.2. Case Description
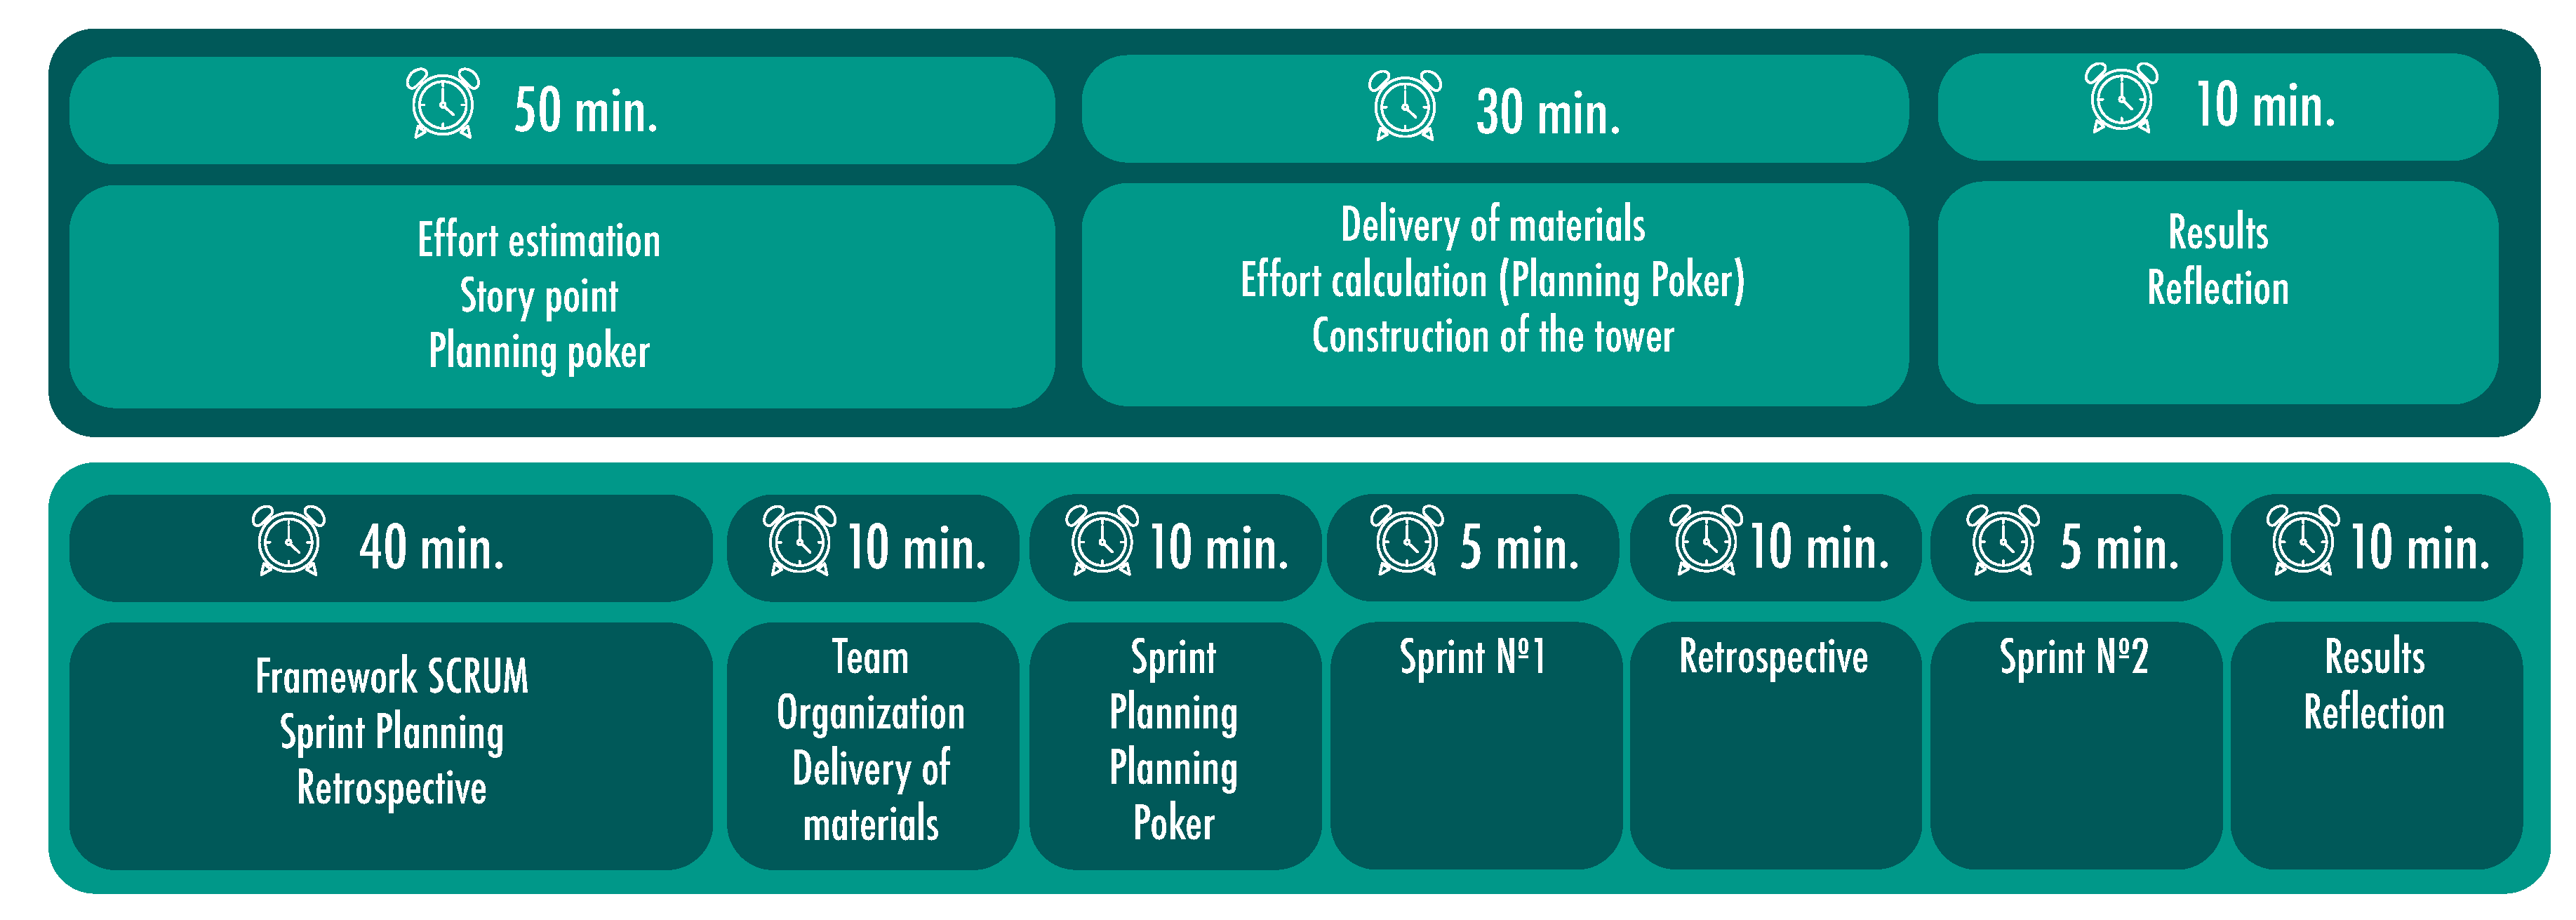
3.2.1. Training and Learning Activities
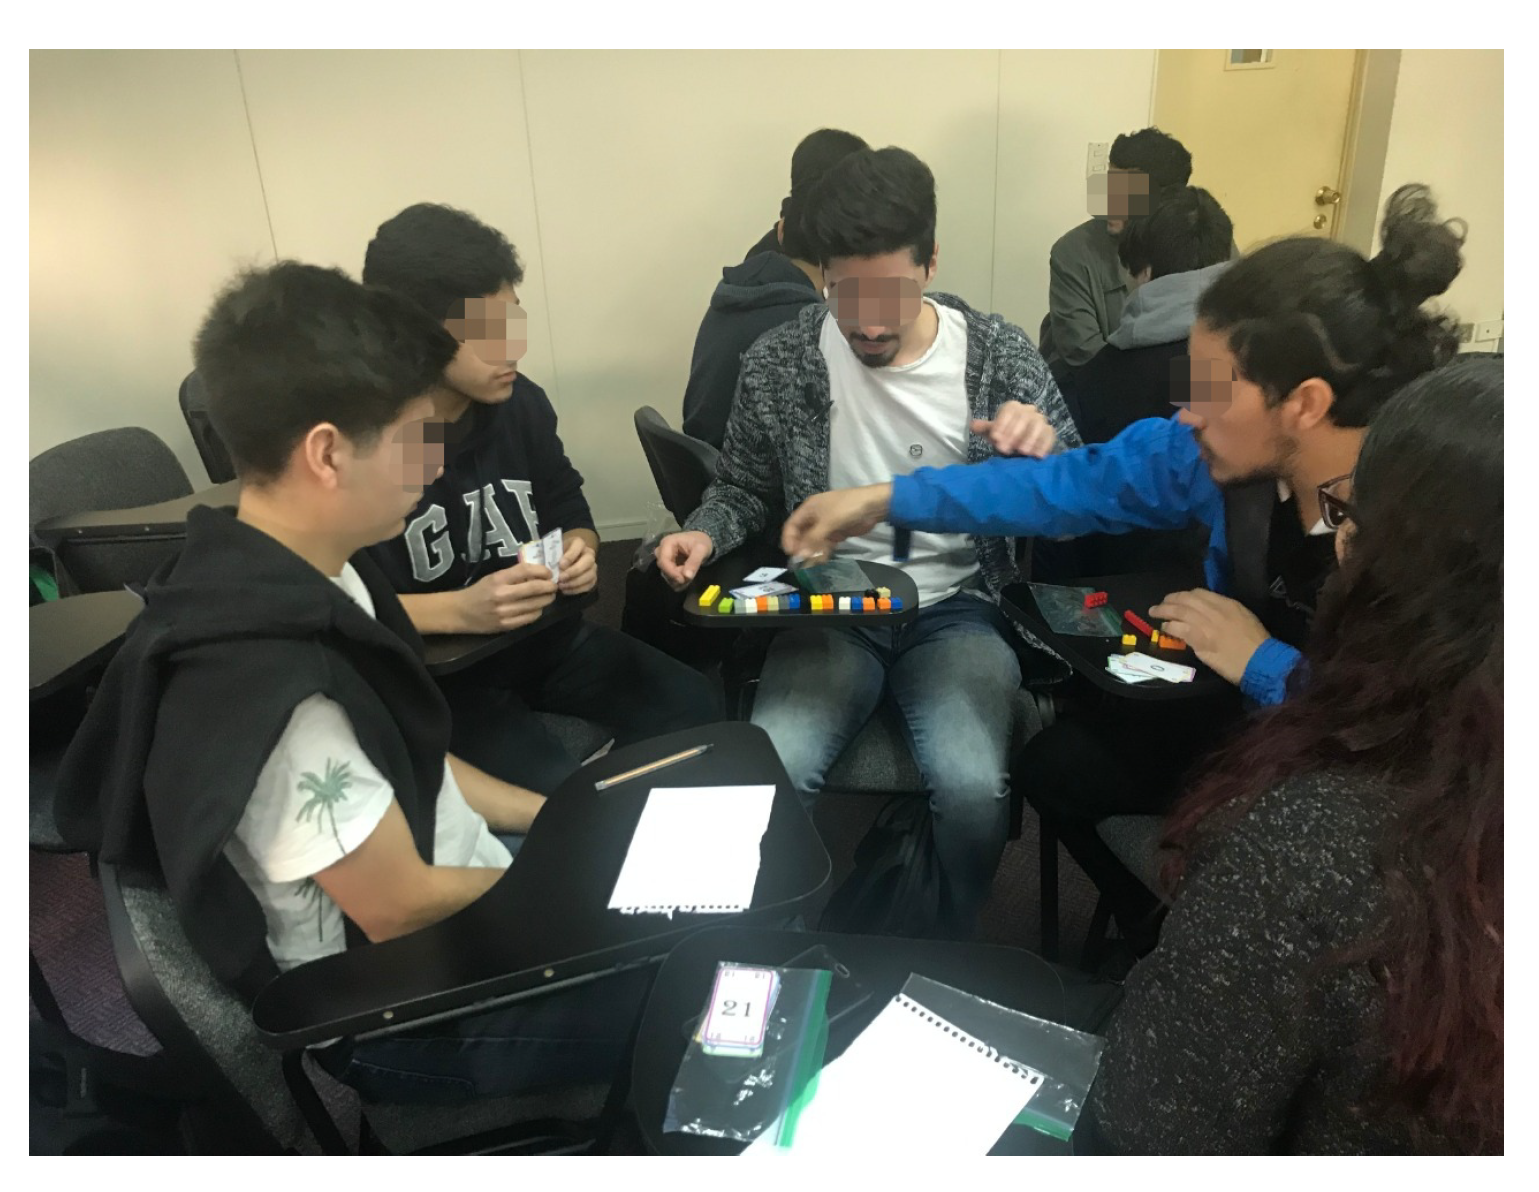
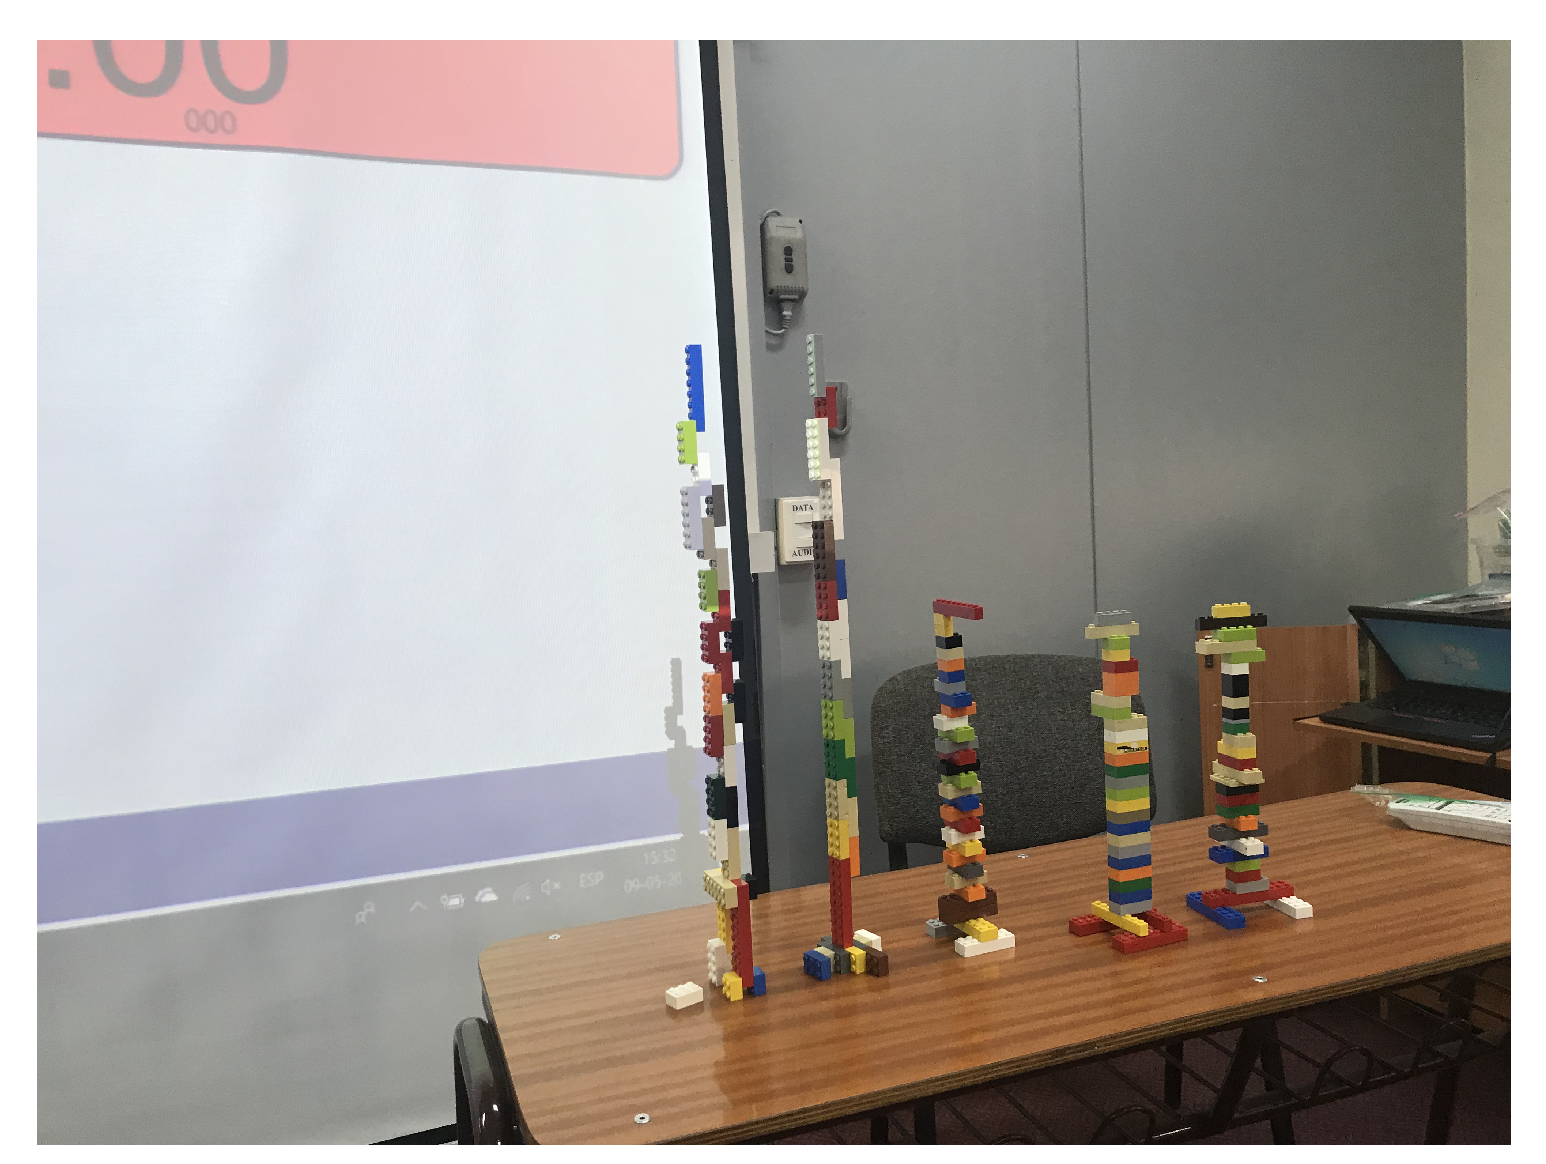
3.2.2. Case Study
- Do you think that this type of activity helps to understand the benefits of teamwork?
- Do you think that working with Lego® bricks facilitated collaborative work?
- Do you think working with Lego® bricks facilitated communication among team members?
- Were all team members were actively involved?
- Were you according to how to plan and distribute work?
- Has planning poker helped the team reach consensus?
- Did you actively participate in the planning?
- Was there clarity in what each one should do?
- Have all team members worked?
- Did you finish each task assigned to you?
- Were problems correctly detected?
- Was it possible to adjust the work to achieve the objective?
- What I liked most was:
- What I liked the least was:
- As a team, what we would do differently would be:
- At the end of the activity I feel:
- According to work done, I can say that the leadership style that predominates in the team was:
- What do you think was the team’s greatest strength?
- What do you think was the team’s biggest weakness?
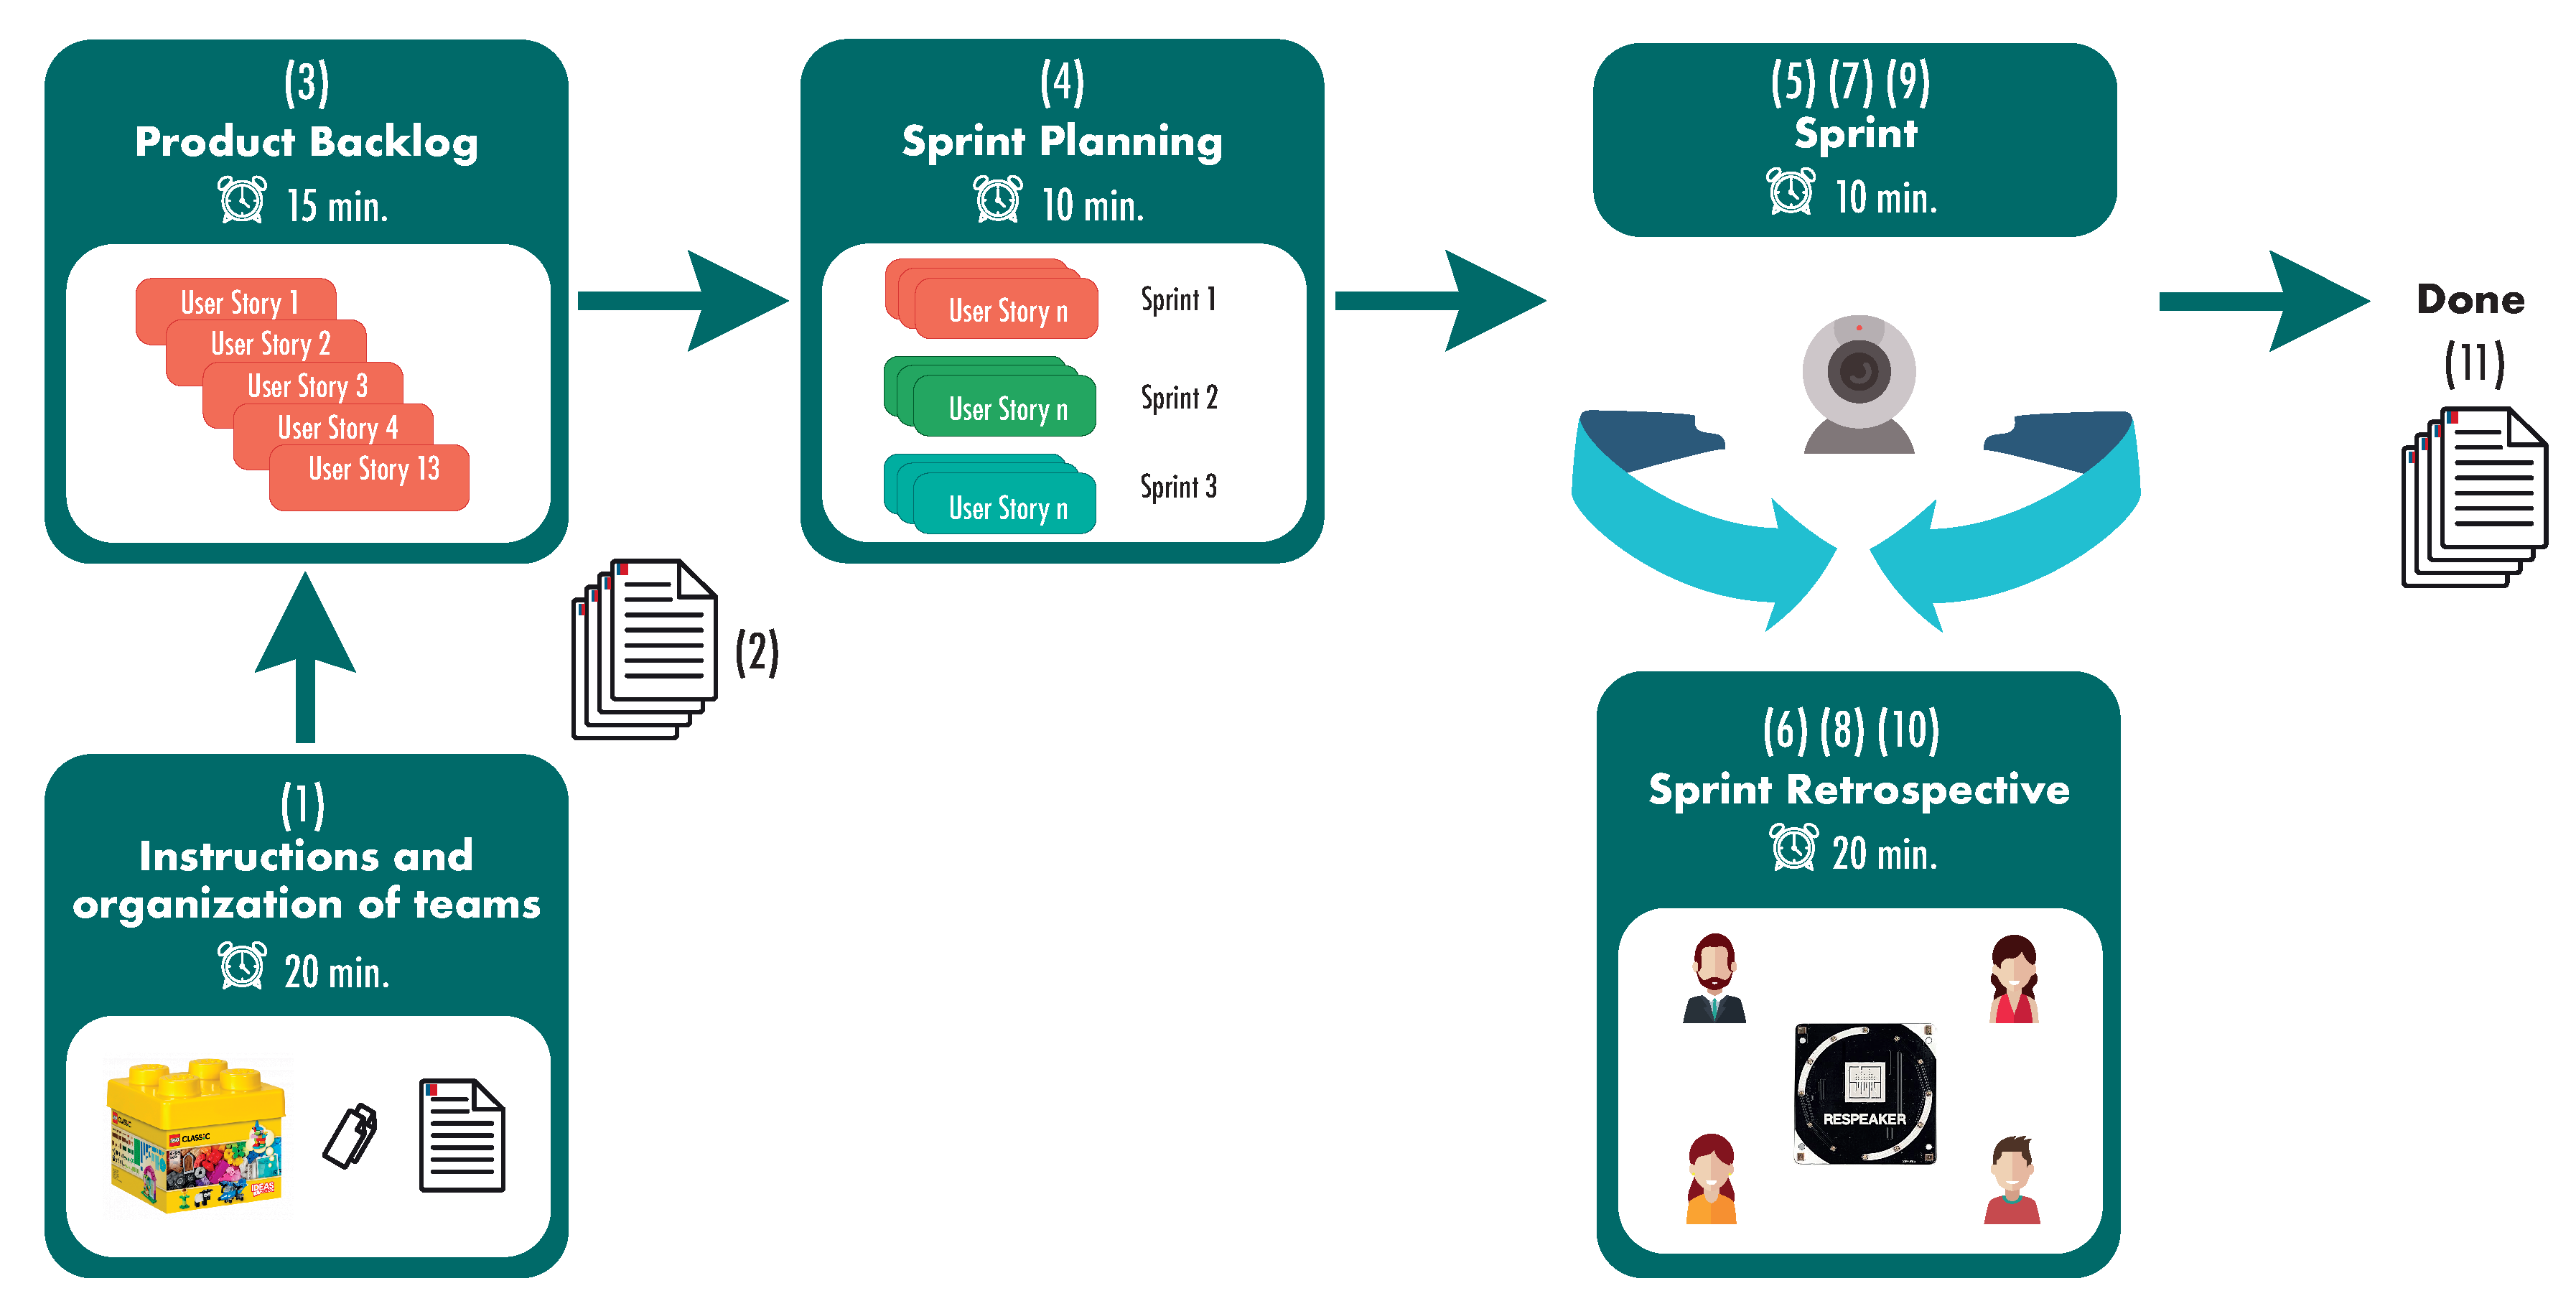
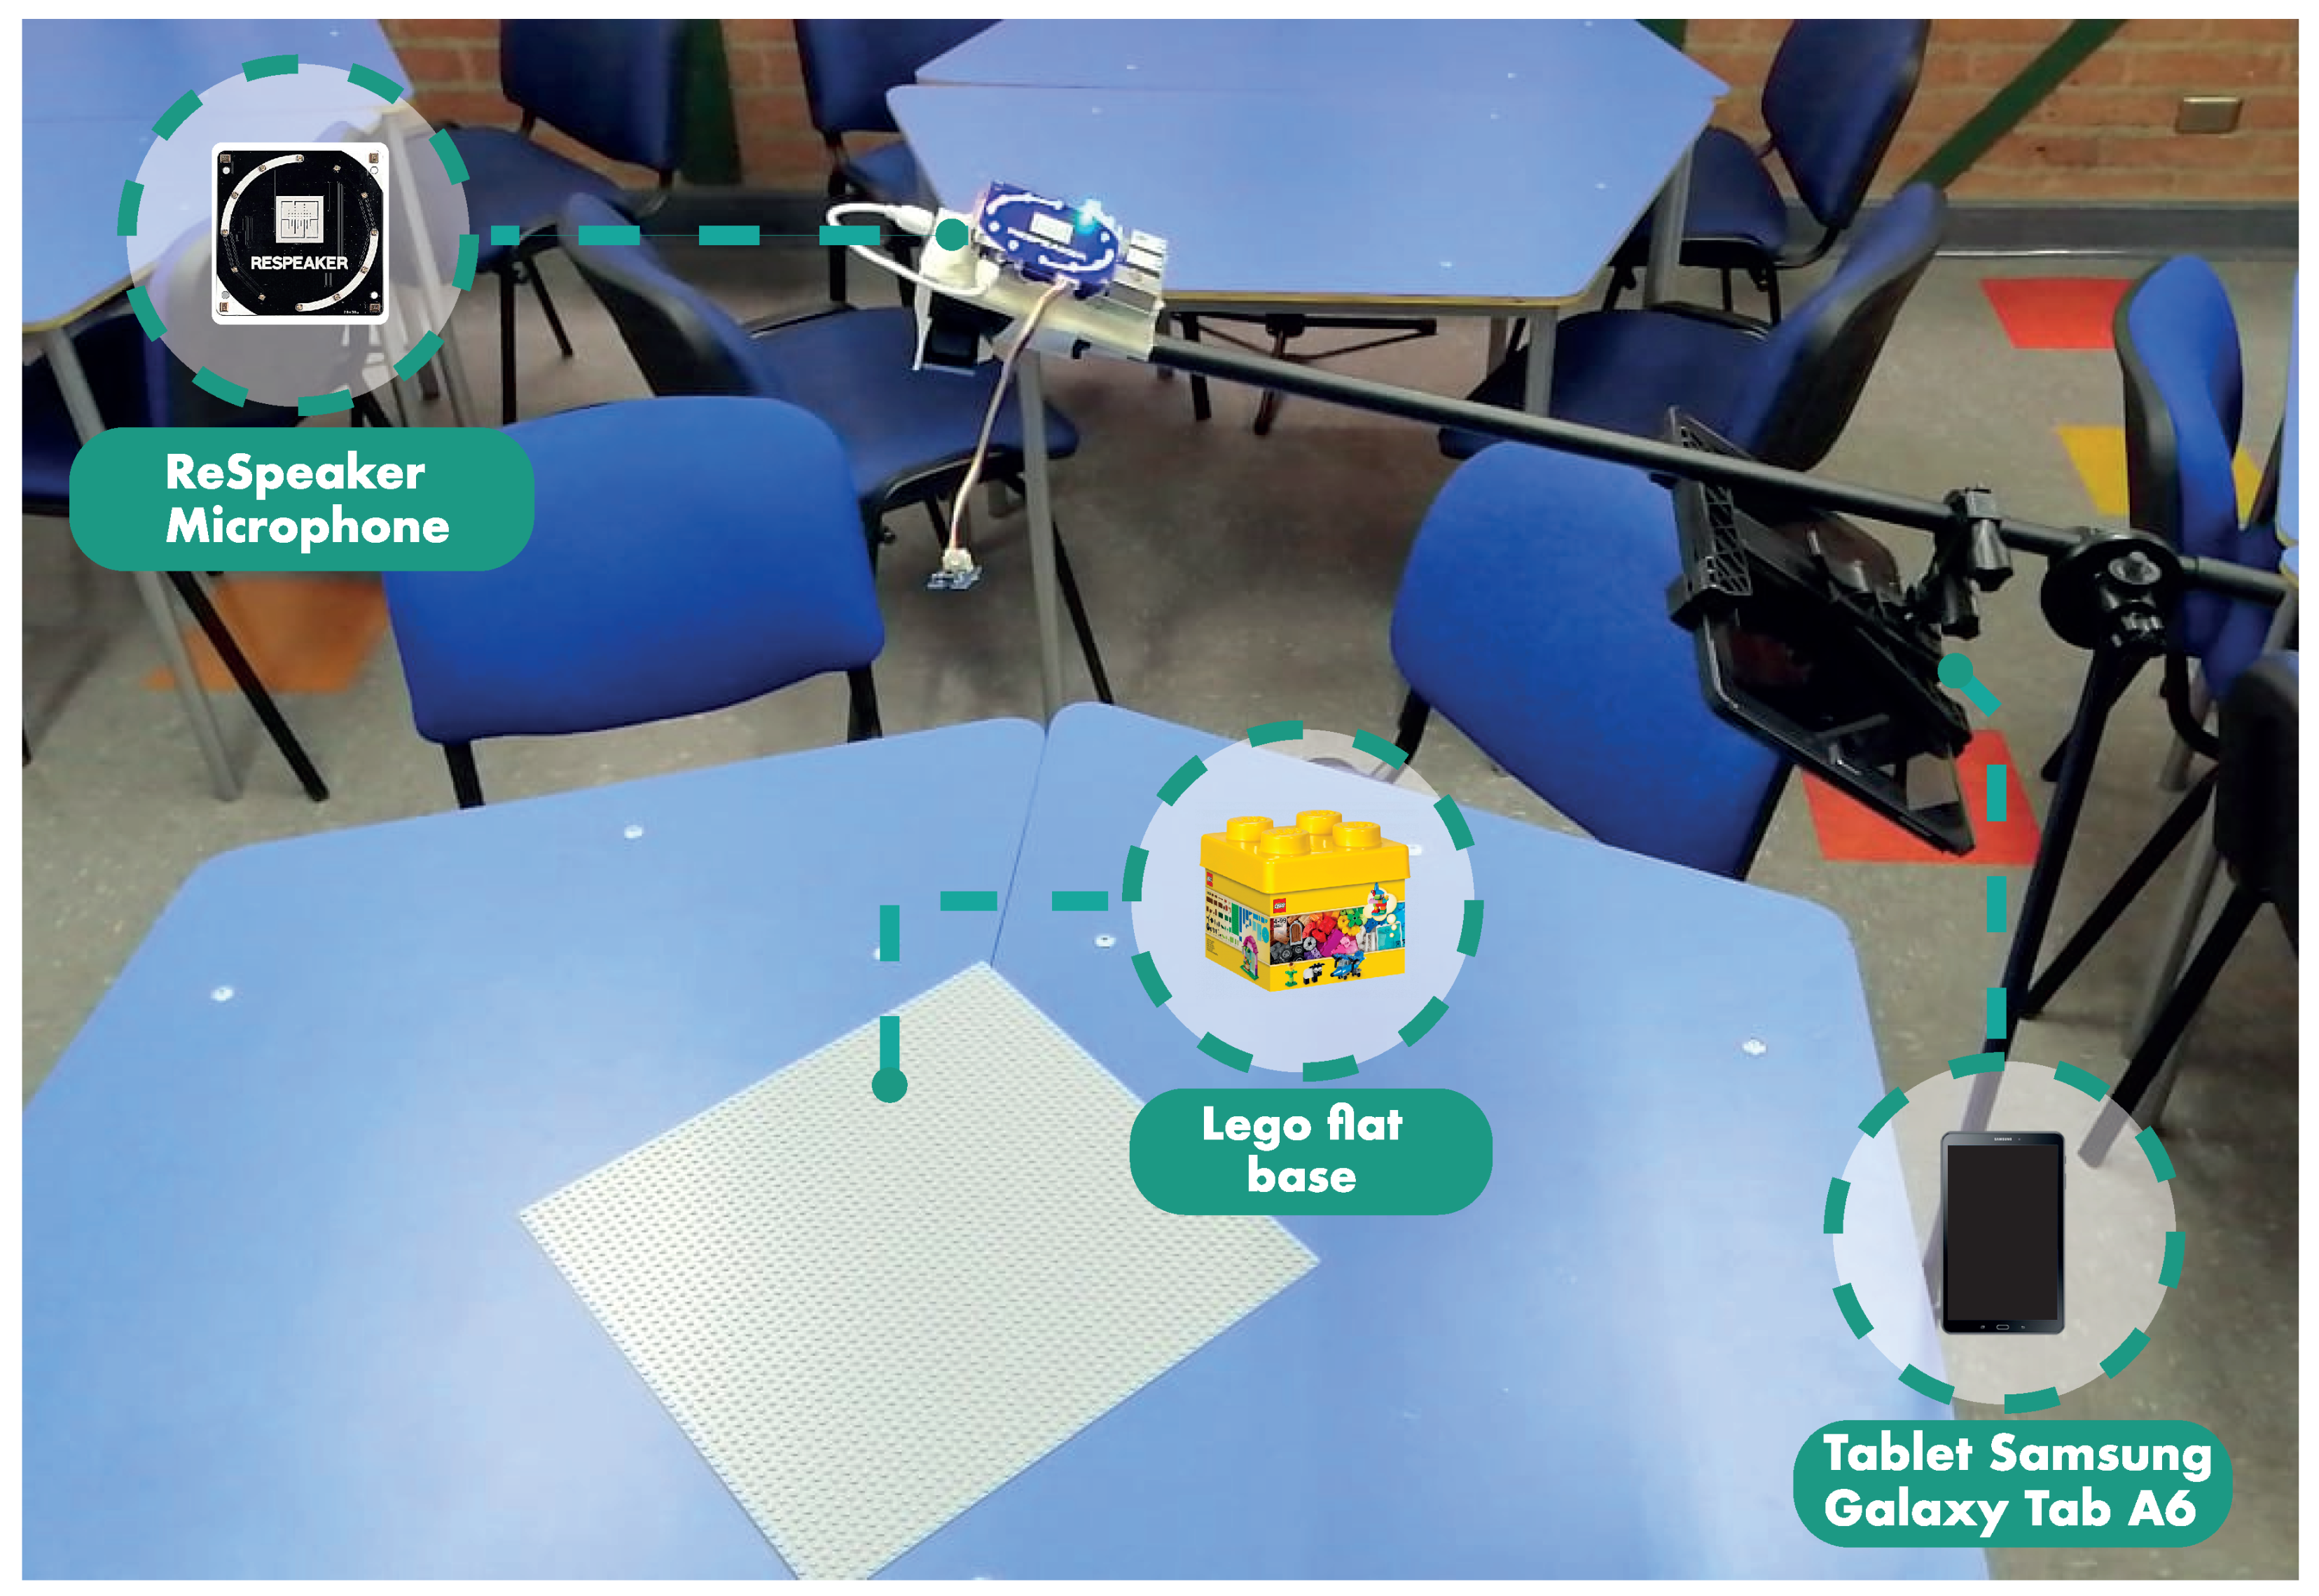
3.2.3. Materials and Instruments
- 1
- Kit Lego® Classic Creative 10,696 (484 pieces)
- 1
- Lego® flat base 10,701 (38 × 38 cm)
- 1
- ReSpeaker Microphone
- 1
- Tablet Samsung Galaxy Tab A6 10’
- 4
- Set Planning Poker
- 13
- User Stories (for details see Table 3)Guidelines and guides for the work:Prioritized backlog, Planned vs. done, guides for retrospectives, Fun vs. utility.Markers
3.2.4. Research Questions
- RQ1: How does collaboration and communication relate to the productivity of agile teams?
- RQ2: How does collaboration and communication relate to the estimation of complexity of each sprint?
- RQ3: What is the relationship between the leadership and personality characteristics of agile team members, and the collaboration in during the activity?
- The ReSpeaker record file of the interventions made by each participant in each Scrum retrospective. We will collect speaking time and number of intervention metrics, to measure communication, and we will analyze the collaboration type by processing these measures (see Section 3.4).
- The worksheets were delivered, completed by each team as they progressed in the Scrum simulation; we will obtain the planned and accomplished story points and user stories, which will allow us to measure the quality of the development process in terms of the burning down of stories and the debt of user stories and story points in each sprint.
- The DiSC® behavior test [58] that each participant answered anonymously at the beginning of the activity. Only the team number was tagged to triangulate the information. We will characterize each team by the most repeated personality type.
- The leadership test [61], completed by each participant, about the leadership style of the team during the activity. We will characterize each team by the most repeated leadership type.
3.2.5. Ethical Considerations
3.3. Definition of Metrics
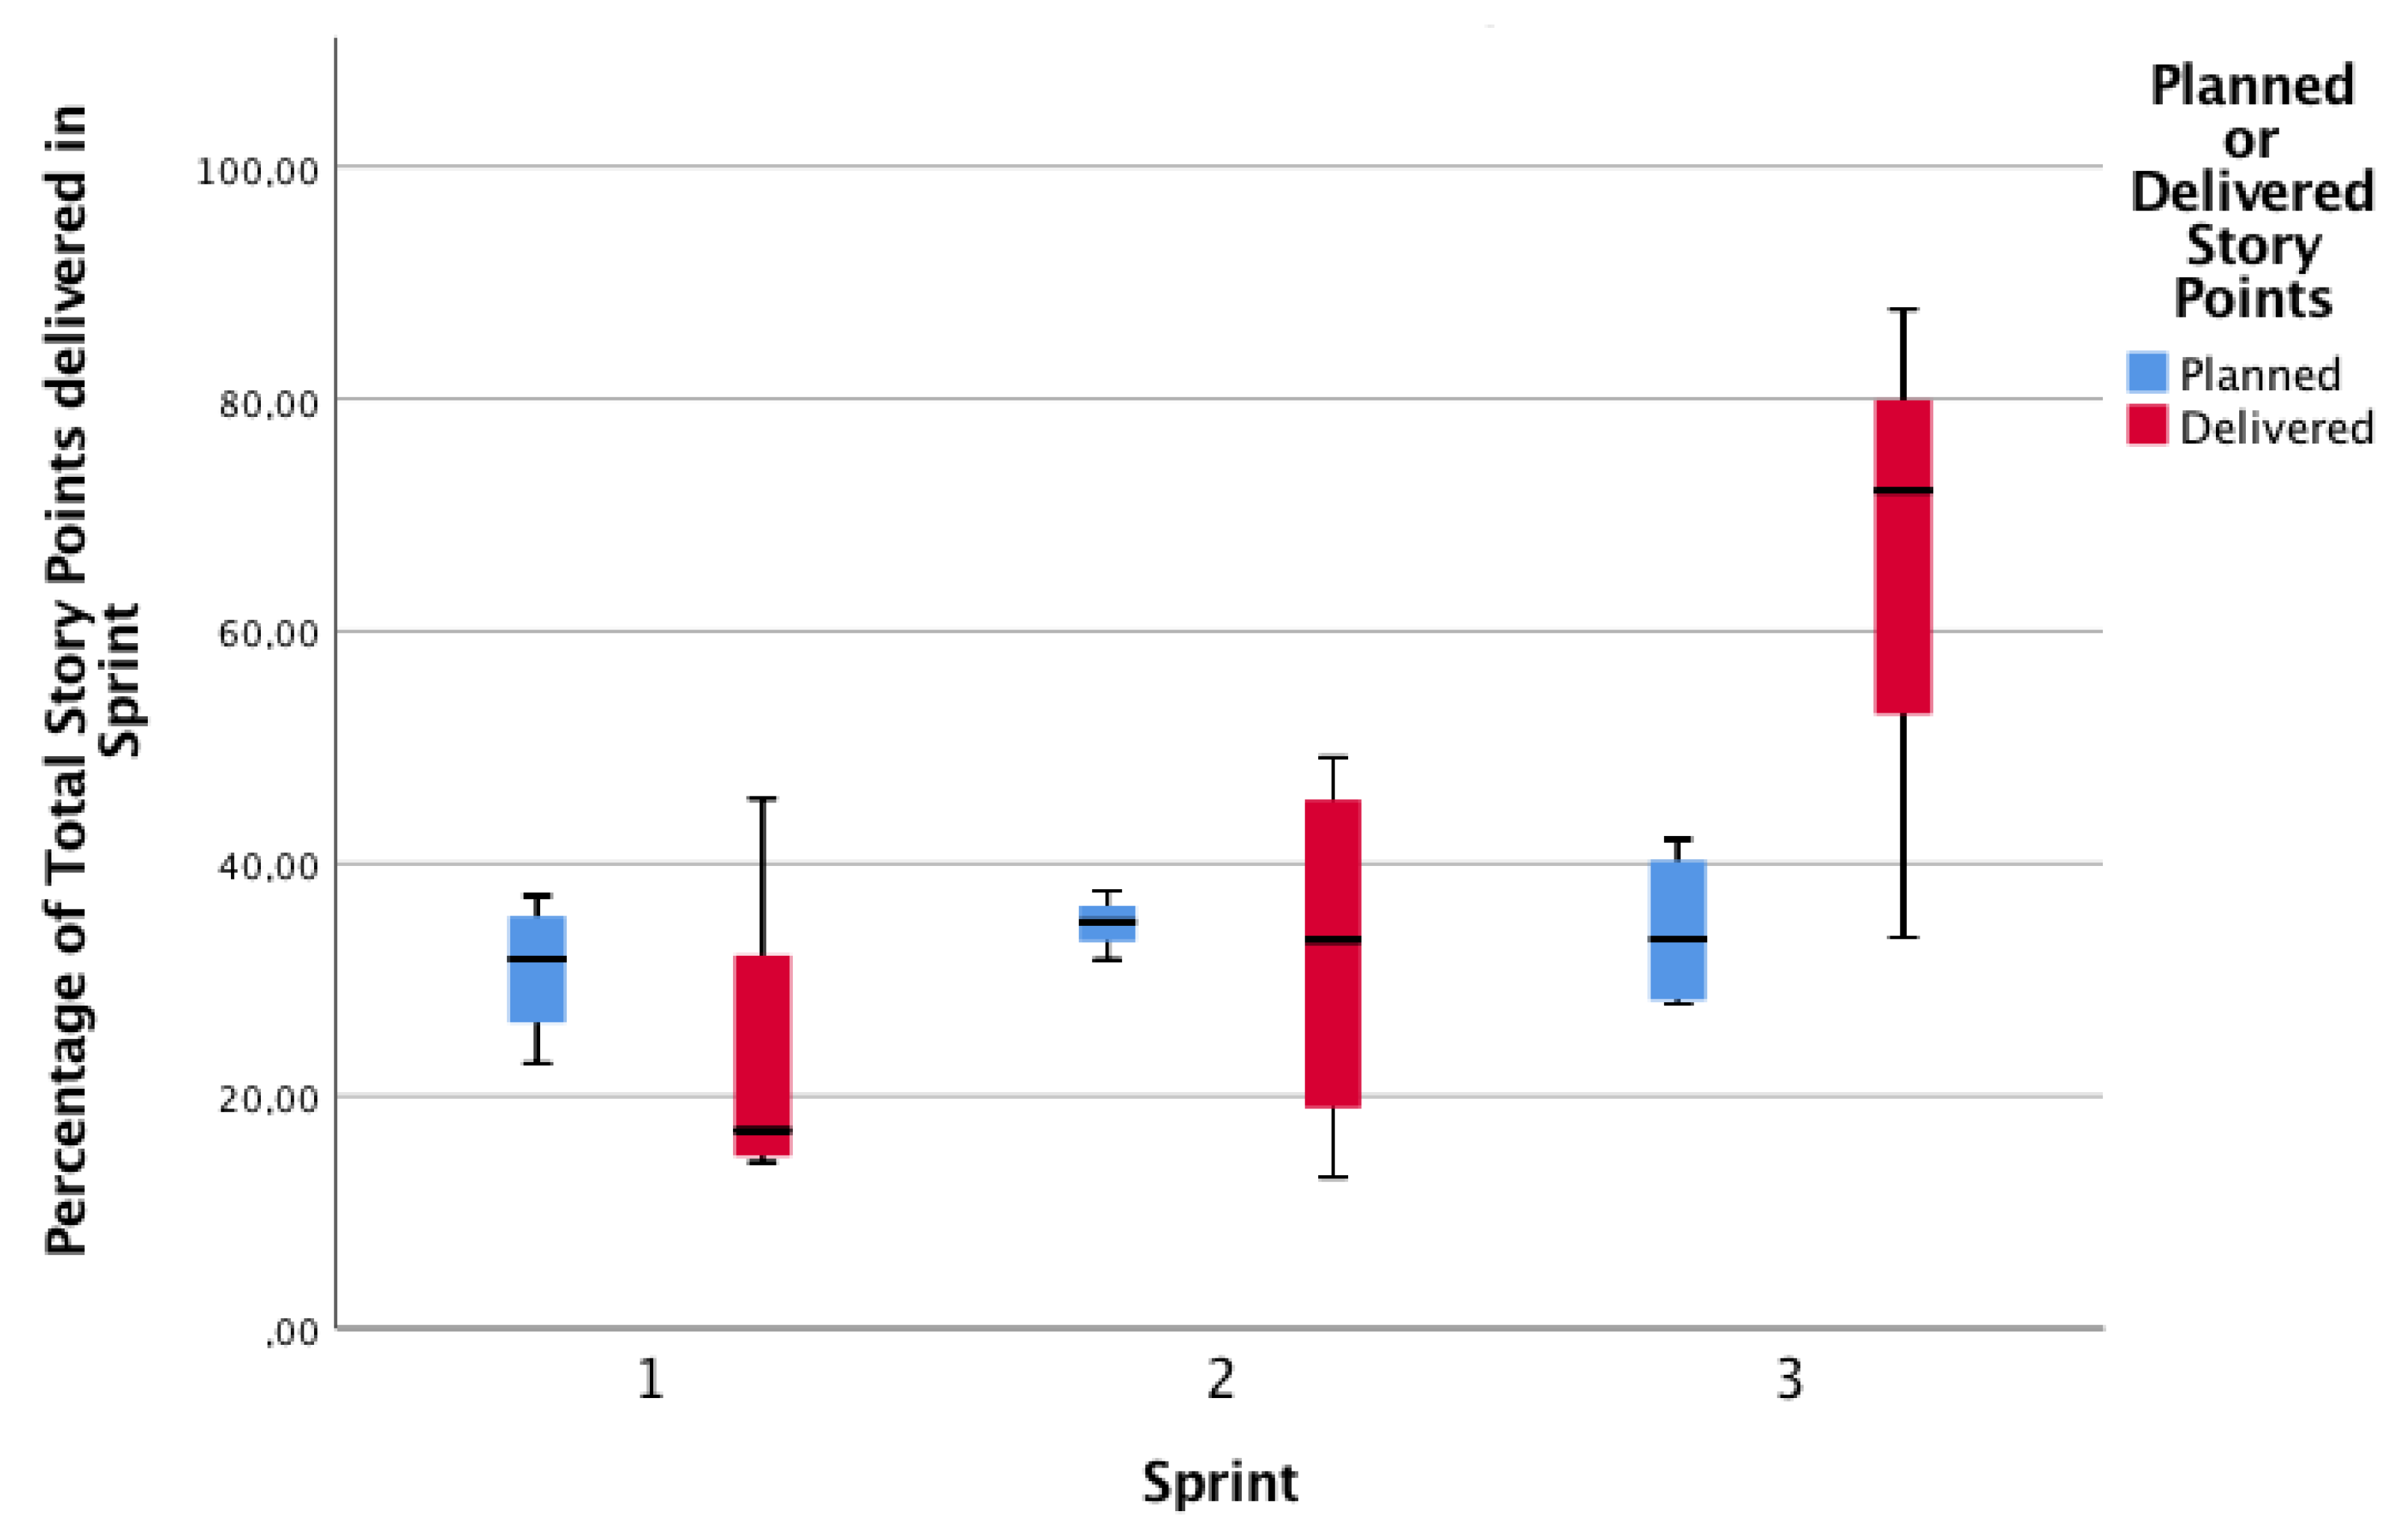
- Productivity—Story Points Delivered (SP-D): In the planning game, each team defines the story points for each user story, as a complexity estimation. Subjects must report, in each sprint, the Delivered Story Points (SP-D). Productivity is measured as the number of accomplished story points; to compare it across teams, we will transform the number of story points to the percentage of story points produced in the sprint with respect to the total story points produced.
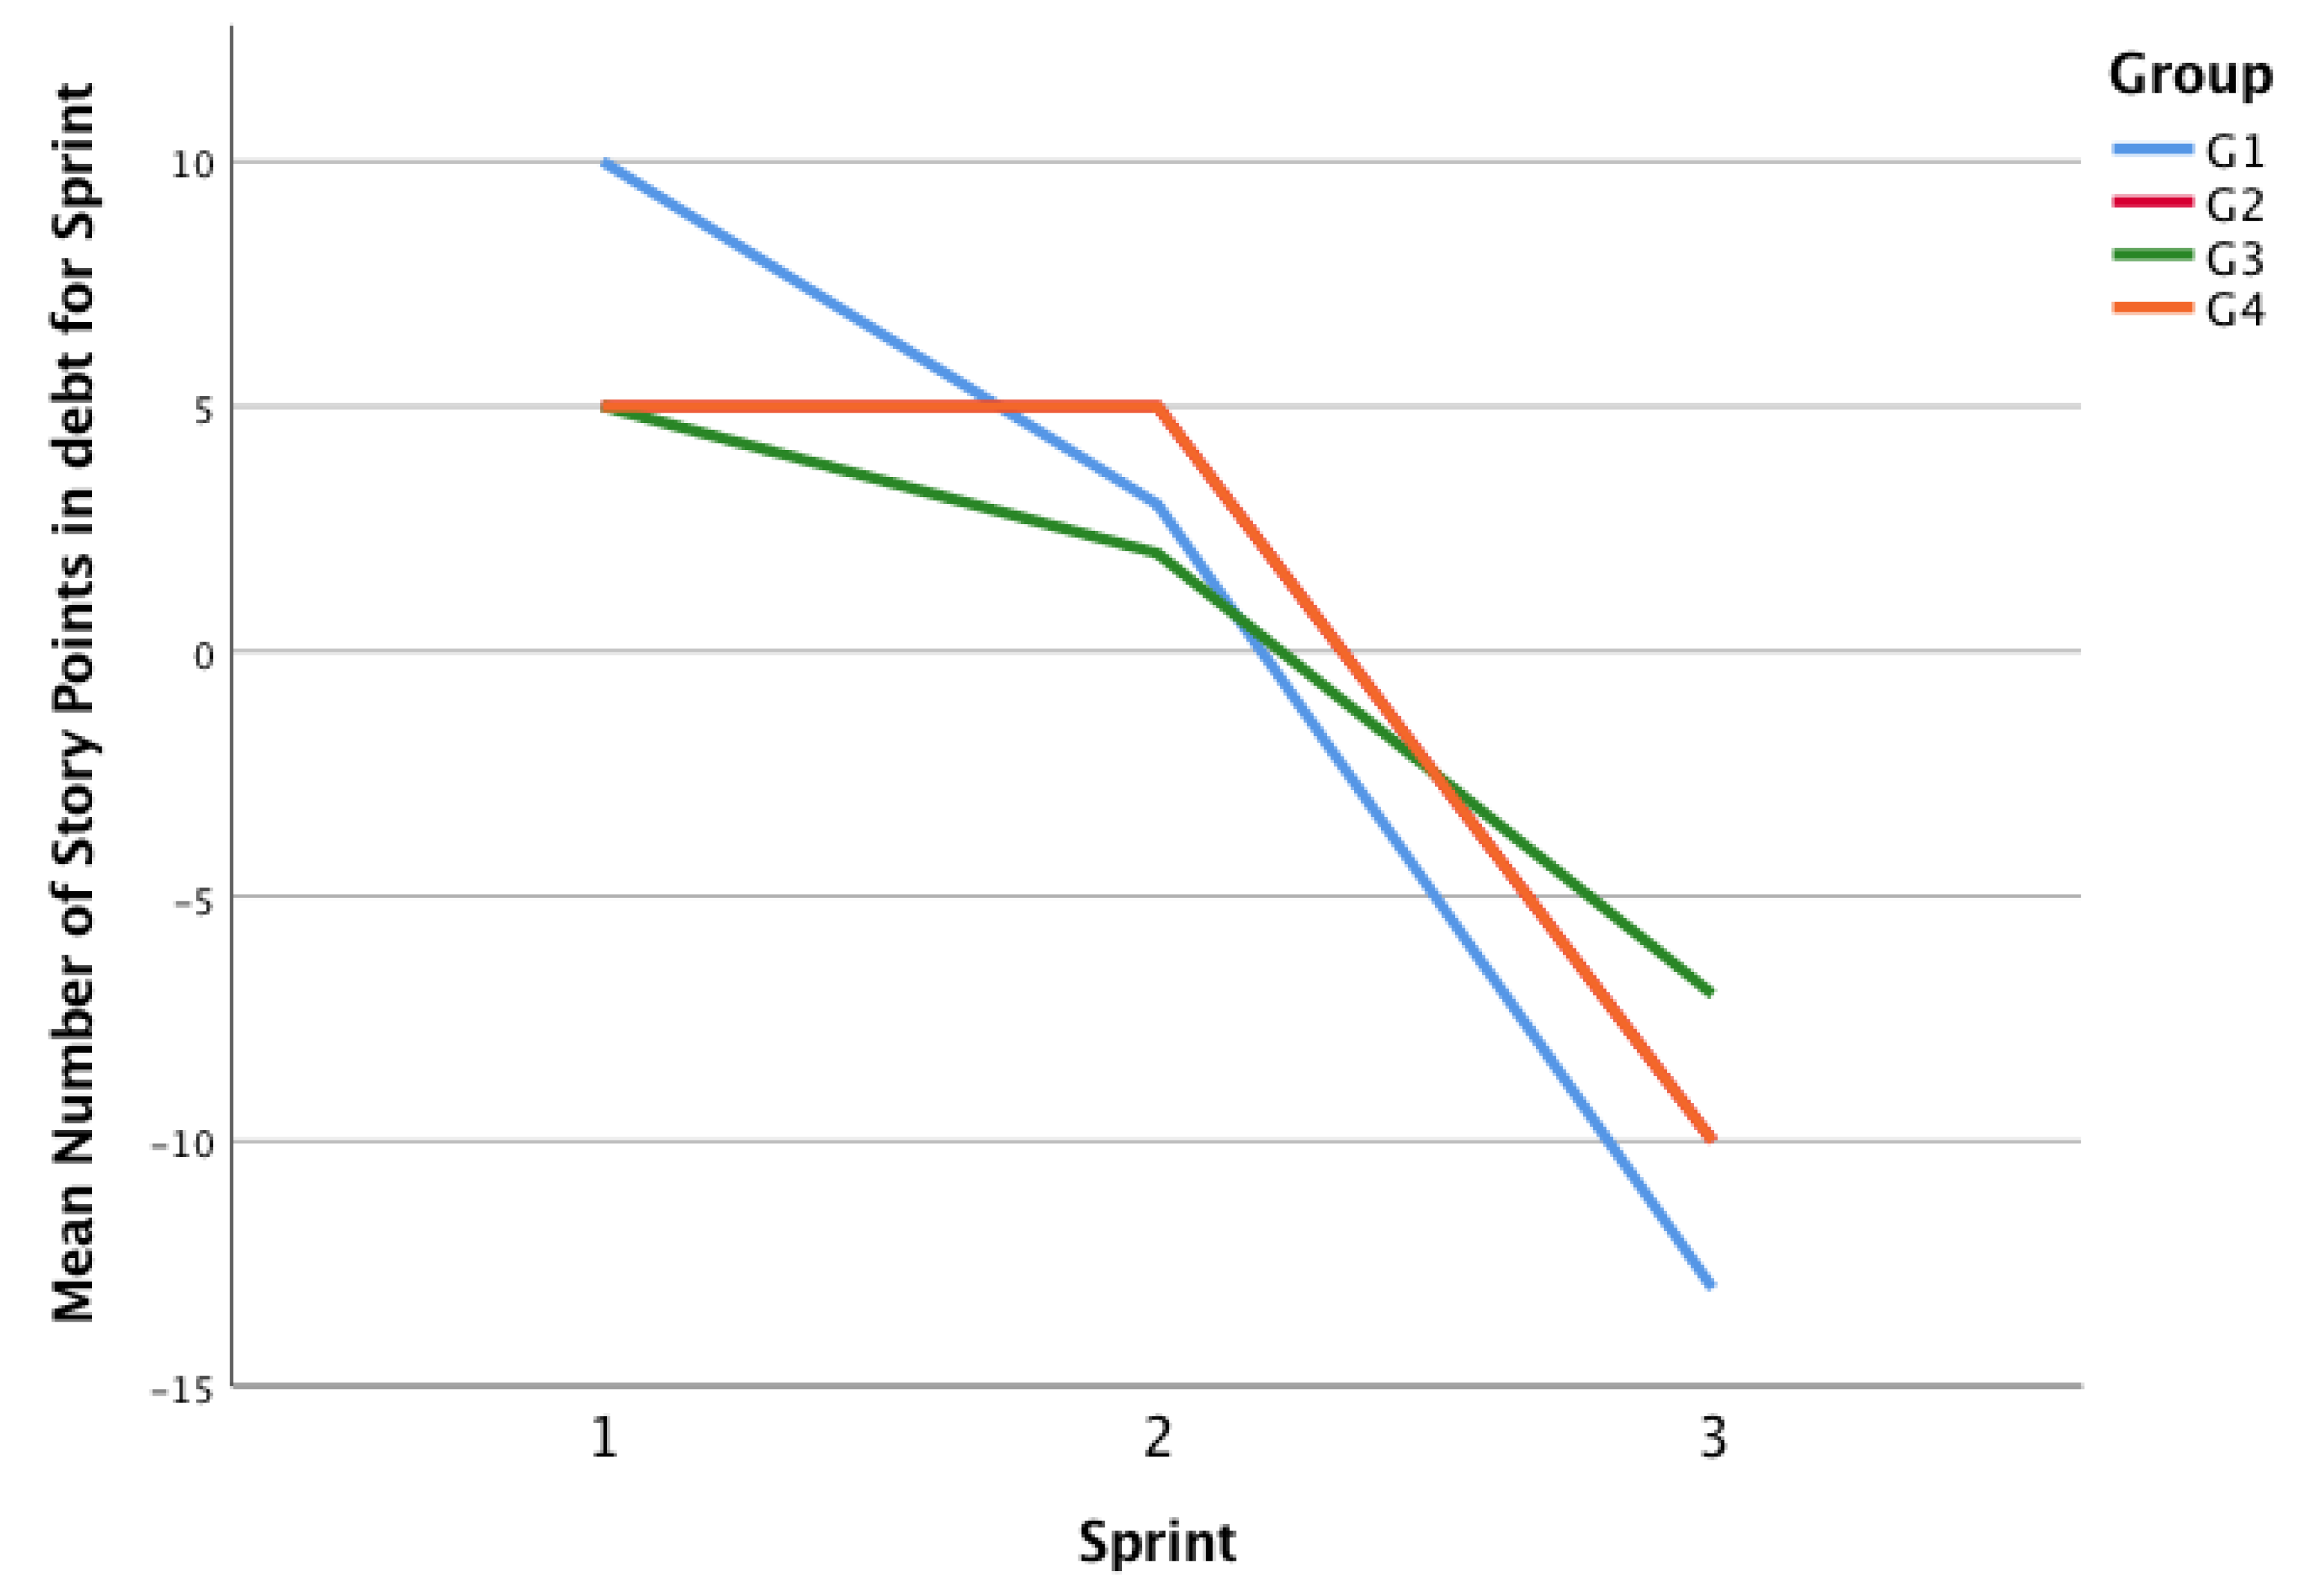
- Complexity Estimation—Story Points Debt (SPDebt): Subjects must report in each sprint, the Planed Story Points (SP-P). We will measure the quality of estimation improvements in terms of the debt of Story Points (SPDebt); this is the difference between the planned and the delivered story points.
- Communication—Speaking Time and Number of Interventions: from ReSpeakers recordings of the three retrospective ceremonies (performed after each development sprint), we obtain the total Speaking Time (ST) for a sprint, by adding all the speaking times of all the team members. Also, we obtain the number of interventions of each team member, and add all the interventions to get the total Number of Interventions (NI) of the sprint. Although this metric is obviously simplistic to assess effective communication, it will be analyzed in the context of the Retrospective Ceremony structure, purpose, and results, i.e., we are not looking for results such as “Group 1 communicated better than Group 2 because Group 1 has more ST or NI”, but to explore if a greater ST or NI could relate to Process Productivity or Process Quality.
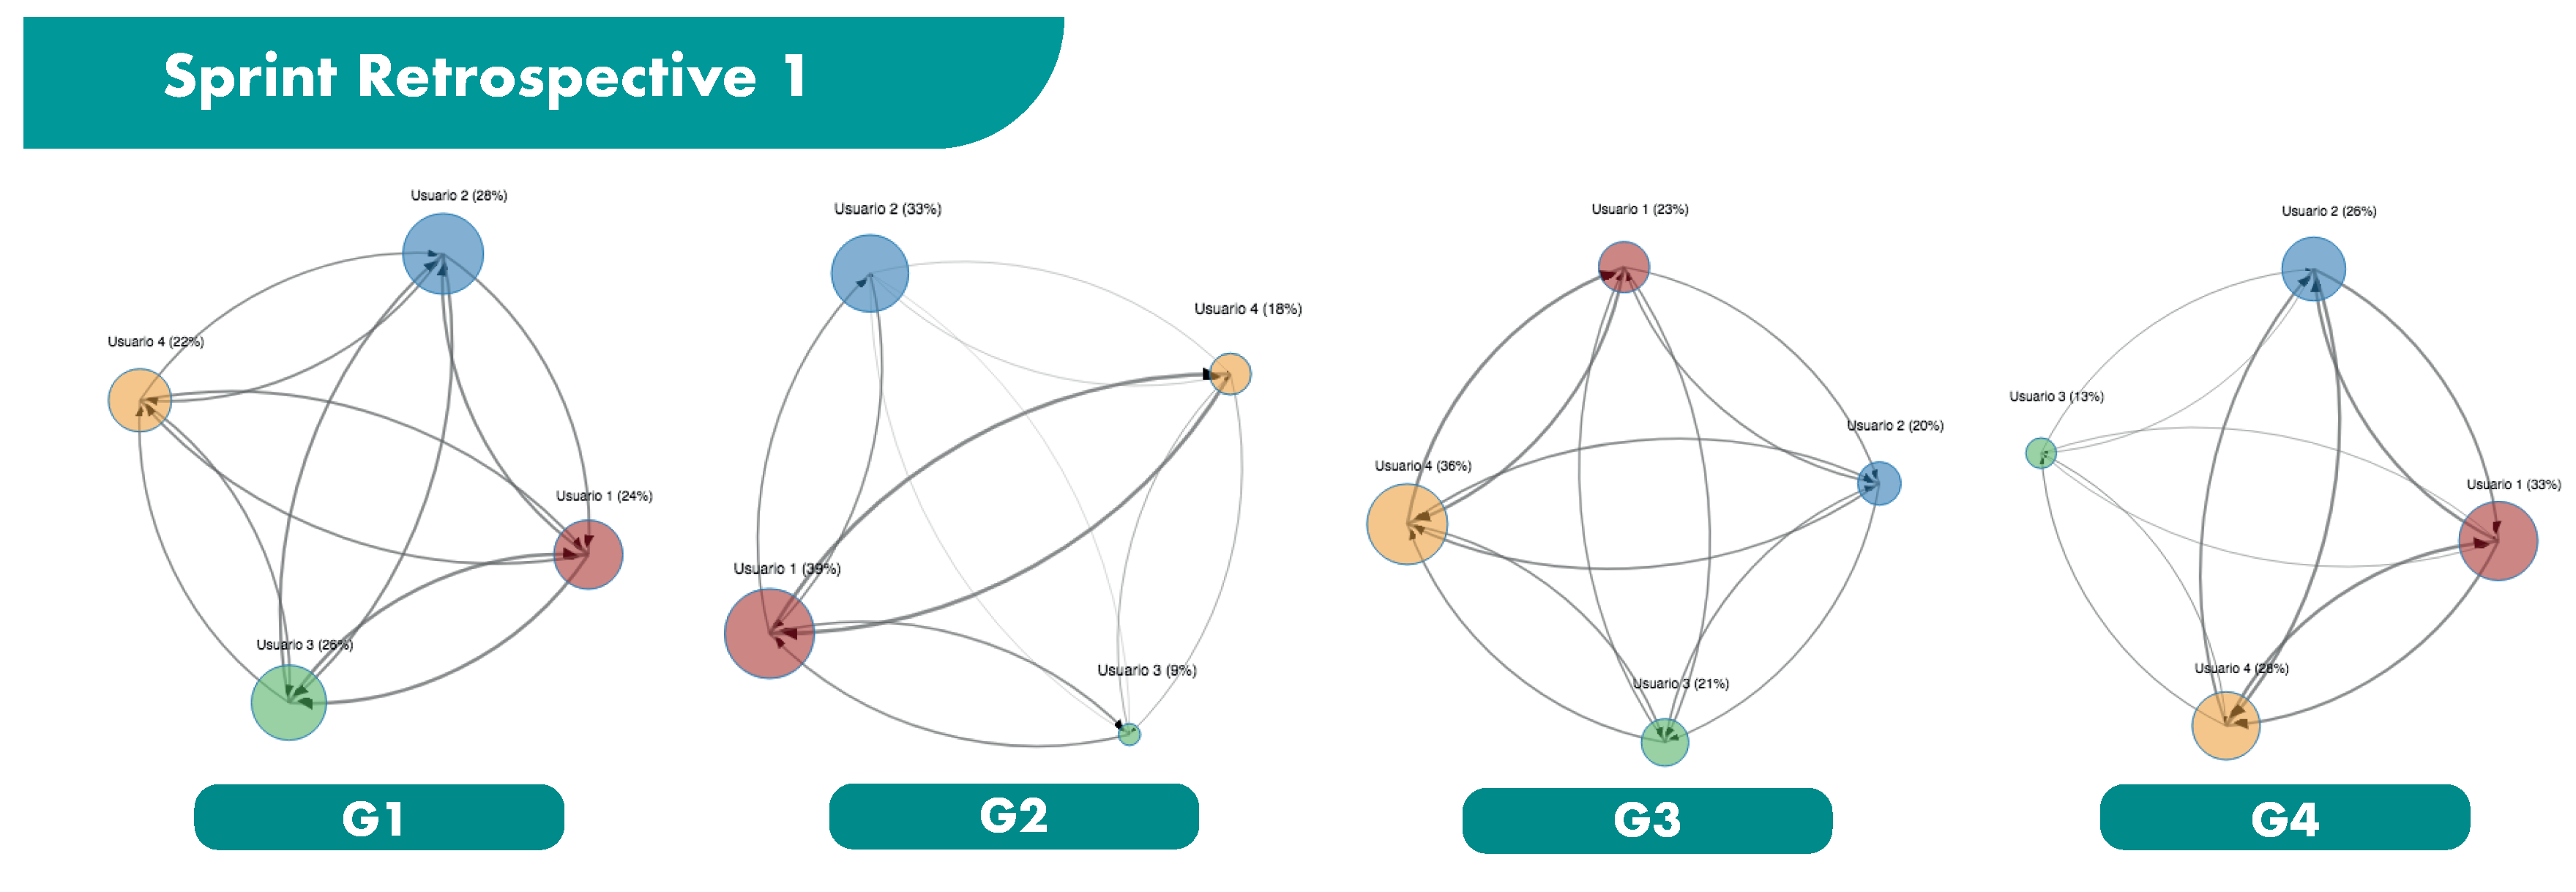
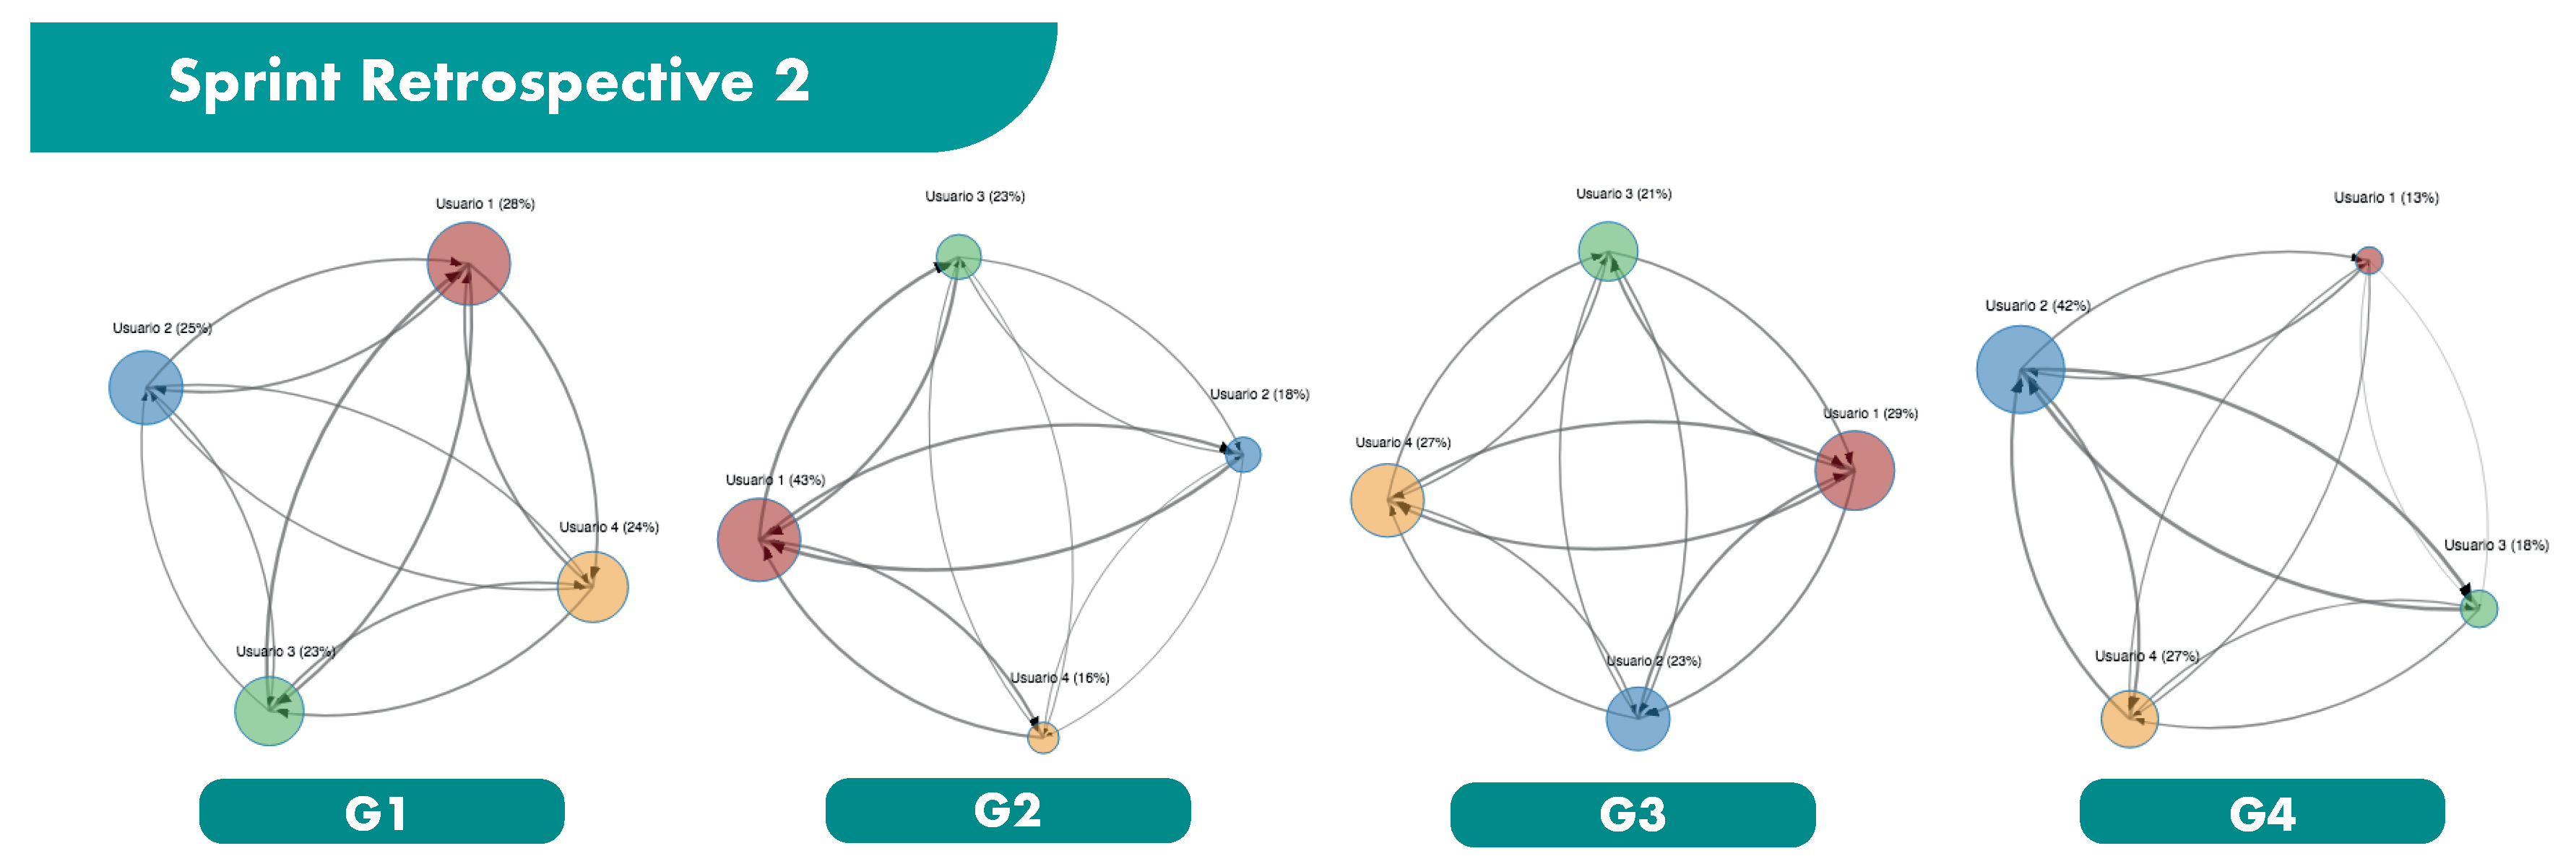
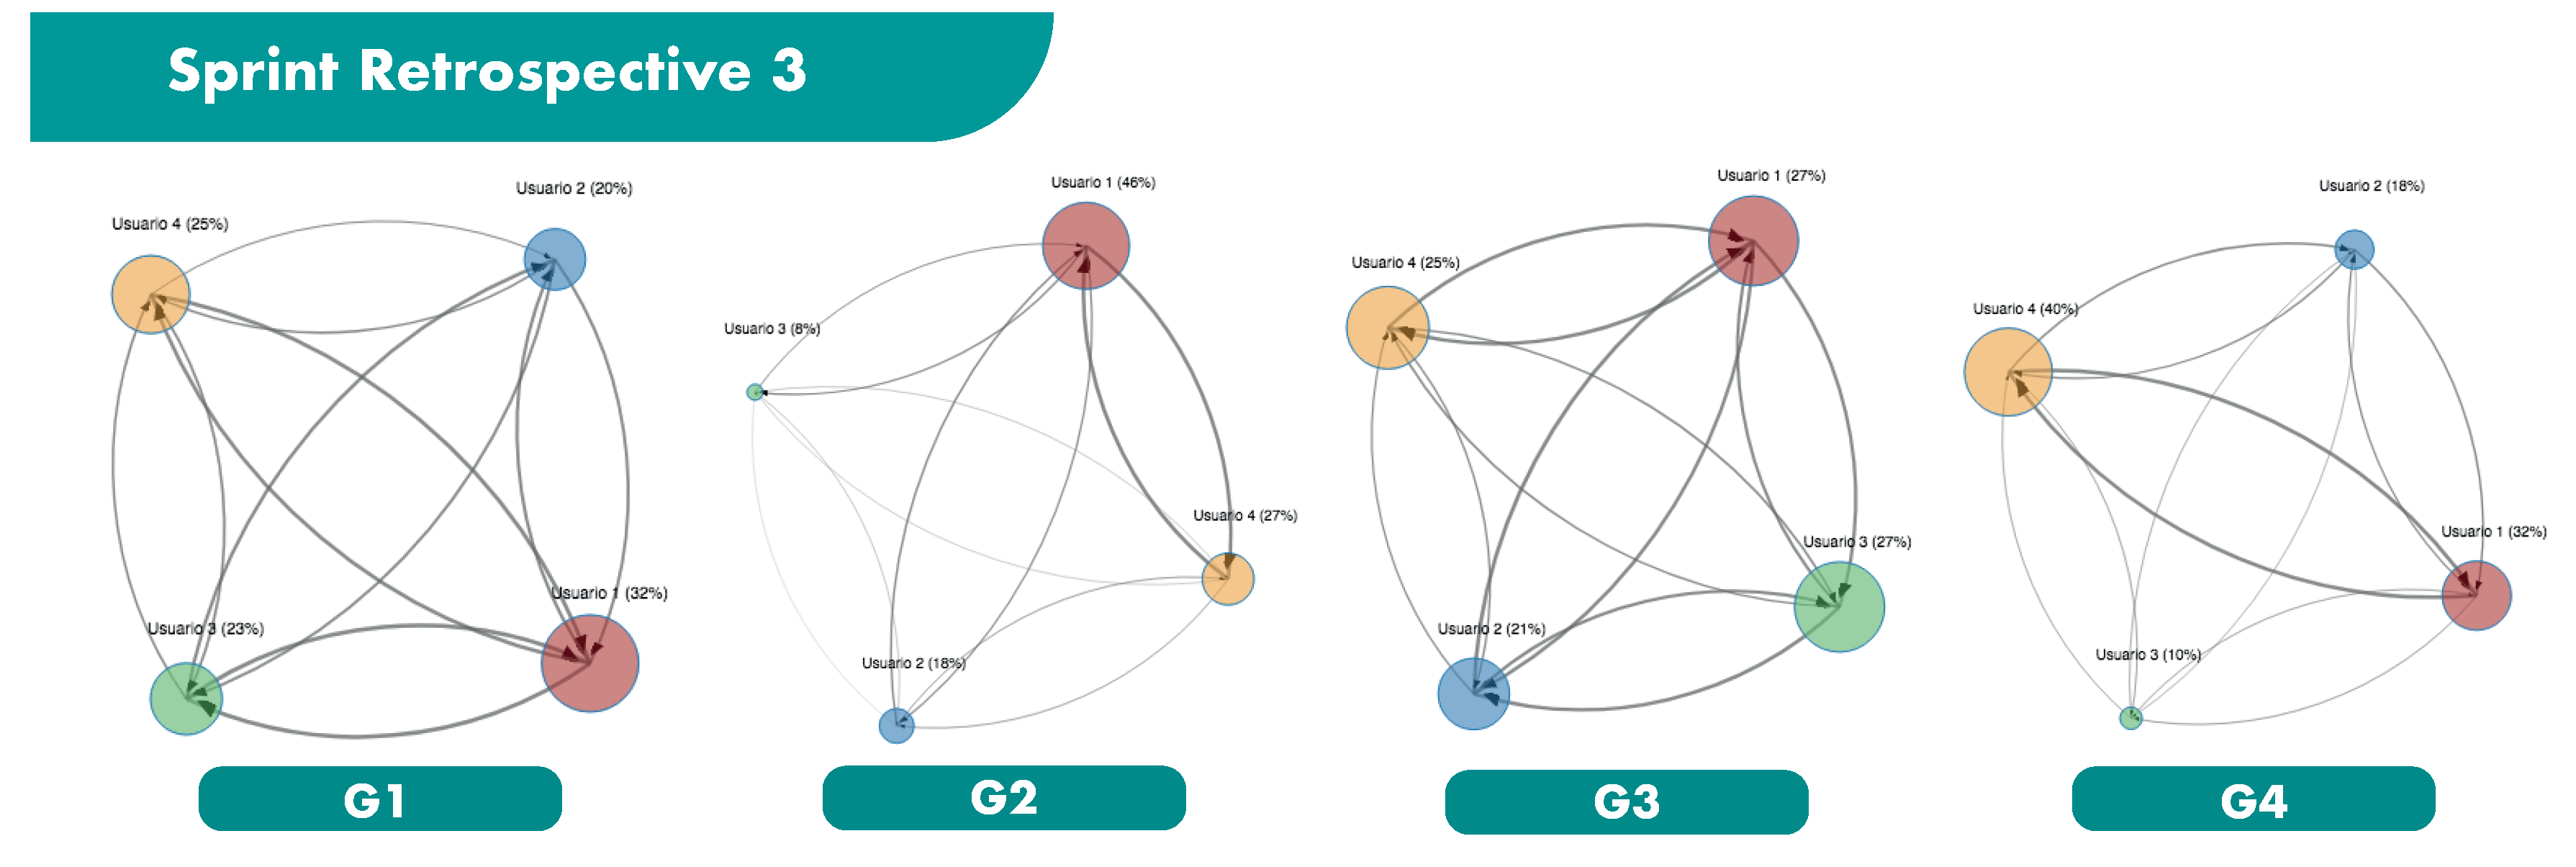
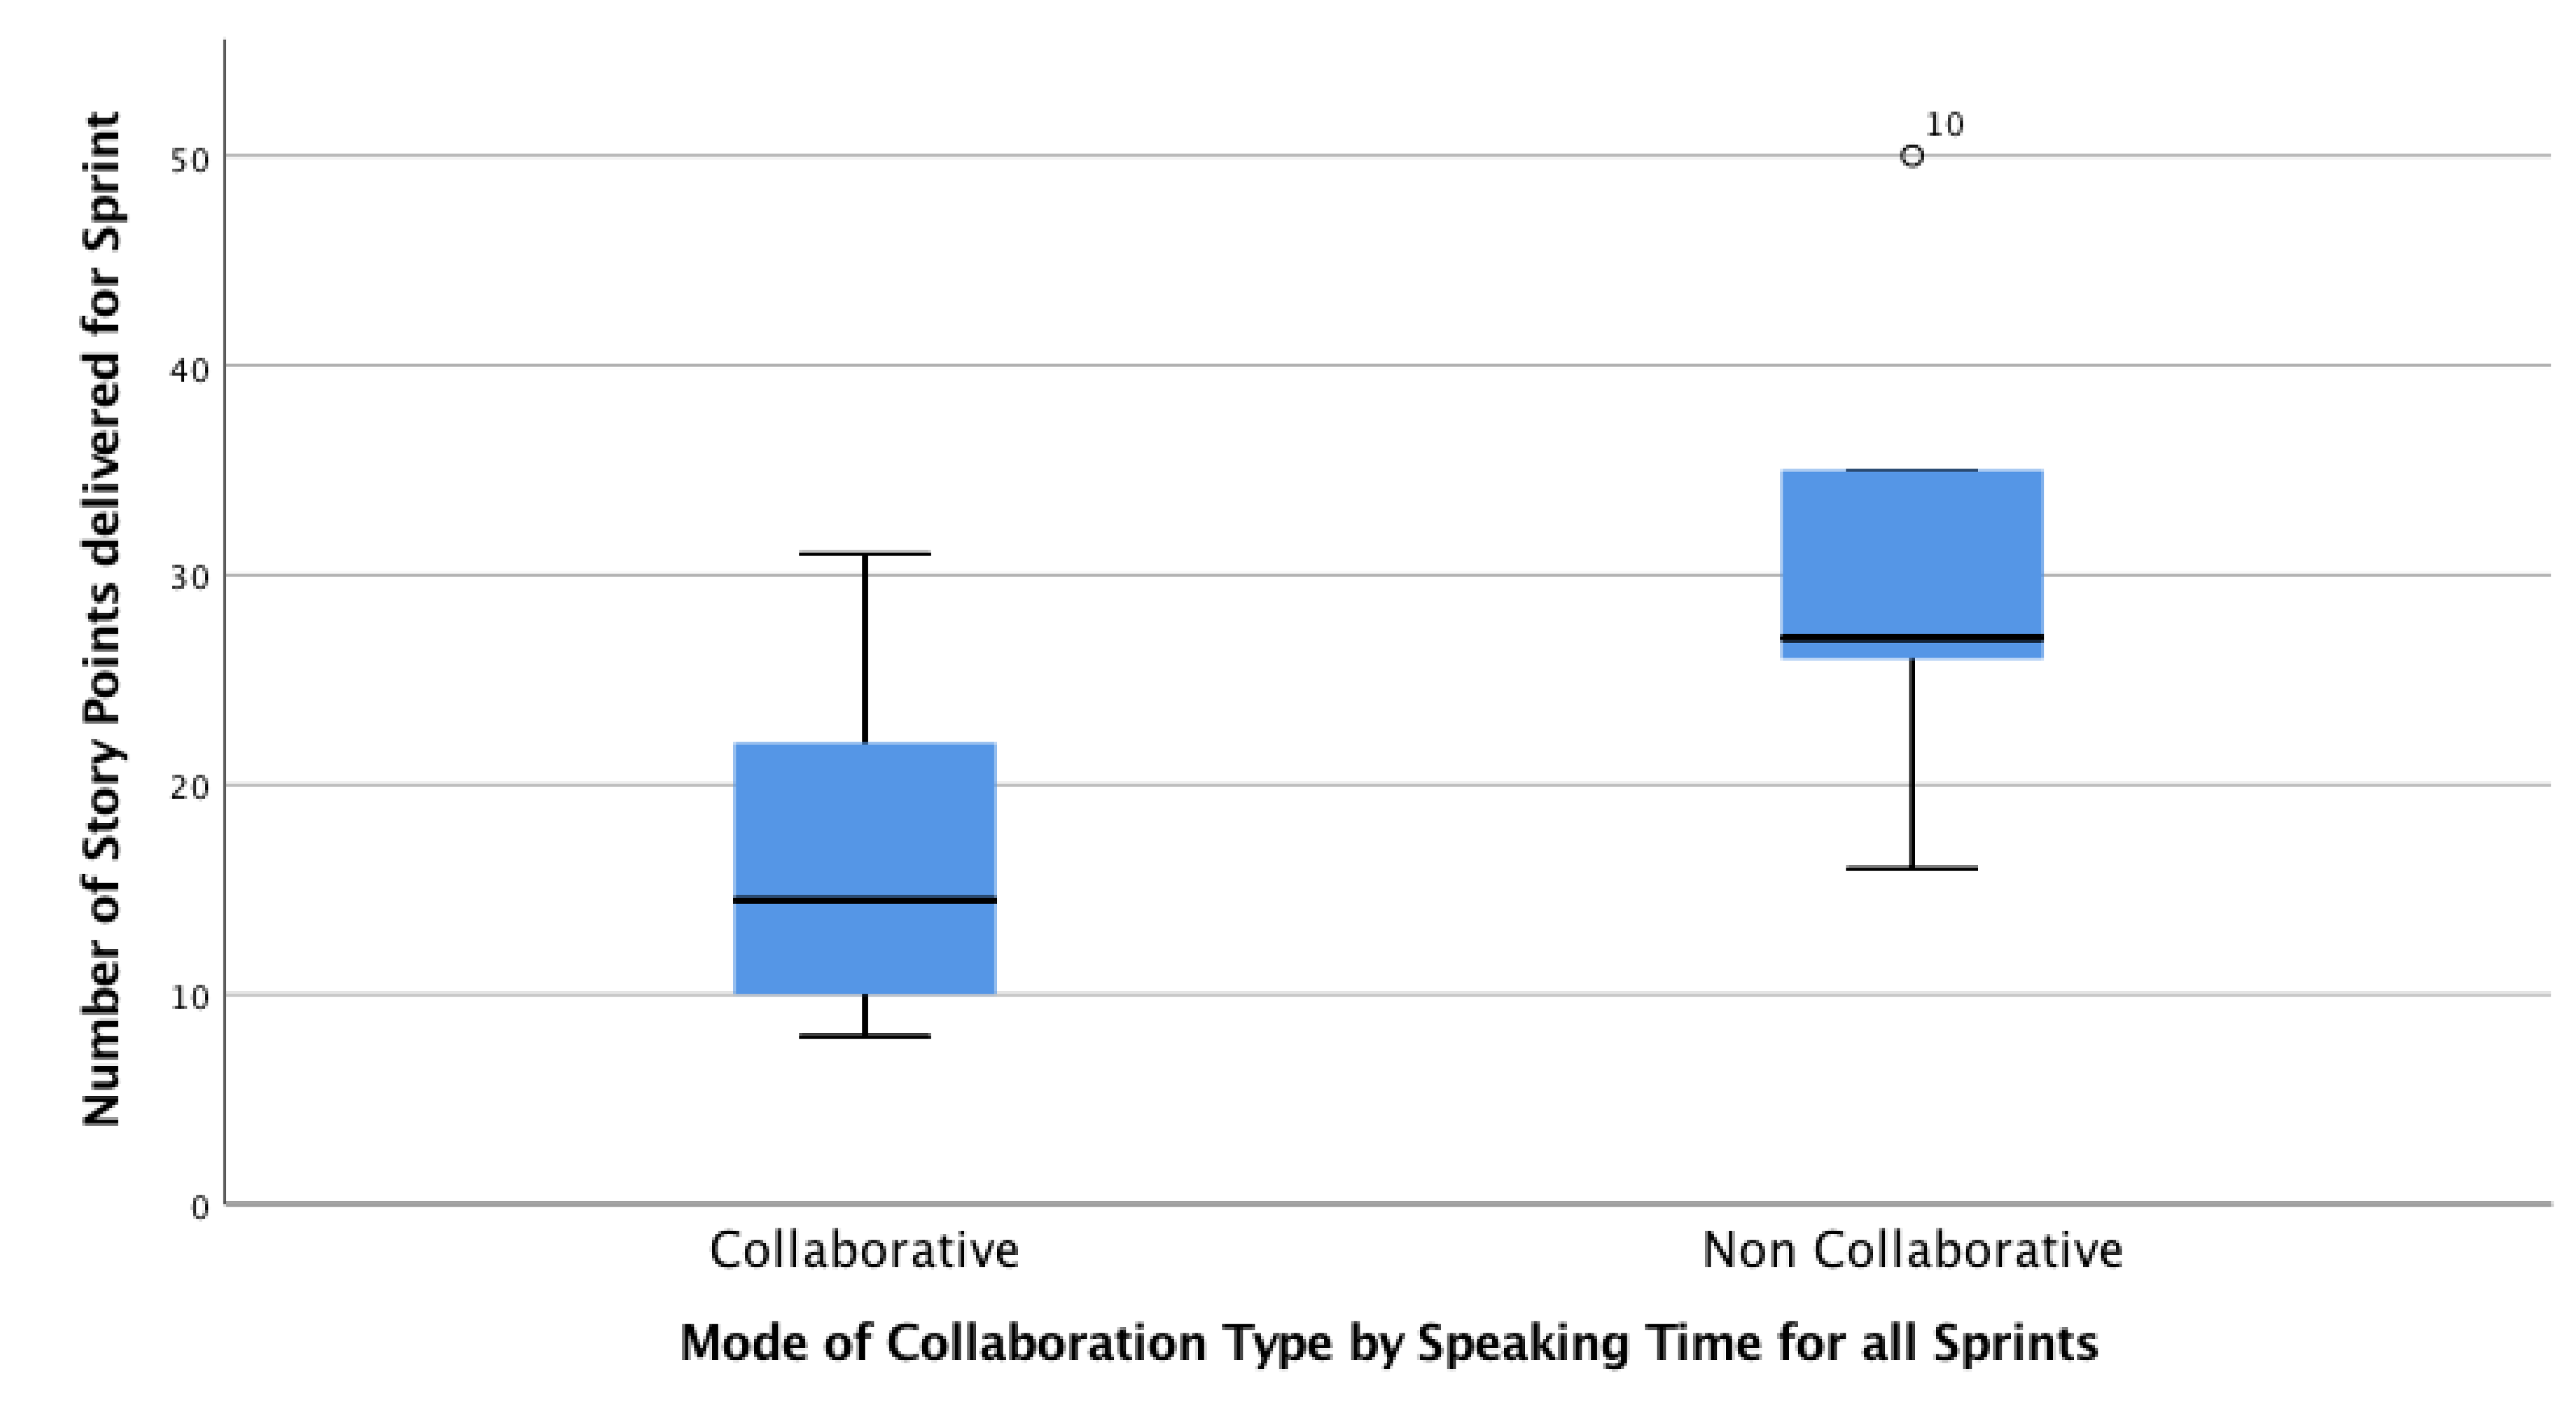
- Collaboration—Collaboration Type by Permanence (CTPer) and Prompting (CTProm): To characterize the collaboration between team members, we use the ReSpeaker data to perform Social Network Analysis and calculate Prompting and Permanence metrics, which yields to a collaboration type for each team. Prompting (calculated from the number of interactions of each team member) and prompting (calculated from the speaking time), were already used to measure collaboration in [5,28]. We labeled each sprint retrospective as Collaborative or Non-Collaborative. Also, we labeled the teams as collaborative if they are collaborative in two or more retrospectives, and non-collaborative in other cases.
- Predominant Personality Type (PPT): Using the DiSC® survey results of each member, a group will be characterized by the most repeated personality type among its members. If there is not a predominant type, it will be labeled as ”undefined”
- Predominant Leadership Style (PLS): Using the leadership survey results of each member, a group will be characterized by the most repeated leadership style among its members. If there is not a predominant type, it will be labeled as ”undefined”
3.4. Collaboration Data Analysis
- The permanence of i: , i.e., the speaking time of participant i regarding the total duration of the conversation.
- The prompting of i: , where , i.e., the number of times the author received comments from another interlocutor, regarding the total number of interventions during the entire conversation.
4. Results and Discussion
4.1. Qualitative Results
4.2. Quantitative Results
4.3. Analysis of the Research Questions
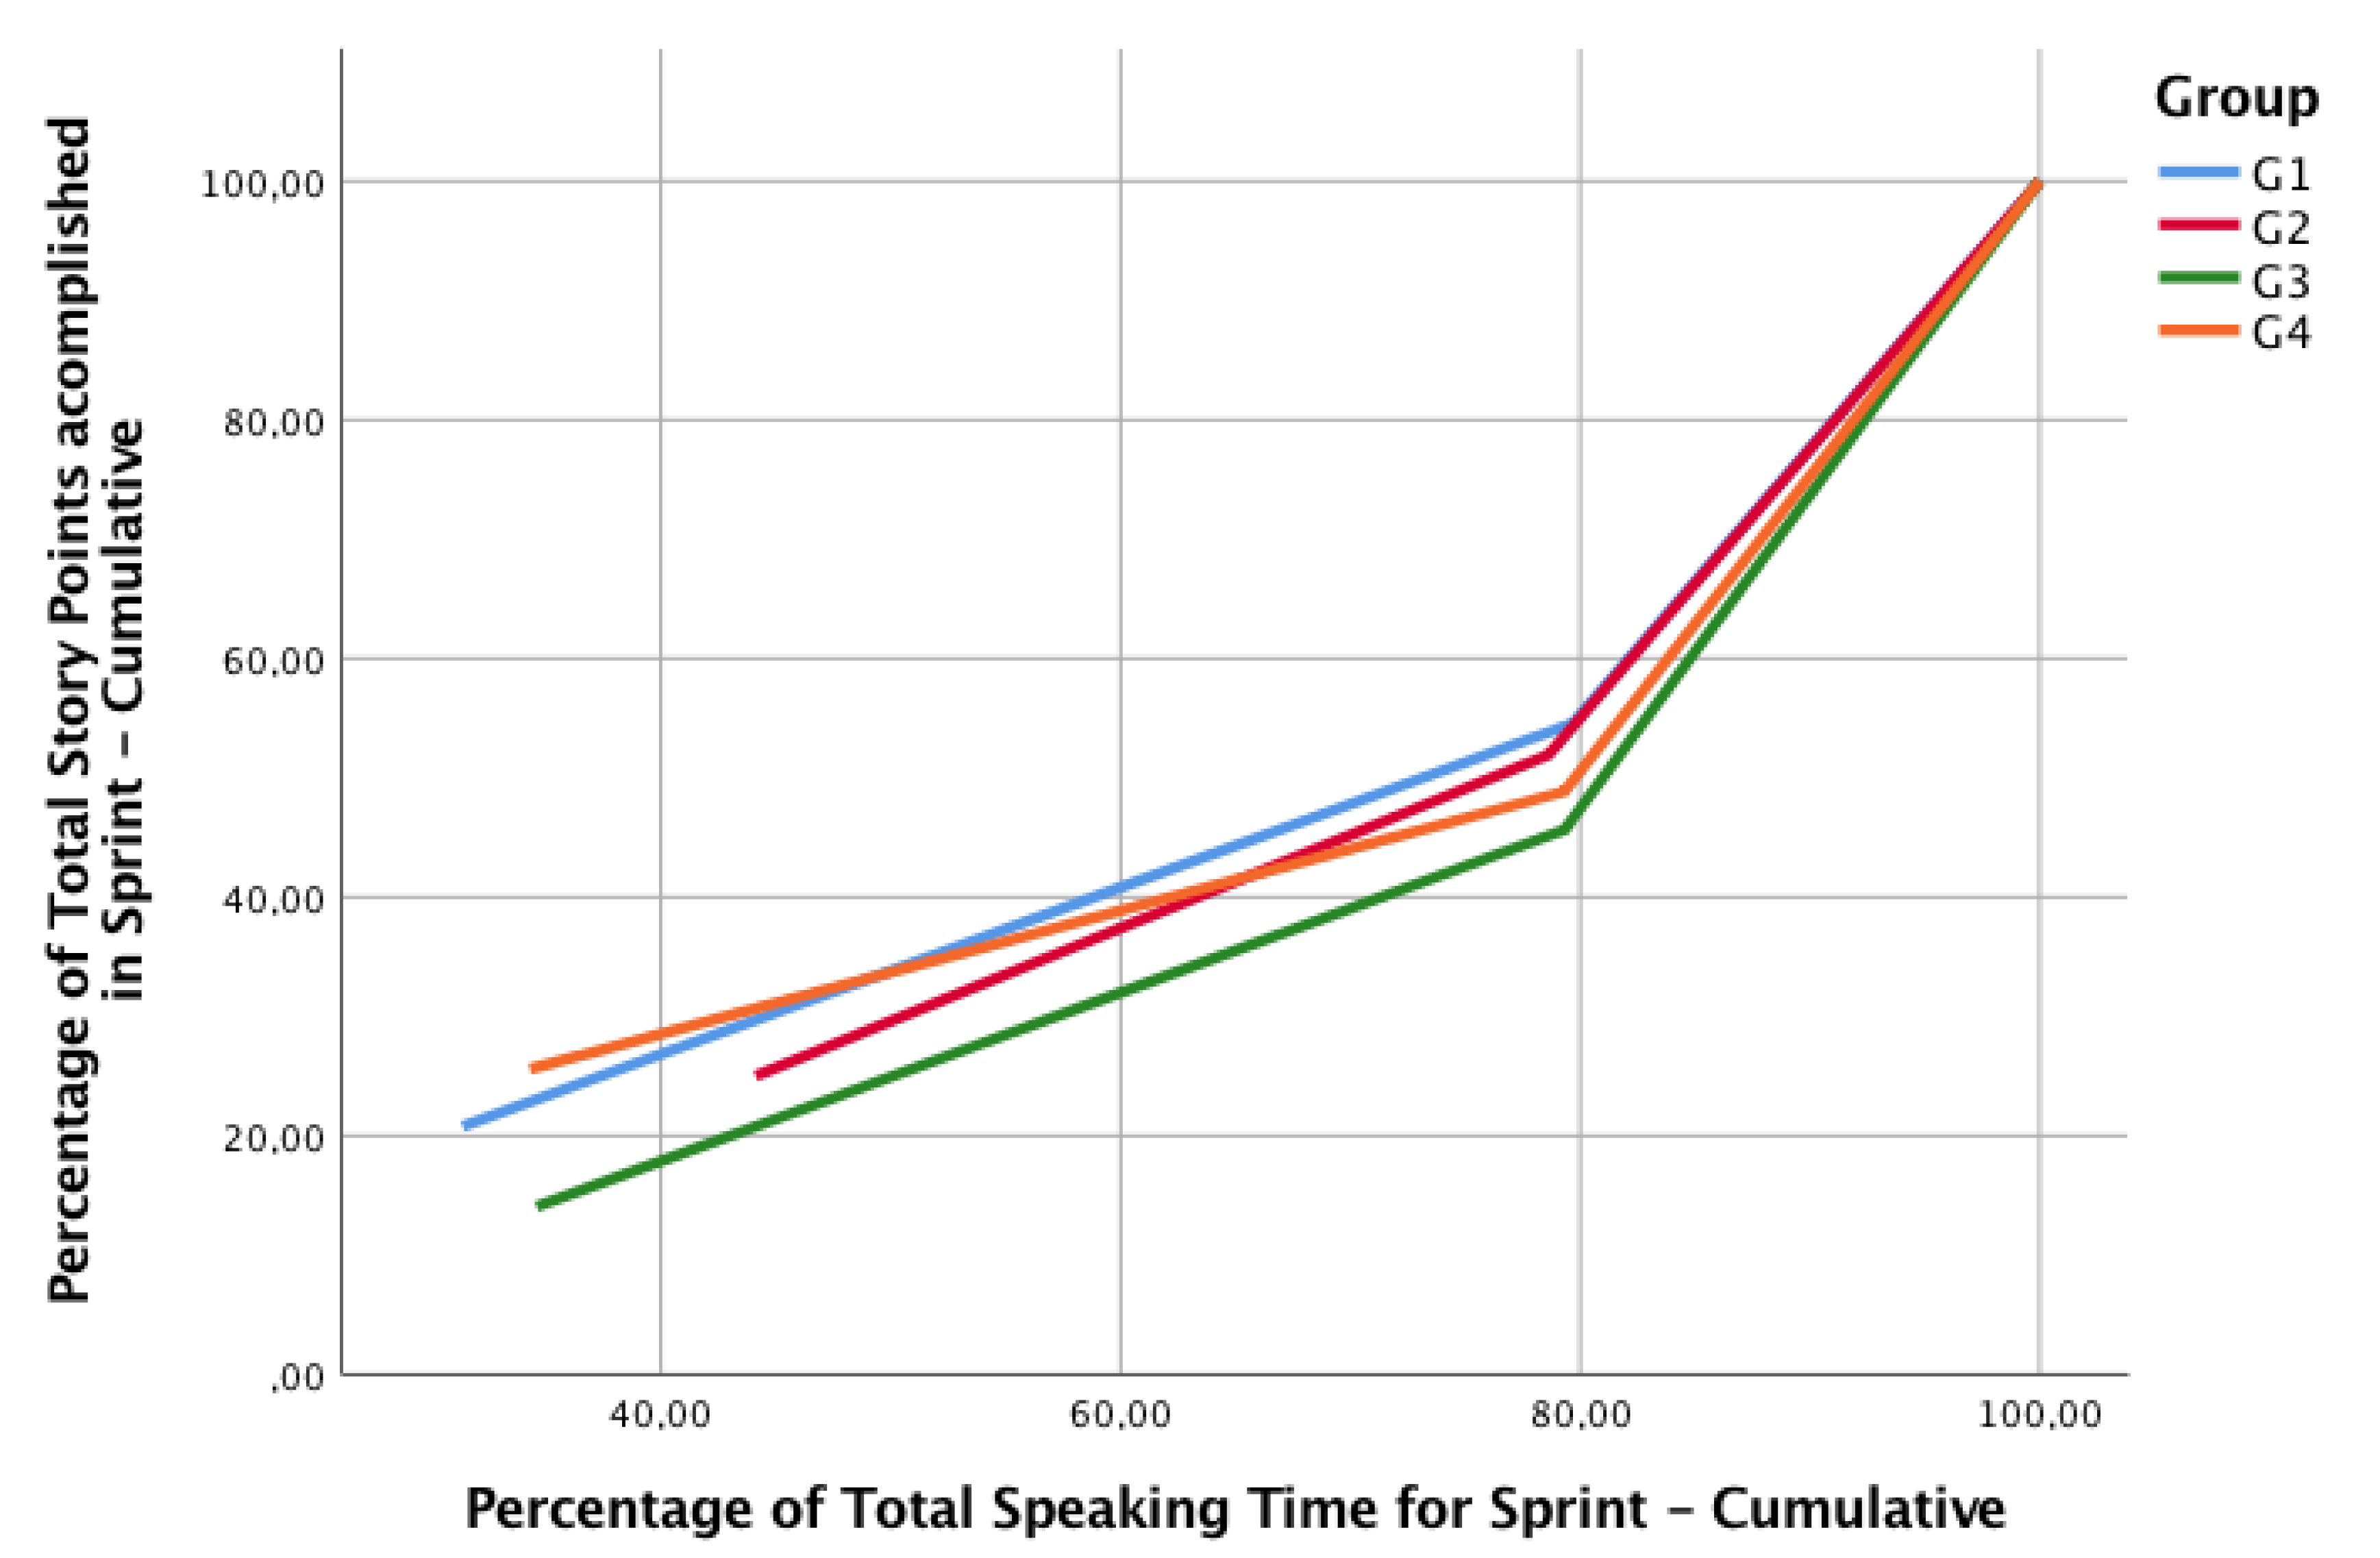
- RQ1: How does collaboration and communication relate to the productivity of agile teams? We theorize that a greater communication in retrospectives would yield to more productive sprints, this is, a greater improvement in productivity. In Figure 9 we represent the cumulative percentage of Speaking Time (ST) in each sprint, compared to the cumulative percentage of the total story points delivered in the sprint.
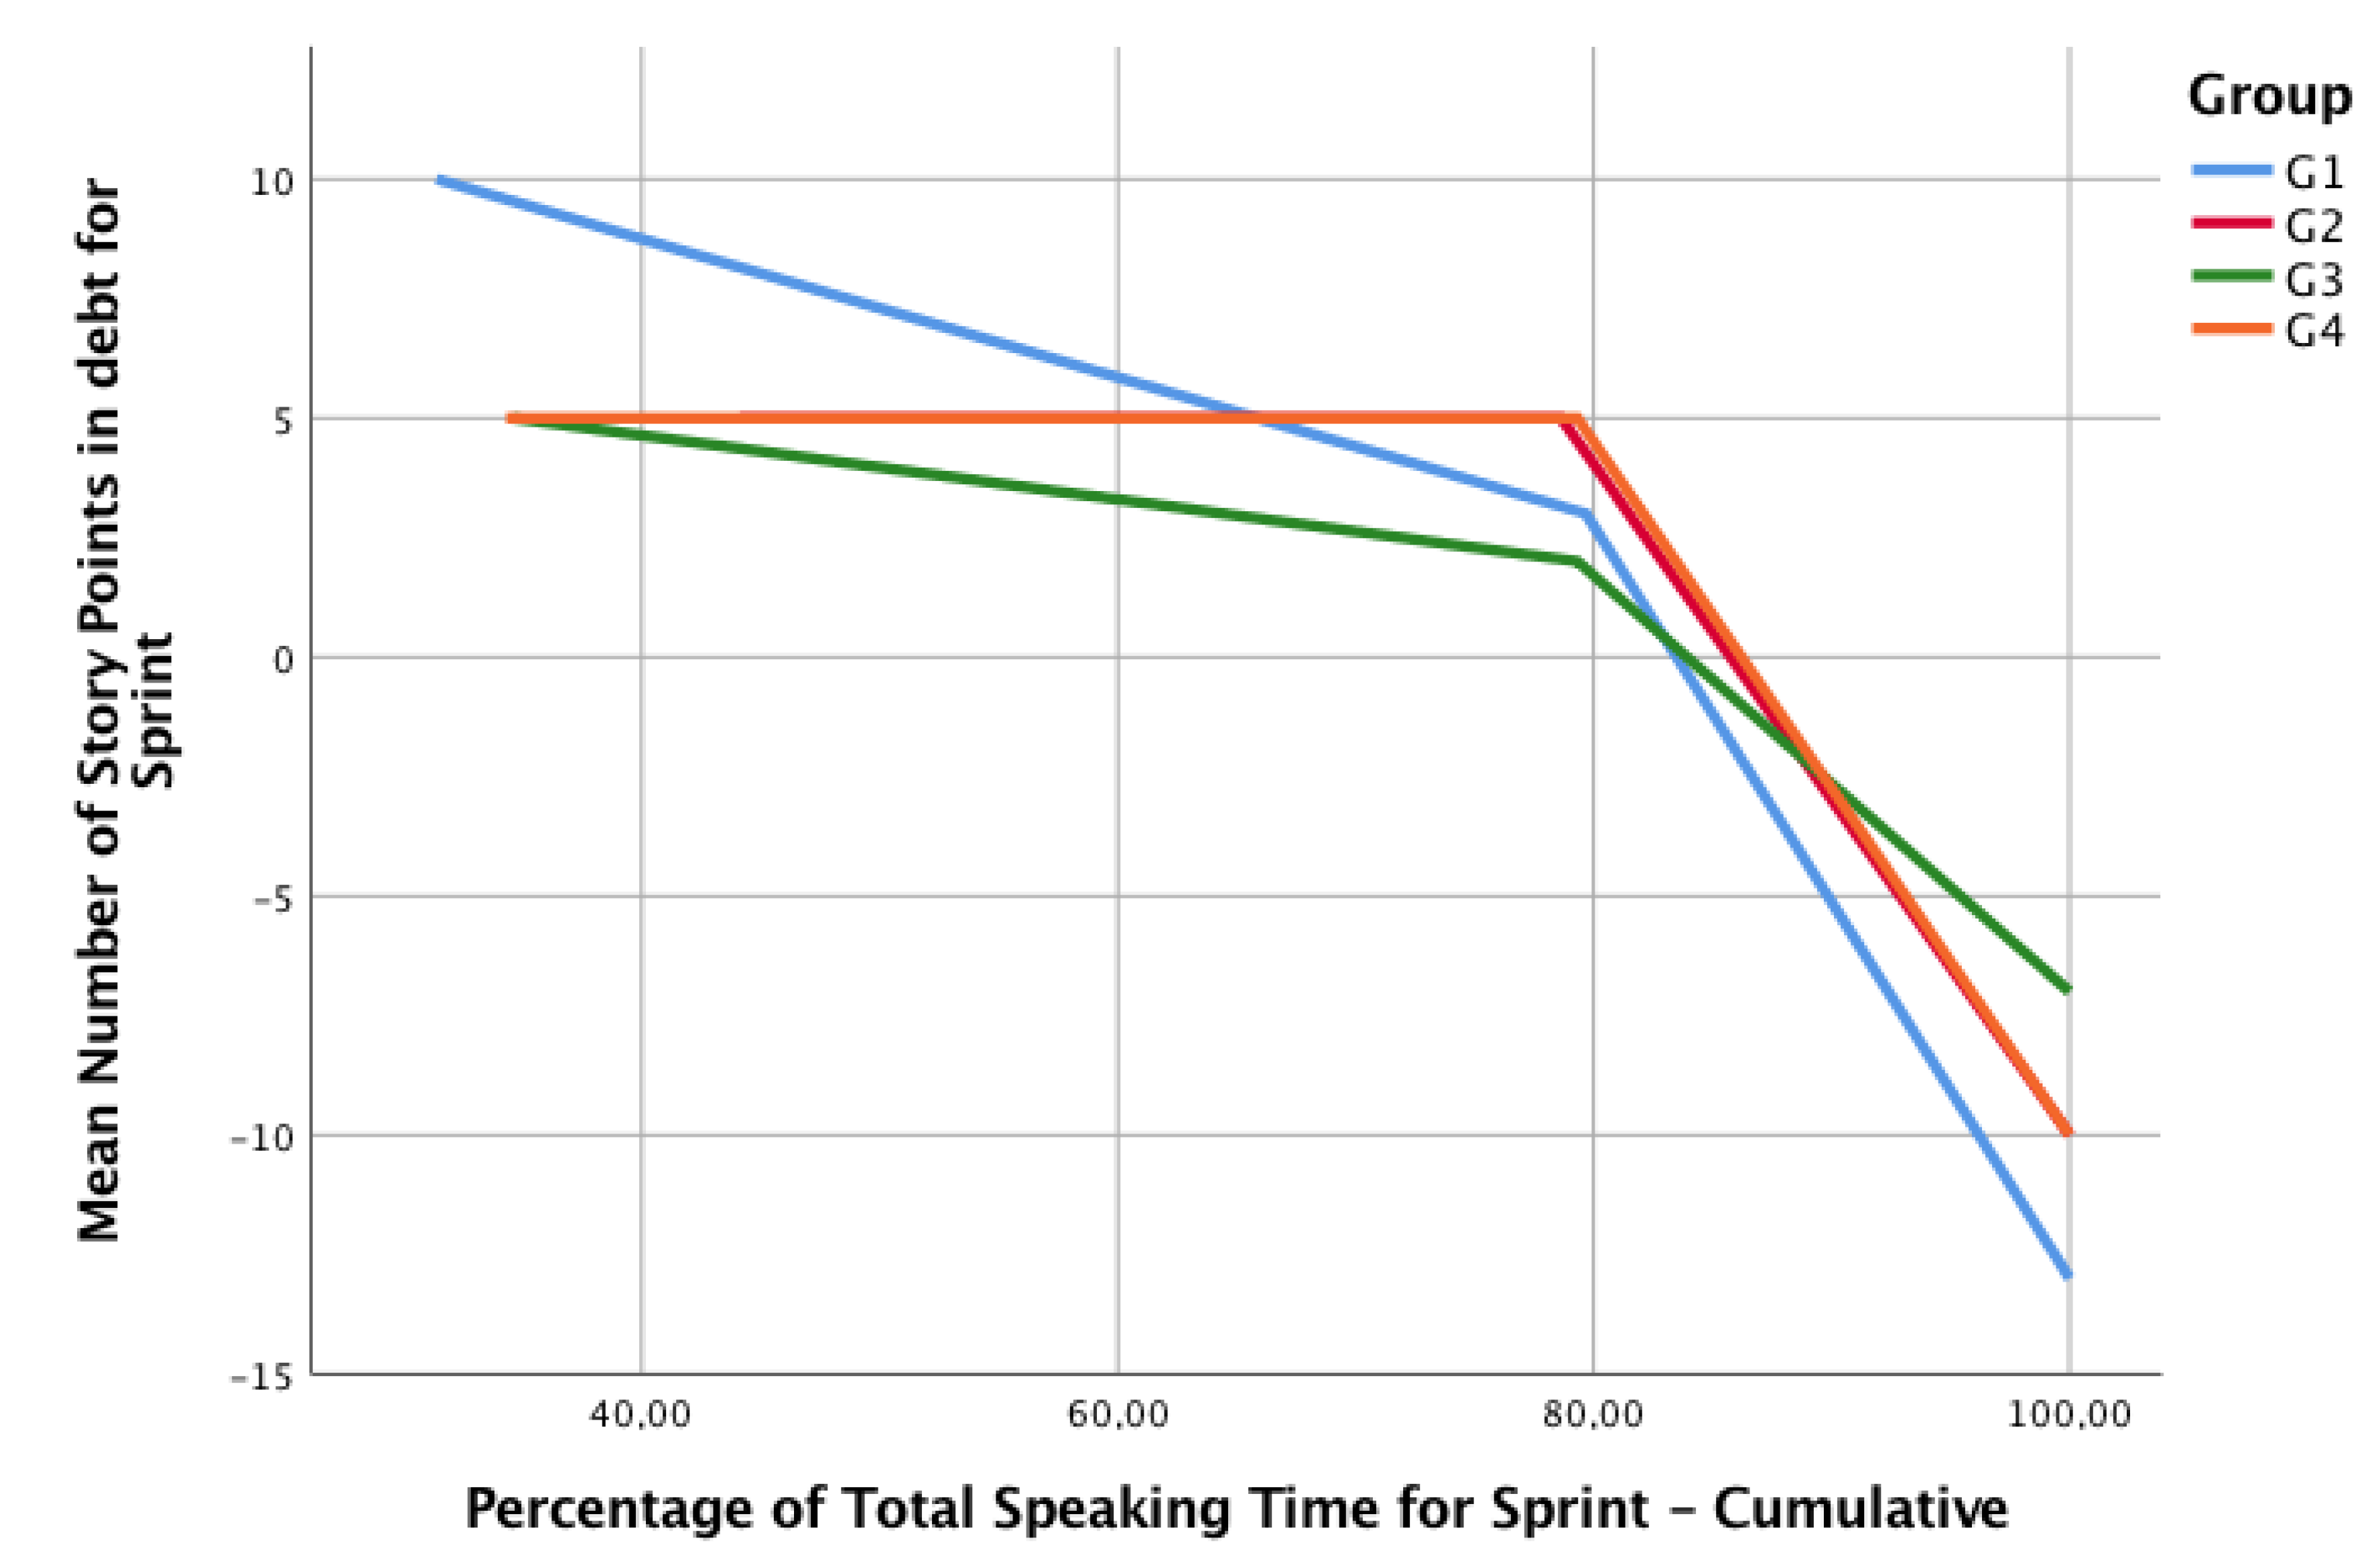
- RQ2: How does collaboration and communication relate to the estimation of complexity of each sprint?
- RQ3: What is the relationship between leadership and personality characteristics of agile team members, and the collaboration during the activity?
5. Conclusions
Author Contributions
Funding
Acknowledgments
Conflicts of Interest
References
- Voogt, J.; Roblin, N.P. A comparative analysis of international frameworks for 21st century competences: Implications for national curriculum policies. J. Curric. Stud. 2012, 44, 299–321. [Google Scholar] [CrossRef]
- Gokhale, A.A. Collaborative learning and critical thinking. Encycl. Sci. Learn. 2012, 634–636. [Google Scholar] [CrossRef]
- Worsley, M. Multimodal Learning Analytics’ Past, Present, and Potential Futures. In Proceedings of the Second Multimodal Learning Analytics Across (Physical and Digital) Spaces co-located with the 8th International Learning Analytics and Knowledge Conference, CrossMMLA@LAK 2018, CEUR Workshop Proceedings, Sydney, Australia, 6 March 2018; Martínez Maldonado, R., Echeverría, V., Prieto, L.P., Rodríguez-Triana, M.J., Spikol, D., Curukova, M., Mavrikis, M., Ochoa, X., Worsley, M., Eds.; Volume 2163. [Google Scholar]
- Drachsler, H.; Schneider, J. JCAL Special Issue on Multimodal Learning Analytics. J. Comput. Assist. Learn. 2018, 34, 335–337. [Google Scholar] [CrossRef]
- Riquelme, F.; Munoz, R.; Lean, R.M.; Villarroel, R.; Barcelos, T.S.; de Albuquerque, V.H.C. Using multimodal learning analytics to study collaboration on discussion groups: A social network approach. Univers. Access Inf. Soc. 2019. [Google Scholar] [CrossRef]
- Muñoz-Soto, R.; Villarroel, R.; Barcelos, T.S.; Souza, A.; Merino, E.; Guiñez, R.; Silva, L.A. Development of a Software that Supports Multimodal Learning Analytics: A Case Study on Oral Presentations. J. Univers. Comput. Sci. 2018, 24, 149–170. [Google Scholar]
- Redeker, C.; Leis, M.; Leendertse, M.; Punie, Y.; Gijsbers, G.; Kirschner, P.A.; Stoyanov, S.; Hoogveld, B. The Future of Learning: Preparing for Change; Eur—Scientific and Technical Research Reports; Publications Office of the European Union: Brussels, Belgium, 2011. [Google Scholar]
- Zenk, L.; Hynek, N.; Schreder, G.; Zenk, A.; Pausits, A.; Steiner, G. Designing Innovation Courses In Higher Education Using LEGO® SERIOUS PLAY®. Int. J. Manag. Appl. Res. 2018, 5, 245–263. [Google Scholar] [CrossRef]
- Albors Garrigos, J.; De Miguel Molina, M.; De Miguel Molina, B.; Segarra OÑA, M. Experiencias en el uso de la herramienta lego serious Play® en la Facultad de ADE. In Congreso IN-RED 2014; Editorial Universitat Politècnica de València: Valencia, Spain, 2014. [Google Scholar]
- Villamizar Acevedo, G.; González Ambrosio, J.E. El lego serious play como herramienta para solucionar problemas sociales. Estudio con alumnos de administración de empresas. Cult. Educ. Y Soc. 2015, 6, 1–166. [Google Scholar]
- Hyvönen, J. Creating shared understanding with lego serious play. Data Value Driven Softw. Eng. Deep Cust. Insight 2014, 36, 36–42. [Google Scholar]
- Schulz, K.P.; Geithner, S.; Woelfel, C.; Krzywinski, J. Toolkit-based modelling and serious play as means to foster creativity in innovation processes. Creat. Innov. Manag. 2015, 24, 323–340. [Google Scholar] [CrossRef]
- Campos, D.; Lima, R.M.; Fernandes, J.M. Identification and Assessment of Behavioural Competences in Multidisciplinary Teams within Design Projects; Technical Report; Universidade do Minho: Braga, Portugal, 2012. [Google Scholar]
- Grienitz, V.; Schmidt, A.M. Scenario workshops for strategic management with Lego® Serious Play®. Probl. Manag. 21st Century 2012, 3, 26–34. [Google Scholar]
- Dempsey, M.; Riedel, R.; Kelly, M. Serious Play as a method for process design. In Proceedings of the IFIP International Conference on Advances in Production Management Systems, Ajaccio, France, 20–24 September 2014; Springer: Berlin/Heidelberg, Germany, 2014; pp. 395–402. [Google Scholar]
- Kurkovsky, S. Teaching Software Engineering with LEGO Serious Play. In Proceedings of the 2015 ACM Conference on Innovation and Technology in Computer Science Education, ITiCS 2015, Vilnius, Lithuania, 4–8 July 2015; Dagiene, V., Schulte, C., Jevsikova, T., Eds.; pp. 213–218. [Google Scholar] [CrossRef]
- Schwaber, K.; Beedle, M. Agile Software Development with Scrum; Prentice Hall: Upper Saddle River, NJ, USA, 2002; Volume 1. [Google Scholar]
- Beck, K.; Gamma, E. Extreme Programming Explained: Embrace Change; Addison-Wesley Professional: Boston, MA, USA, 2000. [Google Scholar]
- Masood, Z.; Hoda, R.; Blincoe, K. Adapting agile practices in university contexts. J. Syst. Softw. 2018, 144, 501–510. [Google Scholar] [CrossRef]
- Chassidim, H.; Almog, D.; Mark, S. Fostering soft skills in project-oriented learning within an agile atmosphere. Eur. J. Eng. Educ. 2018, 43, 638–650. [Google Scholar] [CrossRef]
- Shim, C.Y.; Choi, M.; Kim, J.Y. Promoting collaborative learning in software engineering by adapting the pbl strategy. World Acad. Sci. Eng. Technol. 2009, 3, 1157–1160. [Google Scholar]
- Melo, C.D.O.; Cruzes, D.S.; Kon, F.; Conradi, R. Interpretative case studies on agile team productivity and management. Inf. Softw. Technol. 2013, 55, 412–427. [Google Scholar] [CrossRef]
- Chau, T.; Maurer, F.; Melnik, G. Knowledge Sharing: Agile Methods vs Tayloristic Methods. In Proceedings of the 12th IEEE International Workshops on Enabling Technologies (WETICE 2003), Infrastructure for Collaborative Enterprises, Linz, Austria, 9–11 June 2003; pp. 302–307. [Google Scholar] [CrossRef]
- Derby, E.; Larsen, D.; Schwaber, K. Agile Retrospectives: Making Good Teams Great; Pragmatic Bookshelf: Raleigh, NC, USA, 2006. [Google Scholar]
- Lego4scrum. Available online: http://www.lego4scrum.com/ (accessed on 22 June 2019).
- Oviatt, S. Problem solving, domain expertise and learning: Ground-truth performance results for math data corpus. In Proceedings of the 2013 International Conference on Multimodal Interaction, ICMI ’13, Sydney, NSW, Australia, 9–13 December 2013; Epps, J., Chen, F., Oviatt, S., Mase, K., Sears, A., Jokinen, K., Schuller, B.W., Eds.; pp. 569–574. [Google Scholar] [CrossRef]
- Grover, S.; Bienkowski, M.A.; Tamrakar, A.; Siddiquie, B.; Salter, D.A.; Divakaran, A. Multimodal analytics to study collaborative problem solving in pair programming. In Proceedings of the Sixth International Conference on Learning Analytics & Knowledge, LAK 2016, Edinburgh, UK, 25–29 April 2016; Gasevic, D., Lynch, G., Dawson, S., Drachsler, H., Rosé, C.P., Eds.; pp. 516–517. [Google Scholar] [CrossRef]
- Noel, R.; Riquelme, F.; Lean, R.M.; Merino, E.; Cechinel, C.; Barcelos, T.S.; Villarroel, R.; Munoz, R. Exploring Collaborative Writing of User Stories With Multimodal Learning Analytics: A Case Study on a Software Engineering Course. IEEE Access 2018, 6, 67783–67798. [Google Scholar] [CrossRef]
- Spikol, D.; Ruffaldi, E.; Dabisias, G.; Cukurova, M. Supervised machine learning in multimodal learning analytics for estimating success in project-based learning. J. Comput. Assist. Learn. 2018, 34, 366–377. [Google Scholar] [CrossRef]
- Dillenbourg, P. What Do You Mean by Collaborative Learning? Elsevier: Oxford, UK, 1999; pp. 1–19. [Google Scholar]
- Gupta, M.L. Enhancing student performance through cooperative learning in physical sciences. Assess. Eval. High. Educ. 2004, 29, 63–73. [Google Scholar] [CrossRef]
- Vermette, P.J. Cooperative Learning Teams: Eight Suggestions for the Novice User. Clear. House A J. Educ. Strateg. Issues Ideas 1995, 68, 278–281. [Google Scholar] [CrossRef]
- Lucini, F.G.; Mascarague, C. Hacer Reforma: Temas Transversales y Areas Curriculares; Anaya: Madrid, Spain, 1999. [Google Scholar]
- Johnson, D.W.; Johnson, R.T. Cooperative learning and social interdependence theory. In Theory and Research on Small Groups; Springer: Berlin, Germany, 2002; pp. 9–35. [Google Scholar]
- Spikol, D.; Prieto, L.P.; Rodríguez-Triana, M.J.; Worsley, M.; Ochoa, X.; Cukurova, M. Current and future multimodal learning analytics data challenges. In Proceedings of the Seventh International Learning Analytics & Knowledge Conference, Vancouver, BC, Canada, 13–17 March 2017; Hatala, M., Wis, A., Winne, P., Lynch, G., Ochoa, X., Molenaar, I., Dawson, S., Shehata, S., Tan, J.P., Eds.; pp. 518–519. [Google Scholar]
- Spikol, D.; Ruffaldi, E.; Landolfi, L.; Cukurova, M. Estimation of success in collaborative learning based on multimodal learning analytics features. In Proceedings of the 2017 IEEE 17th International Conference on Advanced Learning Technologies (ICALT), Timisoara, Romania, 3–7 July 2017; pp. 269–273. [Google Scholar]
- Felder, R.M.; Brent, R. Cooperative Learning. In Active Learning; American Chemical Society: Washington, DC, USA, 2007; Chapter 4; pp. 34–53. [Google Scholar]
- Blikstein, P.; Worsley, M. Multimodal Learning Analytics and Education Data Mining: Using computational technologies to measure complex learning tasks. J. Learn. Anal. 2016, 3, 220–238. [Google Scholar] [CrossRef]
- Ochoa, X. Multimodal Learning Analytics. In The Handbook of Learning Analytics; Lang, C., Siemens, G., Wise, A., Gašević, D., Eds.; Society for Learning Analytics Research: Beaumont, AB, Canada, 2017; Chapter 11; pp. 129–141. [Google Scholar] [Green Version]
- Raca, M.; Tormey, R.; Dillenbourg, P. Sleepers’ lag—Study on motion and attention. In Proceedings of the Learning Analytics and Knowledge Conference 2014, LAK ’14, Indianapolis, IN, USA, 24–28 March 2014; Pistilli, M.D., Willis, J., Koch, D., Arnold, K.E., Teasley, S.D., Pardo, A., Eds.; pp. 36–43. [Google Scholar] [CrossRef]
- Echeverría, V.; Avendaño, A.; Chiluiza, K.; Vásquez, A.; Ochoa, X. Presentation Skills Estimation Based on Video and Kinect Data Analysis. In Proceedings of the 2014 ACM Workshop on Multimodal Learning Analytics Workshop and Grand Challenge, Istanbul, Turkey, 12 November 2014; ACM: New York, NY, USA, 2014; pp. 53–60. [Google Scholar] [CrossRef]
- Roque, F.; Cechinel, C.; Muñoz, R.; Lemos, R.; Merino, E.; Acevedo, R.V. Evolução das posturas corporais de estudantes em apresentações de seminários ao longo do semestre: Uma análise utilizando dados multimodais e técnicas de clusterização. In Anais do XXIX Simpósio Brasileiro de Informática na Educação (SBIE 2018); Brazilian Computer Society (Sociedade Brasileira de Computação—SBC): Porto Alegre, Brazil, 2018. [Google Scholar]
- Luz, S. Automatic identification of experts and performance prediction in the multimodal math data corpus through analysis of speech interaction. In Proceedings of the 2013 International Conference on Multimodal Interaction, ICMI ’13, Sydney, NSW, Australia, 9–13 December 2013; Epps, J., Chen, F., Oviatt, S., Mase, K., Sears, A., Jokinen, K., Schuller, B.W., Eds.; pp. 575–582. [Google Scholar] [CrossRef]
- Chua, Y.H.V.; Rajalingam, P.; Tan, S.C.; Dauwels, J. EduBrowser: A Multimodal Automated Monitoring System for Co-located Collaborative Learning. In Communications in Computer and Information Science; Springer International Publishing: Basel, Switzerland, 2019; pp. 125–138. [Google Scholar]
- Shankar, S.K.; Prieto, L.P.; Rodriguez-Triana, M.J.; Ruiz-Calleja, A. A Review of Multimodal Learning Analytics Architectures. In Proceedings of the 2018 IEEE 18th International Conference on Advanced Learning Technologies (ICALT), Mumbai, India, 9–13 July 2018. [Google Scholar] [CrossRef]
- Liu, R.; Stamper, J.; Davenport, J.; Crossley, S.; McNamara, D.; Nzinga, K.; Sherin, B. Learning linkages: Integrating data streams of multiple modalities and timescales. J. Comput. Assist. Learn. 2018, 35, 99–109. [Google Scholar] [CrossRef] [Green Version]
- Schneider, B.; Blikstein, P. Unraveling students’ interaction around a tangible interface using multimodal learning analytics. J. Educ. Data Min. 2015, 7, 89–116. [Google Scholar]
- Scherer, S.; Weibel, N.; Morency, L.P.; Oviatt, S. Multimodal prediction of expertise and leadership in learning groups. In Proceedings of the 1st International Workshop on Multimodal Learning Analytics—MLA12, Santa Monica, CA, USA, 26 October 2012. [Google Scholar] [CrossRef]
- Reilly, J.M.; Ravenell, M.; Schneider, B. Exploring Collaboration Using Motion Sensors and Multi-Modal Learning Analytics. In Proceedings of the International Educational Data Mining Society 2018, Raleigh, NC, USA, 16–20 July 2018. [Google Scholar]
- Cornide-Reyes, H.; Campillay, S.; Alfaro, A.; Villarroel, R. Identification of Skills for the Formation of Agile High Performance Teams: A Systematic Mapping. In Advances in Intelligent Systems and Computing; Springer International Publishing: Basel, Switzerland, 2018; pp. 141–152. [Google Scholar]
- Steghöfer, J.P.; Burden, H.; Alahyari, H.; Haneberg, D. No silver brick: Opportunities and limitations of teaching Scrum with Lego workshops. J. Syst. Softw. 2017, 131, 230–247. [Google Scholar] [CrossRef]
- Runeson, P.; Höst, M. Guidelines for conducting and reporting case study research in software engineering. Empir. Softw. Eng. 2009, 14, 131–164. [Google Scholar] [CrossRef]
- Melo, C.D.; Santos, V.A.; Katayama, E.T.; Corbucci, H.; Prikladnicki, R.; Goldman, A.; Kon, F. The evolution of agile software development in Brazil - Education, research, and the state-of-the-practice. J. Braz. Comput. Soc. 2013, 19, 523–552. [Google Scholar] [CrossRef]
- Rodríguez, P.; Markkula, J.; Oivo, M.; Turula, K. Survey on agile and lean usage in finnish software industry. In Proceedings of the 2012 ACM-IEEE International Symposium on Empirical Software Engineering and Measurement, ESEM ’12, Lund, Sweden, 19–20 September 2012; Runeson, P., Höst, M., Mendes, E., Andrews, A.A., Harrison, R., Eds.; pp. 139–148. [Google Scholar] [CrossRef]
- Diel, E.; Bergmann, M.; Marczak, S.; Luciano, E. What is agile, which practices are used, and which skills are necessary according to brazilian professionals: Findings of an initial survey. In Proceedings of the IEEE 2015 6th Brazilian Workshop on Agile Methods (WBMA), Pernambuco, Brazil, 22 October 2015; pp. 18–24. [Google Scholar] [CrossRef]
- González-Morales, D.; De Antonio, L.M.M.; García, J.L.R. Teaching “Soft” skills in software engineering. In Proceedings of the 2011 IEEE Global Engineering Education Conference (EDUCON), Amman, Jordan, 4–6 April 2011; pp. 630–637. [Google Scholar] [CrossRef]
- Straub, J.; Kerlin, S.; Whalen, D. Teaching software project management using project based learning (PBL) and group projects. In Proceedings of the IEEE International Conference on Electro Information Technology, EIT 2017, Lincoln, NE, USA, 14–17 May 2017; pp. 16–21. [Google Scholar] [CrossRef]
- Marsden, W. Emotions of Normal People; Routledge: Abingdon, UK, 1928. [Google Scholar]
- Robson, C. Real World Research; Wiley: Chichester, UK, 2011; Volume 3. [Google Scholar]
- Wohlin, C.; Runeson, P.; Höst, M.; Ohlsson, M.C.; Regnell, B.; Wesslén, A. Experimentation in Software Engineering; Springer Science & Business Media: Berlin, Germany, 2012. [Google Scholar]
- Goleman, D. Leadership that gets results. Harv. Bus. Rev. 2000, 78, 4–17. [Google Scholar]
- Molinero, X.; Riquelme, F.; Serna, M.J. Cooperation through social influence. Eur. J. Oper. Res. 2015, 242, 960–974. [Google Scholar] [CrossRef] [Green Version]
- Wieringa, R.J. Design Science Methodology for Information Systems and Software Engineering; Springer: Berlin, Germany, 2014. [Google Scholar]


| Factor | Profile | Behavior |
|---|---|---|
| D—“Dominance” | Its priority is to obtain immediate results, act quickly and question others and likewise about its effectiveness. It is motivated by power, having authority, control, and success. They have a lot of confidence in themselves, they speak with frankness and forcefulness; however, they do not care about others, they are impatient and insensitive. | Direct Results-oriented Strong Tenacious Convincing |
| I—“Influence” | Its priority is to express enthusiasm, take action, and promote collaboration. It is motivated by social recognition, group activities, and friendly relations. They tend to be enthusiastic, sociable, optimistic, and talkative. | Extrovert Enthusiast Optimistic Vivacious Lively |
| S—“Steadiness” | Its priority is to support, balance, and enjoy the collaboration. They are motivated by stable environments, sincere appreciation, cooperation and opportunities to help. Usually patient, good team player, humble and good listener. | Serene Condescending Patient Humble Diplomatic |
| C—“Compliance” | Its priority is to ensure accuracy, balance, and challenge assumptions. He is motivated by the opportunity to use experience or increase knowledge, in addition to attending quality. They are usually meticulous, analytical, skeptical and silent | Analytical Prudent Meticulous Reserved Systemic |
| Themes | Technique | Goal | Description | Time |
|---|---|---|---|---|
| Step 1: Set Scenario | Proud—Grateful —Learned | Help the team create an environment of positive feelings. It is a technique that helps break the ice and generate a space of trust for the team | Each member must answer the following questions in front of the group: What have you achieved in this sprint that makes you feel proud? Who from the team would you appreciate for what was done in this sprint? What have you learned in this sprint? | 3 min. |
| Step 2: Get data, Generate ideas, Decide what to do | More—less—keep —stop—start | Help the team analyze their work process by evaluating different aspects of it. | Everyone is asked to propose ideas for changes in the process based on simple questions such as: what else should we do? What less ...? Should we keep ...? | 15 min |
| Step 3: Close | Fun vs. Utility | Measure the mood of the team after the ceremony. | Participants are asked to mark their name in the sector that represents their feelings about the time invested. This technique helps us express how each member feels he spent his time at the meeting. | 2 min. |
| Number | Title | As...I want...For | Validation Rules |
|---|---|---|---|
| 1 | Tractor | As a home builder, I want to have a tractor so I can move easily. | The rear wheels must be larger than the front wheels. |
| 2 | Tractor’s garage | As the tractor owner, I want a garage where you can store the tractor. | It must be wide and roofed |
| 3 | House with front garden. | As a citizen, I want to have a house with a front garden to enjoy the sun in summer | This house should be near the bus stop. The garden must be surrounded by a white fence. |
| 4 | Bridge | As mayor, I want a bridge so that pedestrians and vehicles can cross the river that divides the city. | The river is not large but divides the city in two. The river must have container walls. |
| 5 | Kiosk | As mayor, I want a kiosk so that citizens can relax, chat with friends or have a coffee. | It must be located near the bus stop. Must have a table and chairs outside for clients. |
| 6 | crane tower | As a home builder, I want to have a tower crane to easily transport construction materials. | The crane must be stable and located near the tractor garage. The crane must reach the roof of a 2-story building. |
| 7 | Extendable House Model | As a home builder, I want to have a house design that allows adding new parts or floors to the house | It should be possible to add a room or floors without changing the original structure of the house. The floors should follow the initial design of colors and shapes of the house. |
| 8 | Bus stop | As a citizen, I want a covered bus stop with seats so that in bad weather, it is comfortable to wait for the bus. | The stop must have spaces for advertising posters |
| 9 | Monument | As Mayor, I want a great monument to make it a point of reference in the city | The monument must be in the center of the city. It must be visible from anywhere in the city. It should be located in a green area with plants. |
| 10 | Public road | As Mayor, I want the city to have a single road that passes close to each construction. | The road must go through the Bus Stop. The road must be no more than 5 centimeters from each construction. |
| 11 | Public Hospital | As Mayor, I want the city to have a public hospital for urgent and scheduled care. | The hospital will be two floors. The hospital must have two entrances, one for emergency care and the other for scheduled care. |
| 12 | Mall | As an investor, I want to build a mall, to cover diverse needs of the citizens in a single shopping center. | The mall must have three levels. |
| 13 | Pedestrian crossing in height | As mayor, I want between the hospital and the mall a bridge over height, so that citizens can move easily to buy what they require for hospital patients. | The bridge must take care of the aesthetics of the mall and the Hospital. |
| Team | Natural Profile | Adapted Profile | |||||||
|---|---|---|---|---|---|---|---|---|---|
| D Dominance | I Influence | S Steadiness | C Compliance | D Dominance | I Influence | S Steadiness | C Compliance | ||
| 1 | 0 | 2 | 1 | 1 | 0 | 0 | 3 | 1 | |
| 2 | 0 | 1 | 3 | 0 | 0 | 1 | 0 | 3 | |
| 3 | 2 | 0 | 1 | 1 | 0 | 2 | 1 | 1 | |
| 4 | 0 | 0 | 3 | 0 | 0 | 0 | 0 | 3 | |
| Story Points for User story | Descriptive Statistics | ||||||||||||||||
|---|---|---|---|---|---|---|---|---|---|---|---|---|---|---|---|---|---|
| Group | 1 | 2 | 3 | 4 | 5 | 6 | 7 | 8 | 9 | 10 | 11 | 12 | 13 | Amount | Average | Sd | |
| 1 | 1 | 2 | 5 | 5 | 8 | 5 | 8 | 3 | 5 | 8 | 13 | 13 | 1 | 77 | 5.9 | 4.0 | |
| 2 | 1 | 5 | 8 | 8 | 2 | 13 | 13 | 5 | 5 | 13 | 13 | 5 | 13 | 104 | 8.0 | 4.5 | |
| 3 | 1 | 2 | 5 | 2 | 2 | 8 | 8 | 3 | 3 | 5 | 8 | 5 | 5 | 57 | 4.4 | 2.5 | |
| 4 | 2 | 3 | 2 | 3 | 5 | 3 | 2 | 3 | 5 | 5 | 3 | 5 | 2 | 43 | 3.3 | 1.3 | |
| Speaking Time (s) | Percentile | Classification | Type of Group | |||||||||||||
|---|---|---|---|---|---|---|---|---|---|---|---|---|---|---|---|---|
| G | S | f(1) | f(2) | f(3) | f(4) | Total | 1 | 2 | 3 | 4 | 1 | 2 | 3 | 4 | #max | Type |
| 1 | 175.4 | 199.1 | 193.0 | 181.9 | 749.3 | 0.47 | 0.67 | 0.60 | 0.53 | 2 | 3 | 2 | 2 | 1 | NC | |
| 1 | 2 | 320.5 | 277.1 | 269.6 | 287.2 | 1154.5 | 0.80 | 0.53 | 0.40 | 0.60 | 3 | 2 | 2 | 2 | 1 | NC |
| 3 | 158.6 | 95.8 | 110.1 | 120.8 | 485.3 | 0.80 | 0.27 | 0.40 | 0.53 | 3 | 1 | 2 | 2 | 1 | NC | |
| 1 | 469.7 | 404.0 | 111.0 | 225.6 | 1210.3 | 1.00 | 0.80 | 0.00 | 0.20 | 3 | 3 | 1 | 1 | 2 | C | |
| 2 | 2 | 400.6 | 162.5 | 225.5 | 158.4 | 947.1 | 0.93 | 0.13 | 0.47 | 0.07 | 3 | 1 | 2 | 1 | 1 | NC |
| 3 | 266.3 | 112.3 | 48.8 | 158.9 | 586.3 | 1.00 | 0.20 | 0.00 | 0.60 | 3 | 1 | 1 | 2 | 1 | NC | |
| 1 | 205.1 | 185.8 | 197.7 | 340.8 | 929.3 | 0.40 | 0.27 | 0.33 | 0.87 | 2 | 1 | 1 | 3 | 1 | NC | |
| 3 | 2 | 334.5 | 279.7 | 259.8 | 328.5 | 1202.5 | 0.87 | 0.33 | 0.27 | 0.73 | 3 | 1 | 1 | 3 | 2 | C |
| 3 | 152.1 | 117.7 | 150.8 | 135.0 | 555.6 | 0.73 | 0.33 | 0.67 | 0.47 | 3 | 1 | 3 | 2 | 2 | C | |
| 1 | 149.5 | 278.3 | 120.2 | 329.0 | 877.0 | 0.13 | 0.73 | 0.07 | 0.93 | 1 | 3 | 1 | 3 | 2 | C | |
| 4 | 2 | 137.8 | 488.5 | 222.3 | 302.4 | 1151.0 | 0.00 | 1.00 | 0.20 | 0.67 | 1 | 3 | 1 | 3 | 2 | C |
| 3 | 183.6 | 92.1 | 57.0 | 196.2 | 528.9 | 0.87 | 0.13 | 0.07 | 0.93 | 3 | 1 | 1 | 3 | 2 | C | |
| # Interventions | Percentile | Classification | Type of Group | |||||||||||||
|---|---|---|---|---|---|---|---|---|---|---|---|---|---|---|---|---|
| G | S | Total | 1 | 2 | 3 | 4 | 1 | 2 | 3 | 4 | #max | Type | ||||
| 1 | 237 | 217 | 232 | 192 | 878 | 0.60 | 0.40 | 0.47 | 0.20 | 2 | 2 | 2 | 1 | 3 | C | |
| 1 | 2 | 363 | 275 | 327 | 308 | 1273 | 0.80 | 0.13 | 0.73 | 0.53 | 3 | 1 | 3 | 2 | 2 | C |
| 3 | 163 | 121 | 144 | 123 | 551 | 0.80 | 0.27 | 0.60 | 0.40 | 3 | 1 | 2 | 2 | 1 | NC | |
| 1 | 451 | 347 | 201 | 248 | 1247 | 1.00 | 0.67 | 0.07 | 0.13 | 3 | 3 | 1 | 1 | 2 | C | |
| 2 | 2 | 350 | 229 | 233 | 201 | 1013 | 1.00 | 0.20 | 0.27 | 0.07 | 3 | 1 | 1 | 1 | 1 | NC |
| 3 | 241 | 119 | 89 | 184 | 633 | 1.00 | 0.13 | 0.00 | 0.67 | 3 | 1 | 1 | 3 | 2 | C | |
| 1 | 227 | 195 | 193 | 242 | 857 | 0.53 | 0.33 | 0.27 | 0.80 | 2 | 1 | 1 | 3 | 1 | NC | |
| 3 | 2 | 385 | 307 | 308 | 332 | 1332 | 0.87 | 0.33 | 0.40 | 0.60 | 3 | 1 | 2 | 2 | 1 | NC |
| 3 | 200 | 170 | 168 | 145 | 683 | 0.73 | 0.53 | 0.47 | 0.20 | 3 | 2 | 2 | 1 | 1 | NC | |
| 1 | 76 | 75 | 36 | 81 | 268 | 0.87 | 0.73 | 0.00 | 0.93 | 3 | 3 | 1 | 3 | 3 | C | |
| 4 | 2 | 107 | 207 | 143 | 152 | 609 | 0.00 | 0.93 | 0.47 | 0.67 | 1 | 3 | 2 | 3 | 2 | C |
| 3 | 114 | 81 | 54 | 115 | 364 | 0.87 | 0.33 | 0.07 | 0.93 | 3 | 1 | 1 | 3 | 2 | C | |
| G | CTPer | CTProm | ST | NI | SP-P | Total SP-D | PLS | PPT |
|---|---|---|---|---|---|---|---|---|
| 1 | NC | C | 2389.06 | 2702 | 77 | 77 | Affiliative | Influenced |
| 2 | NC | C | 2743.64 | 2893 | 104 | 104 | Undefined | Steady |
| 3 | C | NC | 2687.42 | 2872 | 57 | 57 | Democratic | Dominant |
| 4 | C | C | 2556.88 | 1241 | 43 | 43 | Democratic | Steady |
| G | S | ST | ST% | ST%C | CTPer | NI | NI% | NI%C | CTPRom | SP-P | SP-D | SP-D% | SP-D%C | SPDebt |
|---|---|---|---|---|---|---|---|---|---|---|---|---|---|---|
| 1 | 1 | 749.32 | 31.36 | 31.36 | NC | 878 | 32.49 | 32.49 | C | 26 | 16 | 20.78 | 20.78 | 10 |
| 2 | 1 | 1210.26 | 44.11 | 44.11 | C | 1247 | 43.10 | 43.10 | C | 31 | 26 | 25.00 | 25.00 | 5 |
| 3 | 1 | 929.32 | 34.58 | 34.58 | NC | 857 | 29.84 | 29.84 | NC | 13 | 8 | 14.04 | 4.04 | 5 |
| 4 | 1 | 876.98 | 34.30 | 34.30 | C | 268 | 21.60 | 21.60 | C | 16 | 11 | 25.58 | 25.58 | 5 |
| 1 | 2 | 1154.48 | 48.32 | 79.68 | NC | 1273 | 47.11 | 79.60 | C | 29 | 26 | 33.77 | 54.55 | 3 |
| 2 | 2 | 947.06 | 34.52 | 78.63 | NC | 1013 | 35.02 | 78.12 | NC | 33 | 28 | 26.92 | 51.92 | 5 |
| 3 | 2 | 1202.48 | 44.74 | 79.32 | C | 1332 | 46.38 | 76.22 | NC | 20 | 18 | 31.58 | 45.62 | 2 |
| 4 | 2 | 1151.00 | 45.02 | 79.32 | NC | 609 | 49.07 | 70.67 | C | 15 | 10 | 23.26 | 48.84 | 5 |
| 1 | 3 | 485.26 | 20.31 | 100.00 | NC | 551 | 20.39 | 100.00 | NC | 22 | 35 | 45.45 | 100.00 | −13 |
| 2 | 3 | 586.32 | 21.37 | 100.00 | NC | 633 | 21.88 | 100.00 | C | 40 | 50 | 48.08 | 100.00 | −10 |
| 3 | 3 | 555.62 | 20.67 | 100.00 | C | 683 | 23.78 | 100.00 | NC | 24 | 31 | 54.39 | 100.00 | −7 |
| 4 | 3 | 528.90 | 20.69 | 100.00 | C | 364 | 29.33 | 100.00 | C | 12 | 22 | 51.16 | 100.00 | −10 |
© 2019 by the authors. Licensee MDPI, Basel, Switzerland. This article is an open access article distributed under the terms and conditions of the Creative Commons Attribution (CC BY) license (http://creativecommons.org/licenses/by/4.0/).
Share and Cite
Cornide-Reyes, H.; Noël, R.; Riquelme, F.; Gajardo, M.; Cechinel, C.; Mac Lean, R.; Becerra, C.; Villarroel, R.; Munoz, R. Introducing Low-Cost Sensors into the Classroom Settings: Improving the Assessment in Agile Practices with Multimodal Learning Analytics. Sensors 2019, 19, 3291. https://doi.org/10.3390/s19153291
Cornide-Reyes H, Noël R, Riquelme F, Gajardo M, Cechinel C, Mac Lean R, Becerra C, Villarroel R, Munoz R. Introducing Low-Cost Sensors into the Classroom Settings: Improving the Assessment in Agile Practices with Multimodal Learning Analytics. Sensors. 2019; 19(15):3291. https://doi.org/10.3390/s19153291
Chicago/Turabian StyleCornide-Reyes, Hector, René Noël, Fabián Riquelme, Matías Gajardo, Cristian Cechinel, Roberto Mac Lean, Carlos Becerra, Rodolfo Villarroel, and Roberto Munoz. 2019. "Introducing Low-Cost Sensors into the Classroom Settings: Improving the Assessment in Agile Practices with Multimodal Learning Analytics" Sensors 19, no. 15: 3291. https://doi.org/10.3390/s19153291