Predicting Advanced Balance Ability and Mobility with an Instrumented Timed Up and Go Test

 , , ,
, , ,  , , ,
, , ,
Abstract
:1. Introduction
2. Materials and Methods
2.1. Population
2.2. Measurements
2.3. Procedures
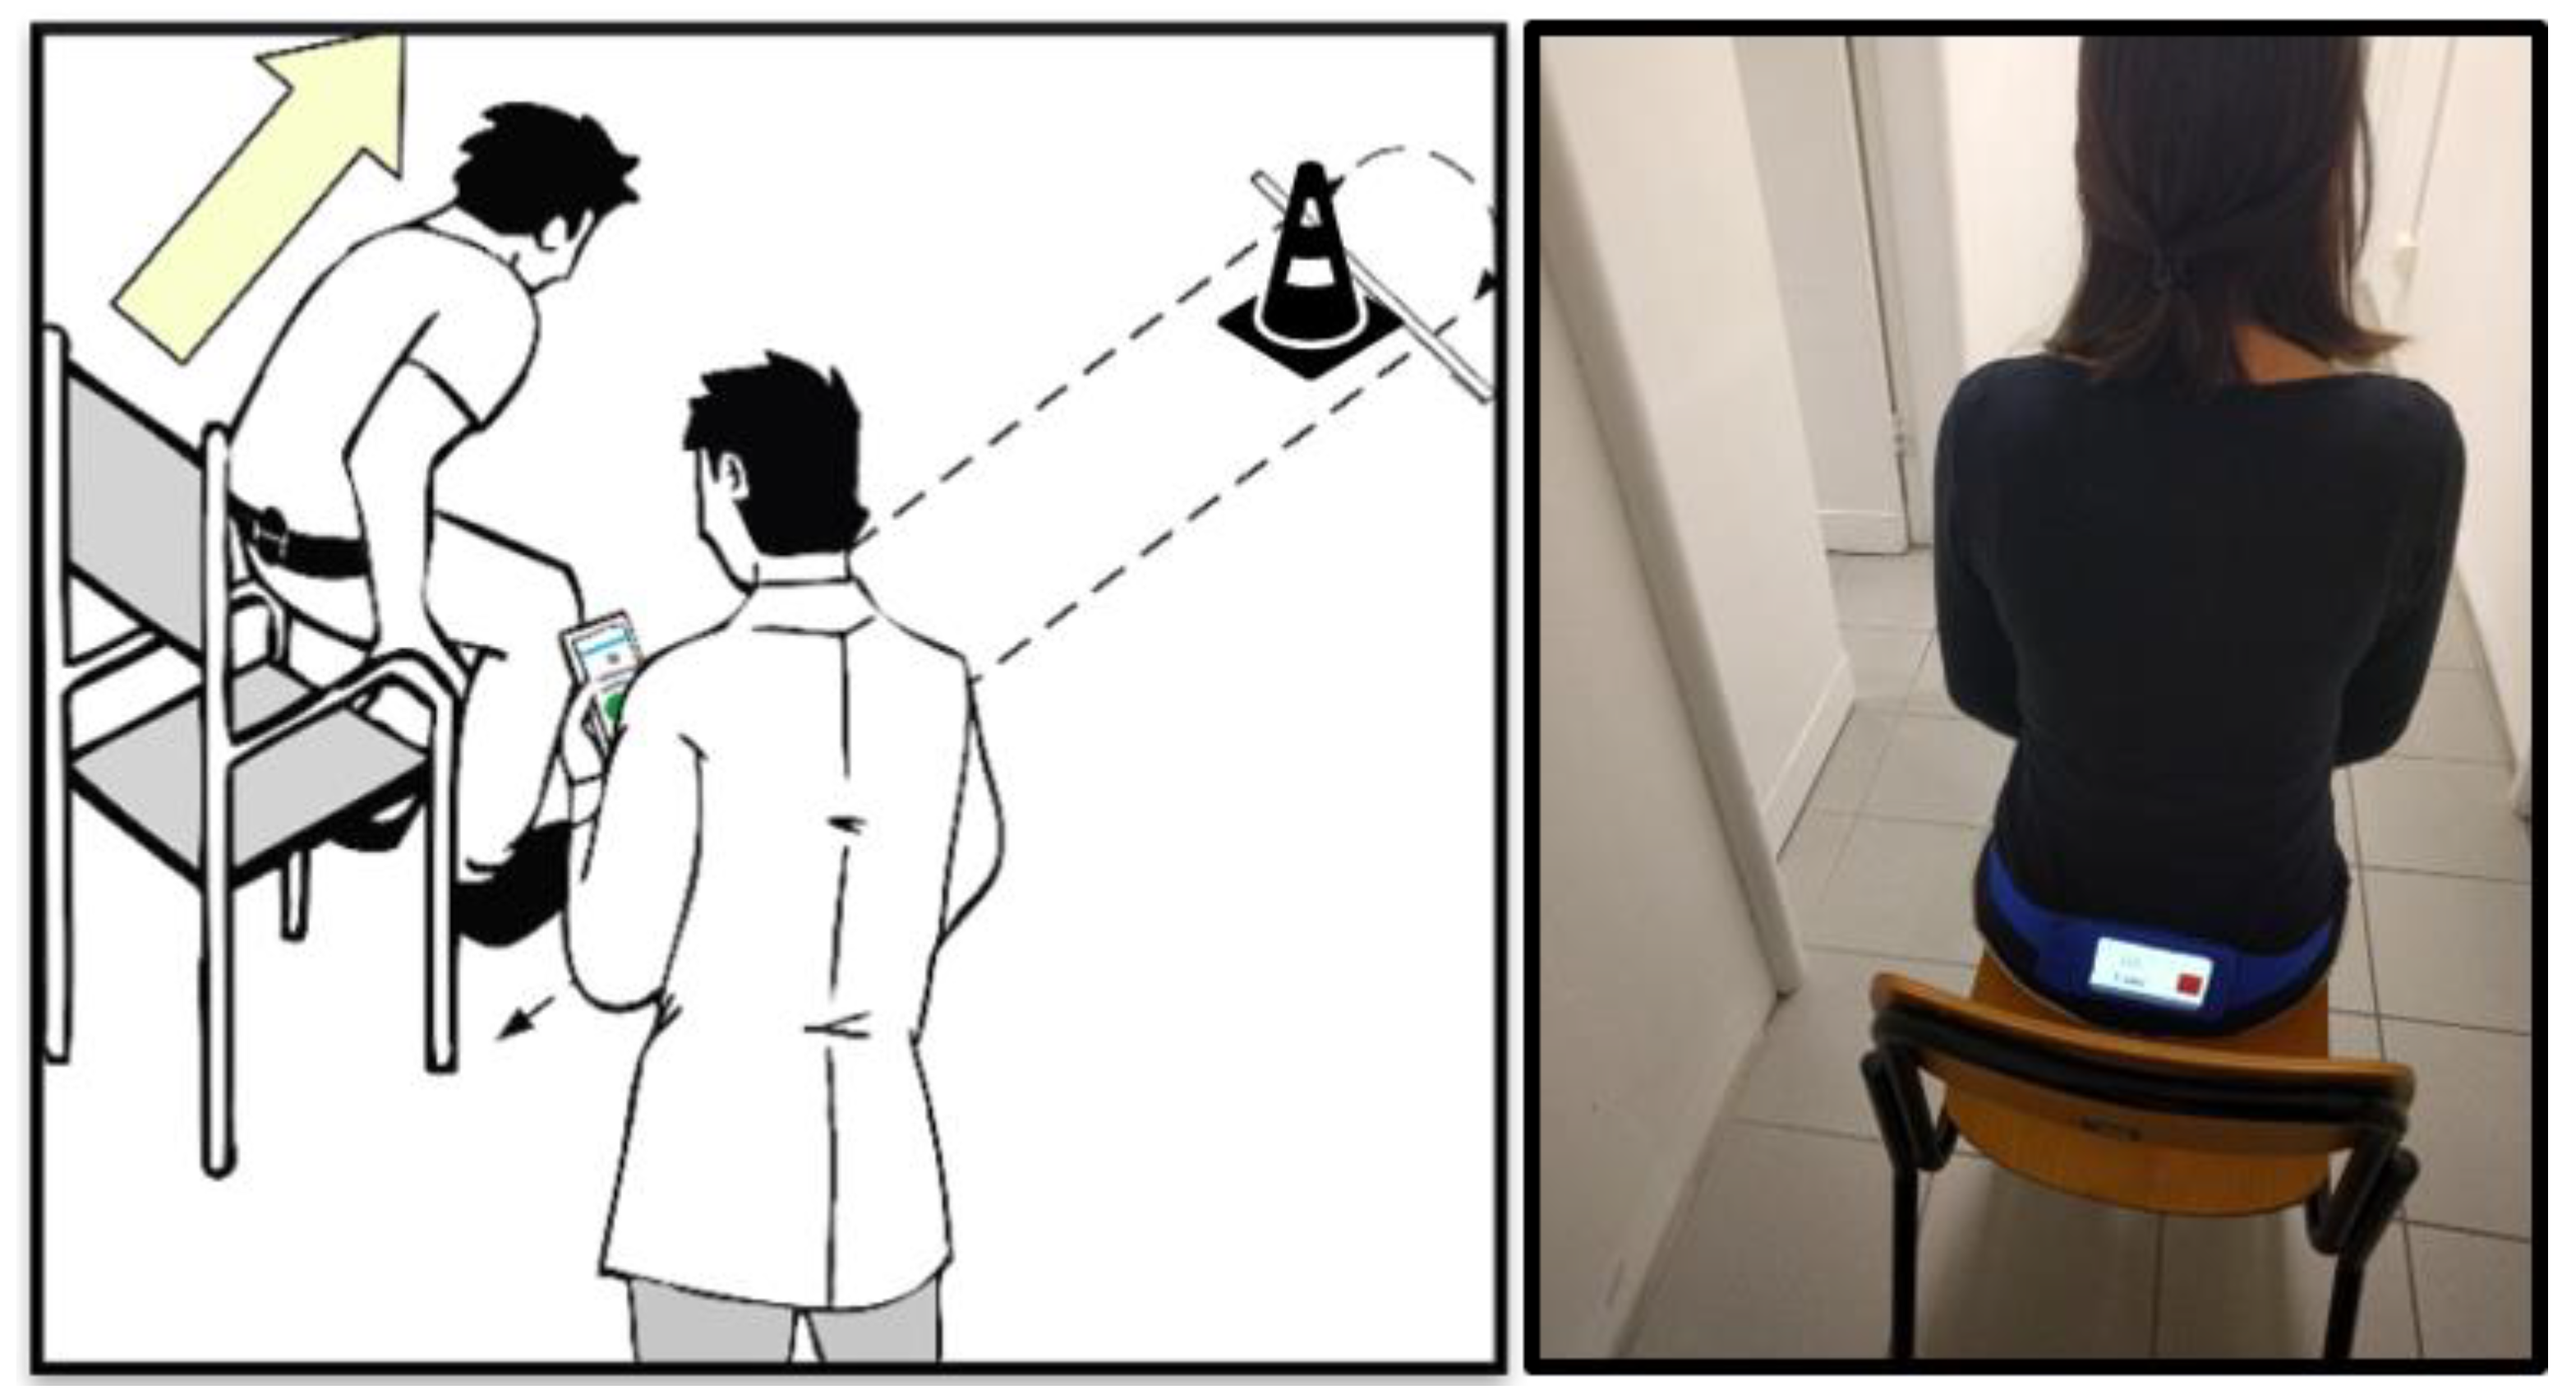
2.4. TUG and iTUG
2.5. Statistical Analysis
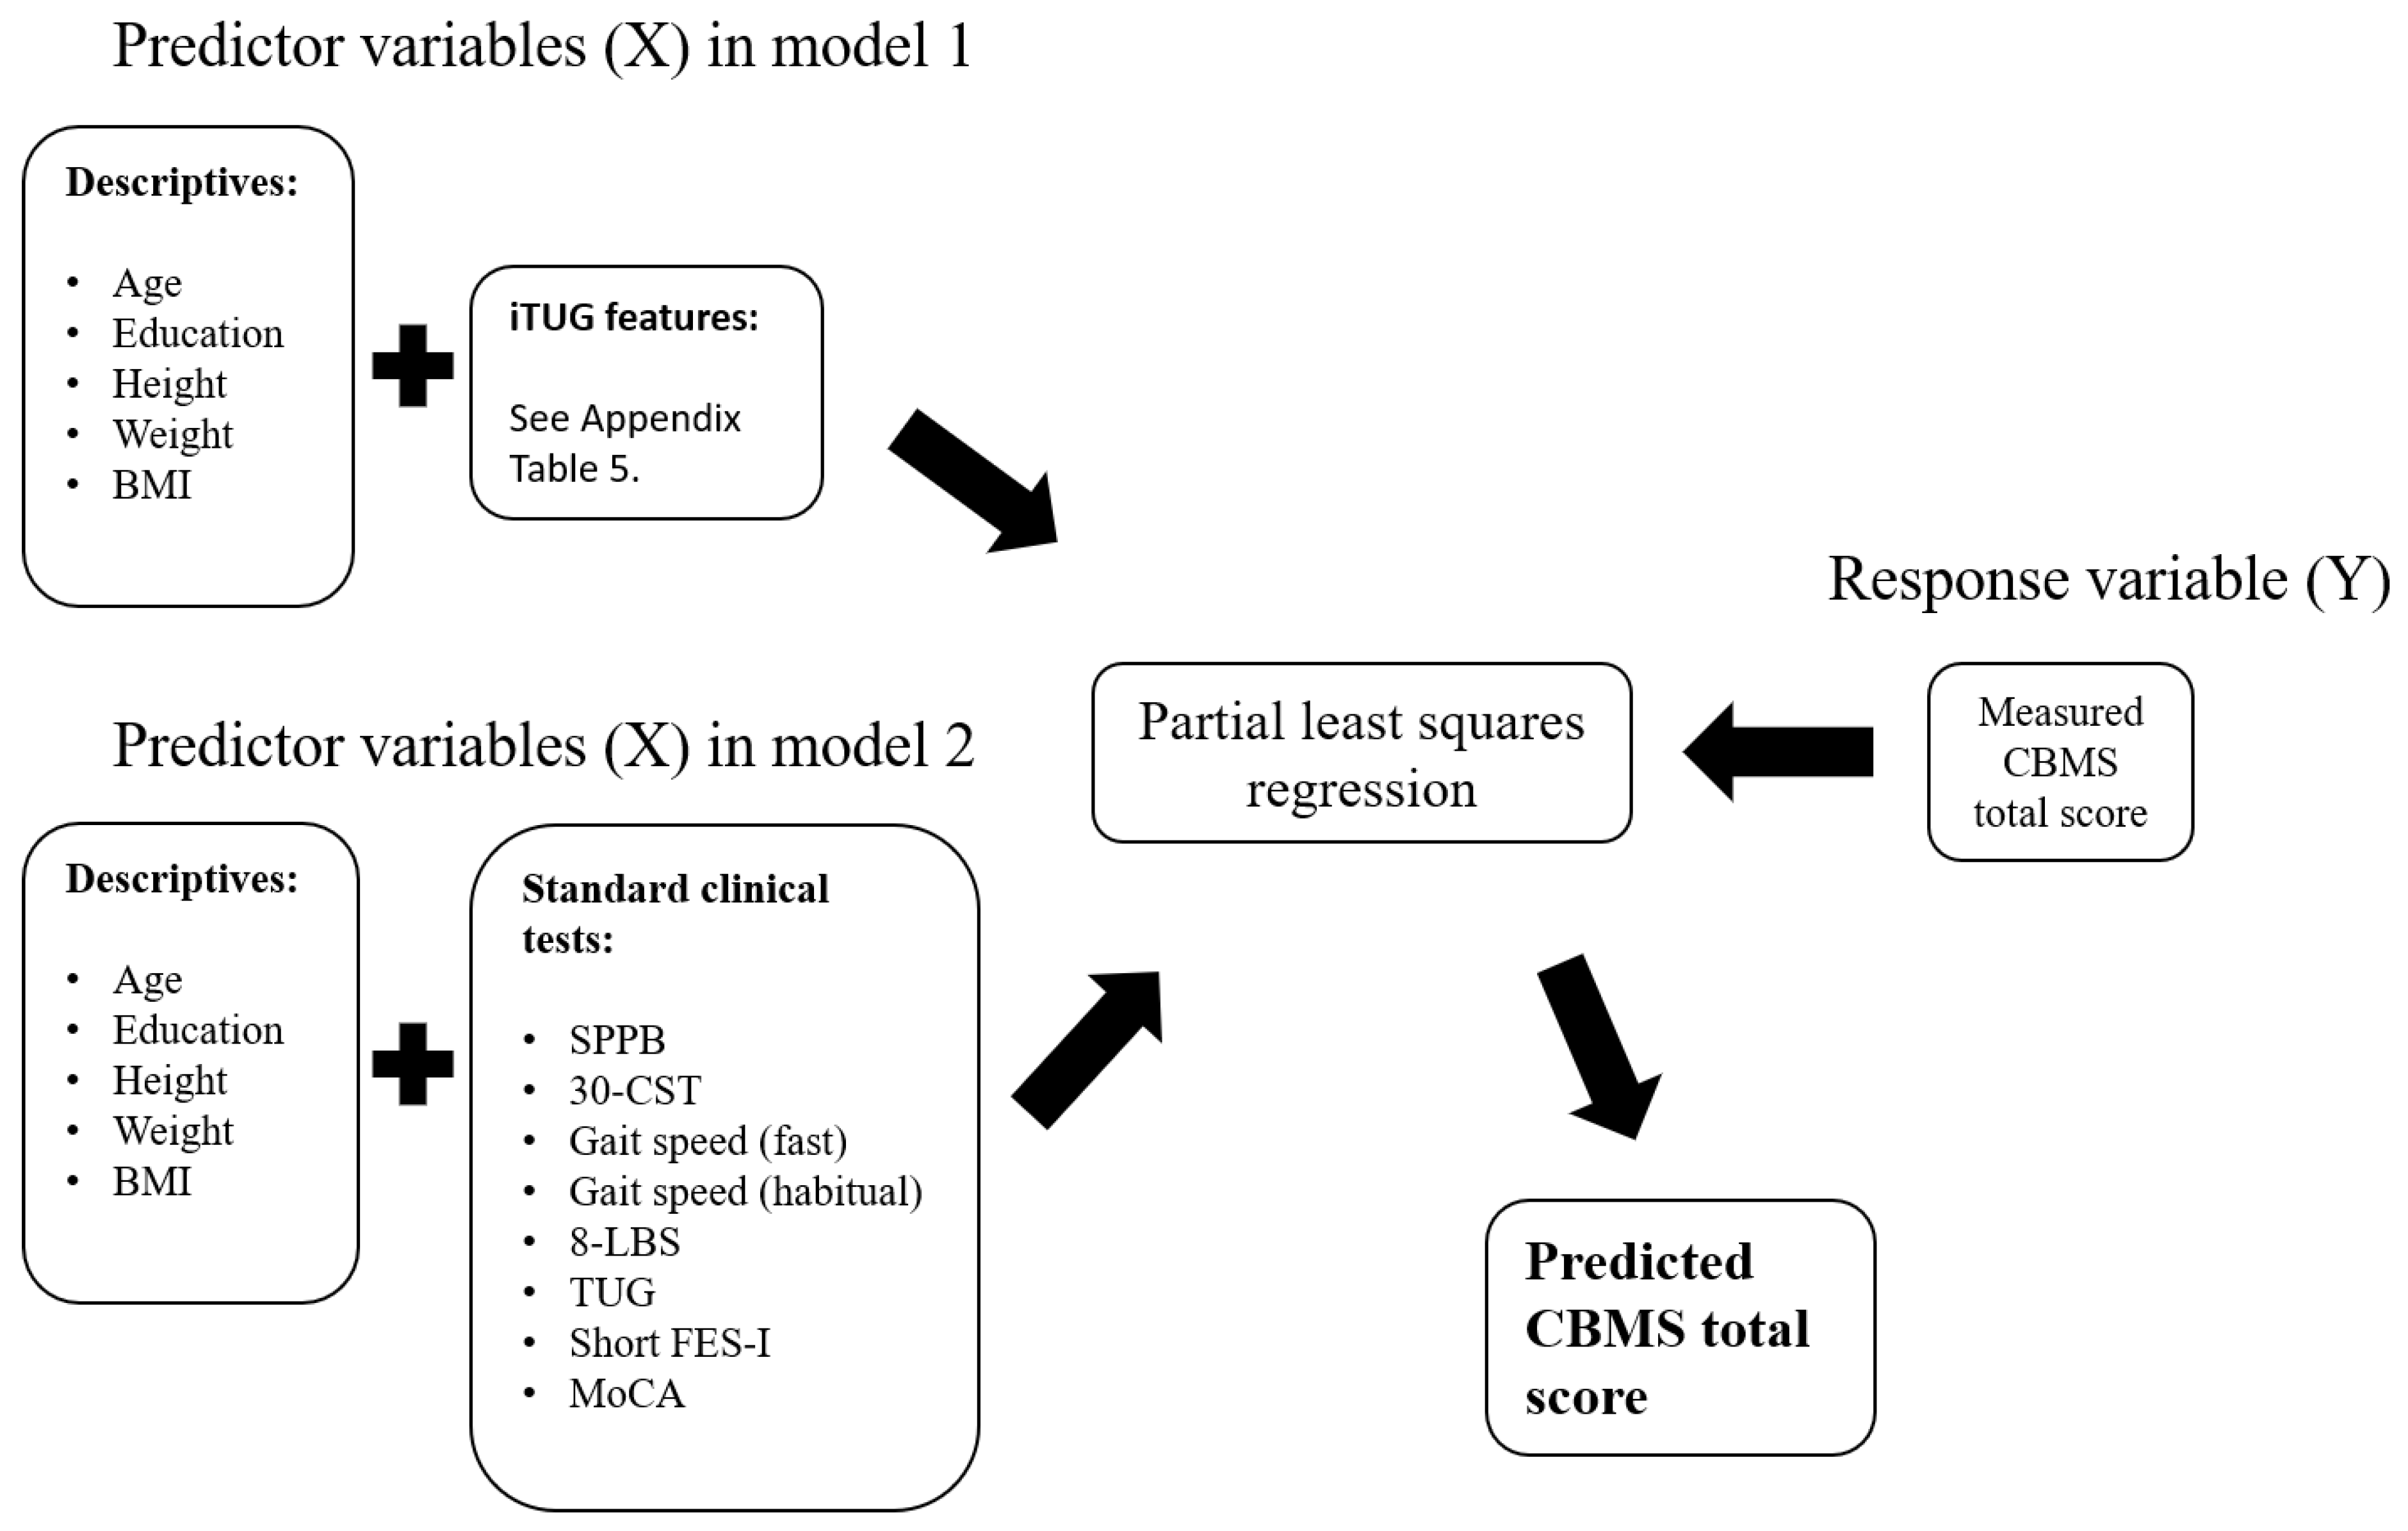
2.6. Partial Least Squares Regression (PLSR)
3. Results
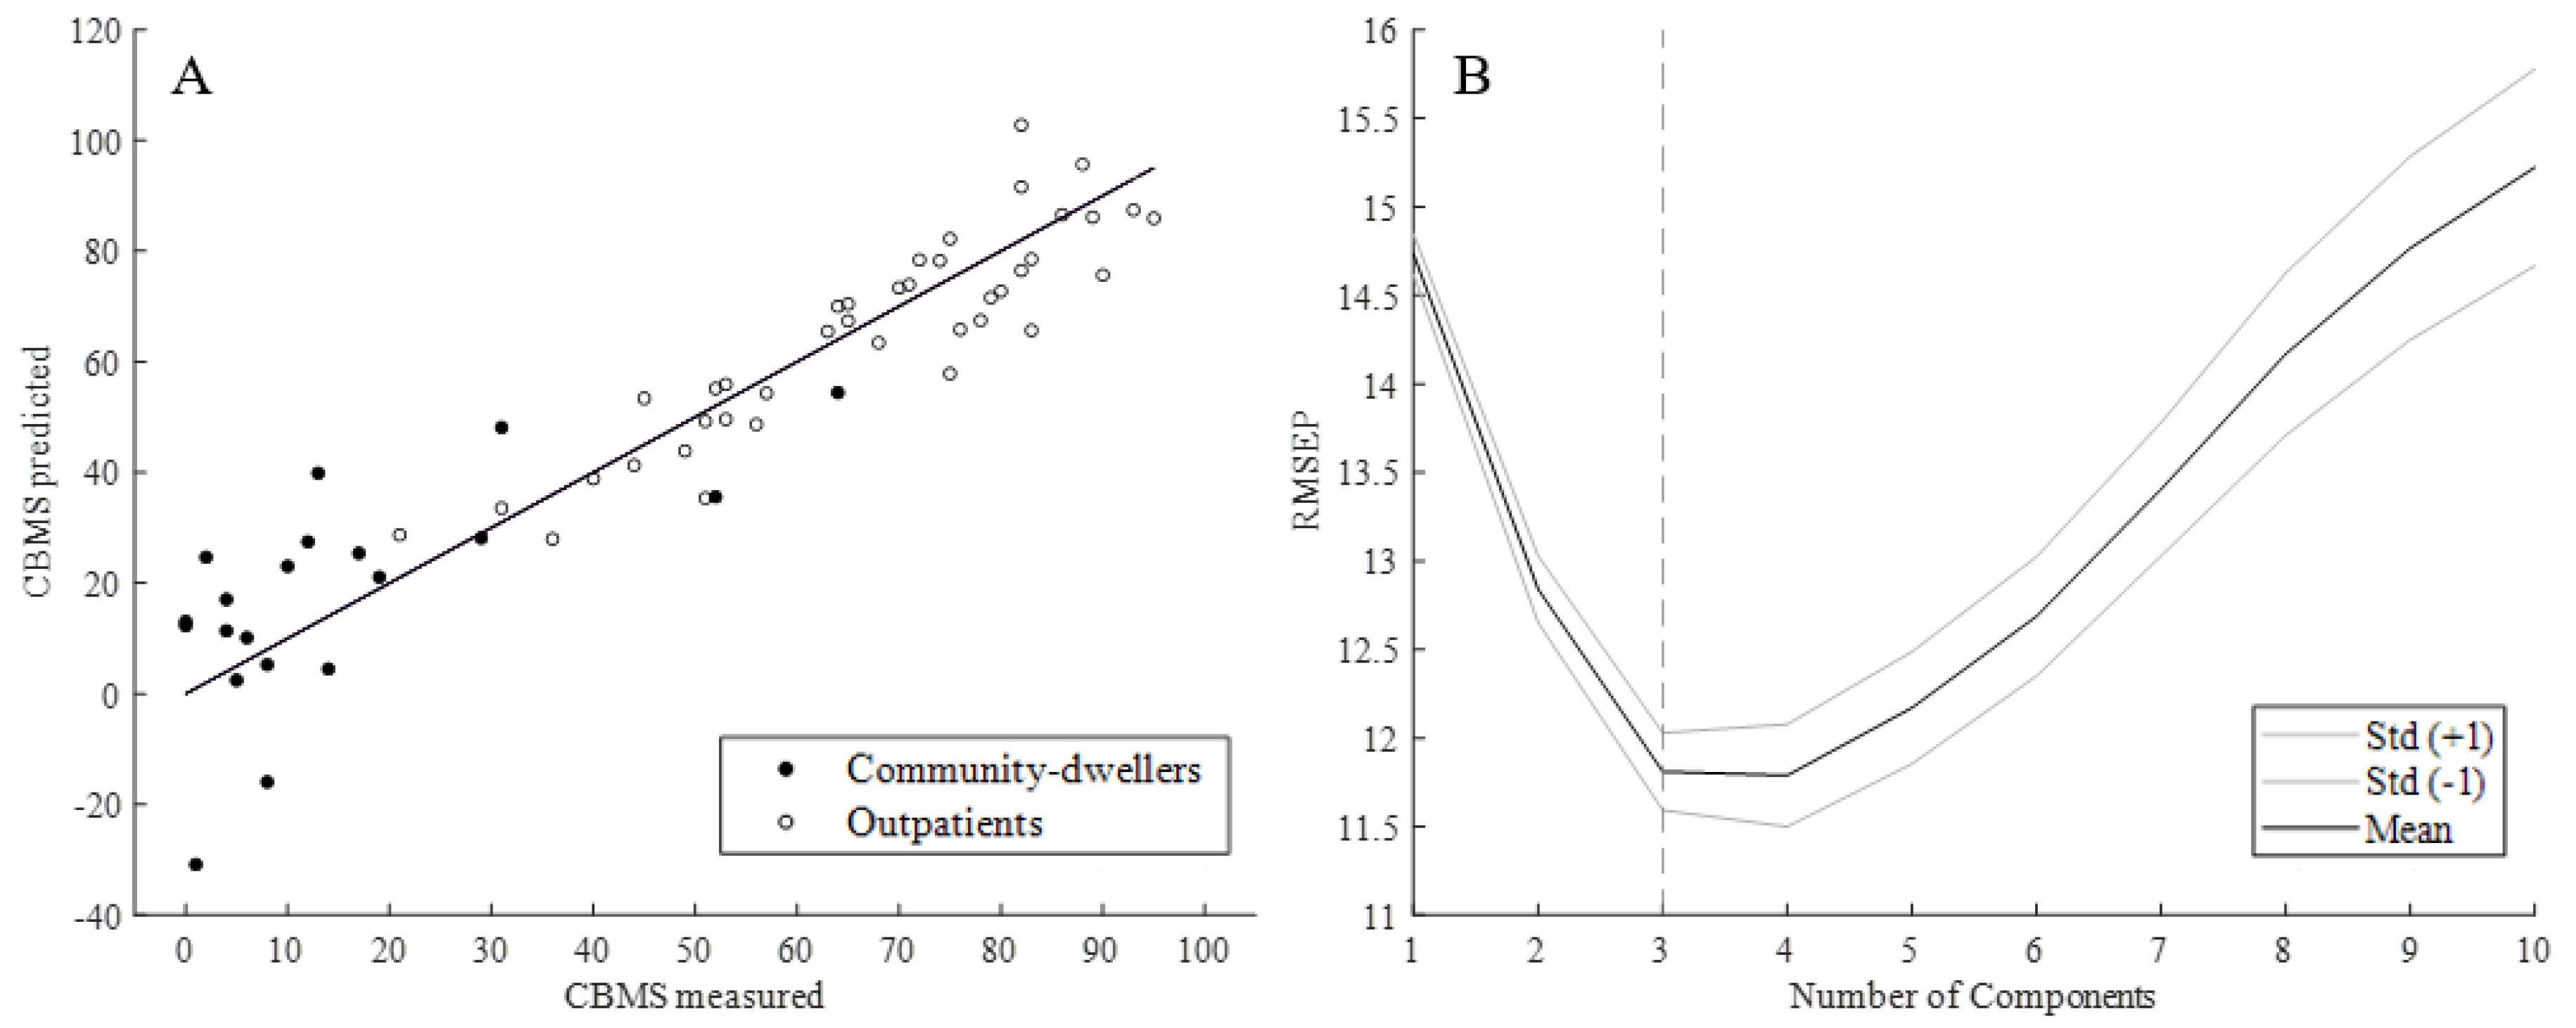
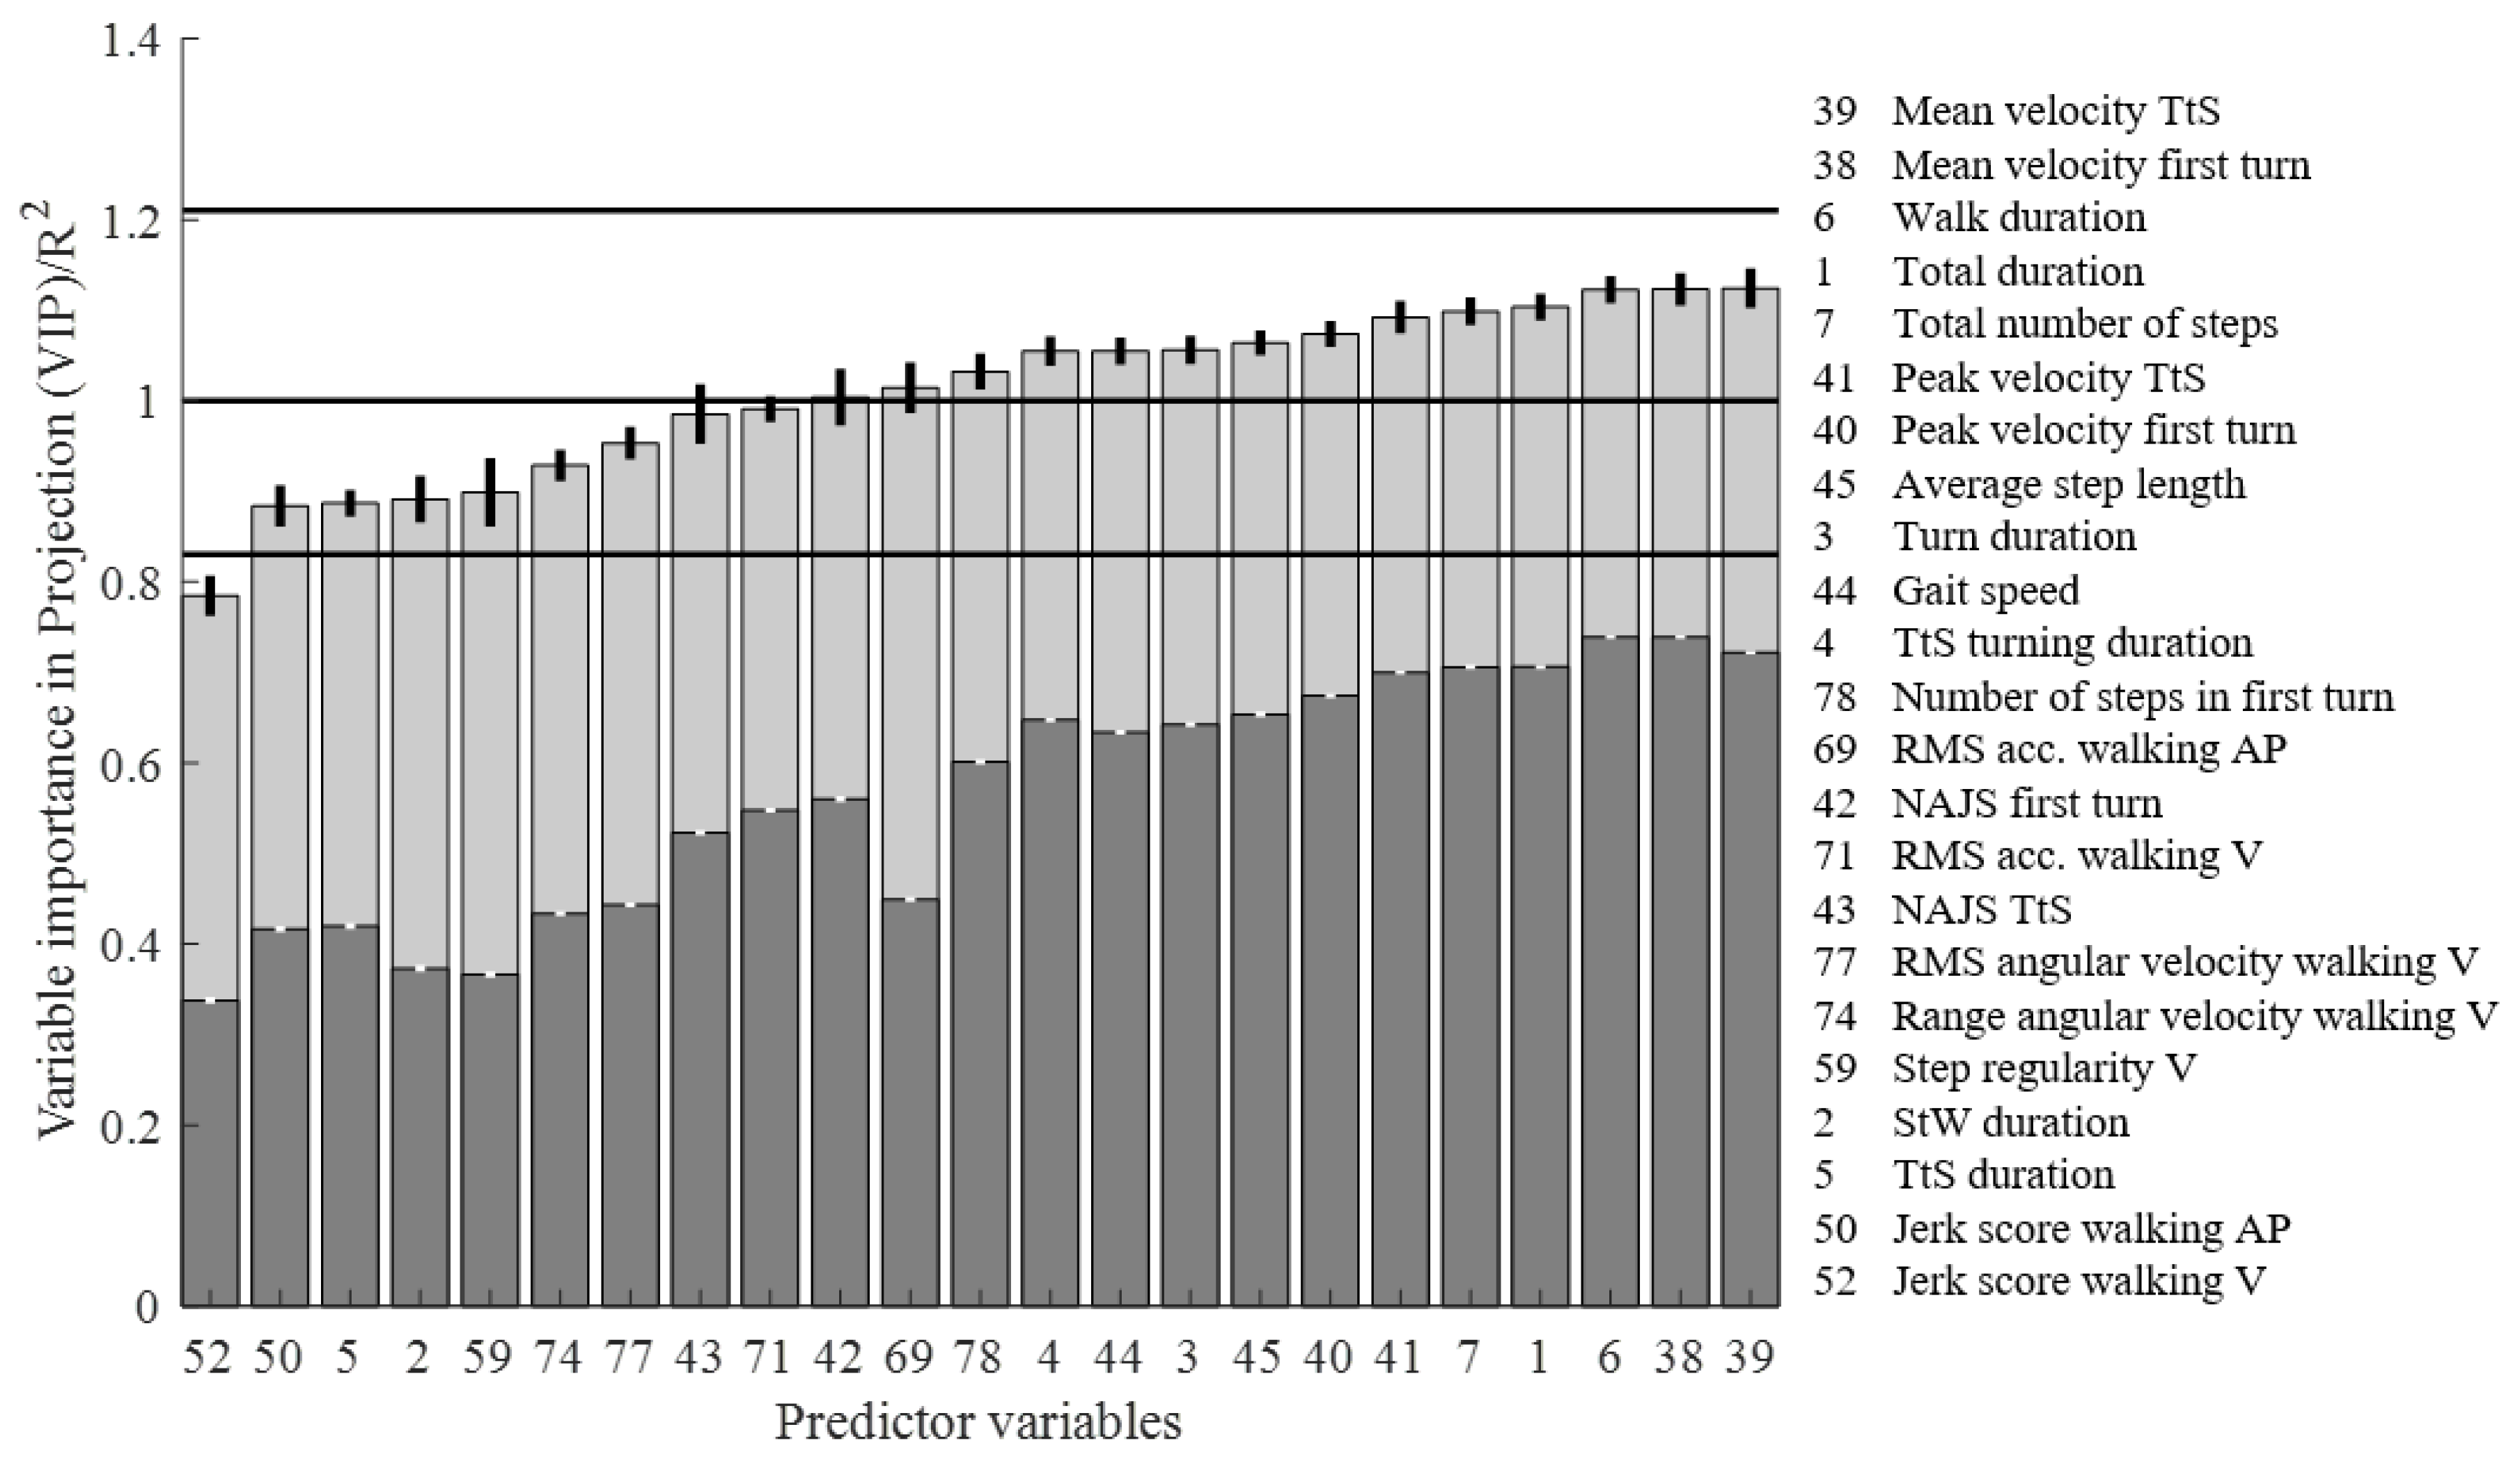
3.1. PLSR of iTUG Features versus the CBMS
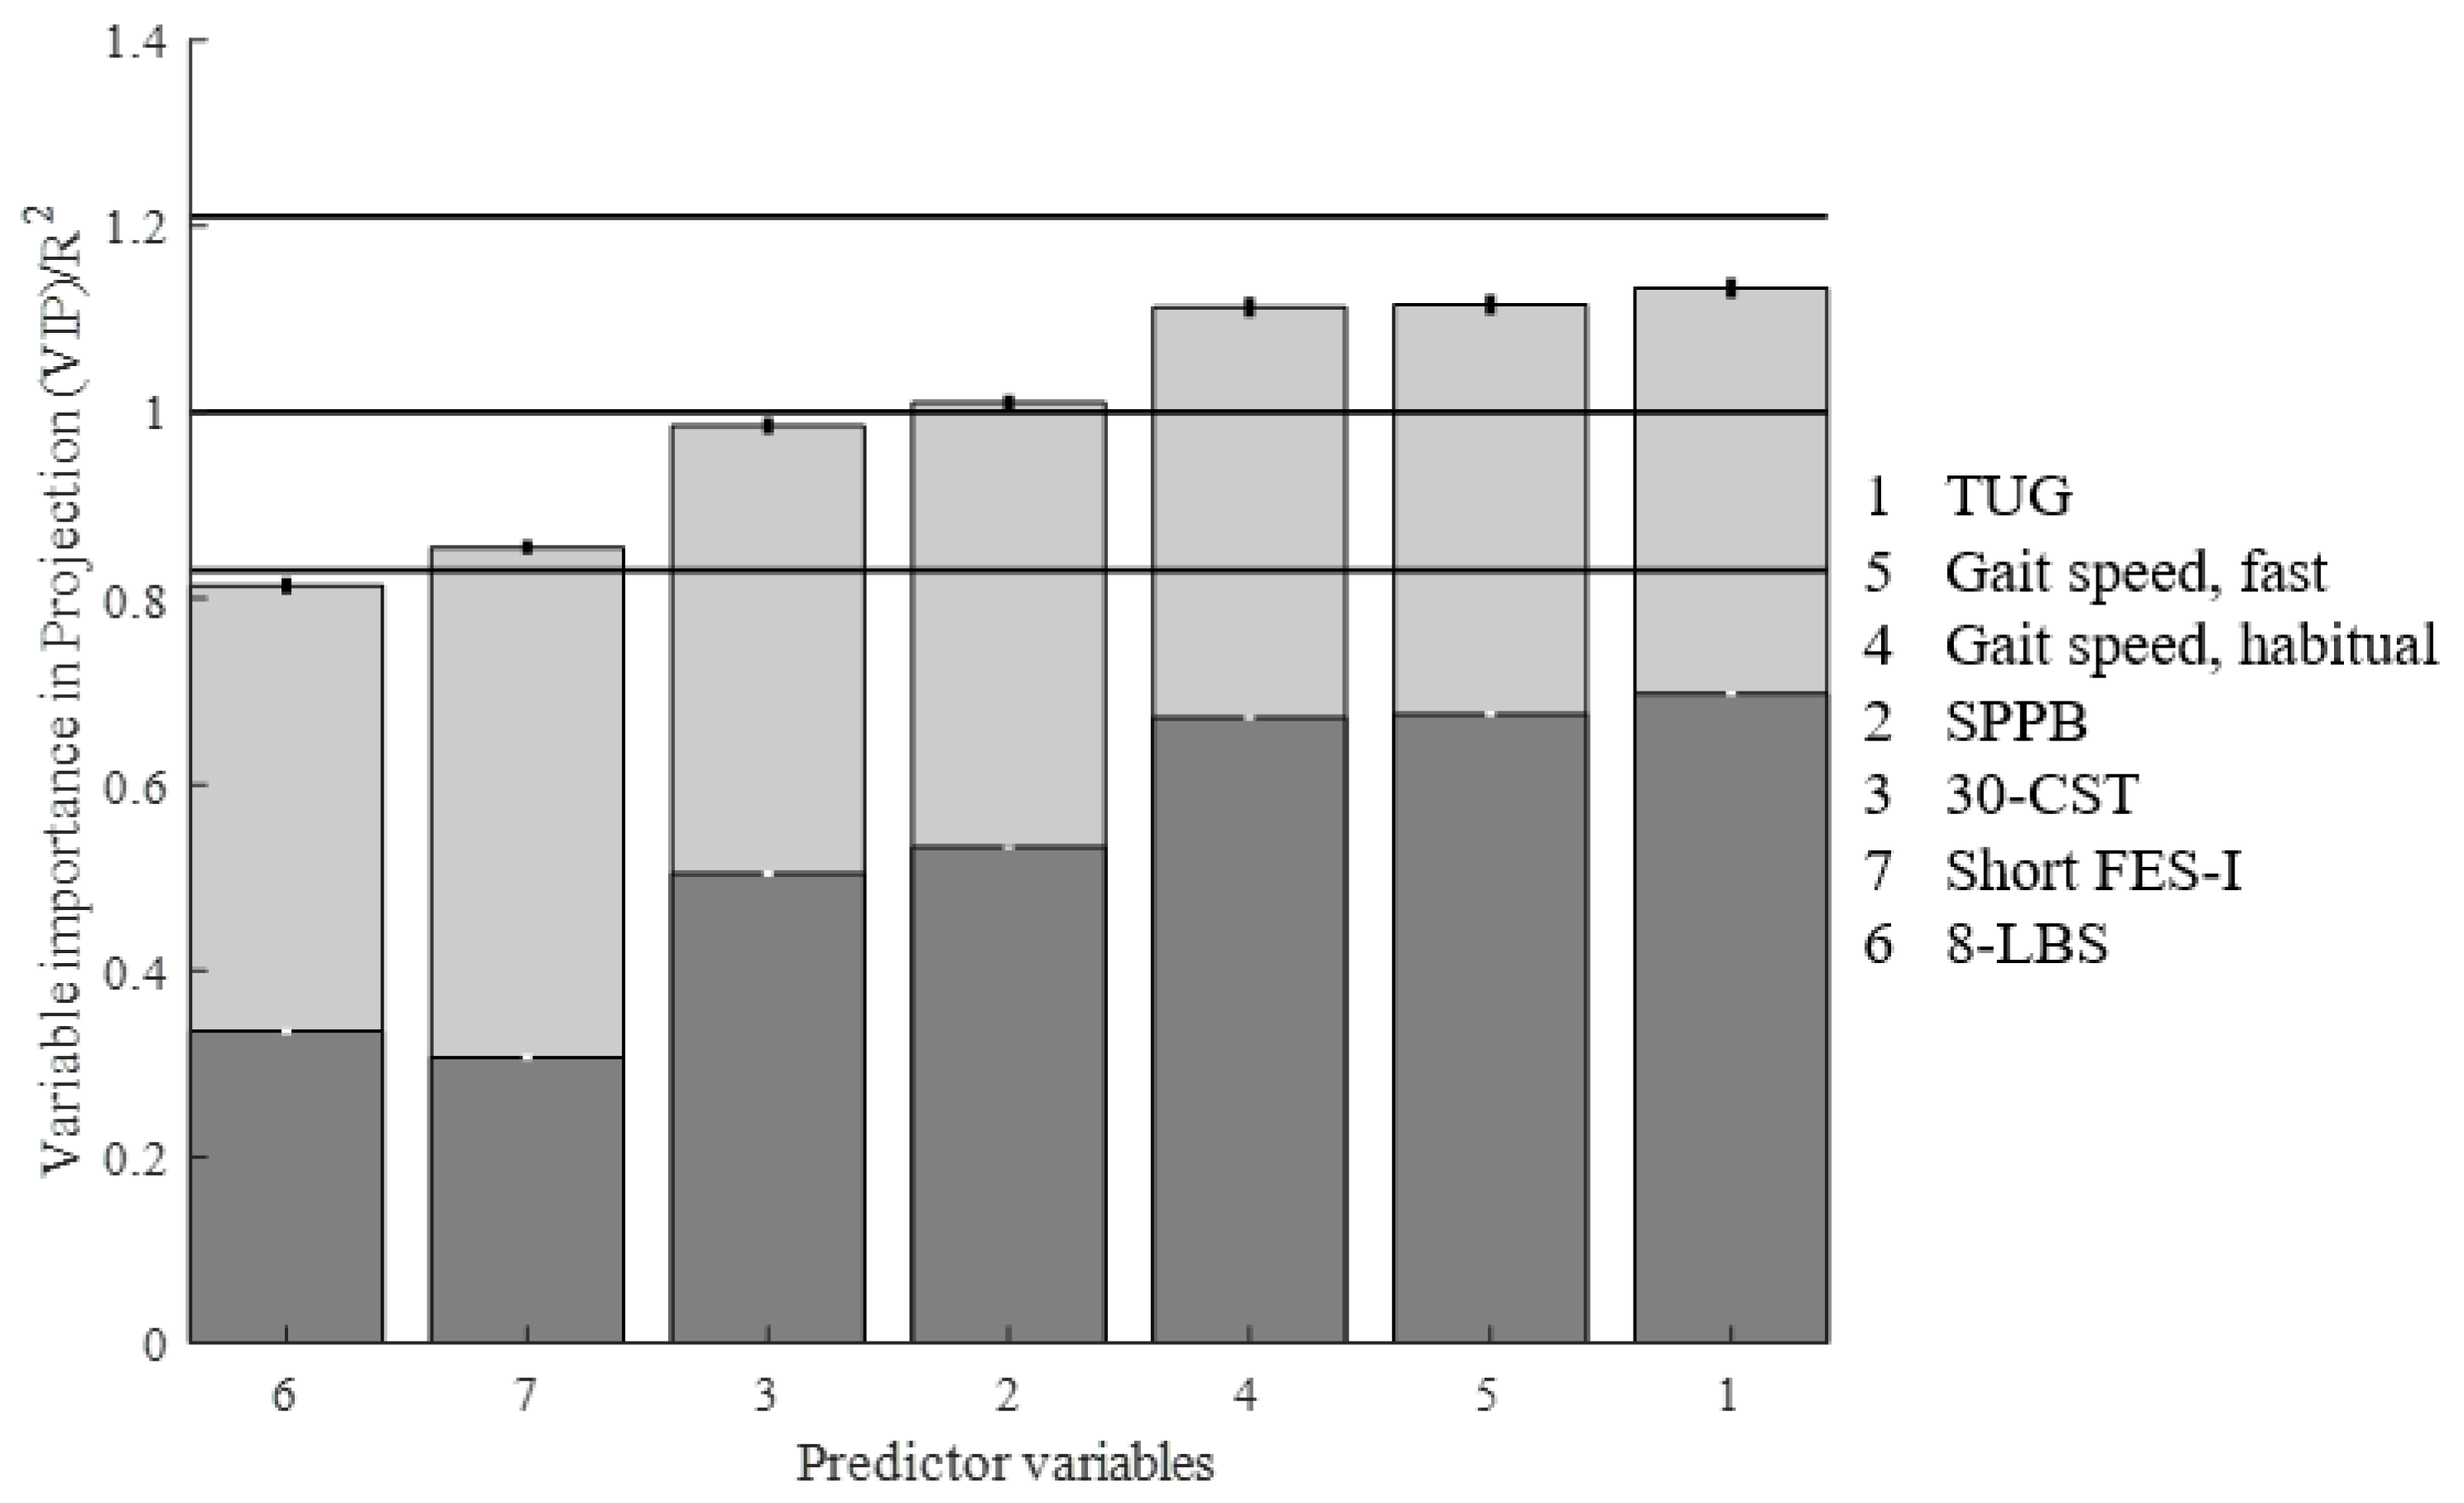
3.2. PLSR of Standard Clinical Tests vs. the CBMS
4. Discussion
4.1. Limitations
4.2. Implications for Clinical Practice and Future Research
5. Conclusions
Author Contributions
Funding
Acknowledgments
Conflicts of Interest
Appendix A

| Late Life Function and Disability Index (LLFDI) The LLFDI [11] consists of two parts, function and disability, with 32 and 16 items, respectively. Both parts of the LLFDI were administered, but for the purpose of this study, only the functional scores will be used in the analysis. The items are regarding how much difficulty the participant experiences with carrying out different activities of daily life with a rating scale of 1–5, ranging from no difficulty to cannot do. The questions span across three dimensions; upper extremity, lower extremity, and advanced lower extremity. The total score is scaled, resulting in scores ranging from 0–100 (higher score indicating better performance), allowing comparison to other trials and cohorts. Short Falls-Efficacy Scale International (Short FES-I) The Short FES-I (9) is a 10-item questionnaire developed to assess the fear of falling in community-dwelling older adults. The outcome is a sum score ranging from minimum 7 (no concern about falling) to maximum 28 (severe concern about falling). Montreal Cognitive Assessment (MoCA) MoCA [12] is a screening tool used identify mild cognitive impairment (MCI) that assesses short-term memory, visuospatial abilities, executive functions, attention, concentration and working memory, language, and orientation to time and place. The score ranges from 0 to a maximal score of 30, with a higher score indicating better cognitive function. Eight-Level Balance Scale (8-LBS) The 8-LBS (11) is a test of static balance in which the participants attempt increasingly difficult positions for 15 s. The test ends when (if) the participants are not able to hold the position for 15 s. The positions are (1) side-by-side standing, narrow base, eyes open; (2) side-by-side standing, narrow base, eyes closed; (3) semi-tandem, eyes open; (4) tandem, eyes open; (5) tandem, eyes closed; (6) one-leg standing, eyes open; (7) one-leg standing, eyes closed; (8) one-leg stand, eyes closed + cognitive distraction (mentioning of the months of the year in a backwards order). The outcome is the number (in order) of the most difficult position attempted, ranging from 1 (least difficult) to 8 (most difficult). Community Balance and Mobility Scale (CBMS) The CBMS (14) is a test battery of balance and mobility consisting of 13 tasks, of which six are assessed unilaterally. It has been shown to be a promising performance-based test of physical function in higher-functioning seniors (2, 6). Each task is rated at the assessor’s discretion, and a score given from 0 (unable) to 5 (coordinated and controlled, without excessive equilibrium reactions). The scores are summed and the total score ranges from 0 to 96, where a higher score indicates better performance. The bonus point (95 + 1) is given if the participants can descend a staircase while holding a weighted basket in front of them, allowed only intermittently to look at the steps. 7-Meter Walk Test (Habitual and Fast) Participants are timed over 7 m within a 9-meter track, allowing one meter in each end for acceleration/deceleration. The best time from two trials in both habitual and fast walking conditions were used to calculate respective gait speeds (m/s). 30-Second Chair-Stand Test (30-CST) In the 30-CST the assessor counts the number of repetitions of sit-to-stands the participants can perform in 30 s. The test was developed to overcome the floor-effect associated with the Five times sit-to-stand, and is originally a part of the Fullerton Functional Fitness Test battery (12). Short Physical Performance Battery (SPPB) SPPB is a test of physical functioning of the lower extremities in older adults (13). The test consists of three parts, where the participants (1) attempts to keep their balance in three different feet-positions for 10 s in each, (2) walk four meters in habitual pace (performed twice), and (3) perform five repeated sit-to-stands as fast as possible. Each part is scored, and a combined score from 0–12 is given, where a higher score indicates better performance. |
| Total Duration | RMS ML gyro StW | Peak Velocity TtS | Stride Regularity ML |
|---|---|---|---|
| StW Duration | RMS V gyro StW | NAJS 180° Turn | Stride Regularity V |
| 180° Turn Duration | Range AP acc TtS | NAJS TtS | Gait Symmetry AP |
| TtS Turning Duration | Range ML acc TtS | Gait Speed | Gait Symmetry ML |
| TtS Duration | Range V acc TtS | Average Step Length | Gait Symmetry V |
| Walk Duration | RMS AP acc TtS | Step Duration | Range Acceleration Walking AP |
| Total Number of Steps | RMS ML acc TtS | Standard Dev. of Step Duration | Range Acceleration Walking ML |
| Range AP acc StW | RMS V acc TtS | Coef. Variation of Step Duration | Range Acceleration Walking V |
| Range ML acc StW | Jerk Score AP TtS | Coordination Index | RMS Acceleration Walking AP |
| Range V acc StW | Jerk Score ML TtS | Jerk Score Walking AP | RMS Acceleration Walking ML |
| RMS AP acc StW | Jerk Score V TtS | Jerk Score Walking ML | RMS Acceleration Walking V |
| RMS ML acc StW | Range AP gyro TtS | Jerk Score Walking V | Range Angular Velocity Walking AP |
| RMS V acc StW | Range ML gyro TtS | Normalised Jerk Score Walking AP | Range Angular Velocity Walking ML |
| Jerk Score AP StW | Range V gyro TtS | Harmonic Ration AP | Range Angular Velocity Walking V |
| Jerk Score ML StW | RMS AP gyro TtS | Harmonic Ration ML | RMS Angular Velocity Walking AP |
| Jerk Score V StW | RMS ML gyro TtS | Harmonic Ration V | RMS Angular Velocity Walking ML |
| Range AP gyro StW | RMS V gyro TtS | Step Regularity AP | RMS Angular Velocity Walking V |
| Range ML gyro StW | Mean Velocity 180° Turn | Step Regularity ML | Number of Steps in 180° Turn |
| Range V gyro StW | Mean Velocity TtS | Step Regularity V | |
| RMS AP gyro StW | Peak Velocity 180° Turn | Stride Regularity AP |
References
- Freiberger, E.; De Vreede, P.; Schoene, D.; Rydwik, E.; Mueller, V.; Frändin, K.; Hopman-Rock, M. Performance-based physical function in older community-dwelling persons: A systematic review of instruments. Age Ageing 2012, 41, 712–721. [Google Scholar] [CrossRef] [PubMed] [Green Version]
- Bergquist, R.; Weber, M.; Schwenk, M.; Ulseth, S.; Helbostad, J.L.; Vereijken, B.; Taraldsen, K. Performance-based clinical tests of balance and muscle strength used in young seniors: A systematic literature review. BMC Geriatr. 2019, 19, 9. [Google Scholar] [CrossRef] [PubMed]
- Schoene, D.; Wu, S.M.; Mikolaizak, A.S.; Menant, J.C.; Smith, S.T.; Delbaere, K.; Lord, S.R. Discriminative ability and predictive validity of the timed up and go test in identifying older people who fall: Systematic review and meta-analysis. J. Am. Geriatr. Soc. 2013, 61, 202–208. [Google Scholar] [CrossRef]
- Weber, M.; Van Ancum, J.; Bergquist, R.; Taraldsen, K.; Gordt, K.; Mikolaizak, A.S.; Nerz, C.; Pijnappels, M.; Jonkman, N.H.; Maier, A.B.; et al. Concurrent validity and reliability of the Community Balance and Mobility scale in young-older adults. BMC Geriatr. 2018, 18, 156. [Google Scholar] [CrossRef] [Green Version]
- Gordt, K.; Mikolaizak, A.S.; Taraldsen, K.; Bergquist, R.; Van Ancum, J.M.; Nerz, C.; Pijnappels, M.; Maier, A.B.; Helbostad, J.L.; Vereijken, B.; et al. Creating and Validating a Shortened Version of the Community Balance and Mobility Scale for Application in People Who Are 61 to 70 Years of Age. Phys. Ther. 2020, 100, 180–191. [Google Scholar] [CrossRef]
- Balasubramanian, C.K. The community balance and mobility scale alleviates the ceiling effects observed in the currently used gait and balance assessments for the community-dwelling older adults. J. Geriatr. Phys. Ther. 2015, 38, 78–89. [Google Scholar] [CrossRef]
- Guralnik, J.M.; Simonsick, E.M.; Ferrucci, L.; Glynn, R.J.; Berkman, L.F.; Blazer, D.G.; Scherr, P.A.; Wallace, R.B. A short physical performance battery assessing lower extremity function: Association with self-reported disability and prediction of mortality and nursing home admission. J. Gerontol. 1994, 49, M85–M94. [Google Scholar] [CrossRef] [PubMed]
- Podsiadlo, D.; Richardson, S. The timed “Up & Go”: A test of basic functional mobility for frail elderly persons. J. Am. Geriatr. Soc. 1991, 39, 142–148. [Google Scholar] [PubMed]
- Studenski, S.; Perera, S.; Patel, K.; Rosano, C.; Faulkner, K.; Inzitari, M.; Brach, J.; Chandler, J.; Cawthon, P.; Connor, E.B.; et al. Gait Speed and Survival in Older Adults. JAMA 2011, 305, 50–58. [Google Scholar] [CrossRef] [Green Version]
- Sprint, G.; Cook, D.J.; Weeks, D.L. Toward Automating Clinical Assessments: A Survey of the Timed Up and Go. IEEE Rev. Biomed. Eng. 2015, 8, 64–77. [Google Scholar] [CrossRef]
- Haley, S.M.; Jette, A.M.; Coster, W.J.; Kooyoomjian, J.T.; Levenson, S.; Heeren, T.; Ashba, J. Late Life Function and Disability Instrument: II. Development and evaluation of the function component. J. Gerontol. A Biol. Sci. Med. Sci. 2002, 57, M217–M222. [Google Scholar] [CrossRef] [PubMed] [Green Version]
- Nasreddine, Z.S.; Phillips, N.A.; Bédirian, V.; Charbonneau, S.; Whitehead, V.; Collin, I.; Cummings, J.L.; Chertkow, H. The Montreal Cognitive Assessment, MoCA: A brief screening tool for mild cognitive impairment. J. Am. Geriatr. Soc. 2005, 53, 695–699. [Google Scholar] [CrossRef]
- Kempen, G.I.; Yardley, L.; van Haastregt, J.C.; Zijlstra, G.A.; Beyer, N.; Hauer, K.; Todd, C. The Short FES-I: A shortened version of the falls efficacy scale-international to assess fear of falling. Age Ageing 2008, 37, 45–50. [Google Scholar] [CrossRef] [Green Version]
- Clemson, L.; Fiatarone Singh, M.A.; Bundy, A.; Cumming, R.G.; Manollaras, K.; O’Loughlin, P.; Black, D. Integration of balance and strength training into daily life activity to reduce rate of falls in older people (the LiFE study): Randomised parallel trial. BMJ 2012, 345, e4547. [Google Scholar] [CrossRef] [PubMed] [Green Version]
- Howe, J.A.; Inness, E.L.; Venturini, A.; Williams, J.I.; Verrier, M.C. The Community Balance and Mobility Scale--a balance measure for individuals with traumatic brain injury. Clin. Rehabil. 2006, 20, 885–895. [Google Scholar] [CrossRef] [PubMed]
- Rikli, R.E.; Jones, C.J. Development and validation of a functional fitness test for community-residing older adults. J. Aging Phys. Act. 1999, 7, 129–161. [Google Scholar] [CrossRef]
- Mellone, S.; Tacconi, C.; Schwickert, L.; Klenk, J.; Becker, C.; Chiari, L. Smartphone-based solutions for fall detection and prevention: The FARSEEING approach. Z. Gerontol. Geriatr. 2012, 45, 722–727. [Google Scholar] [CrossRef]
- Coni, A.; Van Ancum, J.M.; Bergquist, R.; Mikolaizak, A.S.; Mellone, S.; Chiari, L.; Maier, A.B.; Pijnappels, M. Comparison of Standard Clinical and Instrumented Physical Performance Tests in Discriminating Functional Status of High-Functioning People Aged 61–70 Years Old. Sensors 2019, 19, 449. [Google Scholar] [CrossRef] [Green Version]
- Mehmood, T.; Liland, K.H.; Snipen, L.; Sæbø, S. A review of variable selection methods in Partial Least Squares Regression. Chemom. Intell. Lab. Syst. 2012, 118, 62–69. [Google Scholar] [CrossRef]
- Hair, J.F.; Ringle, C.M.; Sarstedt, M. PLS-SEM: Indeed a silver bullet. J. Mark. Theory Pract. 2011, 19, 139–152. [Google Scholar] [CrossRef]
- Chen, T.; Chou, L.-S. Effects of Muscle Strength and Balance Control on Sit-to-Walk and Turn Durations in the Timed Up and Go Test. Arch. Phys. Med. Rehabil. 2017, 98, 2471–2476. [Google Scholar] [CrossRef] [PubMed]
- Caronni, A.; Sterpi, I.; Antoniotti, P.; Aristidou, E.; Nicolaci, F.; Picardi, M.; Pintavalle, G.; Redaelli, V.; Achille, G.; Sciumè, L.; et al. Criterion validity of the instrumented Timed Up and Go test: A partial least square regression study. Gait Posture 2018, 61, 287–293. [Google Scholar] [CrossRef] [PubMed]
- Palmerini, L.; Mellone, S.; Avanzolini, G.; Valzania, F.; Chiari, L. Quantification of motor impairment in Parkinson’s disease using an instrumented timed up and go test. IEEE Trans. Neural Syst. Rehabil. Eng. 2013, 21, 664–673. [Google Scholar] [CrossRef] [PubMed]
- Salarian, A.; Horak, F.B.; Zampieri, C.; Carlson-Kuhta, P.; Nutt, J.G.; Aminian, K. iTUG, a sensitive and reliable measure of mobility. IEEE Trans. Neural Syst. Rehabil. Eng. 2010, 18, 303–310. [Google Scholar] [CrossRef] [Green Version]
- Greene, B.R.; O’Donovan, A.; Romero-Ortuno, R.; Cogan, L.; Scanaill, C.N.; Kenny, R.A. Quantitative Falls Risk Assessment Using the Timed Up and Go Test. IEEE Trans. Biomed. Eng. 2010, 57, 2918–2926. [Google Scholar] [CrossRef]
- Mirelman, A.; Weiss, A.; Buchman, A.S.; Bennett, D.A.; Giladi, N.; Hausdorff, J.M. Association between performance on Timed Up and Go subtasks and mild cognitive impairment: Further insights into the links between cognitive and motor function. J. Am. Geriatr. Soc. 2014, 62, 673–678. [Google Scholar] [CrossRef]
- Buchman, A.S.; Boyle, P.A.; Leurgans, S.E.; Barnes, L.L.; Bennett, D.A. Cognitive function is associated with the development of mobility impairments in community-dwelling elders. Am. J. Geriatr. Psychiatry 2011, 19, 571–580. [Google Scholar] [CrossRef] [Green Version]
- Vabalas, A.; Gowen, E.; Poliakoff, E.; Casson, A.J. Machine learning algorithm validation with a limited sample size. PLoS ONE 2019, 14, e0224365. [Google Scholar] [CrossRef]
- Bergquist, R.; Vereijken, B.; Mellone, S.; Corzani, M.; Helbostad, J.L.; Taraldsen, K. App-based Self-administrable Clinical Tests of Physical Function: Development and Usability Study. JMIR Mhealth Uhealth 2020, 8, e16507. [Google Scholar] [CrossRef]
- Kvedar, J.; Coye, M.J.; Everett, W. Connected Health: A Review Of Technologies And Strategies To Improve Patient Care With Telemedicine And Telehealth. Health Aff. 2014, 33, 194–199. [Google Scholar] [CrossRef] [Green Version]


| Community-Dwellers (n = 40) | Outpatients (n = 20) | |
|---|---|---|
| Age, in years | 71.8 (7.3) | 78.9 (5.9) |
| Sex (M/F) | 17/23 | 11/9 |
| Years of education | 14.6 (3.7) | 11.5 (4.3) |
| Height (cm) | 169.5 (9.6) | 165.9 (11.1) |
| Weight (kg) | 72 (12.6) | 75.5 (16.9) |
| BMI (kg/m2) | 25.0 (3.6) | 27.3 (4.3) |
| MoCA (0–30) | 27.1 (4.9) | 23.7 (2.2) |
| CBMS (0–96) | 66.7 (18.3) | 15.0 (17.2) |
| LLFDI (0–100) | 75.5 (9.9) | 51.3 (14.4) |
| TUG (s) | 8.3 (1.2) | 13.9 (4.0) |
| SPPB (0–12) | 11.7 (0.9) | 9.0 (2.4) |
| 8-LBS (1–8) | 5.4 (1.5) | 4.3 (1.4) |
| 30-CST (no. of repetitions) | 15.3 (2.9) | 8.8 (3.3) |
| Gait speed, habitual (m/s) | 1.36 (0.20) | 0.88 (0.21) |
| Gait speed, fast (m/s) | 1.83 (0.27) | 1.18 (0.30) |
| Short FES-I (7–28) | 8.1 (1.5) | 10.7 (4.0) |
| Variables Selected by PLSR | Loading Scores, Component 1 | Loading Scores, Component 2 | Loading Scores, Component 3 | VIP | R2 |
|---|---|---|---|---|---|
| iTUG features | |||||
| Mean velocity first turn [°/s] | 0.215 | 0.032 | −0.091 | 1.123 | 0.739 |
| Walk duration [s] | −0.222 | 0.024 | 0.028 | 1.123 | 0.739 |
| Mean velocity TtS [°/s] | 0.207 | 0.094 | −0.069 | 1.124 | 0.722 |
| Total duration [s] | −0.218 | 0.030 | 0.015 | 1.104 | 0.706 |
| Total number of steps | −0.213 | −0.039 | 0.079 | 1.099 | 0.706 |
| Peak velocity TtS [°/s] | 0.209 | 0.045 | −0.035 | 1.092 | 0.700 |
| Peak velocity first turn [°/s] | 0.207 | −0.001 | −0.056 | 1.074 | 0.674 |
| Average step length [m] | 0.204 | 0.067 | −0.054 | 1.064 | 0.654 |
| TtS turning duration [s] | −0.205 | −0.032 | 0.065 | 1.055 | 0.647 |
| Turn duration [s] | −0.208 | 0.000 | 0.130 | 1.056 | 0.643 |
| Gait speed [m/s] | 0.207 | −0.009 | 0.009 | 1.055 | 0.634 |
| Number of steps in first turn | −0.201 | −0.020 | 0.200 | 1.032 | 0.601 |
| NAJS first turn | −0.182 | −0.121 | 0.205 | 1.004 | 0.560 |
| RMS acc. walking V [m/s2] | 0.196 | −0.112 | 0.074 | 0.991 | 0.548 |
| NAJS TtS | −0.173 | −0.177 | 0.130 | 0.985 | 0.523 |
| RMS acc. walking AP [m/s2] | 0.191 | −0.266 | 0.080 | 1.014 | 0.449 |
| RMS angular velocity walking V [°/s2] | 0.185 | −0.188 | 0.012 | 0.953 | 0.443 |
| Range angular velocity walking V [°/s2] | 0.181 | −0.182 | 0.042 | 0.929 | 0.433 |
| TtS duration [s] | −0.173 | 0.061 | 0.091 | 0.887 | 0.419 |
| Jerk score walking AP [m−1] | 0.174 | −0.137 | −0.048 | 0.884 | 0.416 |
| StW duration [s] | −0.140 | −0.076 | −0.203 | 0.891 | 0.373 |
| Step regularity V [%] | 0.138 | 0.163 | −0.070 | 0.899 | 0.366 |
| Jerk score walking V | 0.143 | 0.073 | −0.047 | 0.785 | 0.338 |
| Descriptives | |||||
| Age | −0.129 | −0.401 | −0.327 | 1.404 | 0.472 |
| Education | 0.113 | 0.496 | 0.047 | 1.188 | 0.352 |
| Component 1 | Component 2 | Component 3 | Total | ||
| Mean Explained Variation (R2) | 0.771 | 0.058 | 0.023 | 0.852 | |
| 95% CI | 0.769–0.772 | 0.054–0.061 | 0.020–0.027 | 0.849–0.855 |
| Variables Selected by PLSR | Loading Scores, Component 1 | Loading Scores, Component 2 | VIP | R2 |
|---|---|---|---|---|
| Clinical | ||||
| TUG | −0.398 | 0.102 | 1.133 | 0.698 |
| Gait speed, fast | 0.385 | −0.057 | 1.115 | 0.676 |
| Gait speed, habitual | 0.381 | −0.034 | 1.113 | 0.672 |
| SPPB | 0.371 | −0.260 | 1.010 | 0.533 |
| 30-CST | 0.346 | −0.320 | 0.985 | 0.504 |
| 8-LBS | 0.257 | 0.215 | 0.814 | 0.335 |
| Short FES-I | −0.314 | 0.451 | 0.855 | 0.307 |
| Descriptives | ||||
| Age | −0.250 | −0.728 | 1.065 | 0.472 |
| Education | 0.270 | 0.331 | 0.843 | 0.352 |
| Component 1 | Component 2 | Total | ||
| Mean explained variation (R2) | 0.798 | 0.027 | 0.825 | |
| 95% CI | 0.796–0.801 | 0.024–0.029 | 0.822–0.828 |
© 2020 by the authors. Licensee MDPI, Basel, Switzerland. This article is an open access article distributed under the terms and conditions of the Creative Commons Attribution (CC BY) license (http://creativecommons.org/licenses/by/4.0/).
Share and Cite
Bergquist, R.; Nerz, C.; Taraldsen, K.; Mellone, S.; Ihlen, E.A.F.; Vereijken, B.; Helbostad, J.L.; Becker, C.; Mikolaizak, A.S. Predicting Advanced Balance Ability and Mobility with an Instrumented Timed Up and Go Test. Sensors 2020, 20, 4987. https://doi.org/10.3390/s20174987
Bergquist R, Nerz C, Taraldsen K, Mellone S, Ihlen EAF, Vereijken B, Helbostad JL, Becker C, Mikolaizak AS. Predicting Advanced Balance Ability and Mobility with an Instrumented Timed Up and Go Test. Sensors. 2020; 20(17):4987. https://doi.org/10.3390/s20174987
Chicago/Turabian StyleBergquist, Ronny, Corinna Nerz, Kristin Taraldsen, Sabato Mellone, Espen A.F. Ihlen, Beatrix Vereijken, Jorunn L. Helbostad, Clemens Becker, and A. Stefanie Mikolaizak. 2020. "Predicting Advanced Balance Ability and Mobility with an Instrumented Timed Up and Go Test" Sensors 20, no. 17: 4987. https://doi.org/10.3390/s20174987