Foot Strike Angle Prediction and Pattern Classification Using LoadsolTM Wearable Sensors: A Comparison of Machine Learning Techniques

 , , , ,
Abstract
:1. Introduction
2. Materials and Methods
2.1. Participants and Experimental Approach
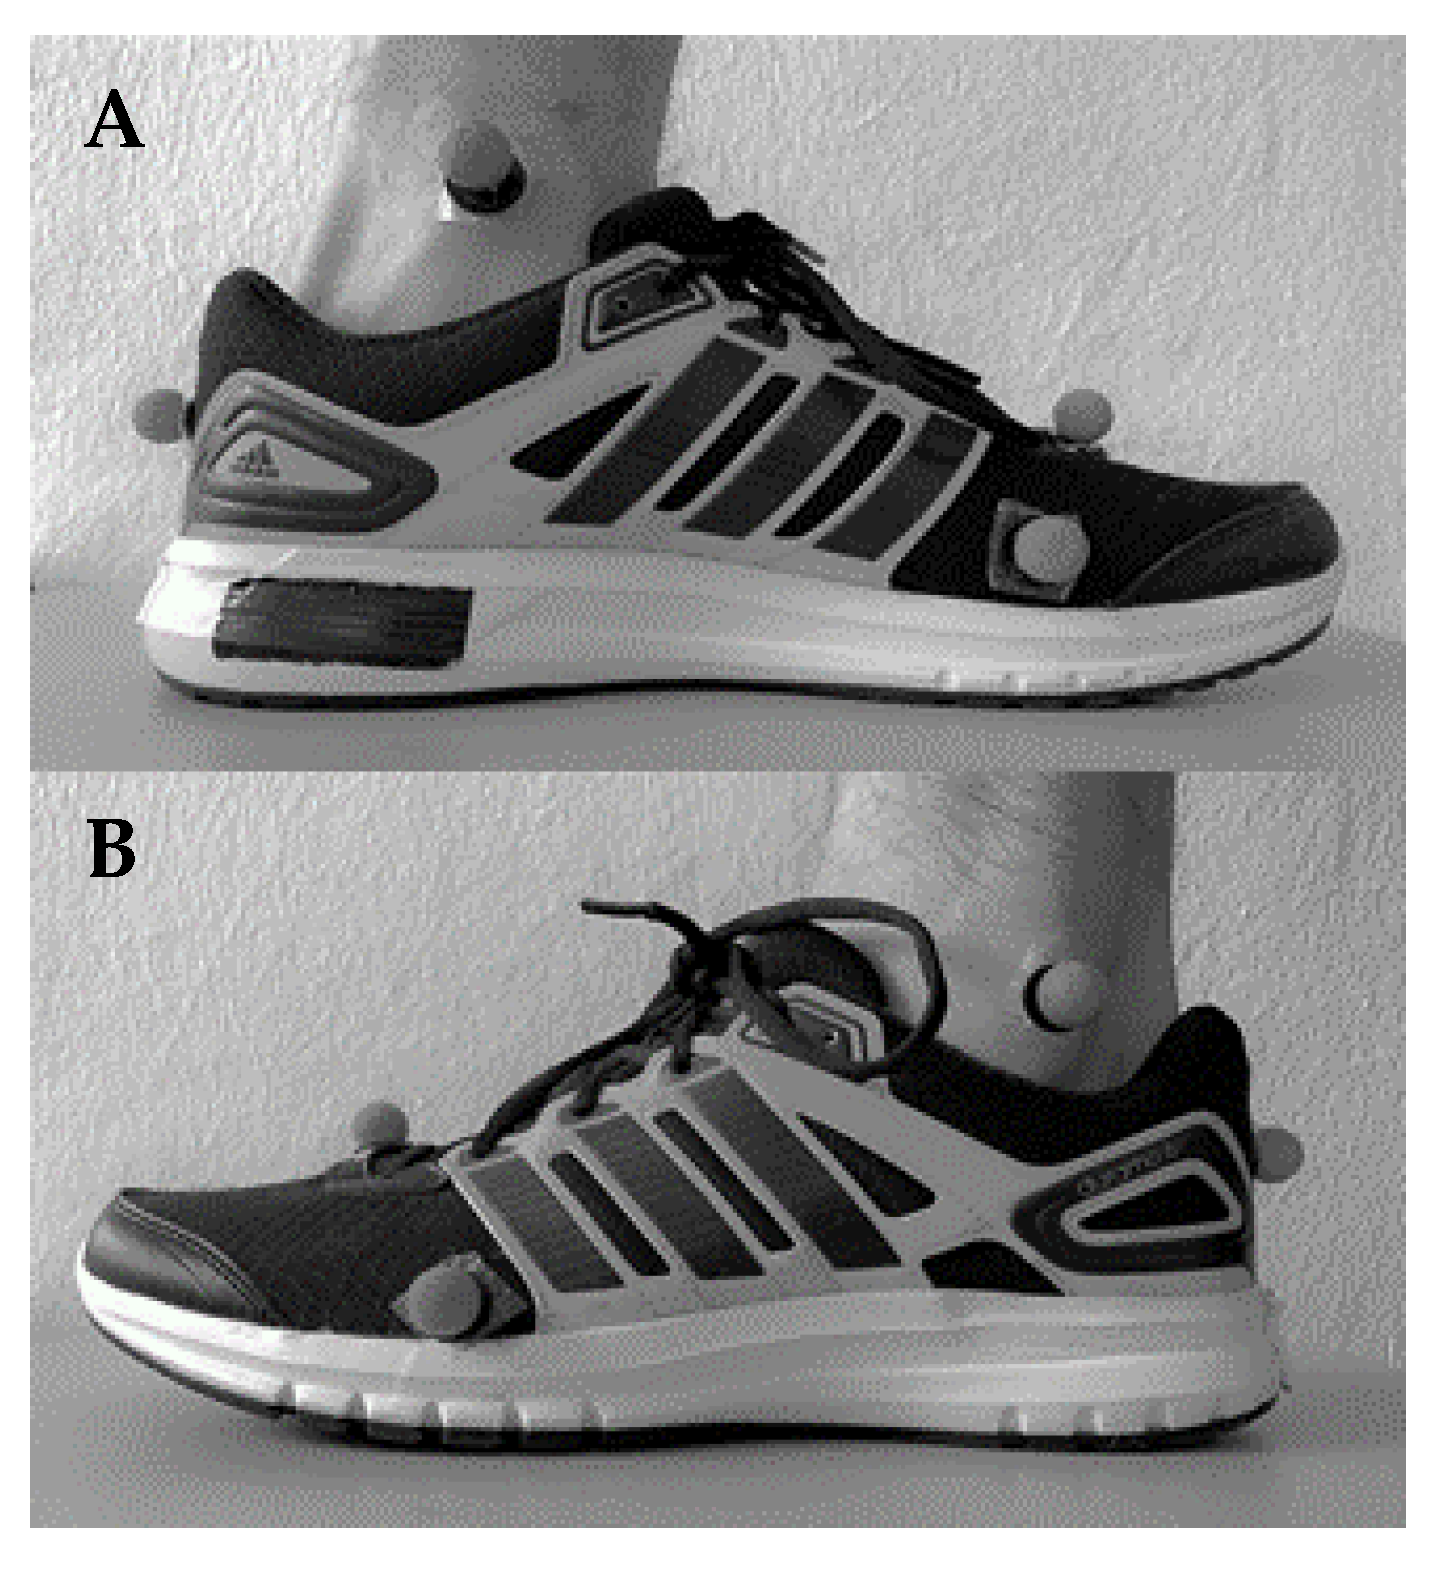
2.2. Measurements
2.3. Data Processing
2.4. Modeling Approaches
2.5. Model Development
2.6. Model Accuracy and Precision
3. Results
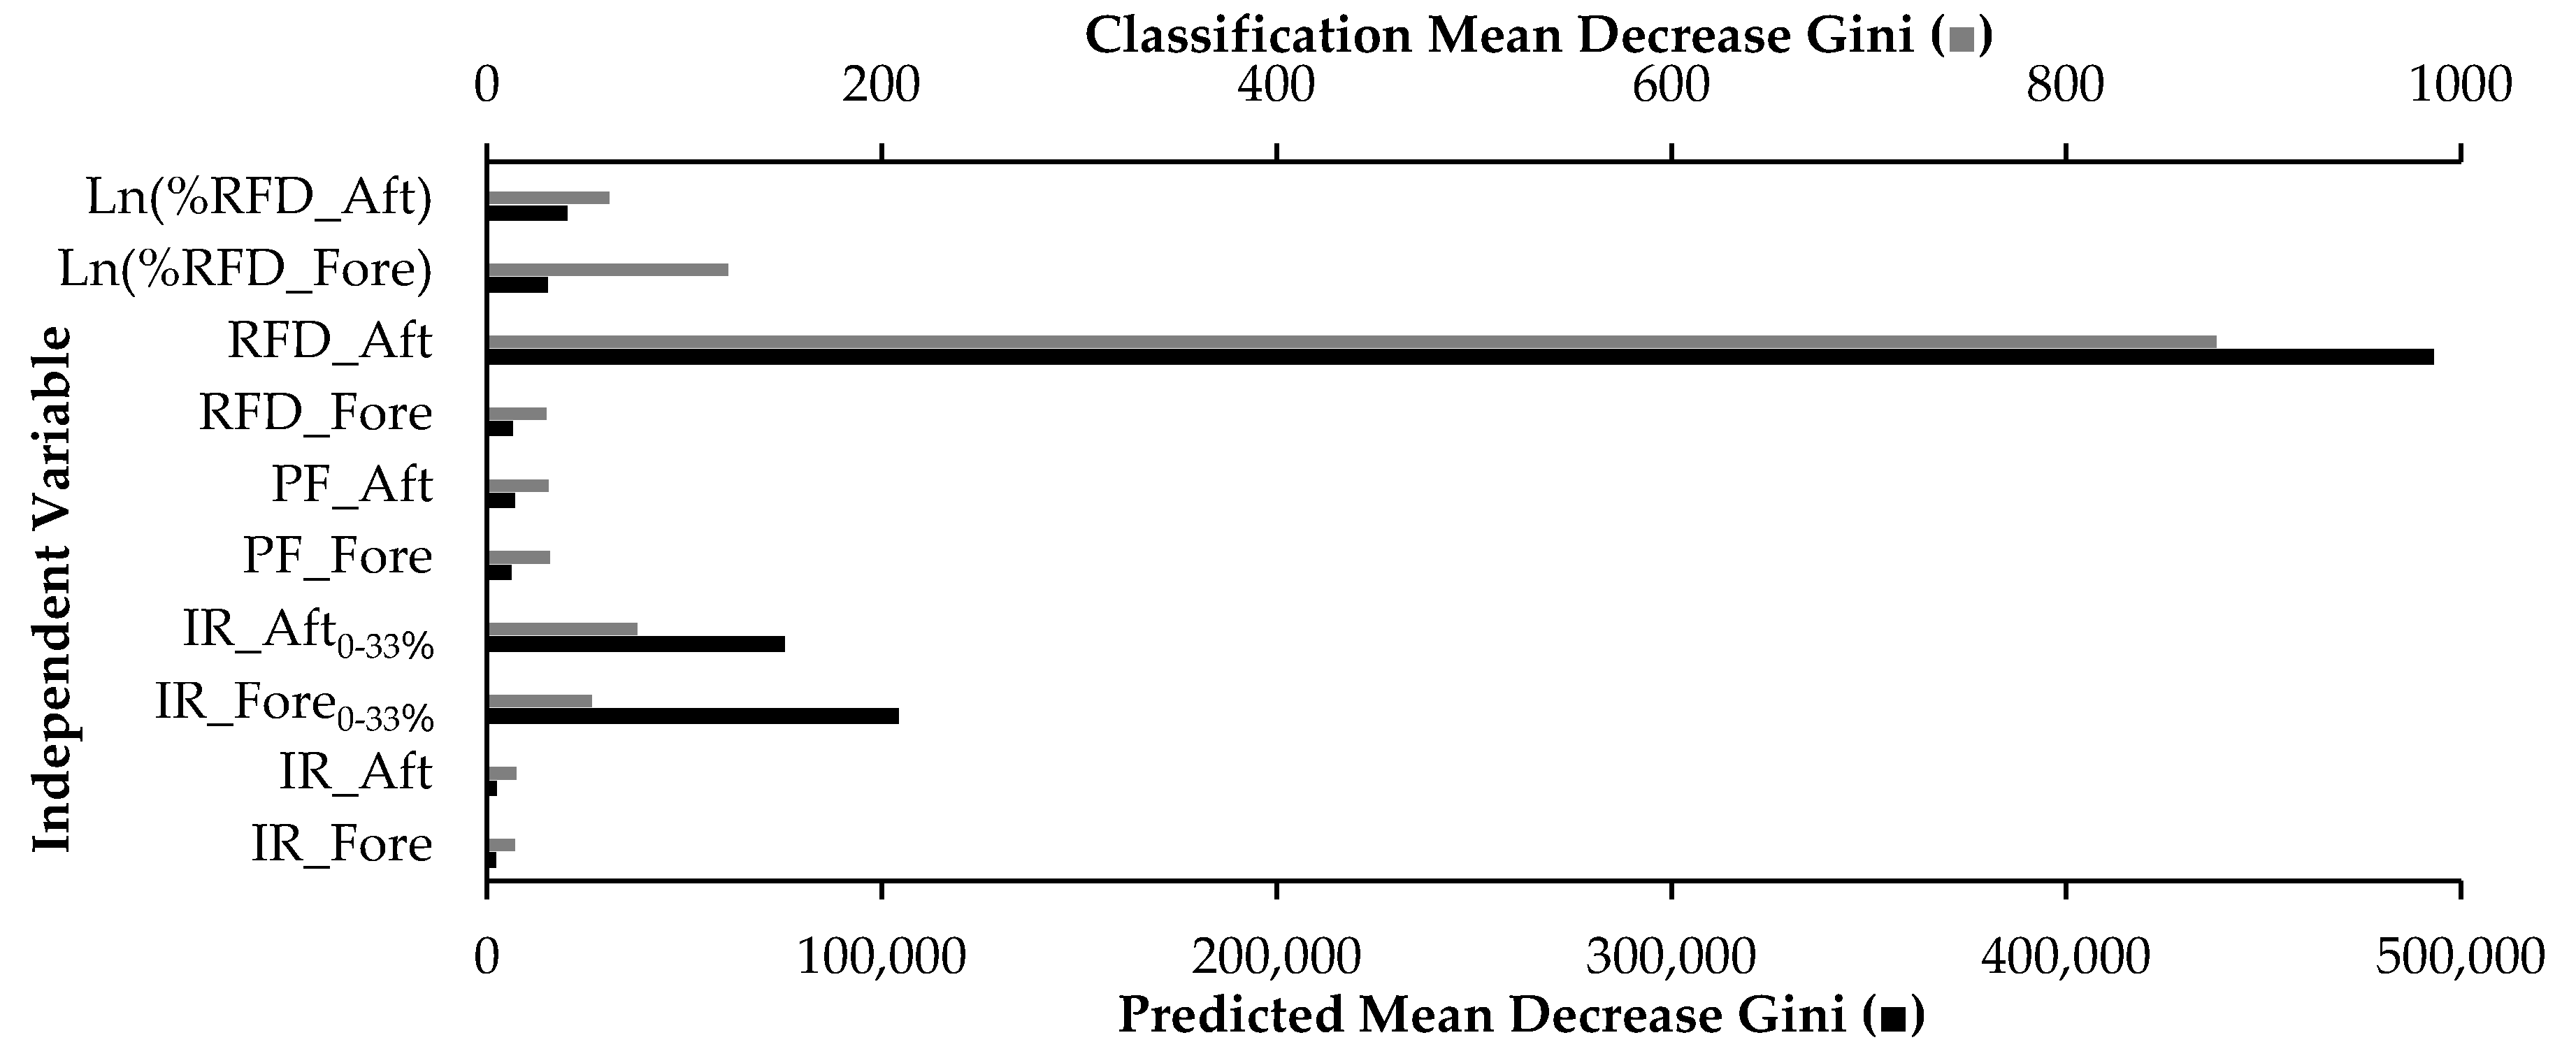
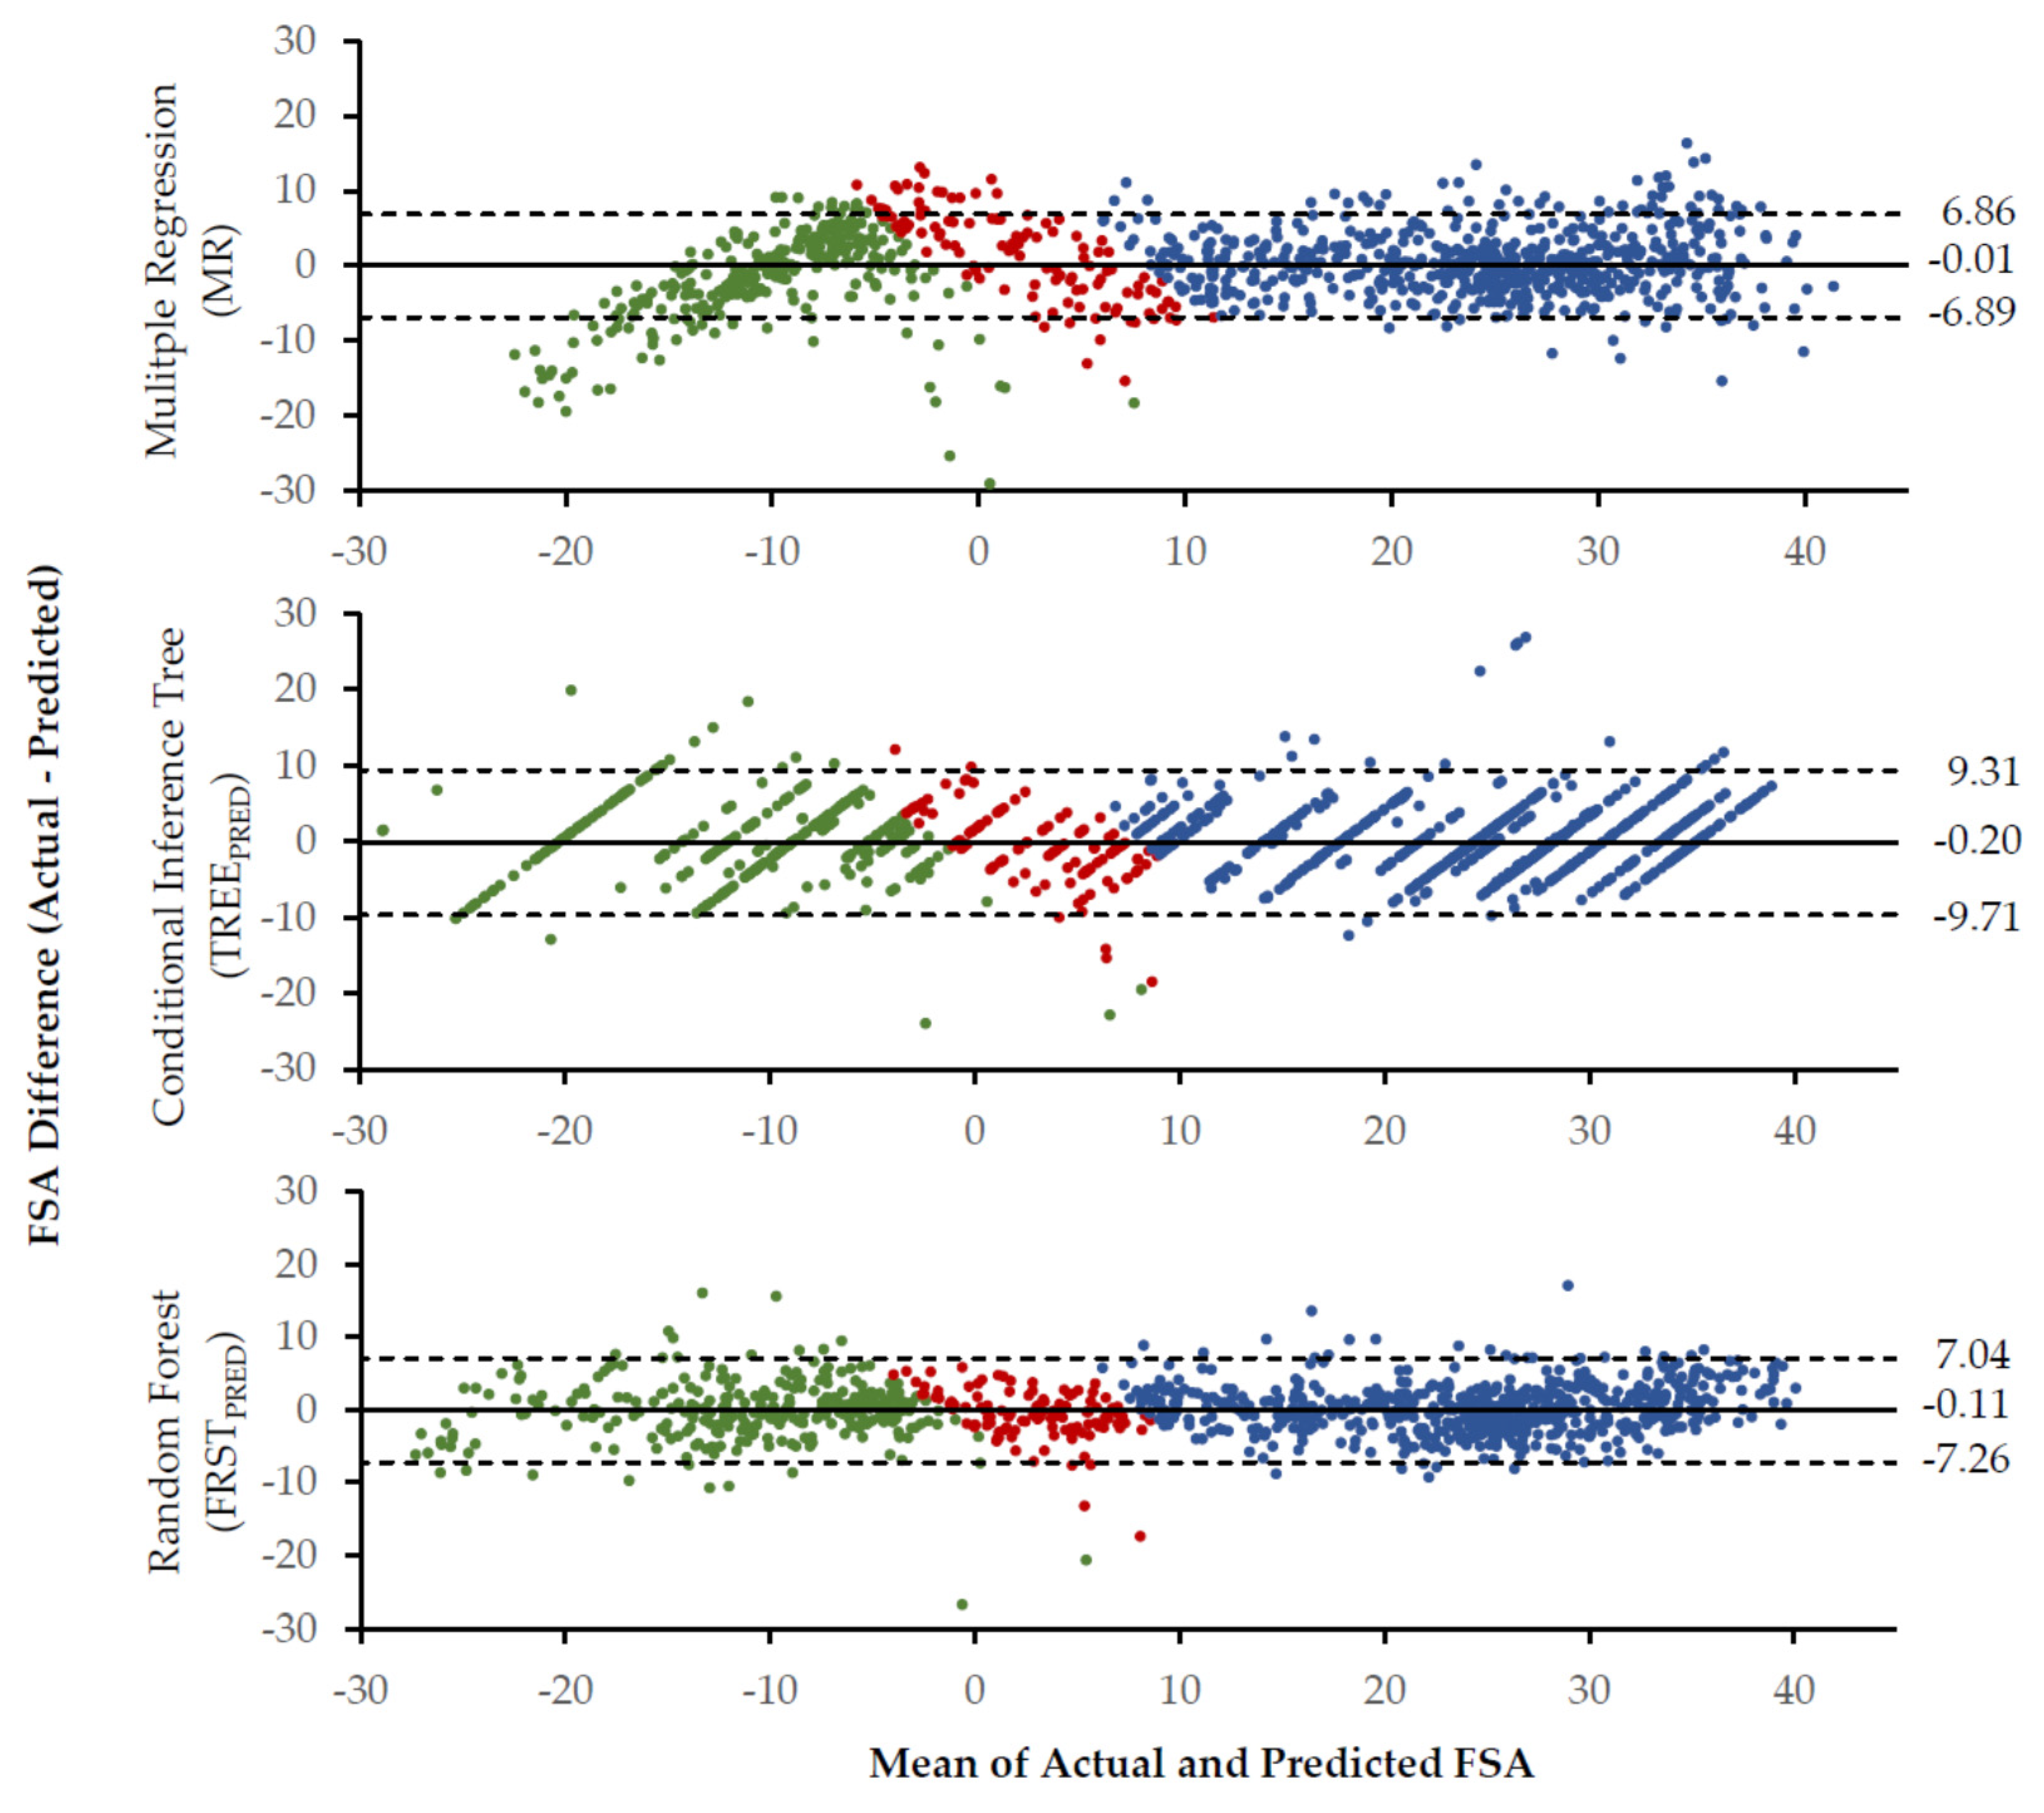
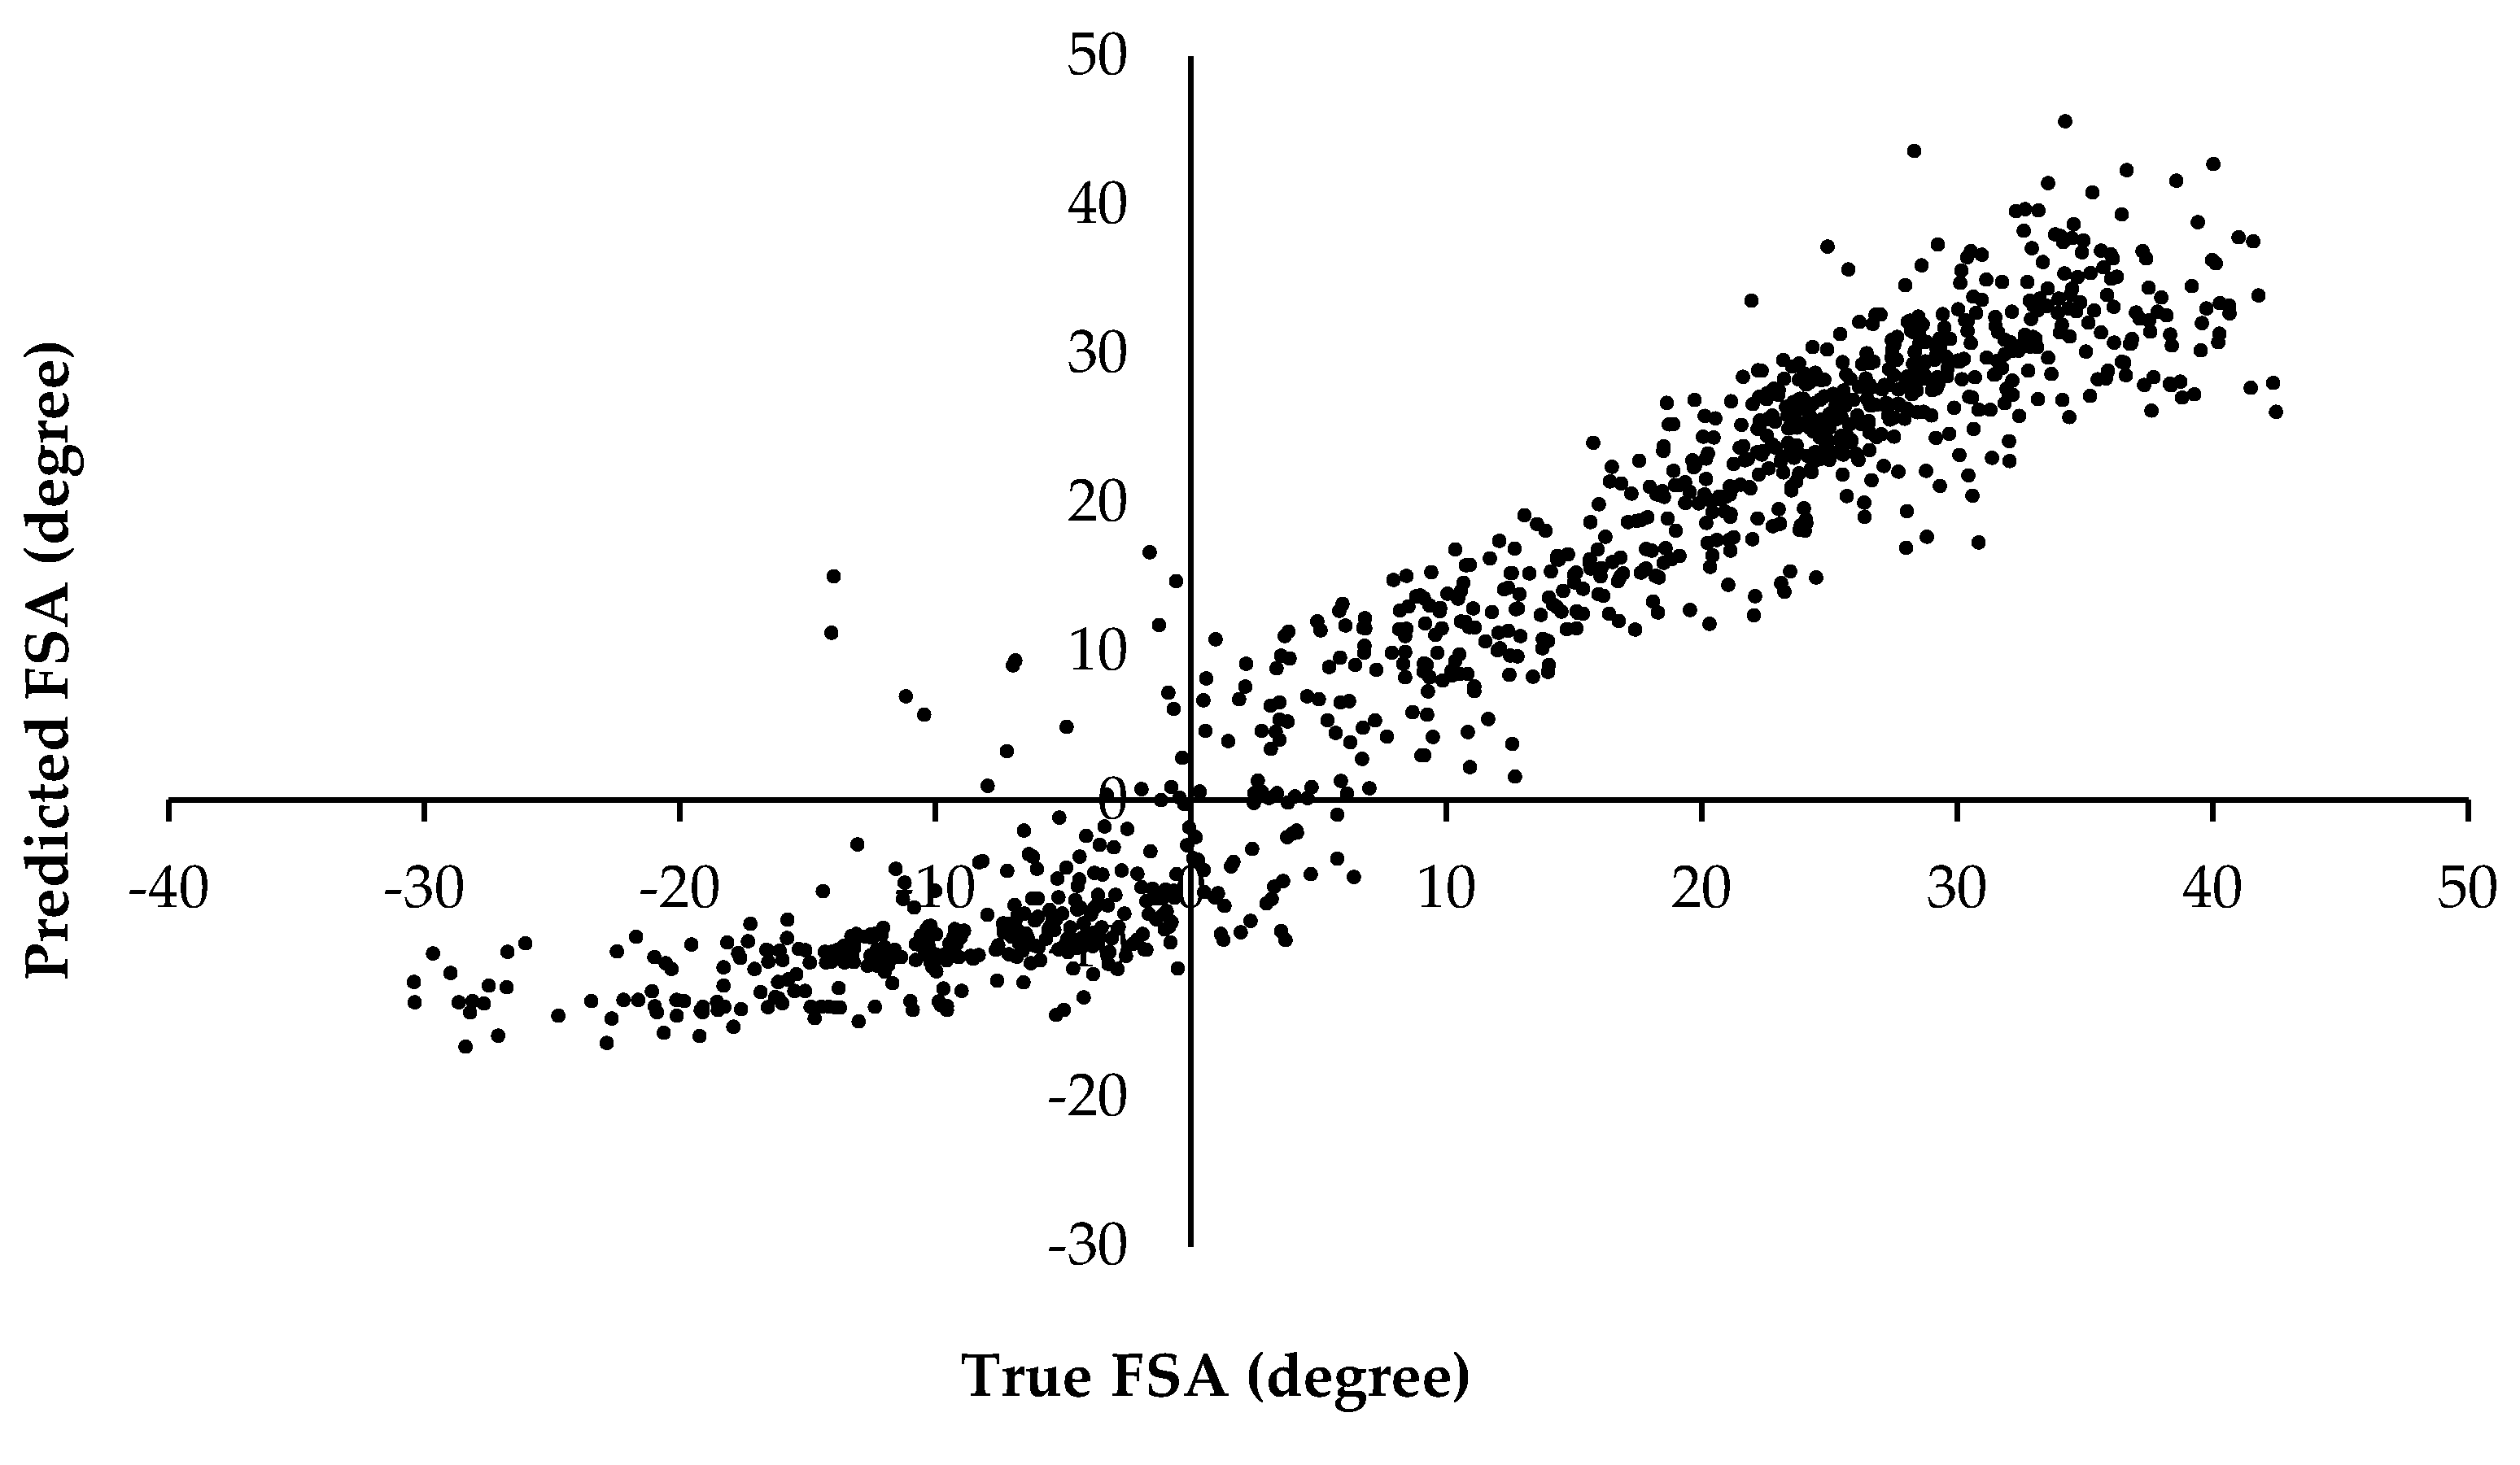
3.1. FSA Prediction
3.2. FSP Classification
4. Discussion
4.1. FSA Prediction
4.2. FSP Classification
4.3. Application
5. Conclusions
Author Contributions
Funding
Acknowledgments
Conflicts of Interest
References
- Moore, I.S. Is There an Economical Running Technique? A Review of Modifiable Biomechanical Factors Affecting Running Economy. Sports Med. 2016, 46, 793–807. [Google Scholar] [CrossRef] [PubMed] [Green Version]
- Paradisis, G.P.; Cooke, C. Kinematic and postural characteristics of sprint running on sloping surfaces. J. Sports Sci. 2001, 19, 149–159. [Google Scholar] [CrossRef] [PubMed]
- Nigg, B.M.; Baltich, J.; Hoerzer, S.; Enders, H. Running shoes and running injuries: Mythbusting and a proposal for two new paradigms: ‘preferred movement path’ and ‘comfort filter’. Br. J. Sports Med. 2015, 49, 1290–1294. [Google Scholar] [CrossRef] [PubMed] [Green Version]
- Sinclair, J.; Shore, H.; Dillon, S. The effect of minimalist, maximalist and energy return footwear of equal mass on running economy and substrate utilisation. Comp. Exerc. Physiol. 2016, 12, 49–54. [Google Scholar] [CrossRef] [Green Version]
- Lindorfer, J.; Kröll, J.; Schwameder, H. Does enhanced footwear comfort affect oxygen consumption and running biomechanics? Eur. J. Sport Sci. 2019, 20, 468–476. [Google Scholar] [CrossRef] [Green Version]
- Mohr, M.; Meyer, C.; Nigg, S.; Nigg, B. The relationship between footwear comfort and variability of running kinematics. Footwear Sci. 2017, 9, S45–S47. [Google Scholar] [CrossRef]
- Malisoux, L.; Chambon, N.; Delattre, N.; Gueguen, N.; Urhausen, A.; Theisen, D. Injury risk in runners using standard or motion control shoes: A randomised controlled trial with participant and assessor blinding. Br. J. Sports Med. 2016, 50, 481–487. [Google Scholar] [CrossRef]
- Zrenner, M.; Ullrich, M.; Zobel, P.; Jensen, U.; Laser, F.; Groh, B.H.; Duemler, B.; Eskofier, B.M. Kinematic Parameter Evaluation for the Purpose of a Wearable Running Shoe Recommendation. In Proceedings of the 2018 IEEE 15th International Conference on Wearable and Implantable Body Sensor Networks (BSN), Las Vegas, NV, USA, 4–7 March 2018; pp. 106–109. [Google Scholar]
- Lieberman, D.E.; Venkadesan, M.; Werbel, W.A.; Daoud, A.I.; D’Andrea, S.; Davis, I.S.; Mang’Eni, R.O.; Pitsiladis, Y. Foot strike patterns and collision forces in habitually barefoot versus shod runners. Nat. Cell Biol. 2010, 463, 531–535. [Google Scholar] [CrossRef]
- Hamill, J.; Gruber, A.H.; Derrick, T.R. Lower extremity joint stiffness characteristics during running with different footfall patterns. Eur. J. Sport Sci. 2012, 14, 130–136. [Google Scholar] [CrossRef]
- Cheung, R.; Davis, I.S. Landing Pattern Modification to Improve Patellofemoral Pain in Runners: A Case Series. J. Orthop. Sports Phys. Ther. 2011, 41, 914–919. [Google Scholar] [CrossRef]
- Maiwald, C.; Sterzing, T.; Mayer, T.; Milani, T. Detecting foot-to-ground contact from kinematic data in running. Footwear Sci. 2009, 1, 111–118. [Google Scholar] [CrossRef]
- Seiberl, W.; Jensen, E.; Merker, J.; Leitel, M.; Schwirtz, A. Accuracy and precision of loadsol® insole force-sensors for the quantification of ground reaction force-based biomechanical running parameters. Eur. J. Sport Sci. 2018, 18, 1100–1109. [Google Scholar] [CrossRef] [PubMed]
- Altman, A.R.; Davis, I.S. A kinematic method for footstrike pattern detection in barefoot and shod runners. Gait Posture 2012, 35, 298–300. [Google Scholar] [CrossRef] [PubMed] [Green Version]
- Falbriard, M.; Meyer, F.; Mariani, B.; Millet, G.P.; Aminian, K. Contact Time and Foot Strike Angles Estimation Using Foot Worn Inertial Sensors in Running. ISBS Proc. Arch. 2017, 35, 213. Available online: https://commons.nmu.edu/isbs/vol35/iss1/213 (accessed on 4 March 2020).
- Shiang, T.-Y.; Hsieh, T.-Y.; Lee, Y.-S.; Wu, C.-C.; Yu, M.-C.; Mei, C.-H.; Tai, I.-H. Determine the Foot Strike Pattern Using Inertial Sensors. J. Sens. 2016, 2016. [Google Scholar] [CrossRef] [Green Version]
- Iosa, M.; Picerno, P.; Paolucci, S.; Morone, G. Wearable Inertial Sensors for Human Movement Analysis. Expert Rev. Med. Devices 2016, 13, 641–659. [Google Scholar] [CrossRef]
- Aubry, R.L.; Power, G.A.; Burr, J.F. An Assessment of Running Power as a Training Metric for Elite and Recreational Runners. J. Strength Cond. Res. 2018, 32, 2258–2264. [Google Scholar] [CrossRef]
- García-Pinillos, F.; Latorre-Román, P.Á.; Roche-Seruendo, L.E.; García-Ramos, A. Prediction of power output at different running velocities through the two-point method with the Stryd™ power meter. Gait Posture 2019, 68, 238–243. [Google Scholar] [CrossRef]
- García-Pinillos, F.; Roche-Seruendo, L.E.; Marcén-Cinca, N.; Marco-Contreras, L.A.; Latorre-Román, P.A. Absolute Reliability and Concurrent Validity of the Stryd System for the Assessment of Running Stride Kinematics at Different Velocities. J. Strength Cond. Res. 2018. [Google Scholar] [CrossRef]
- Arampatzis, A.; Knicker, A.; Metzler, V.; Brüggemann, G.-P. Mechanical power in running: A comparison of different approaches. J. Biomech. 2000, 33, 457–463. [Google Scholar] [CrossRef]
- Ancillao, A.; Tedesco, S.; Barton, J.; O’Flynn, B. Indirect Measurement of Ground Reaction Forces and Moments by Means of Wearable Inertial Sensors: A Systematic Review. Sensors 2018, 18, 2564. [Google Scholar] [CrossRef] [PubMed] [Green Version]
- Cheung, R.; Zhang, J.H.; Chan, Z.Y.; An, W.W.; Au, I.P.H.; MacPhail, A.; Davis, I.S. Shoe-mounted accelerometers should be used with caution in gait retraining. Scand. J. Med. Sci. Sports 2019, 29, 835–842. [Google Scholar] [CrossRef]
- Ngueleu, A.M.; Blanchette, A.K.; Bouyer, L.J.; Maltais, D.B.; McFadyen, B.J.; Moffet, H.; Batcho, C.S. Design and Accuray of an Instrumented Insole Using Pressure Sensors for Step Count. Sensors 2019, 19, 984. [Google Scholar] [CrossRef] [PubMed] [Green Version]
- Roth, N.; Martindale, C.F.; Eskofier, B.M.; Gaßner, H.; Kohl, Z.; Klucken, J. Synchronized Sensor Insoles for Clinical Gait Analysis in Home-Monitoring Applications. Curr. Dir. Biomed. Eng. 2018, 4, 433–437. [Google Scholar] [CrossRef]
- Cheung, R.T.; Ivan, P.H.A.; Au, I.P.H.; Zhang, J.H.; Chan, Z.Y.S.; Man, A.; Lau, F.O.Y.; Lam, M.K.Y.; Lau, K.K.; Leung, C.Y.; et al. Measurement agreement between a newly developed sensing insole and traditional laboratory-based method for footstrike pattern detection in runners. PLoS ONE 2017, 12, e0175724. [Google Scholar] [CrossRef] [Green Version]
- Fritz, J.; Brunauer, R.; Snyder, C.; Kröll, J.; Stöggl, T.; Schwameder, H. Foot strike angle calculation during running based on in-shoe pressure measurements. Footwear Sci. 2019, 11, S147–S149. [Google Scholar] [CrossRef] [Green Version]
- Bruening, D.A.; Cooney, K.M.; Buczek, F.L. Analysis of a kinetic multi-segment foot model. Part I: Model repeatability and kinematic validity. Gait Posture 2012, 35, 529–534. [Google Scholar] [CrossRef] [Green Version]
- Panero, E.; Gastaldi, L.; Rapp, W. Two-Segments Foot Model for Biomechanical Motion Analysis. In Advances in Mechanism and Machine Science; Springer Science and Business Media LLC: Berlin, Germany, 2017; Volume 49, pp. 988–995. [Google Scholar]
- Burns, G.T.; Zendler, J.D.; Zernicke, R.F. Validation of a wireless shoe insole for ground reaction force measurement. J. Sports Sci. 2019, 37, 1129–1138. [Google Scholar] [CrossRef]
- Renner, K.E.; Williams, D.B.; Queen, R.M. The Reliability and Validity of the Loadsol® under Various Walking and Running Conditions. Sensors 2019, 19, 265. [Google Scholar] [CrossRef] [Green Version]
- Alpaydin, E. Introduction to Machine Learning, 3rd ed.; Massachusetts Institute of Technology: Cambridge, MA, USA, 2014; Available online: http://dl.matlabyar.com/siavash/ML/Book/Ethem%20Alpaydin-Introduction%20to%20Machine%20Learning-The%20MIT%20Press%20(2014).pdf (accessed on 12 March 2020).
- Fahrmeir, L.; Kneib, T.; Lang, S. Regression: Modelle, Methoden und Anwendungen; Springer: Berlin, Germany, 2009. [Google Scholar]
- Hothorn, T.; Hornik, K.; Zeileis, A. Unbiased Recursive Partitioning: A Conditional Inference Framework. J. Comput. Graph. Stat. 2006, 15, 651–674. [Google Scholar] [CrossRef] [Green Version]
- Breiman, L. Random Forests. Mach. Learn. 2001, 45, 5–32. [Google Scholar] [CrossRef] [Green Version]
- Fernandez-Delgado, M.; Cernadas, E.; Barro, S.; Amorim, D. Do we Need Hundreds of Classifiers to Solve Real World Classification Problems? J. Mach. Learn. Res. 2014, 15, 3133–3181. [Google Scholar]
- Moore, S.R.; Fritz, J.; Kröll, J.; Stöggl, T.; Schwameder, H. Consistency and validity of acute foot-strike pattern alterations during laboratory-based running. ISBS Proc. Arch. 2020, 38, 848. [Google Scholar]
- Selbie, W.S.; Hamill, J.; Kepple, T. Chapter 7: Three Dimensional Kinetics. In Research Methods in Biomechanics, 2nd ed.; Robertson, G., Caldwell, G., Hamill, J., Whittlesey, S., Eds.; Human Kinetics: Champaign, IL, USA, 2004; pp. 151–176. [Google Scholar]
- C-Motion, Inc. Visual3D Wiki Documentation. 2017. Available online: https://c-motion.com/v3dwiki/index.php?title=Main_Page (accessed on 24 January 2020).
- Neto, E.C.; Pratap, A.; Perumal, T.M.; Tummalacherla, M.; Snyder, P.; Bot, B.M.; Trister, A.D.; Friend, S.H.; Mangravite, L.; Omberg, L. Detecting the impact of subject characteristics on machine learning-based diagnostic applications. NPJ Digit. Med. 2019, 2, 1–6. [Google Scholar] [CrossRef] [Green Version]
- Little, M.A.; Varoquaux, G.; Saeb, S.; Lonini, L.; Jayaraman, A.; Mohr, D.C.; Kording, K.P. Using and understanding cross-validation strategies. Perspectives on Saeb et al. GigaScience 2017, 6. [Google Scholar] [CrossRef] [PubMed]
- Saeb, S.; Lonini, L.; Jayaraman, A.; Mohr, D.C.; Kording, K.P. The need to approximate the use-case in clinical machine learning. GigaScience 2017, 6. [Google Scholar] [CrossRef] [Green Version]
- Field, A. Discovering Statistics Using IBM SPSS Statistics, 3rd ed.; Sage Publications: London, UK, 2013. [Google Scholar]
- R Core Development Team. R: A Language and Environment for Statistical Computing; R Foundation for Statistical Computing: Vienna, Austria, 2018; Available online: https://www.r-project.org/ (accessed on 29 July 2020).
- Hothorn, T.; Zeileis, A. Partykit: A modular toolkit for recursive partytioning in R. J. Mach. Learn. Res. 2015, 16, 3905–3909. [Google Scholar]
- Liaw, A.; Wiener, M. Classification and Regression by randomForest. R News 2002, 2, 18–22. [Google Scholar]
- Probst, P.; Boulesteix, A.-L. To tune or not to tune the number of trees in random forest? J. Mach. Learn. Res. 2017, 18, 6673–6690. [Google Scholar]
- Kuhn, M. Caret: Classification and Regression Training. Available online: https://CRAN.R-project.org/package=caret (accessed on 9 June 2020).
- Calle, M.L.; Urrea, V. Letter to the Editor: Stability of Random Forest importance measures. Brief. Bioinform. 2011, 12, 86–89. [Google Scholar] [CrossRef] [Green Version]
- Galdi, P.; Tagliaferri, R. Data Mining: Accuracy and Error Measures for Classification and Prediction. In Encyclopedia of Bioinformatics and Computational Biology; Elsevier BV: Amsterdam, The Netherlands, 2019; pp. 431–436. [Google Scholar]
- Bland, J.M.; Altman, D.G. Statistical methods for assessing agreement between two methods of clinical measurement. Int. J. Nurs. Stud. 2010, 47, 931–936. [Google Scholar] [CrossRef]
- Mason, C.H.; Perreault, W.D. Collinearity, Power, and Interpretation of Multiple Regression Analysis. J. Mark. Res. 1991, 28, 268. [Google Scholar] [CrossRef]
- Delgado-Gonzalo, R.; Hubbard, J.; Renevey, P.; Lemkaddem, A.; Vellinga, Q.; Ashby, D.; Willardson, J.; Bertschi, M. Real-Time Gait Analysis with Accelerometer-Based Smart Shoes. In Proceedings of the 2017 39th Annual International Conference of the IEEE Engineering in Medicine and Biology Society (EMBC), Jeju Island, Korea, 11–15 July 2017; pp. 148–148c. [Google Scholar]
- Fong, D.T.-P.; Chan, Y.-Y.; Hong, Y.; Yung, P.S.-H.; Fung, K.-Y.; Chan, K.-M. A three-pressure-sensor (3PS) system for monitoring ankle supination torque during sport motions. J. Biomech. 2008, 41, 2562–2566. [Google Scholar] [CrossRef] [PubMed] [Green Version]
- Billing, D.C.; Nagarajah, C.R.; Hayes, J.P.; Baker, J. Predicting ground reaction forces in running using micro-sensors and neural networks. Sports Eng. 2006, 9, 15–27. [Google Scholar] [CrossRef]
- Cerezuela-Espejo, V.; Hernández-Belmonte, A.; Courel-Ibáñez, J.; Conesa-Ros, E.; Mora-Rodriguez, R.; Pallarés, J.G. Are we ready to measure running power? Repeatability and concurrent validity of five commercial technologies. Eur. J. Sport Sci. 2020, 1–10. [Google Scholar] [CrossRef] [PubMed]


| Parent Variable | Variable | Definition | Insole Sensor | Stance Phase [%] | Abbreviation |
|---|---|---|---|---|---|
| Impulse [N∙s] | Impulse Ratio [%] | Impulse ratio between the insole sensor and total foot during the entire or first third of the stance phase | Fore | 0–100% | IR_Fore |
| Aft | 0–100% | IR_Aft | |||
| Fore | 0-33% | IR_Fore0-33% | |||
| Aft | 0-33% | IR_Aft0-33% | |||
| Peak Force [N] | Peak Force Ratio [%] | Ratio of peak force measured from the insole sensor and total foot during the entire stance phase | Fore | 0–100% | PF_Fore |
| Aft | 0–100% | PF_Aft | |||
| Peak RFD [N∙s−1] | Peak RFD Ratio [%] | Ratio of peak RFD between the insole sensor and total foot | Fore | 0–100% | RFD_Fore |
| Aft | 0–100% | RFD_Aft | |||
| Ln(Peak RFD) [unit] | Natural logarithm of the occurrence of the peak RFD (as a stance phase %) | Fore | % of Stance | Ln(%RFD_Fore) | |
| Aft | % of Stance | Ln(%RFD_Aft) |
| Variable | Units | FF | MF | RF |
|---|---|---|---|---|
| FSA | ° | −10.2 ± 6.6 | 3.0 ± 2.8 | 24.9 ± 8.0 |
| IR_Fore | % | 96.2 ± 5.7 | 89.3 ± 7.0 | 65.4 ± 11.5 |
| IR_Aft | % | 3.8 ± 5.7 | 10.6 ± 7.0 | 34.6 ± 11.5 |
| IR_Fore0-33% | % | 92.5 ± 9.8 | 77.2 ± 12.9 | 31.7 ± 16.3 |
| IR_Aft0-33% | % | 7.5 ± 9.9 | 22.8 ± 12.9 | 68.2 ± 16.3 |
| PF_Fore | % | 95.8 ± 8.2 | 93.3 ± 6.1 | 77.0 ± 11.5 |
| PF_Aft | % | 8.1 ± 12.3 | 22.2 ± 13.4 | 59.9 ± 15.3 |
| RFD_Fore | % | 88.3 ± 12.8 | 70.0 ± 20.8 | 49.2 ± 16.2 |
| RFD_Aft | % | 14.5 ± 16.5 | 40.5 ± 22.0 | 91.2 ± 11.0 |
| Ln(%RFD_Fore) | unit | 2.69 ± 0.55 | 2.27 ± 0.33 | 2.43 ± 0.23 |
| Ln(%RFD_Aft) | unit | 2.72 ± 0.41 | 2.89 ± 0.35 | 3.25 ± 0.26 |
| Multiple Regression (MR) | Conditional Inference Tree (TREEPRED) | Random Forest (FRSTPRED) | |
|---|---|---|---|
| MSE | 26.61 | 23.57 | 13.31 |
| RMSE | 5.16 | 4.85 | 3.65 |
| MAE | 3.85 | 3.51 | 2.69 |
| MAPE | 0.32 | 0.45 | 0.33 |
| A | Multiple Regression (MR) | Conditional Inference Tree (TREECLASS) | Random Forest (FRSTCLASS) | |||||||||||
|---|---|---|---|---|---|---|---|---|---|---|---|---|---|---|
| True | RF | 621 | 13 | 0 | RF | 613 | 21 | 0 | RF | 611 | 23 | 0 | ||
| MF | 26 | 46 | 48 | MF | 14 | 88 | 18 | MF | 16 | 92 | 12 | |||
| FF | 5 | 8 | 280 | FF | 5 | 6 | 282 | FF | 3 | 8 | 282 | |||
| RF | MF | FF | RF | MF | FF | RF | MF | FF | ||||||
| Estimated | Estimated | Estimated | ||||||||||||
| B | MR | TREECLASS | FRSTCLASS | |||||||||||
| Accuracy (%) | ALL | 90.4 | 93.9 | 94.1 | ||||||||||
| Recall (%) | RF | 97.9 | 96.7 | 96.4 | ||||||||||
| MF | 38.0 | 73.3 | 76.7 | |||||||||||
| FF | 95.6 | 96.3 | 96.3 | |||||||||||
| RF | 95.2 | 97.0 | 97.0 | |||||||||||
| Precision (%) | MF | 68.7 | 76.5 | 74.8 | ||||||||||
| FF | 85.4 | 94.0 | 95.9 | |||||||||||
Publisher’s Note: MDPI stays neutral with regard to jurisdictional claims in published maps and institutional affiliations. |
© 2020 by the authors. Licensee MDPI, Basel, Switzerland. This article is an open access article distributed under the terms and conditions of the Creative Commons Attribution (CC BY) license (http://creativecommons.org/licenses/by/4.0/).
Share and Cite
Moore, S.R.; Kranzinger, C.; Fritz, J.; Stӧggl, T.; Krӧll, J.; Schwameder, H. Foot Strike Angle Prediction and Pattern Classification Using LoadsolTM Wearable Sensors: A Comparison of Machine Learning Techniques. Sensors 2020, 20, 6737. https://doi.org/10.3390/s20236737
Moore SR, Kranzinger C, Fritz J, Stӧggl T, Krӧll J, Schwameder H. Foot Strike Angle Prediction and Pattern Classification Using LoadsolTM Wearable Sensors: A Comparison of Machine Learning Techniques. Sensors. 2020; 20(23):6737. https://doi.org/10.3390/s20236737
Chicago/Turabian StyleMoore, Stephanie R., Christina Kranzinger, Julian Fritz, Thomas Stӧggl, Josef Krӧll, and Hermann Schwameder. 2020. "Foot Strike Angle Prediction and Pattern Classification Using LoadsolTM Wearable Sensors: A Comparison of Machine Learning Techniques" Sensors 20, no. 23: 6737. https://doi.org/10.3390/s20236737