
LOCATE-US: Indoor Positioning for Mobile Devices Using Encoded Ultrasonic Signals, Inertial Sensors and Graph-Matching


 ,
,  , , , and
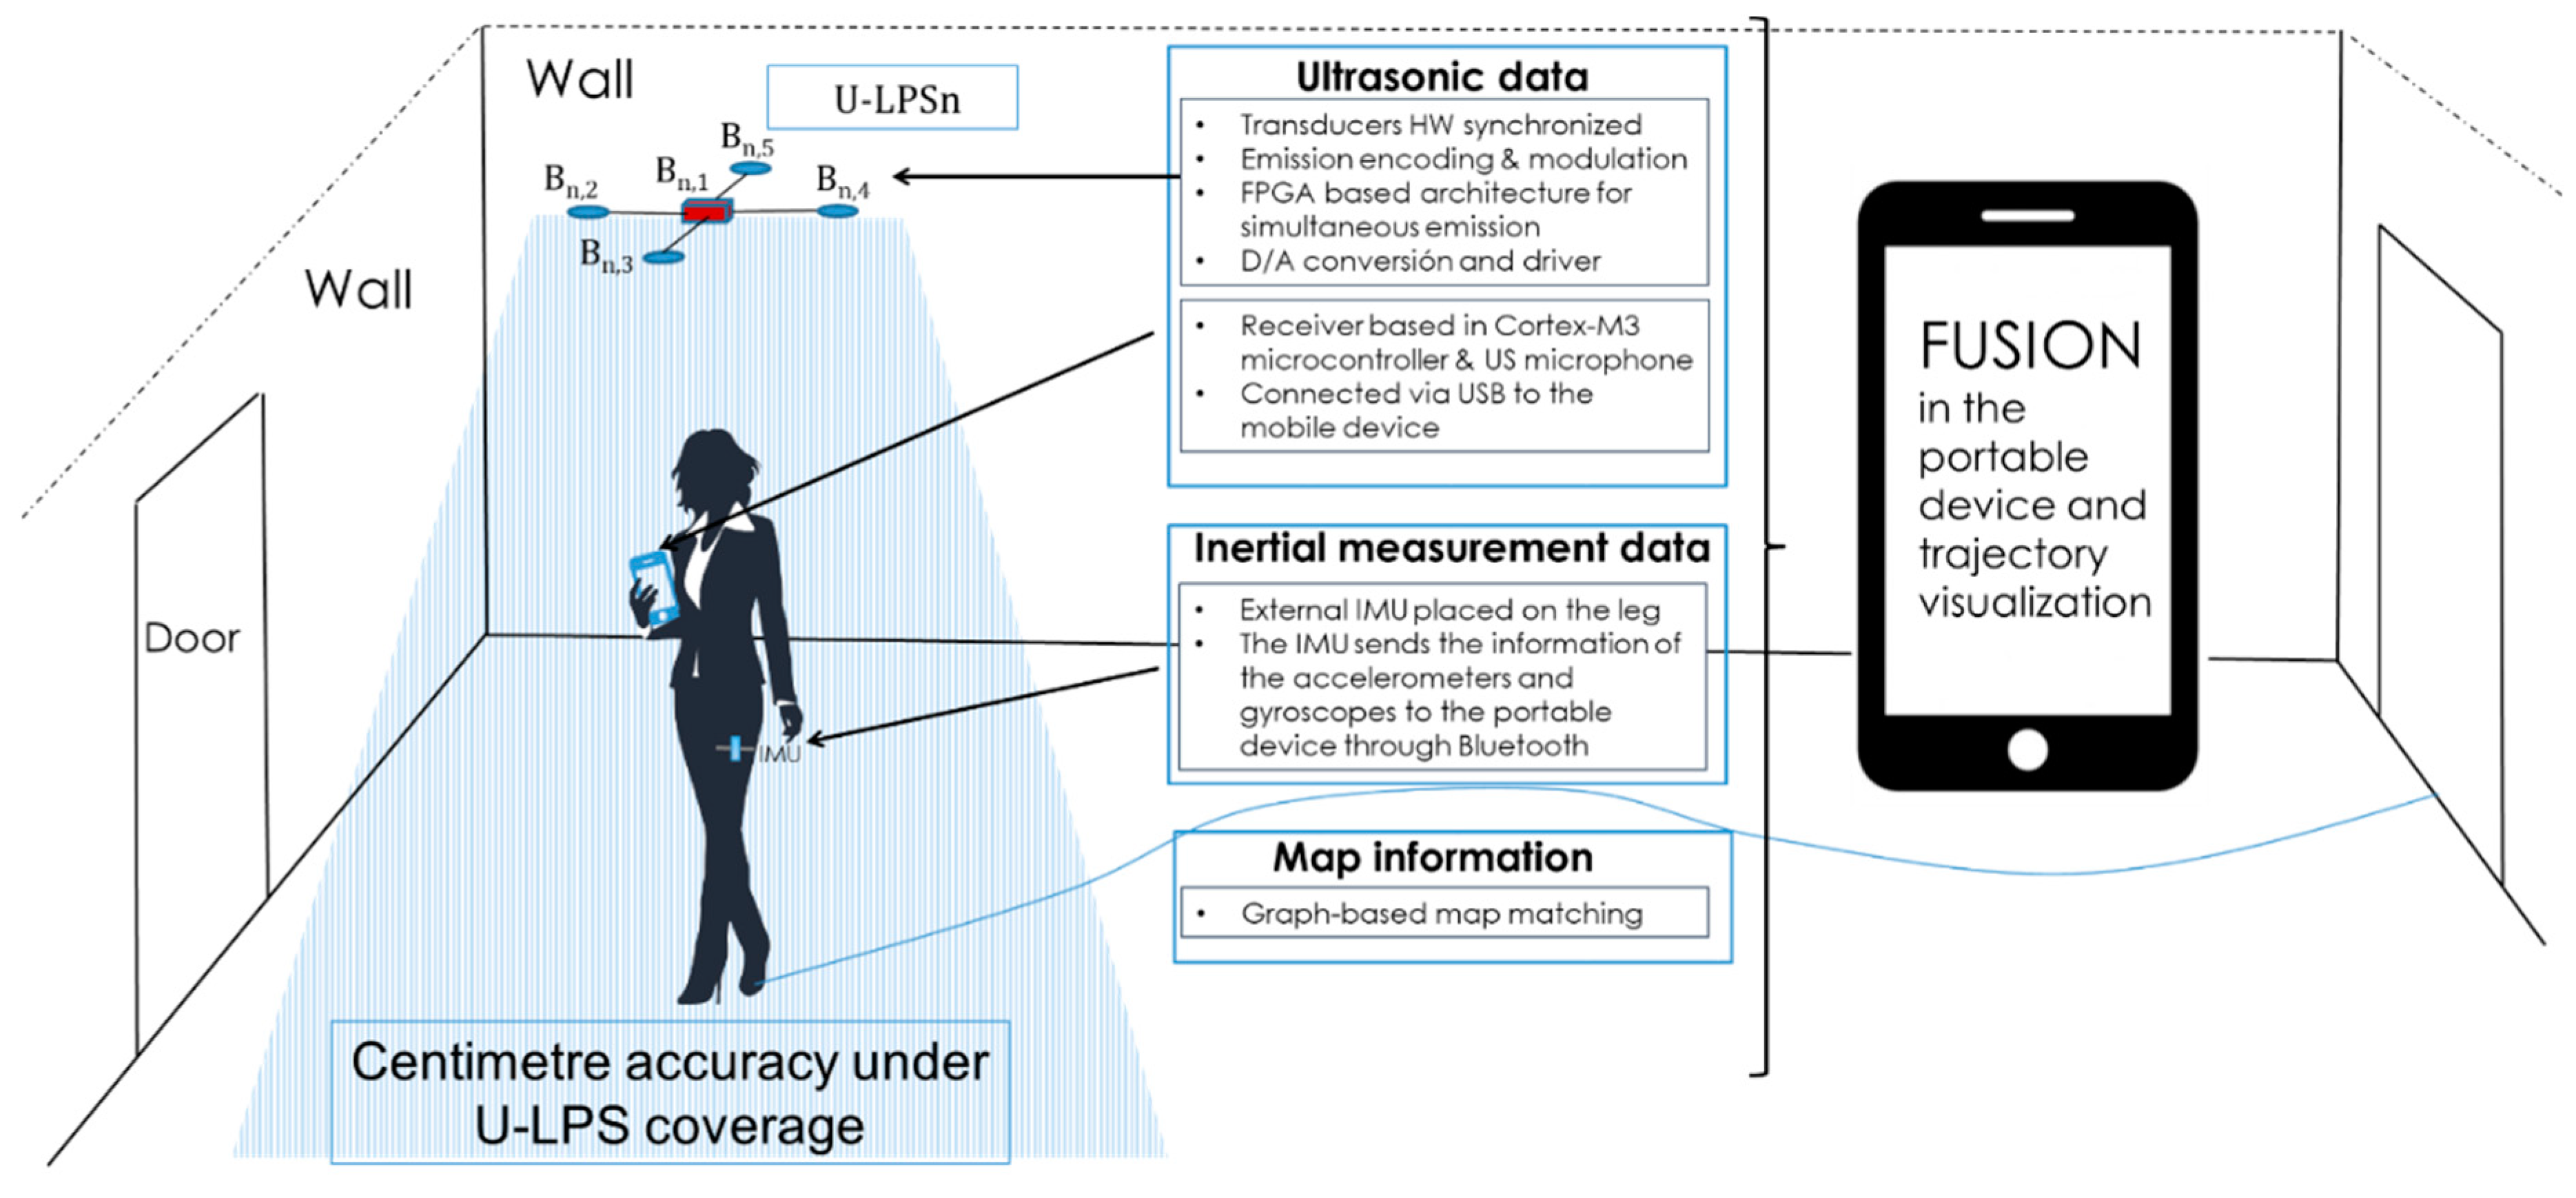
Abstract
:1. Introduction
- -
- The proposed LOCATE-US system is described, which is intended for smartphone or any other mobile device positioning through a hybrid ultrasonic/IMU/Graph-Matching approach for wide indoor areas. IMU and graph-matching are used in zones that do not require accurate positioning, whereas the U-LPS is used to correct the drift errors from the IMU, obtaining decimeter positioning. Thus, the application can be adapted to the different granularity demands of the context.
- -
- Any annoying audible disturbance is avoided by using ad hoc hardware to acquire the ultrasonic signals emitted at 41 kHz. Broadband signals allow simultaneous emission and robustness against noise. Time Differences of Arrival (TDOA) imply no need for additional synchronization signals.
- -
- Real-time experimental tests are carried out, which match simulation results, obtaining a position estimate every 0.1 s. The time constraints are defined by the ultrasonic acquisition time, whereas the signal processing in the mobile device only requires 36 ms.
2. Available Data
2.1. Ultrasonic Data
2.2. Inertial Sensor Data
2.3. Map Information
3. Processing in the Portable Device
3.1. Ultrasonic Processing
3.2. Inertial Sensor Data processing
3.3. Measurements Fusion
3.4. Map Representation
4. Android Implementation
5. User Interface
6. Experimental Results
7. Conclusions
Author Contributions
Funding
Institutional Review Board Statement
Informed Consent Statement
Data Availability Statement
Conflicts of Interest
References
- Filonenko, V.; Cullen, C.; Carswell, J. Indoor Positioning for Smartphones Using Asynchronous Ultrasound Trilateration. Isprs Ing. J. Geo-Inf. 2013, 2, 598–620. [Google Scholar] [CrossRef] [Green Version]
- Brena, R.F.; García-Vázquez, J.P.; Galván-Tejada, C.E.; Muñoz-Rodriguez, D.; Vargas-Rosales, C. Evolution of Indoor Positioning Technologies: A Survey. J. Sens. 2017, 17, 1–21. [Google Scholar] [CrossRef]
- Google Indoor Navigation. Available online: https://www.indoornavigation.com/knowledge/indoor-navigation-by-google-what-you-should-know-about-it (accessed on 10 January 2021).
- Vanclooster, A.; De Maeyer, P. Combining indoor and outdoor navigation: The current approach of route planners. In Advances in Location-Based Services; Springer: Berlin, Germany, 2012; pp. 283–303. [Google Scholar]
- Torres-Sospedra, J.; Montoliu, R.; Trilles, S.; Belmonte, O.; Huerta, J. Comprehensive Analysis of Distance and Similarity Measures for WiFi Fingerprinting Indoor Positioning Systems. Expert Syst. Appl. 2015, 42, 9263–9278. [Google Scholar] [CrossRef]
- Li, Y.; Zhuang, Y.; Zhang, P.; Lan, H.; Niu, X.; El-Sheimy, N. An improved inertial/wifi/magnetic fusion structure for indoor navigation. Inf. Fusion 2017, 34, 101–119. [Google Scholar] [CrossRef]
- Gualda, D.; Villadangos, J.M.; Ureña, J.; Jiménez, A.; Seco, F.; Hernández, A. Indoor Positioning in Large Environments: Ultrasonic and UWB Technologies. In Proceedings of the International Conference of Indoor Positioning and Indoor Navigation (IPIN), Pisa, Italy, 30 September–3 October 2019; pp. 362–369. [Google Scholar]
- Qi, J.; Liu, G.-P. A Robust High-Accuracy Ultrasound Indoor Positioning System Based on a Wireless Sensor Network. Sensors 2017, 17, 2554. [Google Scholar] [CrossRef] [Green Version]
- Yang, L.; Feng, X.; Zhang, J.; Shu, X. Multi-Ray Modeling of Ultrasonic Sensors and Application for Micro-UAV Localization in Indoor Environments. Sensors 2019, 19, 1770. [Google Scholar] [CrossRef] [PubMed] [Green Version]
- Rowe, A.; Lazik, P. Indoor Pseudo-ranging of Mobile Devices using Ultrasonic Chirps. In Proceedings of the 10th ACM Conference on Embedded Network Sensor System, Toronto, Canada, 6–9 November 2012; pp. 99–112. [Google Scholar]
- Peng, C.; Shen, G.; Zhang, Y.; Li, Y.; Tan, K. BeepBeep: A High Accuracy Acoustic Ranging System using COTS Mobile Devices. In Proceedings of the 5th International Conference on Embedded Networked Sensor Systems, Sydney, Australia, 6–9 November 2007; pp. 1–14. [Google Scholar]
- Ens, A.; Höflinger, F.; Wendeberg, J.; Hoppe, J.; Zhang, R.; Bannoura, A.; Reindl, L.M.; Schindelhauer, C. Acoustic Self-Calibrating System for Indoor Smart Phone Tracking. Intern. J. Navig. Obs. 2015, 2015, 1–15. [Google Scholar] [CrossRef] [Green Version]
- Langheinrich, M. Privacy by design- principles of privacy-aware ubiquitous sytems. In Proceedings of the Ubiquitous Computing, Atlanta, GA, USA, 30–2 September 2001; pp. 273–291. [Google Scholar]
- Aguilera, T.; Paredes, J.A.; Álvarez, F.J.; Suárez, J.I.; Hernández, A. Acoustic Local Positioning System Using an iOS device. In Proceedings of the International Conference on Indoor Positioning and Indoor Navigation (IPIN), Montbeliard, France, 28–31 October 2013; pp. 1–5. [Google Scholar]
- Oh, J.; Um, J. Acoustic Signal-Based Indoor Global Coordinates System for Smartphones. IEEE Sens. J. 2018, 18, 3248–3254. [Google Scholar] [CrossRef]
- Álvarez, F.J.; Aguilera, T.; López-Valcarce, R. CDMA-based acoustic local positioning system for portable devices with multipath cancellation. Digit. Signal Process. 2017, 62, 38–51. [Google Scholar] [CrossRef]
- González, J.R.; Bleackley, C.J. High-Precision Robust Broadband Ultrasonic Location and Orientation Estimation. IEEE J. Sel. Top. Signal Process. 2009, 3, 832–844. [Google Scholar] [CrossRef]
- Llata, J.R.; Sarabia, E.G.; Oria, J.P. Fuzzy expert systems with double knowledge base for ultrasonic classification. Expert Syst. Appl. 2001, 20, 347–355. [Google Scholar] [CrossRef]
- Ureña, J.; Hernandez, A.; Garcia, J.J.; Villadangos, J.M.; Carmen–Perez, M.; Gualda, D.; Alvarez, F.J.; Aguilera, T. Acoustic Local Positioning with Encoded Emission Beacons. Proc. IEEE 2018, 106, 1042–1062. [Google Scholar] [CrossRef]
- Ureña, J.; Villadangos, J.M.; Gualda, D.; Pérez, M.C.; Hernández, A.; García, J.J.; Jiménez, A.; García, J.C.; Arango, A.; Jiménez, J.C.; et al. Technical description of LOCATE-US: An Ultrasonic local positioning system based on encoded beacons. In Proceedings of the International Conference on Indoor Positioning and Indoor Navigation (IPIN), Alcalá de Henares, Spain, 4–7 October 2016; pp. 1–4. [Google Scholar]
- Guo, H.; Uradzinski, M.; Yin, H.; Yu, M. Indoor positioning based on foot-mounted IMU. Bull. Pol. Acad. Sci. Tech. Sci. 2015, 63, 629–634. [Google Scholar] [CrossRef]
- Bousdar–Ahmed, D.; Munoz–Diaz, E.; Kaiser, S. Performance comparison of foot- and pocket-mounted inertial navigation systems. In Proceedings of the International Conference on Indoor Positioning and Indoor Navigation (IPIN), Alcalá de Henares, Spain, 4–7 October 2016; pp. 1–7. [Google Scholar]
- Kuang, J.; Niu, X.; Chen, X. Robust Pedestrian Dead Reckoning Based on MEMS-IMU for Smartphones. Sensors 2018, 18, 1391. [Google Scholar] [CrossRef] [PubMed] [Green Version]
- Solin, A.; Cortes, S.; Rahtu, E.; Kannala, J. Inertial Odometry on Handheld Smartphones. In Proceedings of the 21st International Conference on Information Fusion, Cambridge, UK, 10–13 July 2018; pp. 1–8. [Google Scholar]
- Hou, X.; Bergmann, J. Pedestrian Dead Reckoning with Wearable Sensors: A Systematic Review. IEEE Sens. J. 2021, 21, 143–152. [Google Scholar] [CrossRef]
- SHIMMER 3 EMG. Available online: https://www.shimmersensing.com/products/shimmer3-emg-sensor (accessed on 10 January 2021).
- Bahillo, A.; Aguilera, T.; Álvarez, F.J. Seamless Positioning Using a Smart Device. Wirel. Pers. Commun. 2019, 94, 2949–2967. [Google Scholar] [CrossRef]
- Xia, M.; Xiu, C.; Yang, D.; Wang, L. Performance Enhancement of Pedestrian Navigation Systems Based on Low-Cost Foot-Mounted MEMS-IMU/Ultrasonic Sensor. Sensors 2019, 19, 364. [Google Scholar] [CrossRef] [Green Version]
- Girard, G.; Côté, S.; Zlatanova, S.; Barette, Y.; St-Pierre, J.; Van Oosterom, P. Indoor Pedestrian Navigation Using Foot-Mounted IMU and Portable Ultrasound Range Sensors. Sensors 2011, 11, 7606–7624. [Google Scholar] [CrossRef] [PubMed] [Green Version]
- School of Engineering, University of Alcala. Available online: http://escuelapolitecnica.uah.es (accessed on 10 January 2021).
- Zampella, F.; Jiménez, A.R.; Seco, F. Indoor Positioning Using Efficient Map Matching, RSS Measurements, and an Improved Motion Model. IEEE Trans. Veh. Technol. 2015, 64, 1304–1317. [Google Scholar] [CrossRef]
- Nikolic, M.; Jovic, J. Implementation of generic algorithm in map-matching model. Expert Syst. Appl. 2017, 72, 283–292. [Google Scholar] [CrossRef]
- Hernández, A.; García, E.; Gualda, D.; Pérez, M.C.; Villadangos, J.M.; Ureña, J.; Cervigón, R. FPGA-Based Architecture for Managing Ultrasonic Beacons in a Local Positioning System. IEEE Trans. Instrum. Meas. 2017, 66, 1954–1964. [Google Scholar] [CrossRef]
- Pérez-Bachiller, S.; Gualda, D.; Pérez, M.C.; Villadangos, J.M.; Ureña, J.; Cervigón, R. Android application for indoor location using sensor fusion: Ultrasounds and inertial devices. In Proceedings of the International Conference on Indoor Positioning and Indoor Navigation (IPIN), Nantes, France, 24–27 September 2018; pp. 1–8. [Google Scholar]
- Pro-Wave Electronics Corporation. Available online: http://www.prowave.com.tw/pdf/txall.pdf (accessed on 10 January 2021).
- García, E.; Paredes, J.A.; Álvarez, F.J.; Pérez, M.C.; García, J.J. Spreading sequences in active sensing: A review. Signal Process. 2015, 106, 88–105. [Google Scholar] [CrossRef]
- Knowles Acoustics Application Note. Available online: https://media.digikey.com/pdf/Data%20Sheets/Knowles%20Acoustics%20PDFs/SiSonic_Design_Guide.pdf (accessed on 10 January 2021).
- Kasami, T. Weight Distribution Formula for Some Class of Cyclic Codes; Technical Report R-285; Coordinated Science Lab, University of Illynois: Urbana, IL, USA, 1966. [Google Scholar]
- Piccinni, G.; Avitabile, G.; Coviello, G. An improved technique based on Zadoff-Chu sequences for distance measurements. In Proceedings of the 2016 IEEE Radio and Antenna Days of the Indian Ocean (RADIO), Reunion, France, 10–13 October 2016; pp. 1–2. [Google Scholar]
- Chen, C.; Lu, X.; Markham, A.; Trigoni, N. IONet: Learning to Cure the Curse of Drift in Inertial Odometry. In Proceedings of the International Conference on Artificial Intelligence, New Orleans, LA, USA, 2–7 February 2018; pp. 12–17. [Google Scholar]
- García, J.C.; Marrón, M.; Amaral, P.F.; Bastos, T.; Palazuelos, S.; Martín, J.L.; Gualda, D. Proposal for a building accessibility service (BASE). In Everyday Technology for Independence and Care (AAATE); IOS Press: Amsterdam, The Netherlands, 2011; Volume 29, pp. 393–400. [Google Scholar]
- Li, X.; Scaglione, A. Convergence and applications of a gossip-based gauss-newton algorithm. IEEE Trans. Signal Process. 2013, 61, 5231–5246. [Google Scholar] [CrossRef] [Green Version]
- Ruíz, D.; Ureña, J.; García, J.C.; Pérez, M.C.; Villadangos, J.M.; García, E. Efficient trilateration algorithm using time differences of arrival. Sens. Actuators A Phys. 2013, 193, 220–232. [Google Scholar] [CrossRef]
- Kalman, R.E. A New Approach to Linear Filtering and Prediction Problems. Trans. ASME J. Basic Eng. 1960, 82, 35–45. [Google Scholar] [CrossRef] [Green Version]
- Munoz–Diaz, E.; Mendiguchia–Gonzalez, A.L. Step Detector and Step Length Estimator for an Inertial Pocket Navigation System. In Proceedings of the International Conference of Indoor Positioning and Indoor Navigation (IPIN), Busan, Korea, 27–30 October 2014; pp. 105–110. [Google Scholar]
- Gualda, D.; Ureña, J.; García, J.C.; Alcalá, J.; Miyadaira, A.N. Reduction of Ultrasonic Indoor Localization Infraestructure based on the use of Graph Information. In Proceedings of the International Conference on Indoor Positioning and Indoor Navigation (IPIN), Alcalá de Henares, Spain, 4–7 October 2016; pp. 1–6. [Google Scholar]
- Samsung Galaxy Tab S2. Available online: http://www.samsung.com/es/tablets/galaxytab-s2-9-7-t810/SM-T810NZKEPHE/ (accessed on 10 January 2021).
- Apple, Iphone 11. Available online: https://www.apple.com/jo/iphone-11/ (accessed on 10 January 2021).
- Davidson, P.; Piché, R. A Survey of Selected Indoor Positioning Methods for Smartphones. IEEE Commun. Surv. Tutor. 2017, 19, 1347–1370. [Google Scholar] [CrossRef]
- Zhou, L.; Fischer, E.; Tunca, C.; Brahms, C.M.; Ersoy, C.; Granacher, U.; Arnrich, B. How We Found Our IMU: Guidelines to IMU Selection and a Comparison of Seven IMUs for Pervasive Healthcare Applications. Sensors 2020, 20, 4090. [Google Scholar] [CrossRef]


Publisher’s Note: MDPI stays neutral with regard to jurisdictional claims in published maps and institutional affiliations. |
© 2021 by the authors. Licensee MDPI, Basel, Switzerland. This article is an open access article distributed under the terms and conditions of the Creative Commons Attribution (CC BY) license (http://creativecommons.org/licenses/by/4.0/).
Share and Cite
Gualda, D.; Pérez-Rubio, M.C.; Ureña, J.; Pérez-Bachiller, S.; Villadangos, J.M.; Hernández, Á.; García, J.J.; Jiménez, A. LOCATE-US: Indoor Positioning for Mobile Devices Using Encoded Ultrasonic Signals, Inertial Sensors and Graph-Matching. Sensors 2021, 21, 1950. https://doi.org/10.3390/s21061950
Gualda D, Pérez-Rubio MC, Ureña J, Pérez-Bachiller S, Villadangos JM, Hernández Á, García JJ, Jiménez A. LOCATE-US: Indoor Positioning for Mobile Devices Using Encoded Ultrasonic Signals, Inertial Sensors and Graph-Matching. Sensors. 2021; 21(6):1950. https://doi.org/10.3390/s21061950
Chicago/Turabian StyleGualda, David, María Carmen Pérez-Rubio, Jesús Ureña, Sergio Pérez-Bachiller, José Manuel Villadangos, Álvaro Hernández, Juan Jesús García, and Ana Jiménez. 2021. "LOCATE-US: Indoor Positioning for Mobile Devices Using Encoded Ultrasonic Signals, Inertial Sensors and Graph-Matching" Sensors 21, no. 6: 1950. https://doi.org/10.3390/s21061950