
Numerical Analysis of Radiation Effects on Fiber Optic Sensors


1
Department of Electrical and Computer Engineering, Boise State University, Boise, ID 83725, USA
2
Idaho National Laboratory, 1955 N Fremont Avenue, Idaho Falls, ID 83415, USA
*
Author to whom correspondence should be addressed.
Sensors 2021, 21(12), 4111; https://doi.org/10.3390/s21124111
Submission received: 13 May 2021
/
Revised: 10 June 2021
/
Accepted: 12 June 2021
/
Published: 15 June 2021
(This article belongs to the Special Issue Optical Fiber Sensors in Radiation Environments)
Abstract
:Optical fiber sensors (OFS) are a potential candidate for monitoring physical parameters in nuclear environments. However, under an irradiation field the optical response of the OFS is modified via three primary mechanisms: (i) radiation-induced attenuation (RIA), (ii) radiation-induced emission (RIE), and (iii) radiation-induced compaction (RIC). For resonance-based sensors, RIC plays a significant role in modifying their performance characteristics. In this paper, we numerically investigate independently the effects of RIC and RIA on three types of OFS widely considered for radiation environments: fiber Bragg grating (FBG), long-period grating (LPG), and Fabry-Perot (F-P) sensors. In our RIC modeling, experimentally calculated refractive index (RI) changes due to low-dose radiation are extrapolated using a power law to calculate density changes at high doses. The changes in RI and length are subsequently calculated using the Lorentz–Lorenz relation and an established empirical equation, respectively. The effects of both the change in the RI and length contraction on OFS are modeled for both low and high doses using FIMMWAVE, a commercially available vectorial mode solver. An in-depth understanding of how radiation affects OFS may reveal various potential OFS applications in several types of radiation environments, such as nuclear reactors or in space.
1. Introduction
Nuclear power is a potential clean energy solution to the world’s ever-increasing energy demands [1,2]. Power-producing reactors require little in-core instrumentation; however, accurate in-pile measurements are required to qualify new nuclear fuels or extend the burnup of existing fuel designs. Typical commercial electronic sensors often fail under radiation environments such as those encountered in nuclear reactors, so an alternative approach is needed to monitor physical parameters such as temperature, strain, and pressure [3,4,5,6,7]. Due to their high immunity to electromagnetic interference, optical-fiber-based technologies are considered potential candidates for in-pile nuclear environments [3,6]. However, an in-depth understanding of how radiation affects optical fibers and optical fiber sensors (OFS) is required to ensure their reliability and survivability. Early work has shown that three types of resonance-based OFS—fiber Bragg grating (FBG), long-period grating (LPG), and Fabry-Perot (F-P)—have been widely tested in nuclear environments [8,9,10,11,12,13,14,15]. Studies show that the survivability and performance of OFS in nuclear environments largely depends on the chemical composition of the fibers, the nature of the irradiation, the manufacturing conditions, and the wavelength of light used [3,16]. However, the viability of OFS under a known radiation field is threatened due to radiation-induced modification of their fiber optic properties via three mechanisms: (i) radiation-induced attenuation (RIA), which increases the linear absorption due to radiation-induced defects; (ii) radiation-induced emission (RIE), which adds noise to the useful signal through emitted radiation; and (iii) radiation-induced compaction (RIC), which alters the density and hence the refractive index (RI) of the optical fibers via a knock-on process [3,6].
Radiation-induced attenuation (RIA) increases the linear absorption of the fiber material due to radiation-induced defects [3]. RIA reduces the amplitude of the spectral response and is caused by radiation-induced defects in silica material, resulting in modification of the fiber absorption band. These defects are primarily a function of fiber composition, and a significant amount of work has been performed to mitigate such defects, including studying fiber composition and irradiation conditions, choosing an appropriate wavelength of light, and optimizing manufacturing conditions. [3,5,6,7,8,9,17]. The fiber darkening associated with RIA modifies the complex RI of the material in accordance with a Kramer–Kronig relation [18], and this change in RI is uniform throughout the sensor. The change in RI modifies the numerical aperture of the fiber, again showing up as attenuation. Hence, one can say that RIA attenuates the signal received, without affecting the frequency response of the sensor.
Radiation-induced compaction (RIC) occurs when radiation modifies the density of a fiber, leading to compaction in the overall fiber structure. It has been reported that, under fast neutron irradiation, silica tends to undergo roughly 3% density increase that results in changing the RI by 0.5% [19,20]. This density change varies the volume if the compaction is homogeneous [19,20]. The change in density due to RIC results in a significant spectral shift in the response of resonance-based sensors [16]. In other words, RIC shifts the resonant wavelength position and changes the magnitude of the propagating signal, thus corrupting the signal response. Therefore, while RIA modifies the signal strength, RIC modifies both the intensity and wavelength shift response. Subsequently, RIC is the primary cause of data error that occurs in the performance of resonance-based sensors.
Radiation-induced emission (RIE) adds noise to the useful signal through emitted radiation [3] from defects excited by radiation or Cherenkov emissions [8]. RIE is generated when pre-existing or radiation-induced point defects are excited by incoming particles, causing a parasitic signal (radiation-induced luminescence or Cherenkov emissions) [21]. This parasitic signal superimposes onto the transmitted data and decreases the signal-to-noise ratio of the fiber system. At room temperature, thermal bleaching of radiation-induced point defects during or after irradiation partially recovers the transmission. It was suggested that thermal annealing (close to room temperature) only untraps the charge carriers from the defect sites, but defect sites remain unchanged and filled up again during the irradiation [22]. For applications in which the sensor operates in the infrared domain, the effect of RIE is neglected. RIE is generally considered in the ultra-violet (UV)-visible wavelength spectrum [3]. As a result, we did not analyze the effects of RIE on these sensors at the infrared wavelength.
In this paper, we numerically analyze the macroscopic effects of RIC on three resonance-based types of sensors: FBG, LPG, and F-P. We started our simulation by looking the effects of variation of RI on these sensors caused by gamma radiation. As the radiation causes change in the structure of optical sensors, which results in macroscopic changes, for example, RI change in the fiber material, the simulation indirectly also analyzes the radiation effects on the optical structure. We obtained the values for radiation-induced RI changes in optical fibers, as experimentally determined by Kher et al. [18]. Based on the radiation-induced RI values in [18], we used the Lorentz–Lorenz relation to calculate the corresponding density and length change in the optical fiber and then studied its effects on sensor response. We used established empirical models to extrapolate the RI variation at higher doses to predict the response of these sensors at such doses. Finally, we hypothesized the usability of each sensor in various radiation environments. We also included our preliminary results on how RIA affects the performance of these sensors. The paper is divided up as follows: Section 2 describes the modeling of FBG, LPG, and F-P sensors; Section 3 analyzes the effects of RIC on these three types of sensors at low doses; Section 4 investigates how RIC affects these three types of sensors at high doses; Section 5 discusses the effects of RIA on these three types of sensors; and Section 6 offers concluding remarks based on our observations.
2. Setting up the OFS Models
To numerically investigate how radiation affects optical performance, we modeled three types of resonance-based sensors (FBG, LPG, and F-P) using a robust and fully vectorial mode solver (FIMMWAVE from PhotonDesign) [23]. This simulation software can solve a large variety of waveguides made of almost any material and any geometry as it supports a rich number of complementary algorithms. FIMMPROP, the integrated part of FIMMWAVE, is a tool for simulating propagation in optical waveguides. For modelling grating based sensors, FIMMPROP uses either Eigenmode Expansion (EME) method or rigorous coupled mode theory (RCMT). SMF-28 optical fiber parameters used for simulation purposes throughout the paper are: cladding RI = 1.444 [24], core diameter = 8.2 µm, cladding diameter = 125 µm, mode field diameter = 10.4 ± 0.5 µm, and numerical aperture = 0.14. The following sections describe the base model for the three types of OFS in this paper.
2.1. Fiber Bragg Grating (FBG)
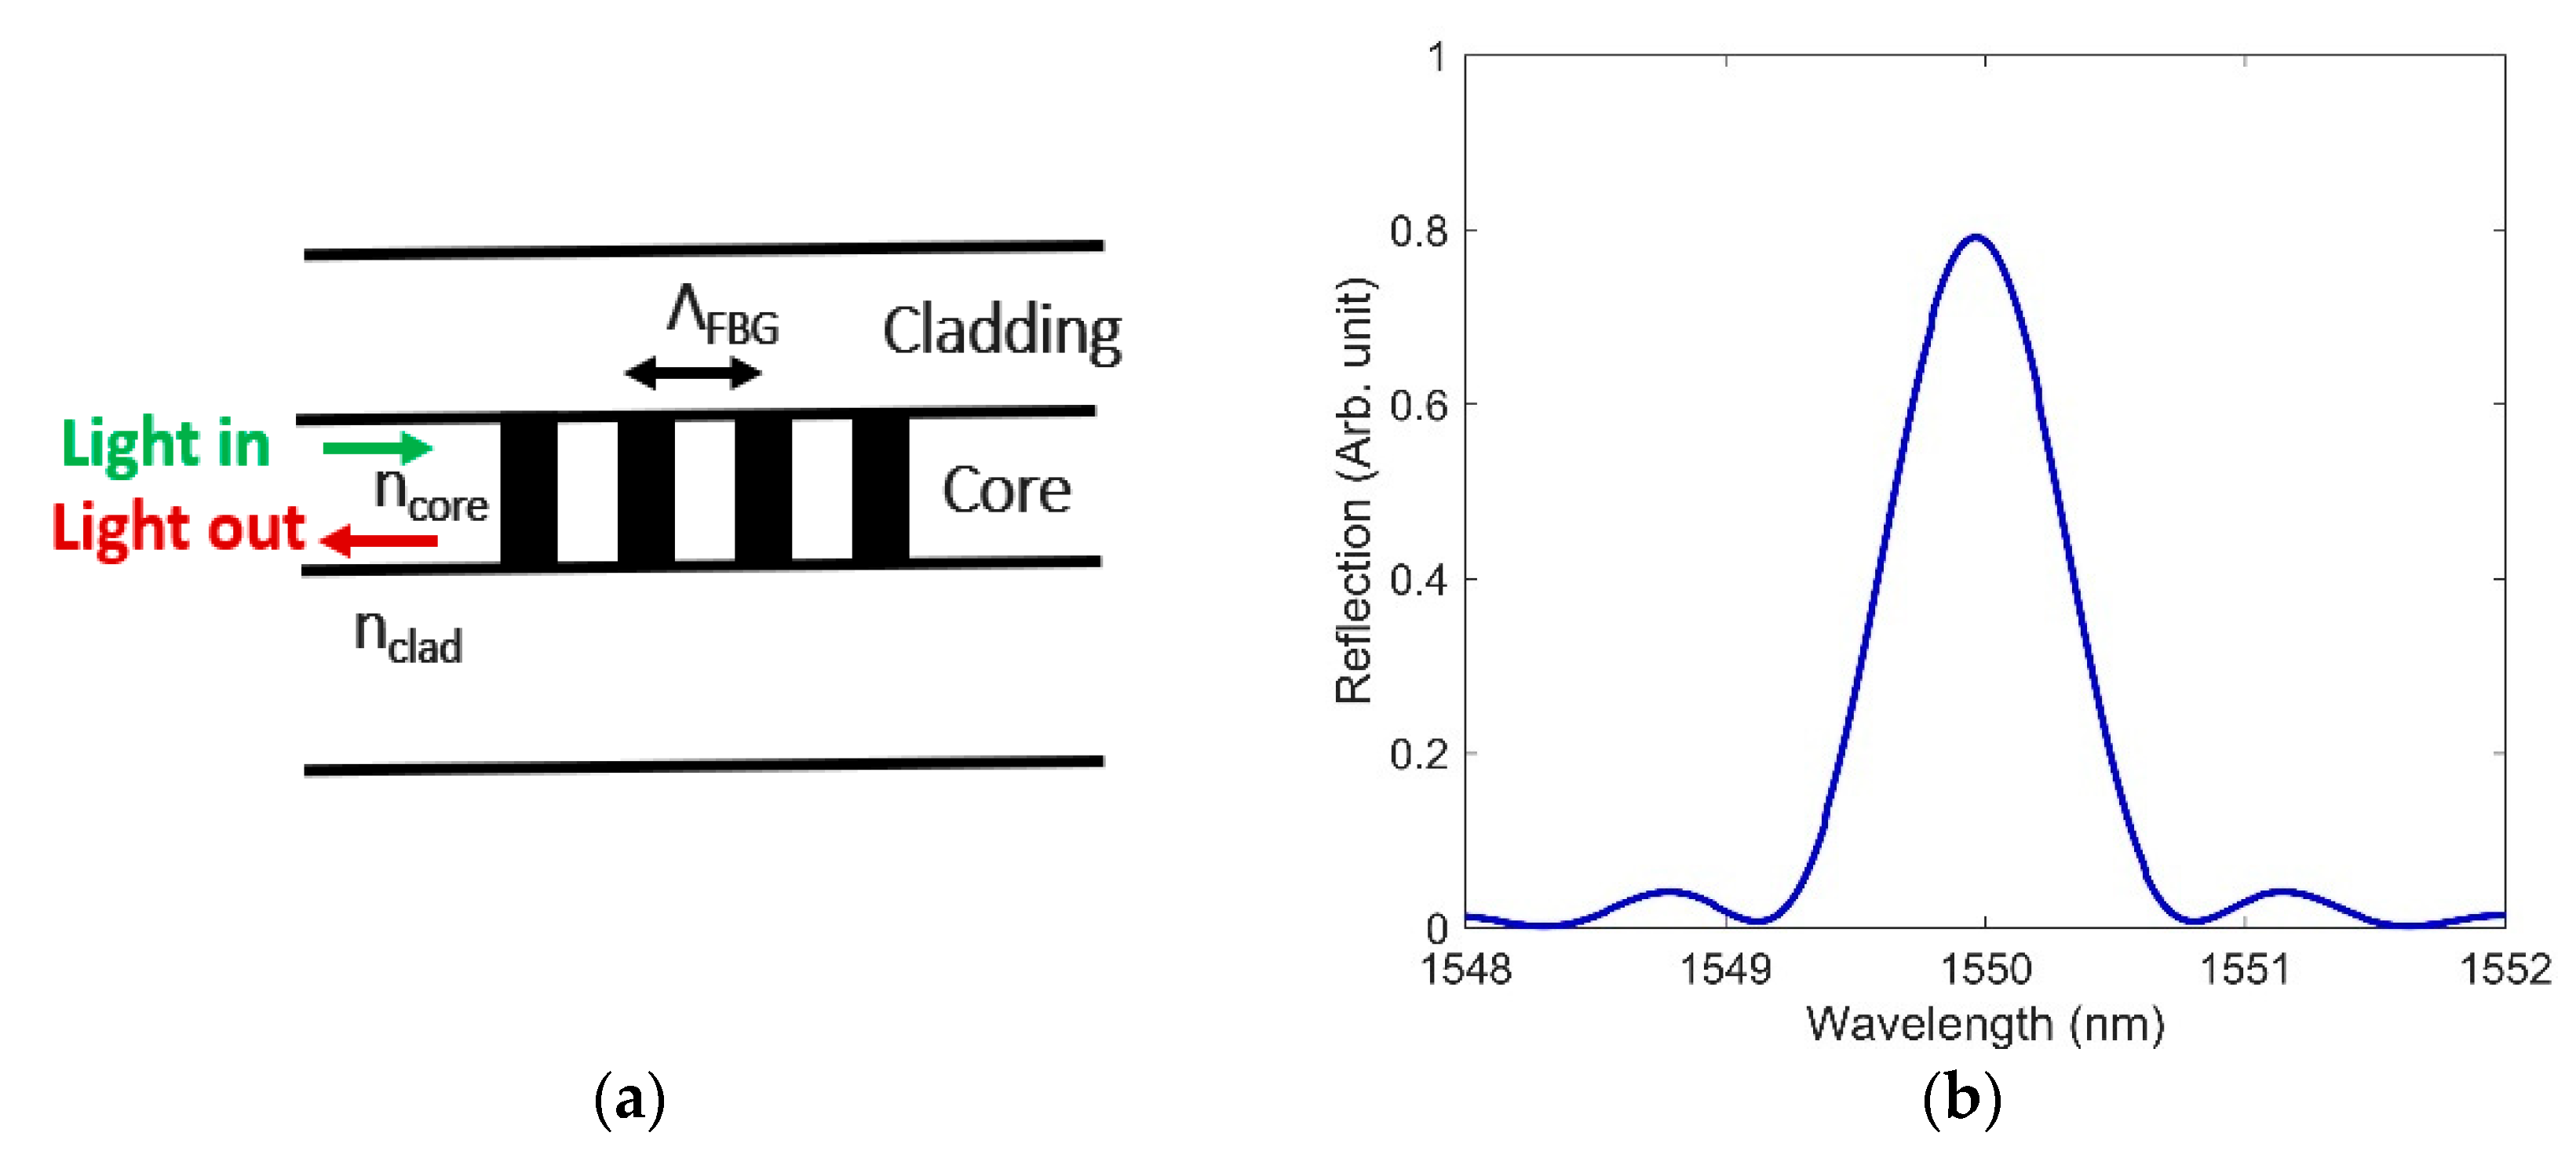
FBG inscription in the core of the fiber using femtosecond (fs) laser radiation and changing the refractive index of the core have found potential applications in nuclear environments, as reported in [9,10,17,25,26]. An FBG is created by generating a periodic RI modulation in the fiber core. In an FBG, the fundamental guided mode couples to the counterpropagating guided mode when the following phase-matching condition is satisfied [27]:
where is the Bragg wavelength, is the effective RI of the core, and is the grating period. The Bragg wavelength is very sensitive to any external changes in physical parameters such as temperature and pressure. A schematic of the FBG is shown in Figure 1a, where and are the RIs of the core and cladding, respectively. To design an FBG in FIMMWAVE, we used a grating period of 0.5353 µm to obtain a Bragg peak near 1550 nm. The effective RI we obtained for the designed FBG is 1.447714. The reflection spectrum of the designed FBG is shown in Figure 1b with a distinct peak at 1550 nm observed.
2.2. Long-Period Grating (LPG)
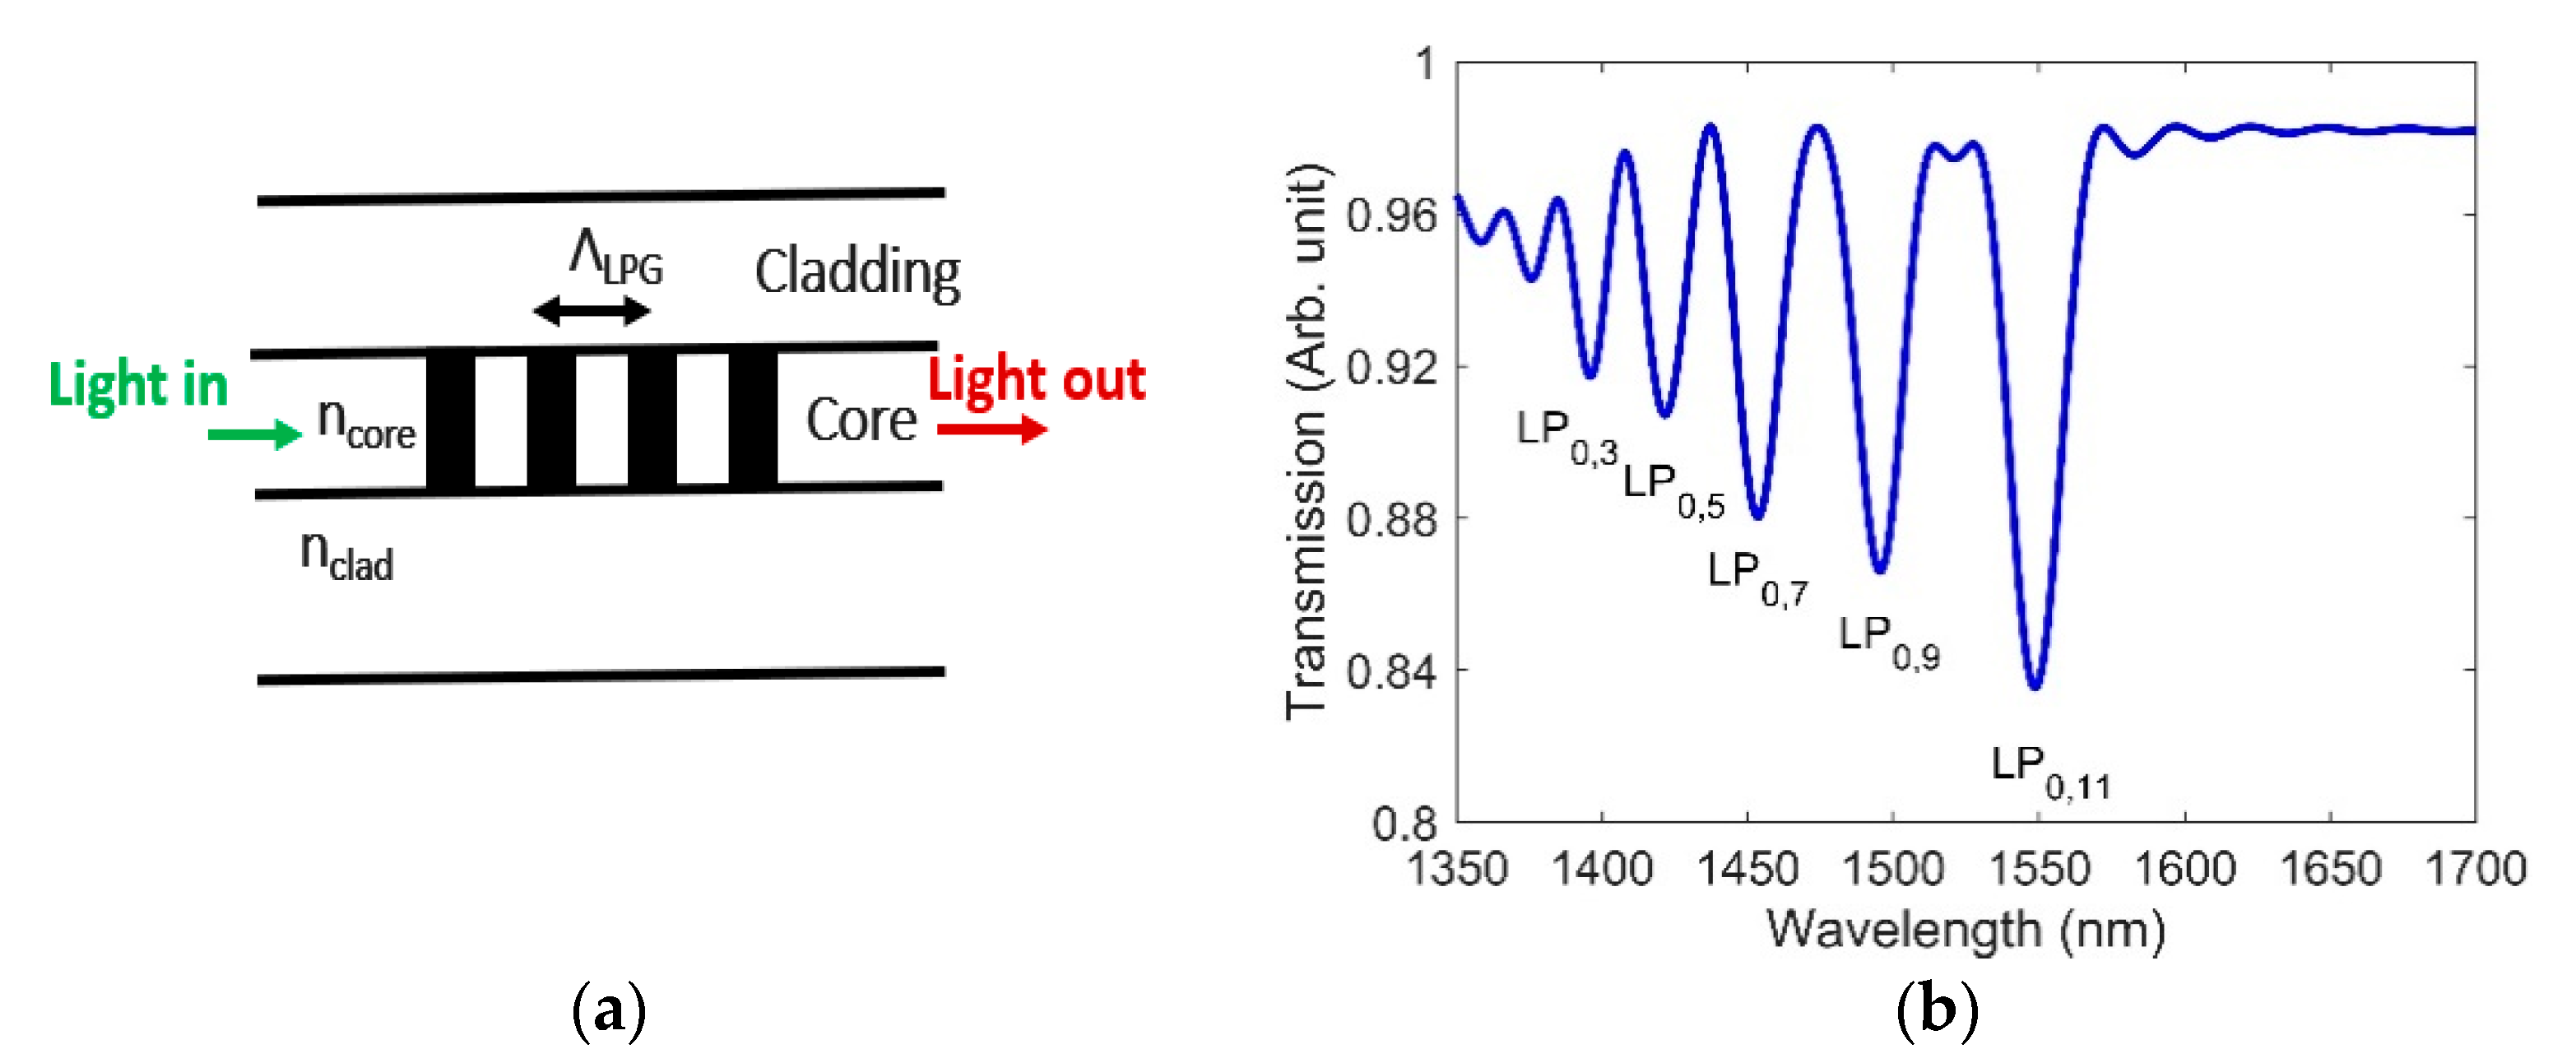
LPGs have also been tested in nuclear environments [12,13,28]. An LPG is similar to an FBG except that it has a larger grating period (100–1000 µm as opposed to 0.1–1 µm). In LPG, light coupling occurs between the fundamental core mode and a number of co-propagating cladding modes. Depending on the phase-matching condition, such coupling results in a number of discrete attenuation bands in the transmission spectrum [29,30]. The wavelength at which coupling takes place is called the “resonance wavelength” and is given by [30]:
where is the resonance wavelength, is the effective RI of the guided core mode, is the effective RI of the mth order cladding mode, and is the grating period. The resonance wavelengths are dependent on the grating period and RIs of the fiber core and cladding. The LPGs are very sensitive devices (even compared to FBG), i.e., a small change in the physical parameters can cause a large shift in the resonance wavelength. LPGs are typically used to sense temperature, pressure, and external RIs [31,32]. We chose an LPG with a grating period of 348 µm in order to achieve at least one resonance dip close to the 1550 nm wavelength, for which several sources and detectors are commercially available. The schematic and transmission spectrum of the designed LPG are shown in Figure 2a,b, respectively. For a uniform grating, the cladding modes featuring only circularly symmetric field couples to the core mode. Analysis of cladding mode resonance and coupling coefficients shows that low-order even modes (e.g., 2, 4, and 6) contain very little power in the fiber core, whereas low-order odd modes (e.g., 1, 3, and 5) have a peak localized in the core [33]. As a result, the coupling between the low-order even modes and the fundamental core mode of the fiber is expected to be very weak. In our designed LPG, the core mode couples to five odd-number cladding modes (LP0,3, LP0,5, LP0,7, LP0,9, and LP0,11), thus supporting the cladding mode analysis discussed in [33]. Please note that the resonance wavelength for coupling to the LP0,11 cladding mode is situated at 1550 nm.
2.3. Fabry-Perot (F-P)
F-P sensors feature several potential applications for nuclear environments, due to their insensitivity to radiation [14,15,34].
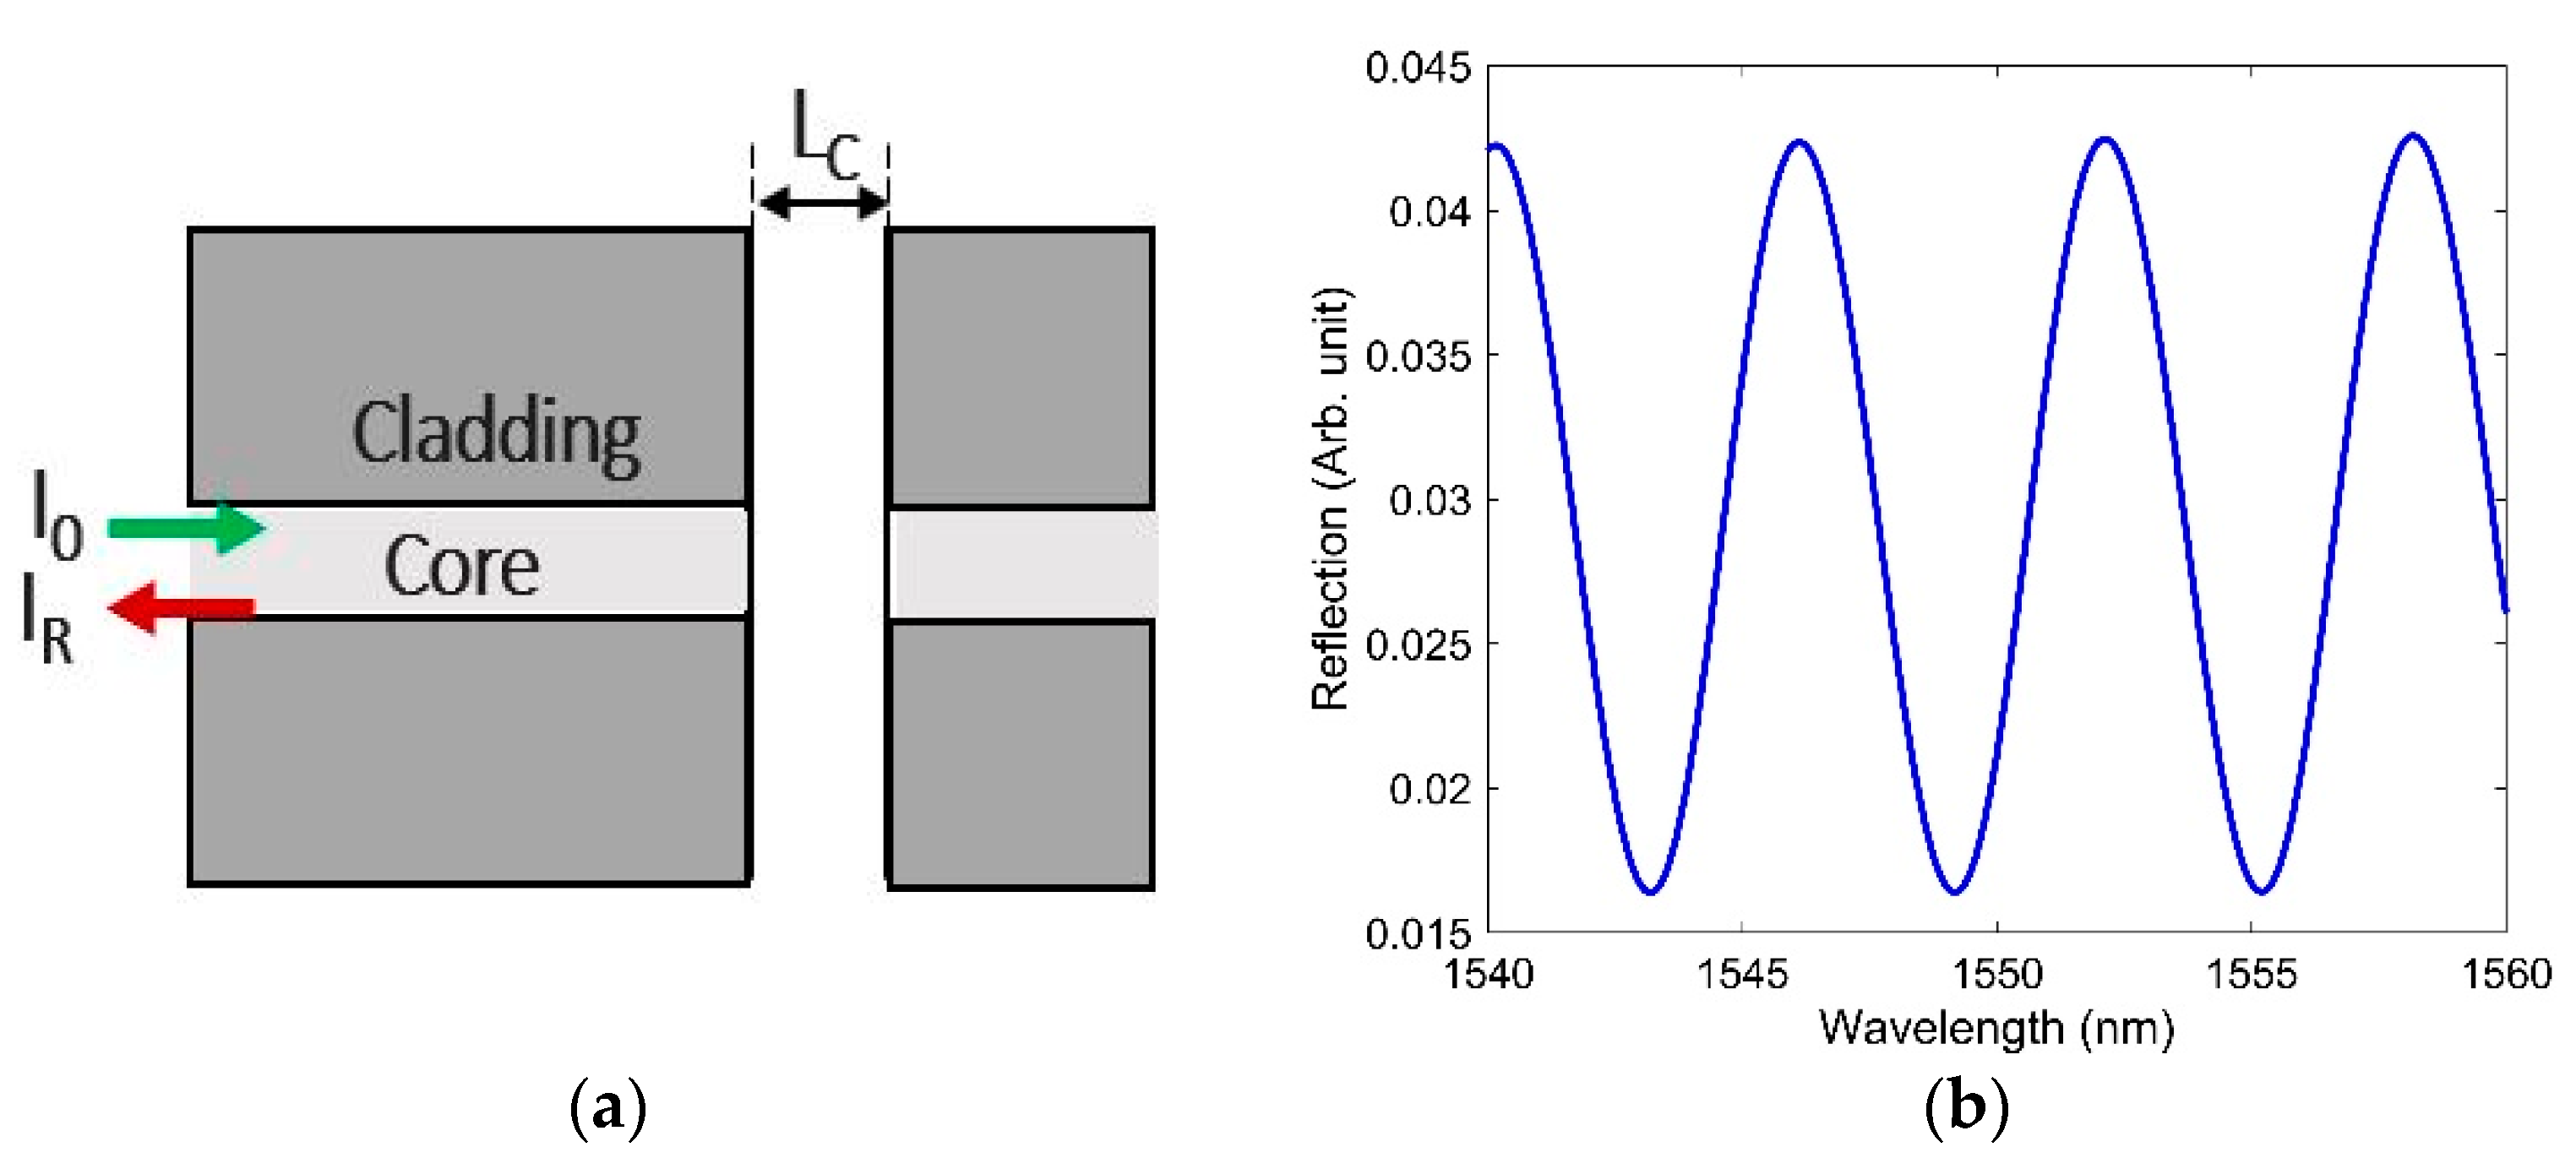
An F-P interferometer consists of two reflective surfaces surrounding a cavity. In an intrinsic F-P interferometer, the fiber, mirrors, and cavity are made within a single fiber. In contrast, in extrinsic F-P interferometer (EFPI) sensors, the cavity (containing either a different medium or air) is situated between a fiber tip and an external reflecting mirror. A schematic of an EFPI is shown in Figure 3a. The interferometric fringes of the simulated F- P sensor with a cavity length of 200 µm are shown in Figure 3b. Please note in all the designs of FBG, LPG, and F-P simulated in the paper, the same fiber parameters values as described in Section 2 were used.
3. Numerical Analysis of How RIC Affects OFS at Low Doses
To study how RIC affects OFS at low doses, we applied the change in RI values that resulted from the RIC observed by Kher et al. [18] (see Table 1) to our simulation models. Kher et al. derived the gamma-ray-induced RI change of a single-mode fiber by observing the resonance wavelength shift in an LPG. They used CO2 laser to inscribe the LPG. However, please note that inscription techniques of gratings play a crucial role in sensing different physical parameters in radiation environment. It is well known that radiation significantly affects the basic characteristics of FBG sensors such as peak wavelength and spectral width, and the amplitude and magnitude of these changes largely depend on the grating type and fabrication technique [8]. Similar to FBG, radiation also changes the structural parameters of LPG; again, it depends on the inscription technique, grating type, and composition of fibers [13,28,35]. It has been reported that fs-etched compared to conventional UV irradiated gratings can survive for a long time in radiation environment without significant degradation of gratings parameters [8,9,10]. In this section, we present our simulation results regarding how RIC affects the aforementioned sensors, based on these observed changes in the RI.
3.1. RIC Effects on FBG
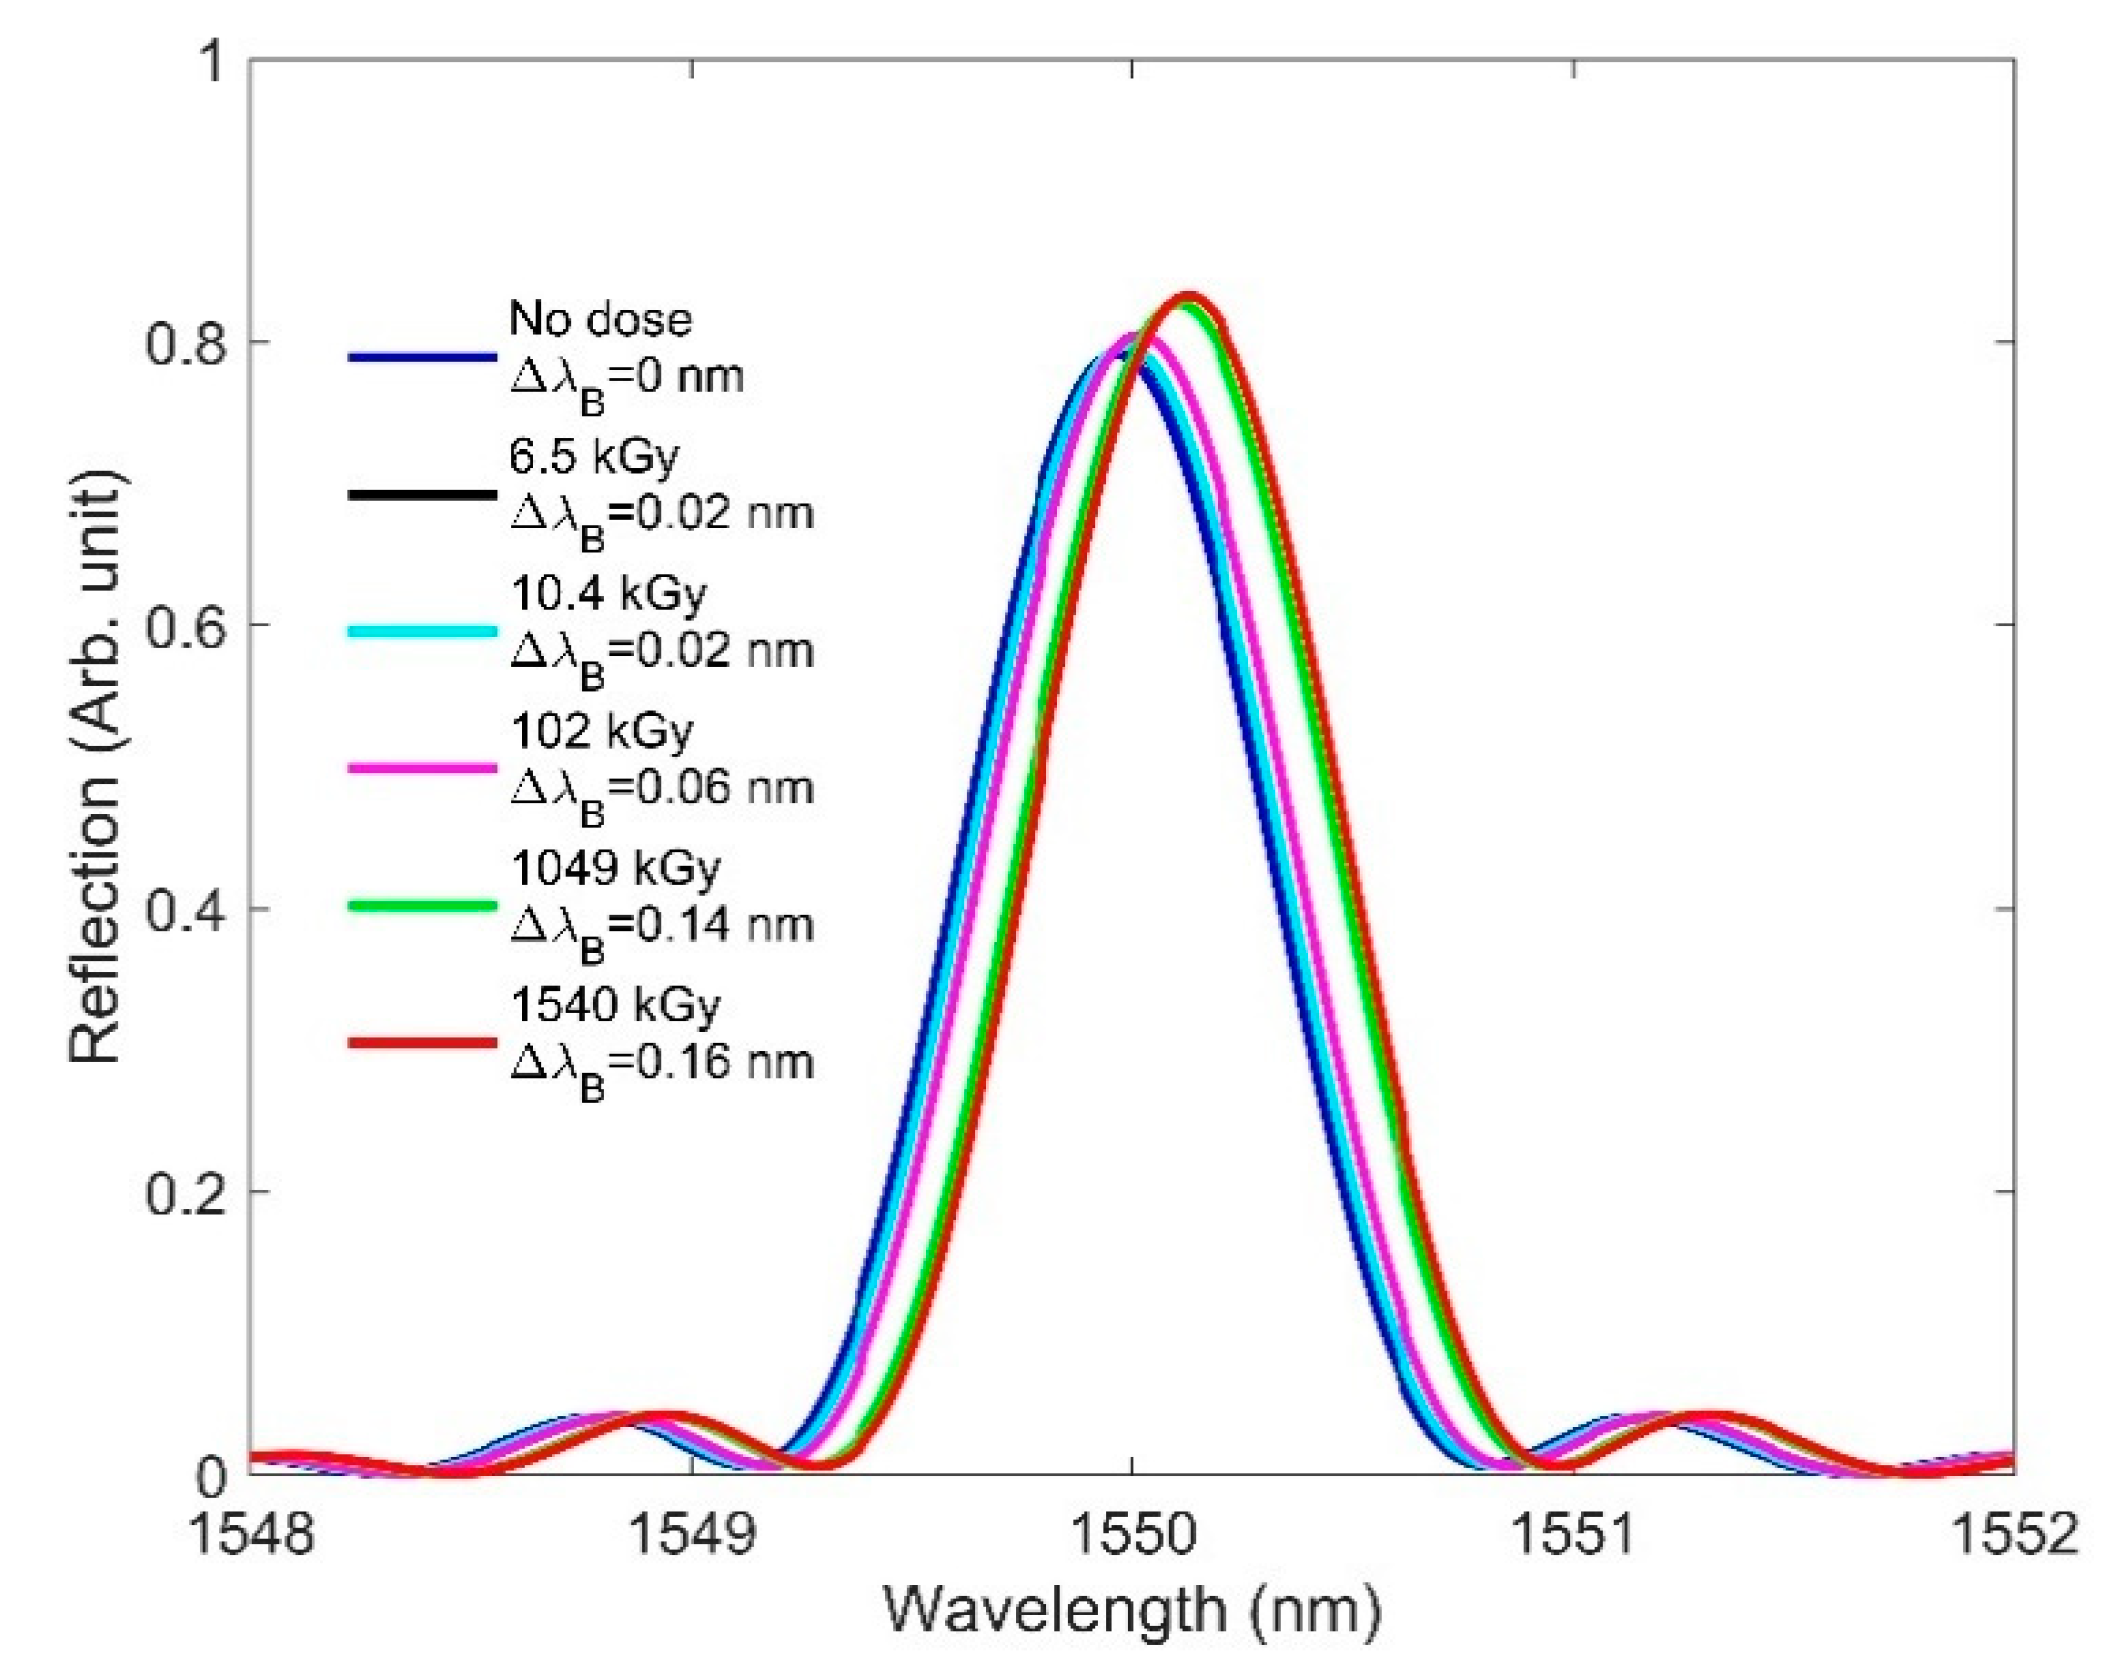
The radiation-induced RI changes shown in Table 1 are applied in the FBG model to observe their effects on the FBG spectra. Please note that we added the RI change values to the grating portion (in both high and low RIs). Figure 4 plots the Bragg wavelength changes due to RIC at various doses. We observed that increasing the dose resulted in a redshift in the Bragg peak, since increased RI shifts the Bragg wavelength to the longer wavelength side, as per Equation (1). A high dose (1540 kGy) provides the largest Bragg peak amplitude in comparison with a no-dose condition—something unusual for an FBG under a radiation field. It was reported that increasing the radiation dose degrades the amplitude of the Bragg peak, due to the significant attenuation caused by radiation-induced color-center generation [3,6,26]. If the attenuation effects are not considered, Figure 4 would indicate that an increasing RI change resulting from the radiation dose is accompanied by an increase in the amplitude of the Bragg peak, since we are independently analyzing the RIC effect. While our preliminary simulation results showed a redshift of the Bragg wavelength as a function of increasing doses, this contradicted the experimental findings reported in [17,26,36]. In the next section, we discuss another key aspect—one that involves RIC effects and considers the length change—for accurately predicting the resonance shift behavior in FBG.
3.2. RIC Effects on FBG Considering Length Change
While our simulation results for FBG demonstrate a redshift of the Bragg wavelength ( due to the radiation-induced RI change, experimental results reported in [17,26,36] showed a radiation-induced blueshift of . Comparing the simulation results to the experimental work reported in [17,26,36] suggests that additional parameters must be considered for simulating our designs.
In our earlier simulation, we did not consider material density variations due to changes in the RI, as described by the Lorentz–Lorenz relation [16] given by:
where n, , , , and are the RI, density of the material, Avogadro number, molecular weight, and electronic polarizability, respectively.
A change in density modifies the volume of the fiber material and, hence, the FBG/LPG grating period as well as the cavity length for the F-P interferometer. The density change relates to the volumetric change and can be represented by the following expression:
where ,, ,, and are the initial density, initial volume, final density, final volume, and volumetric compaction, respectively. Considering the isotropic change in volume, the relationship between volumetric compaction () and linear compaction () can be expressed by the following equation:
A linear compaction is required to observe the effect of the length (or grating period) change caused by radiation on the resonance-based sensors. The changes in density and length due to radiation-induced RI change values were calculated using Equations (3)–(5), and the calculated results are shown in Table 2. Along with the radiation-induced RI change, we added the grating period change (linear compaction) to our FBG model in order to see their overall effect on the FBG spectra.
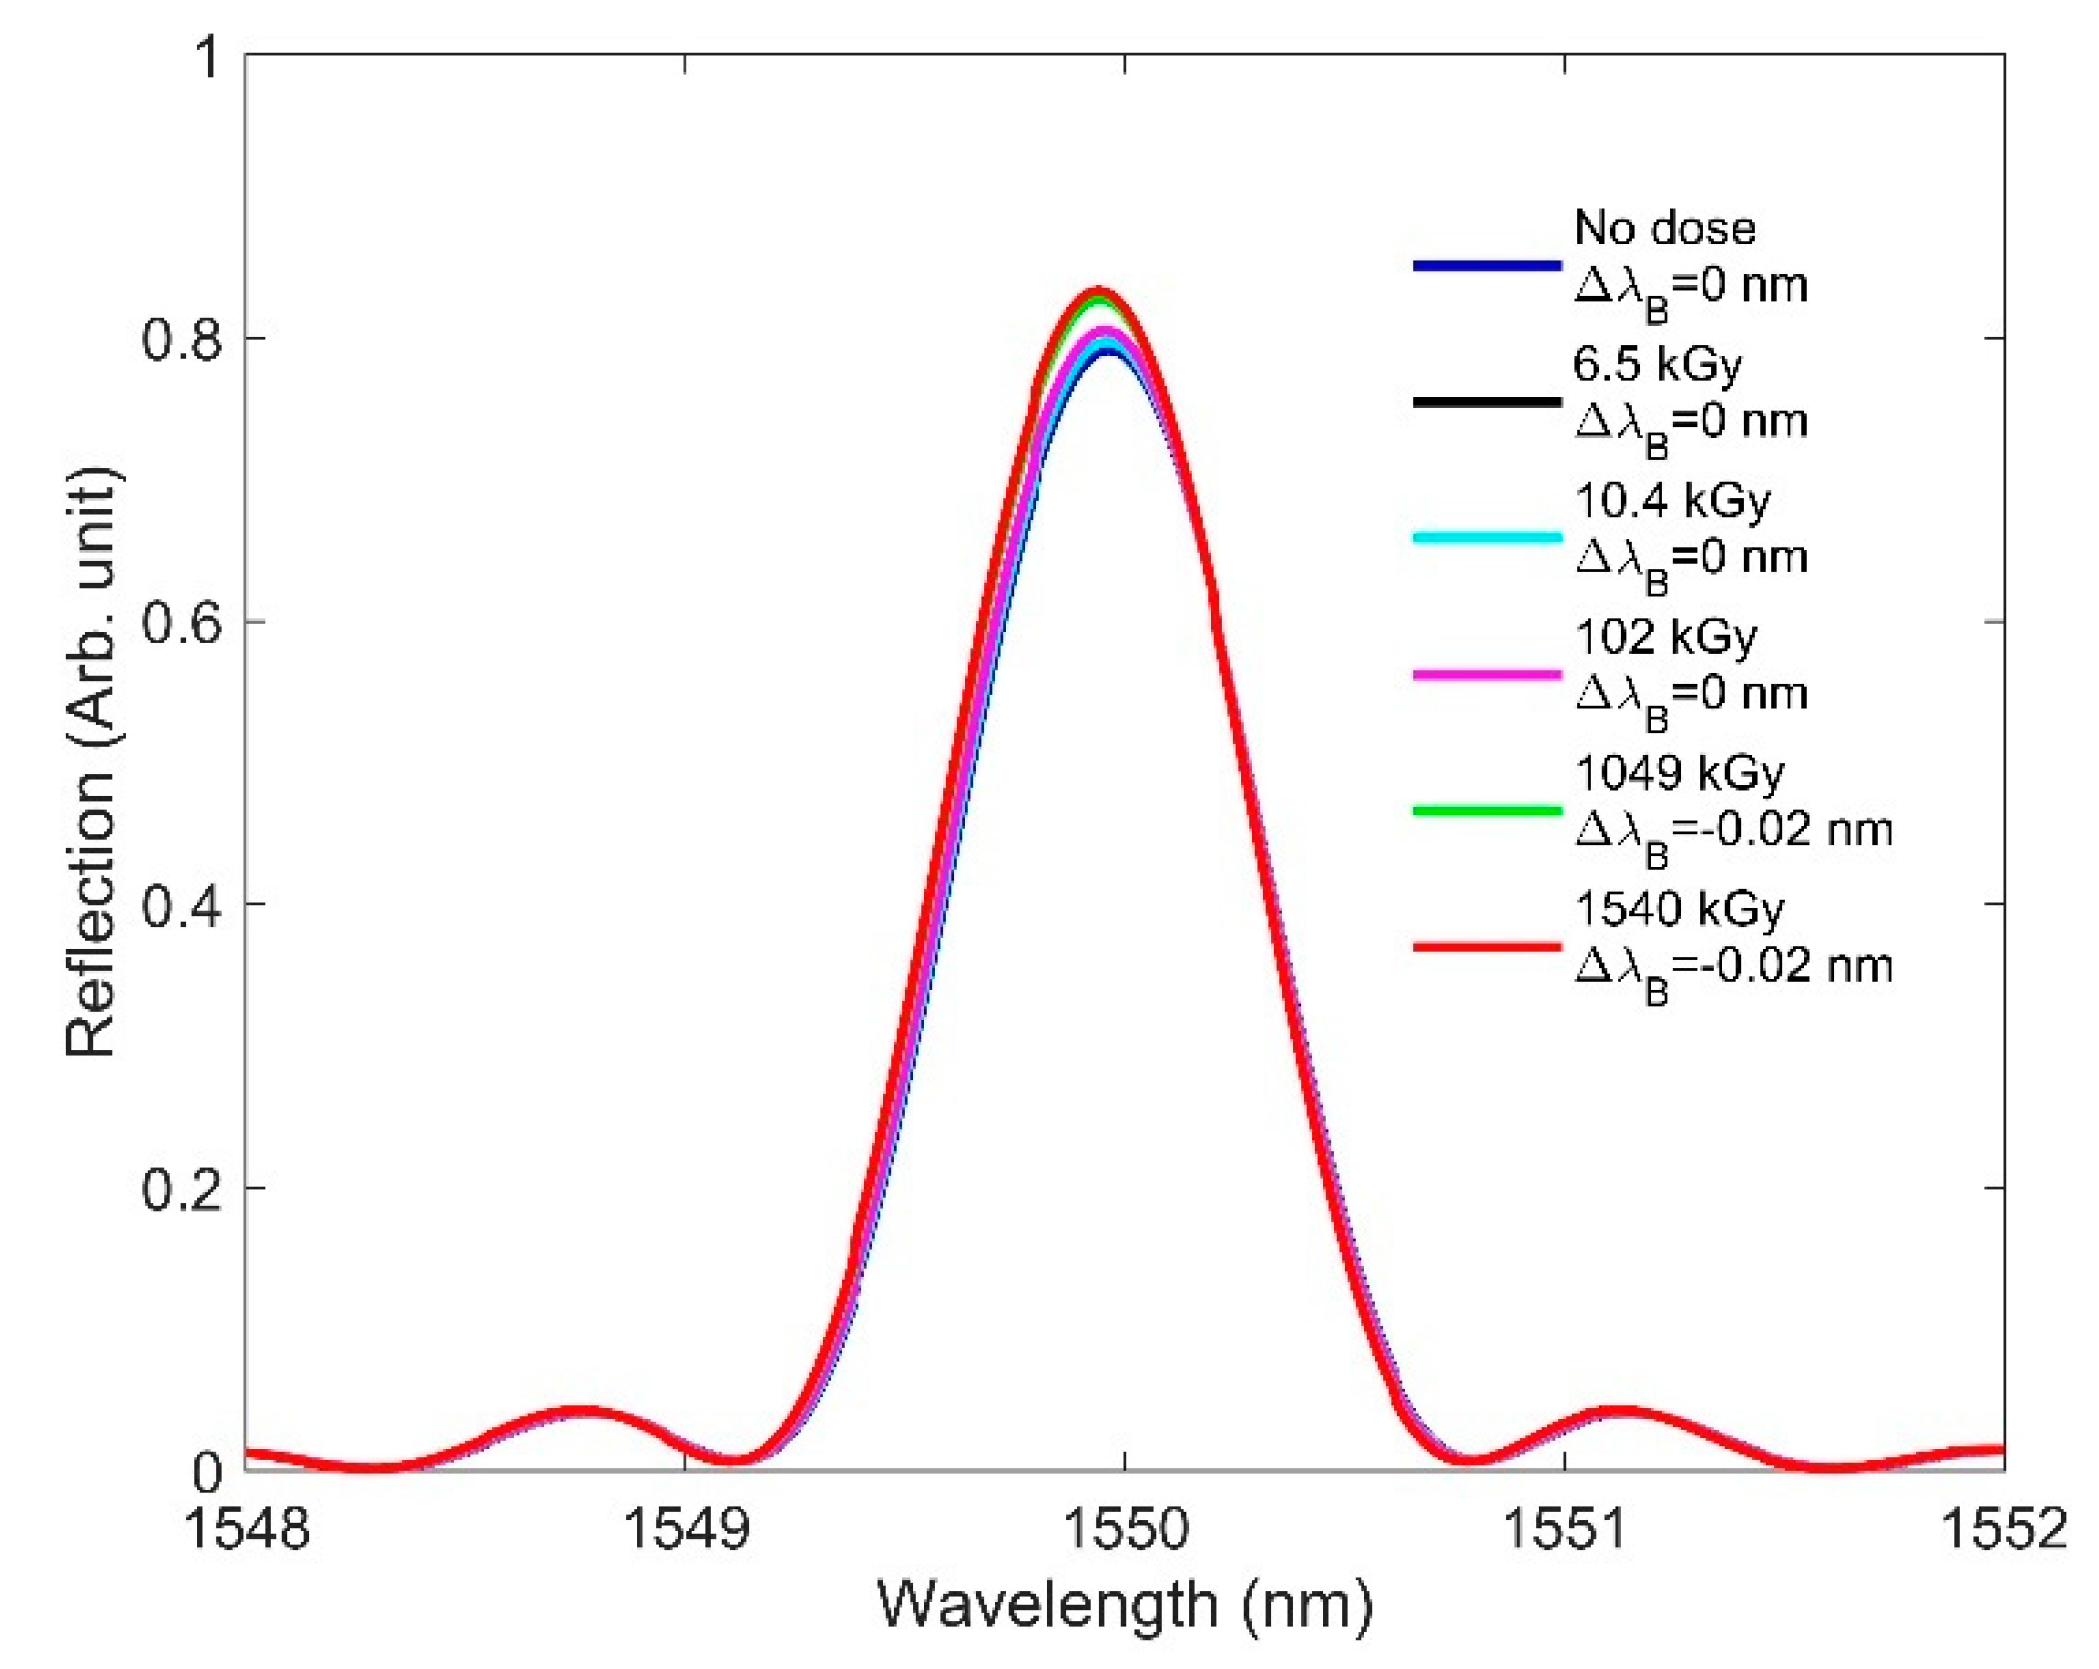
Figure 5 shows the Bragg wavelength shift as a function of dose when both the radiation-induced RI and length changes were considered for simulation. It is observed that, this time, the Bragg wavelength sees a blueshift with increasing doses.
While the increase in the RI produces a redshift of the Bragg wavelength, the compaction of length (reduced grating period) provides a competing blueshift. As the FBG grating period is generally very small (0.5353 µm in our design), even a small change in length caused by radiation induces a significant blueshift in the Bragg wavelength. Figure 5 reveals that the length-change effect on the Bragg wavelength compensates for the RI effect, producing a zero Bragg wavelength shift up to 102 kGy. At higher doses (1049–1540 kGy), the compaction effect on the Bragg wavelength dominates; as a result, the Bragg wavelength shifts towards the shorter wavelengths, thus supporting the experimental results reported in [17,26,36]. Please note that in [17,26,36], Nuetron-irradiation-induced shift was reported. However, both gamma and neutron irradiation alter the RI of the host fiber, although their mechanisms for changing the RI are different [37].
3.3. RIC Effects on LPG
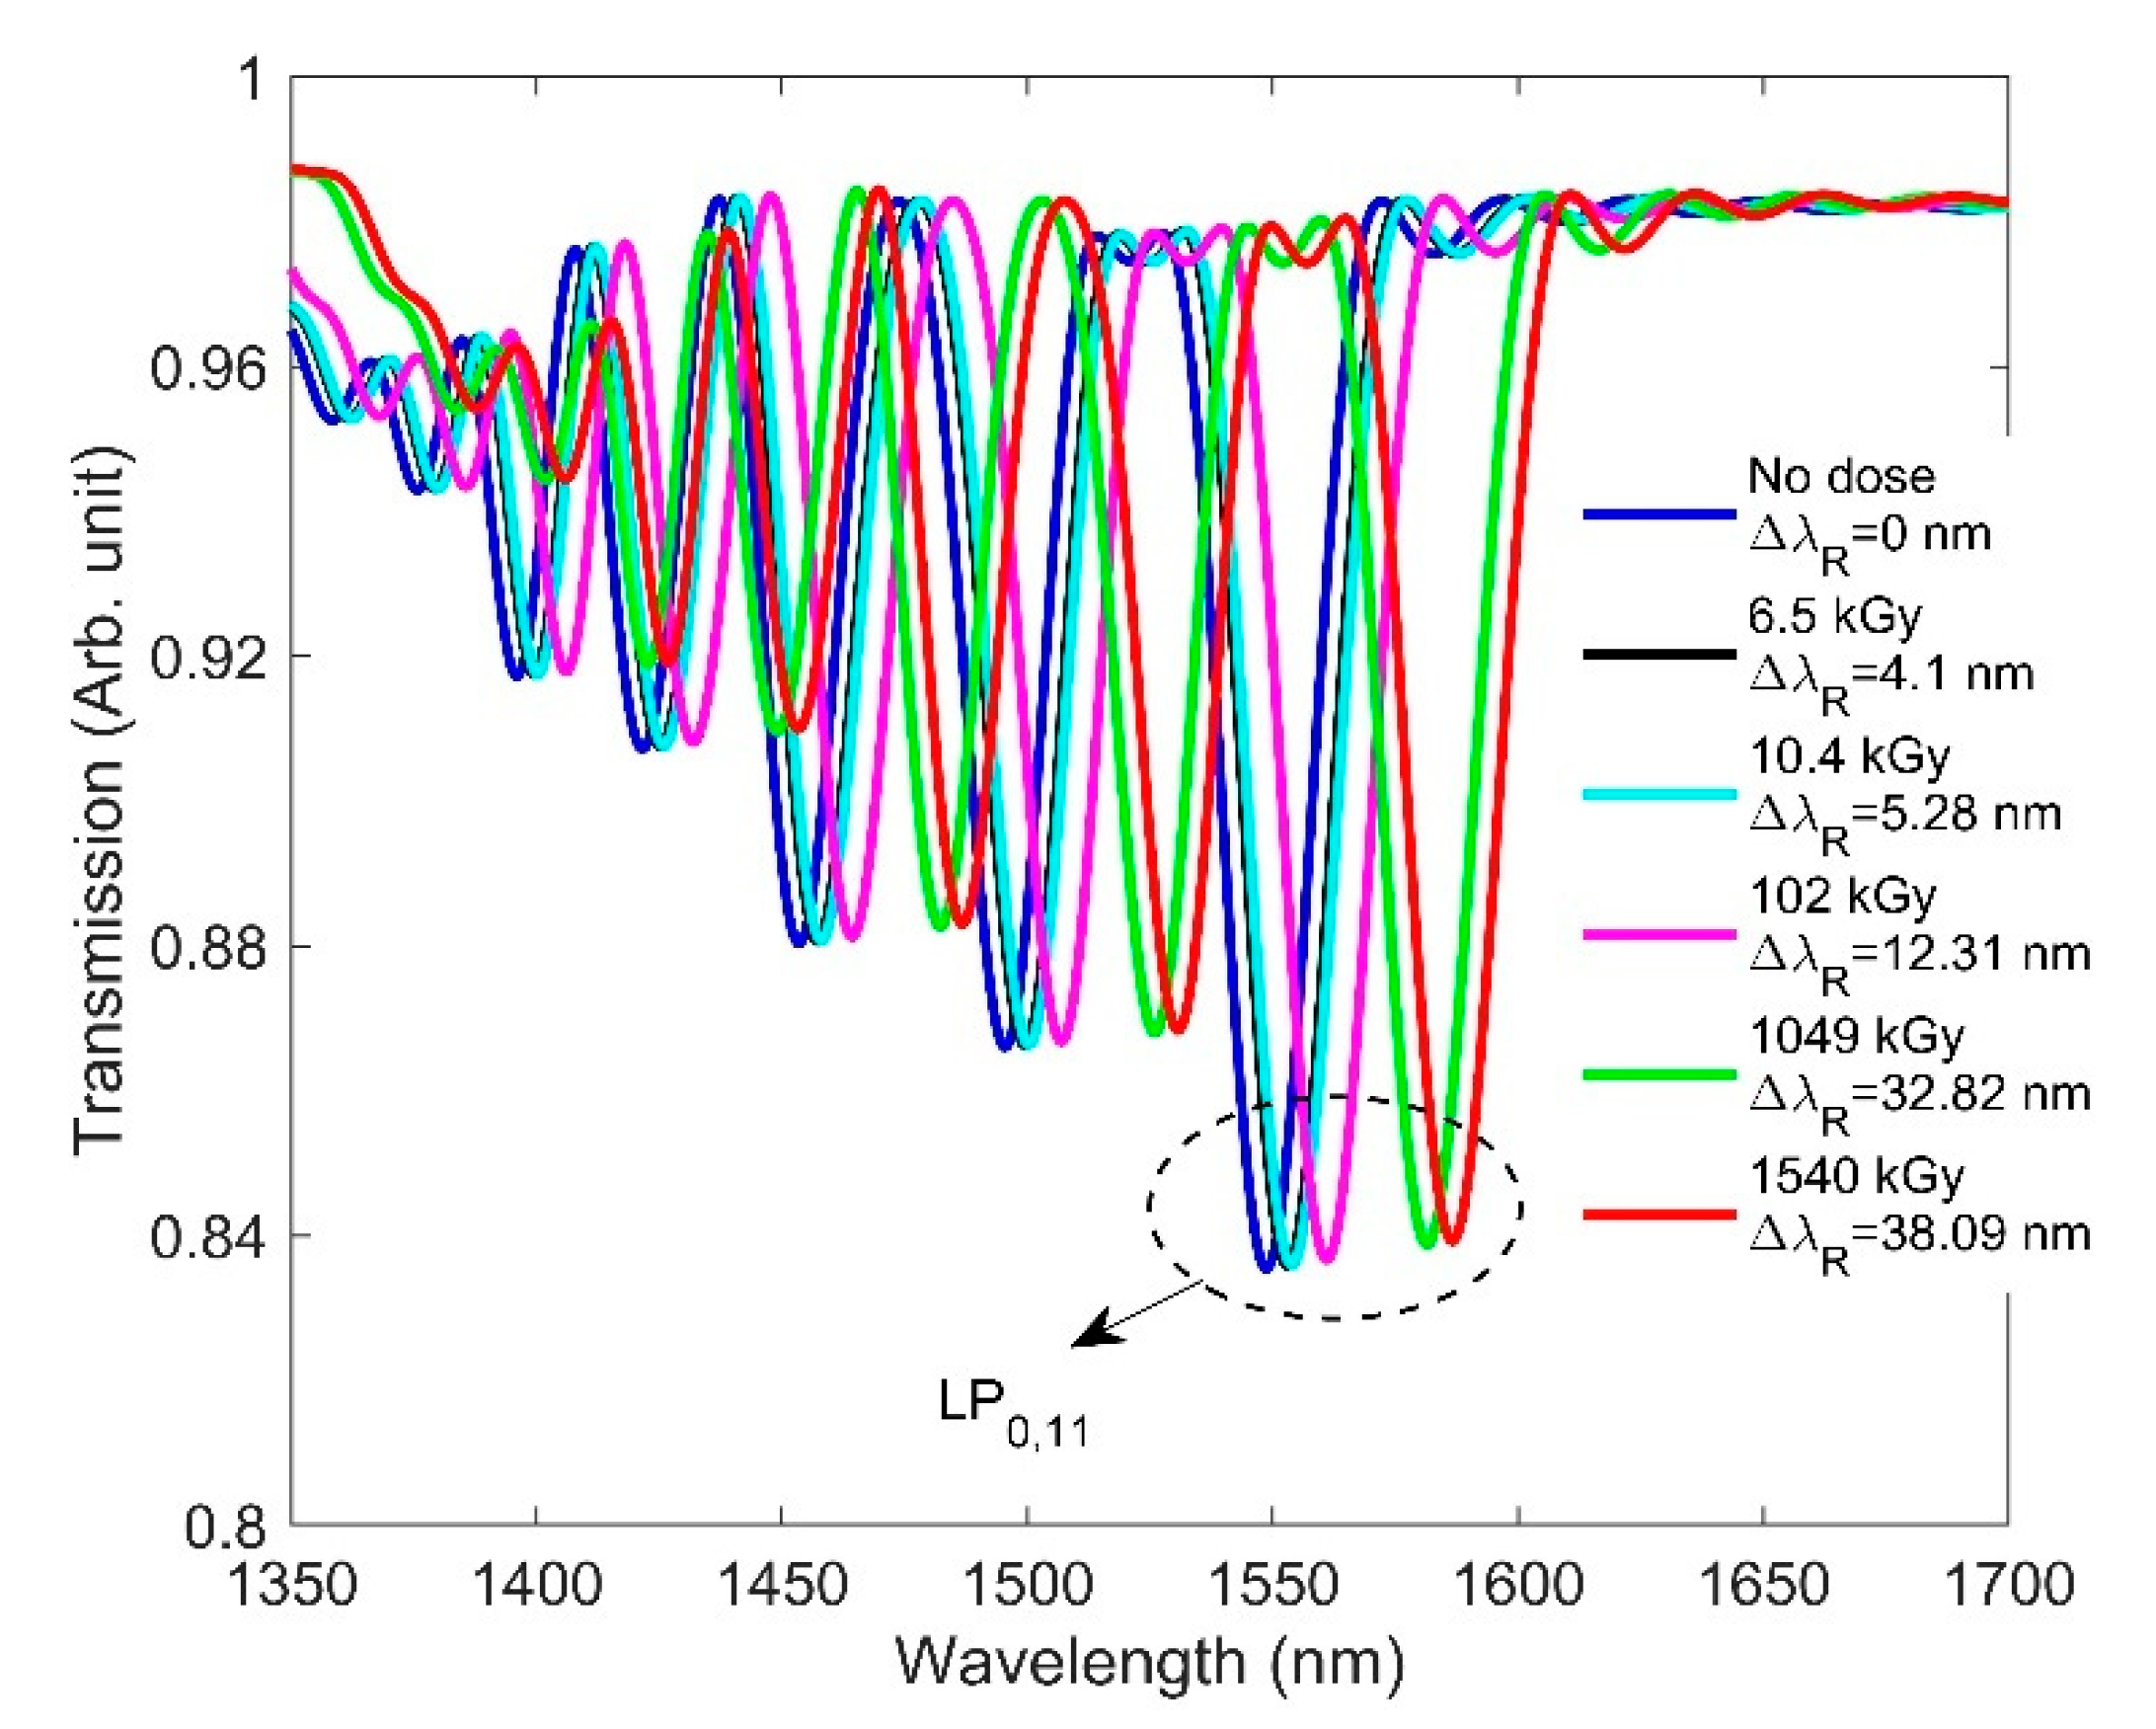
Here, we analyze how RIC affects the spectra of LPG. This is accomplished by inserting the radiation-induced RI values from Table 1 into our design. We assume no radiation-induced change in the pure silica-based cladding RI. It has been reported that pure-silica-based cladding composition has been shown to be resistant to gamma up-to 1 MGy due to the absence of precursors of radiation induced color centers like NBOHC and E’-centers [38]. Since no radiation-induced change in the cladding RI is considered, the resonance wavelength is expected to shift significantly due to the large effective RI difference between the core and cladding (). As with FBG, the RI change values due to radiation were added to the grating portion. Figure 6 shows the transmission spectrum for the designed LPG when only the RI change due to radiation was considered in the simulation. Please note that, throughout the paper, we only considered the resonance wavelength shift of the LP0,11 cladding mode. The resonance wavelength is seen to shift from 1550 to 1588.08 nm when the accumulated dose is increased from a no-dose condition to 1540 kGy. This is due to the dependency of the resonance wavelength on the differential RI between the core and cladding. The simulation results show good agreement with the experimental results reported in [18], where the researchers demonstrated a redshift of the resonance wavelength with increasing doses.
3.4. RIC Effects on LPG Considering Length Change
Figure 7 shows the combined effect of the radiation-caused RI and length changes on the spectra of the designed LPG. It is seen from Figure 7 that the resonance wavelength shift is slightly smaller than when the length change was not considered (Figure 6), due to the competing blueshift effect induced by the length change effect. Since the grating period of the designed LPG is 348 µm, a small change in the grating period due to the radiation does not significantly affect the resonance wavelength. Furthermore, the resonance wavelength shift of LPG under gamma radiation was observed, which cannot be attributed to changes in grating period [18]. As a result, the effect of the RI on the LPG spectra dominates over the length compaction effect, and the resonance wavelength shifts towards the longer wavelength for increasing doses.
3.5. RIC Effects on F-P
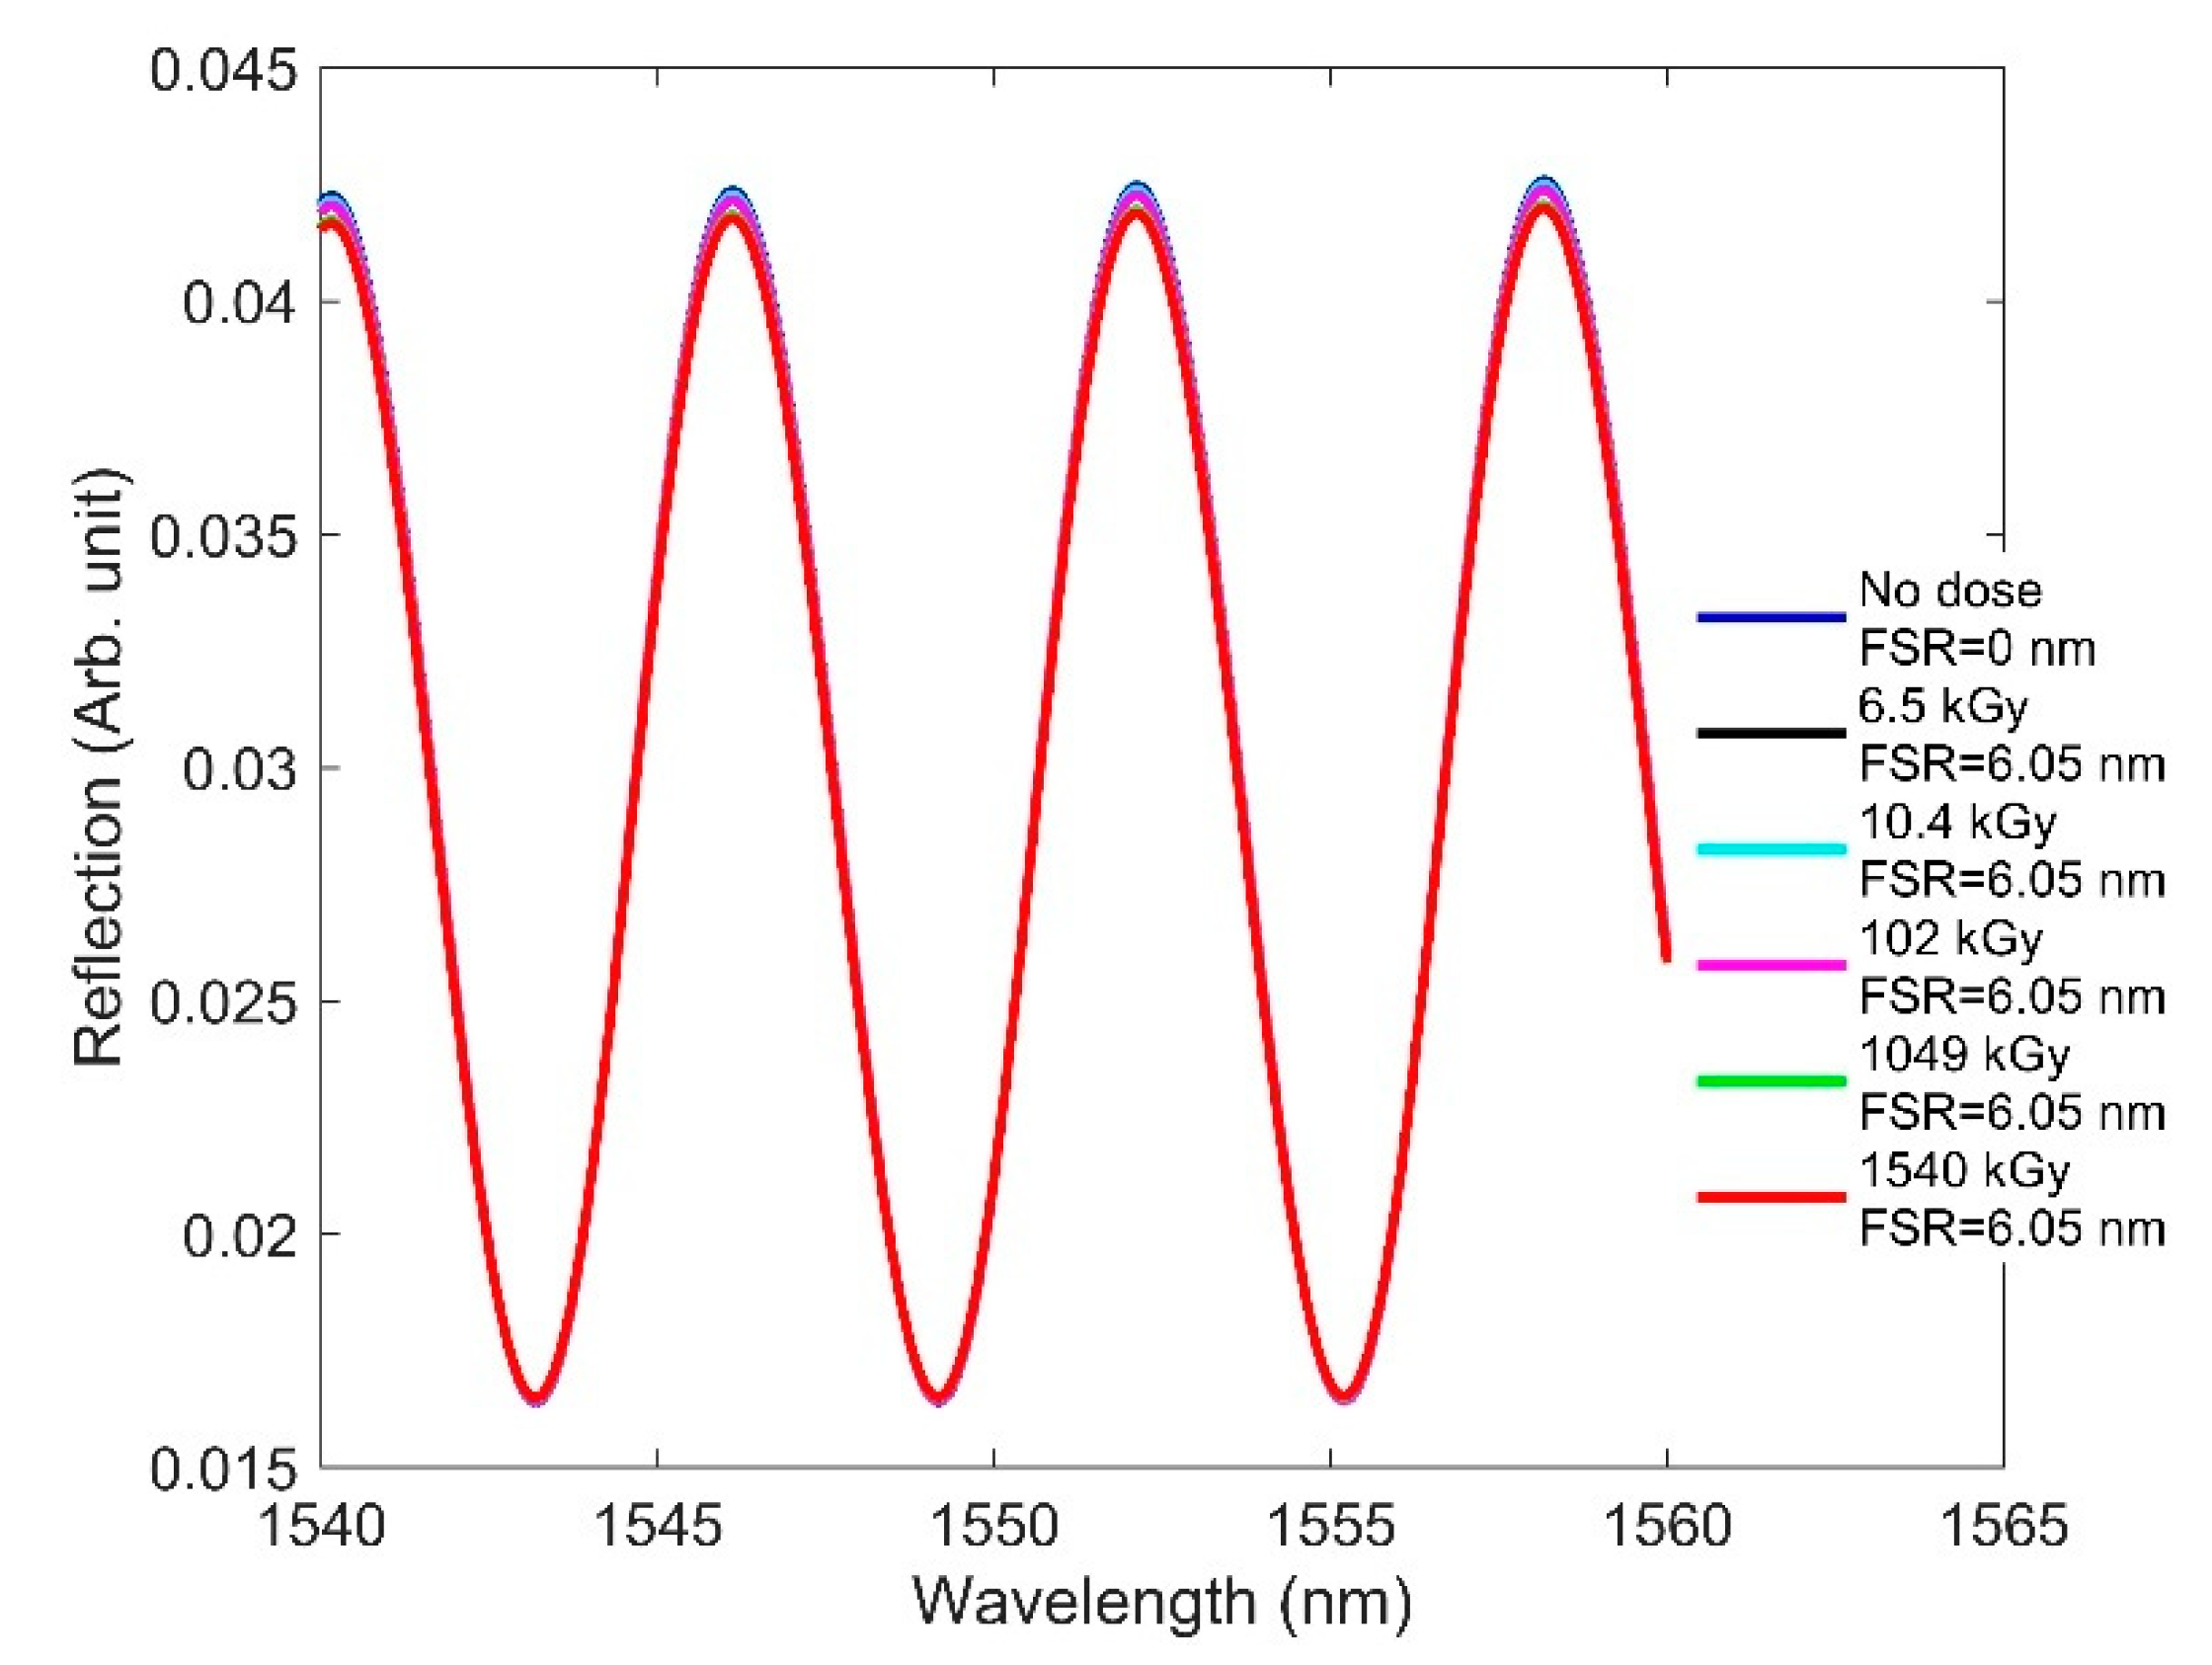
Here, we focus on how RIC affects F-P sensor performance. We designed an EFPI in which the cavity is comprised of an air medium. We considered one end surface of the cavity to be metal and the other to be the fiber facet. Because of the air cavity, the radiation-induced RI change to the fiber did not affect the wavelength characteristics of the fringes. As a result, the free spectral range (FSR)—namely, the spectral distance between two adjacent fringe peaks—remained constant with increasing doses (Figure 8).
3.6. RIC Effects on F-P Considering Length Change
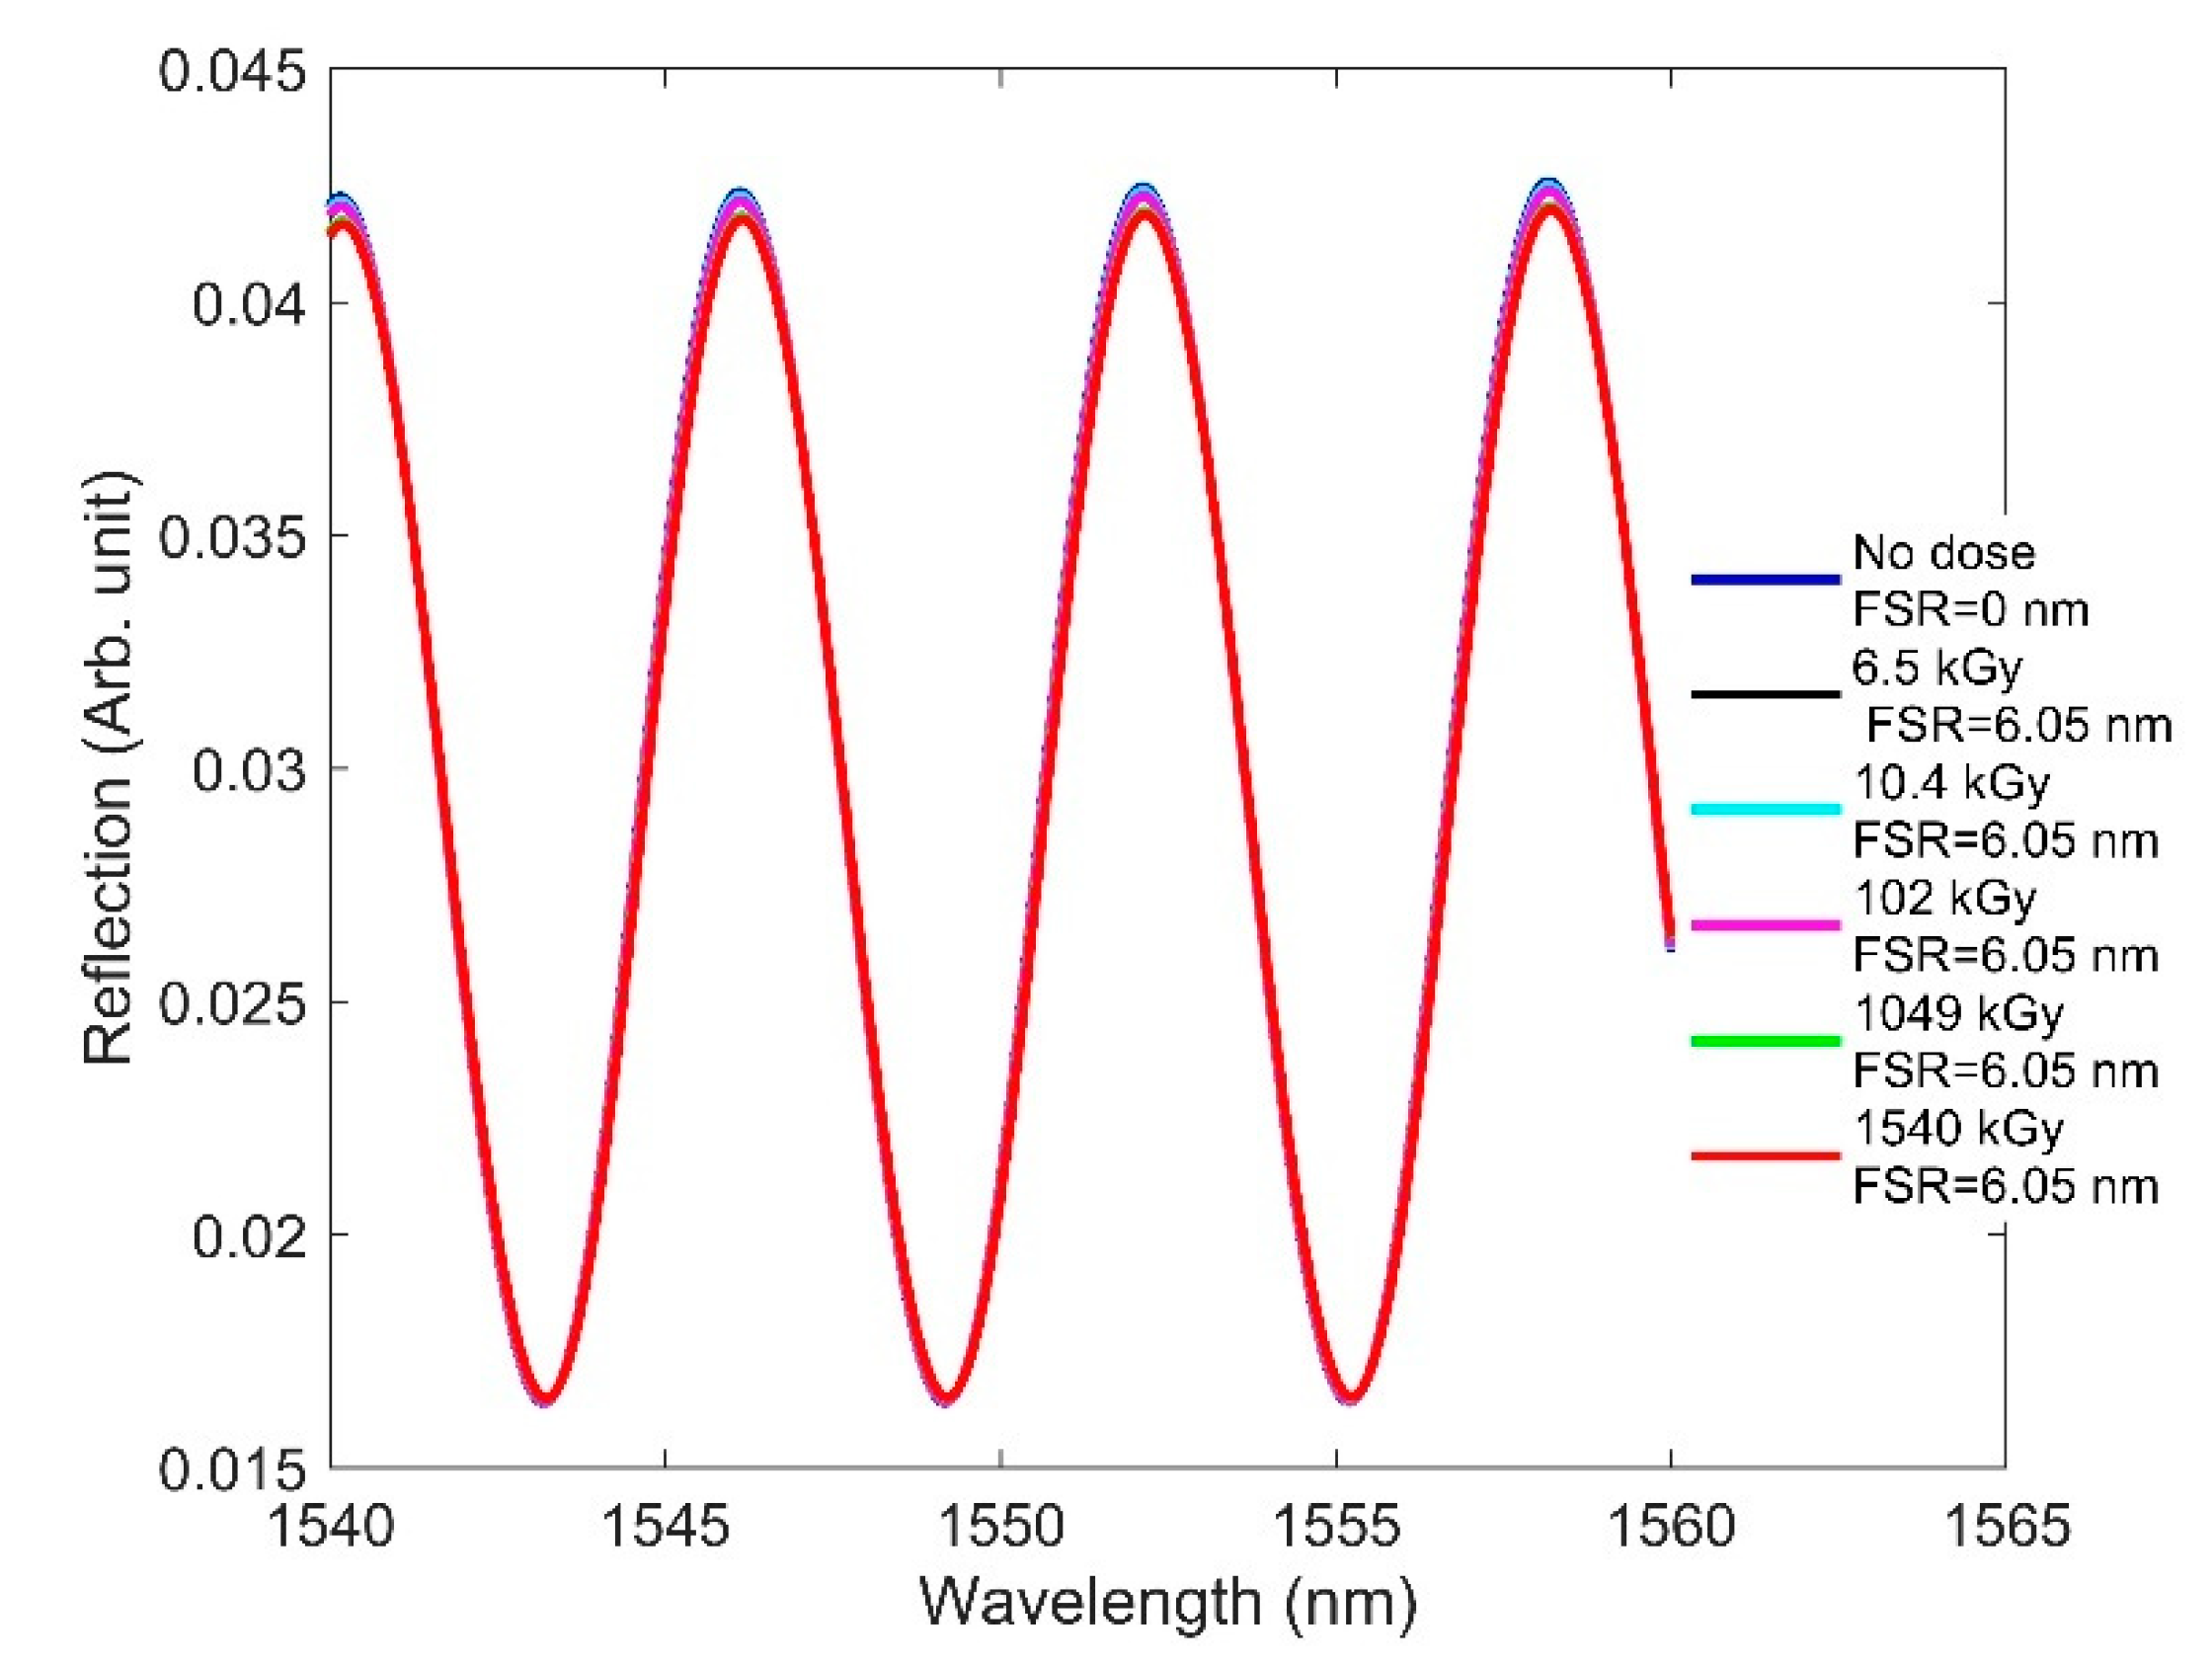
It is necessary to consider the radiation-induced length change to observe how RIC affects the designed F-P sensor, even though the cavity medium is air. For simulation purposes, we considered a roughly 50-µm-long fiber segment exposed to radiation beyond the fixing point, for example, as in [15], and compaction was calculated for that length. The responses of the sensor can differ, depending on the choice of cavity length as well as the fiber length exposed to a radiation field. For example, F-P sensors with different lengths of lead-in fibers were intentionally exposed to radiation, and compaction was assessed on the fiber tips in [15]. The calculated length change taken from Table 2 was used to simulate the F-P sensor. Figure 9 shows the fringe pattern and FSR of the designed F-P sensor at different doses. We observed no change in the fringe position, owing to a similarly negligible change in the effective cavity length. Of the three types of sensors studied in regard to low-dose effects, the F-P sensor was found to be the most robust to radiation. Thus, F-P sensors can be considered a potential candidate for measuring physical parameters in nuclear environments when the accumulated dose reaches 1540 kGy.
4. RIC Effects on OFS at High Doses
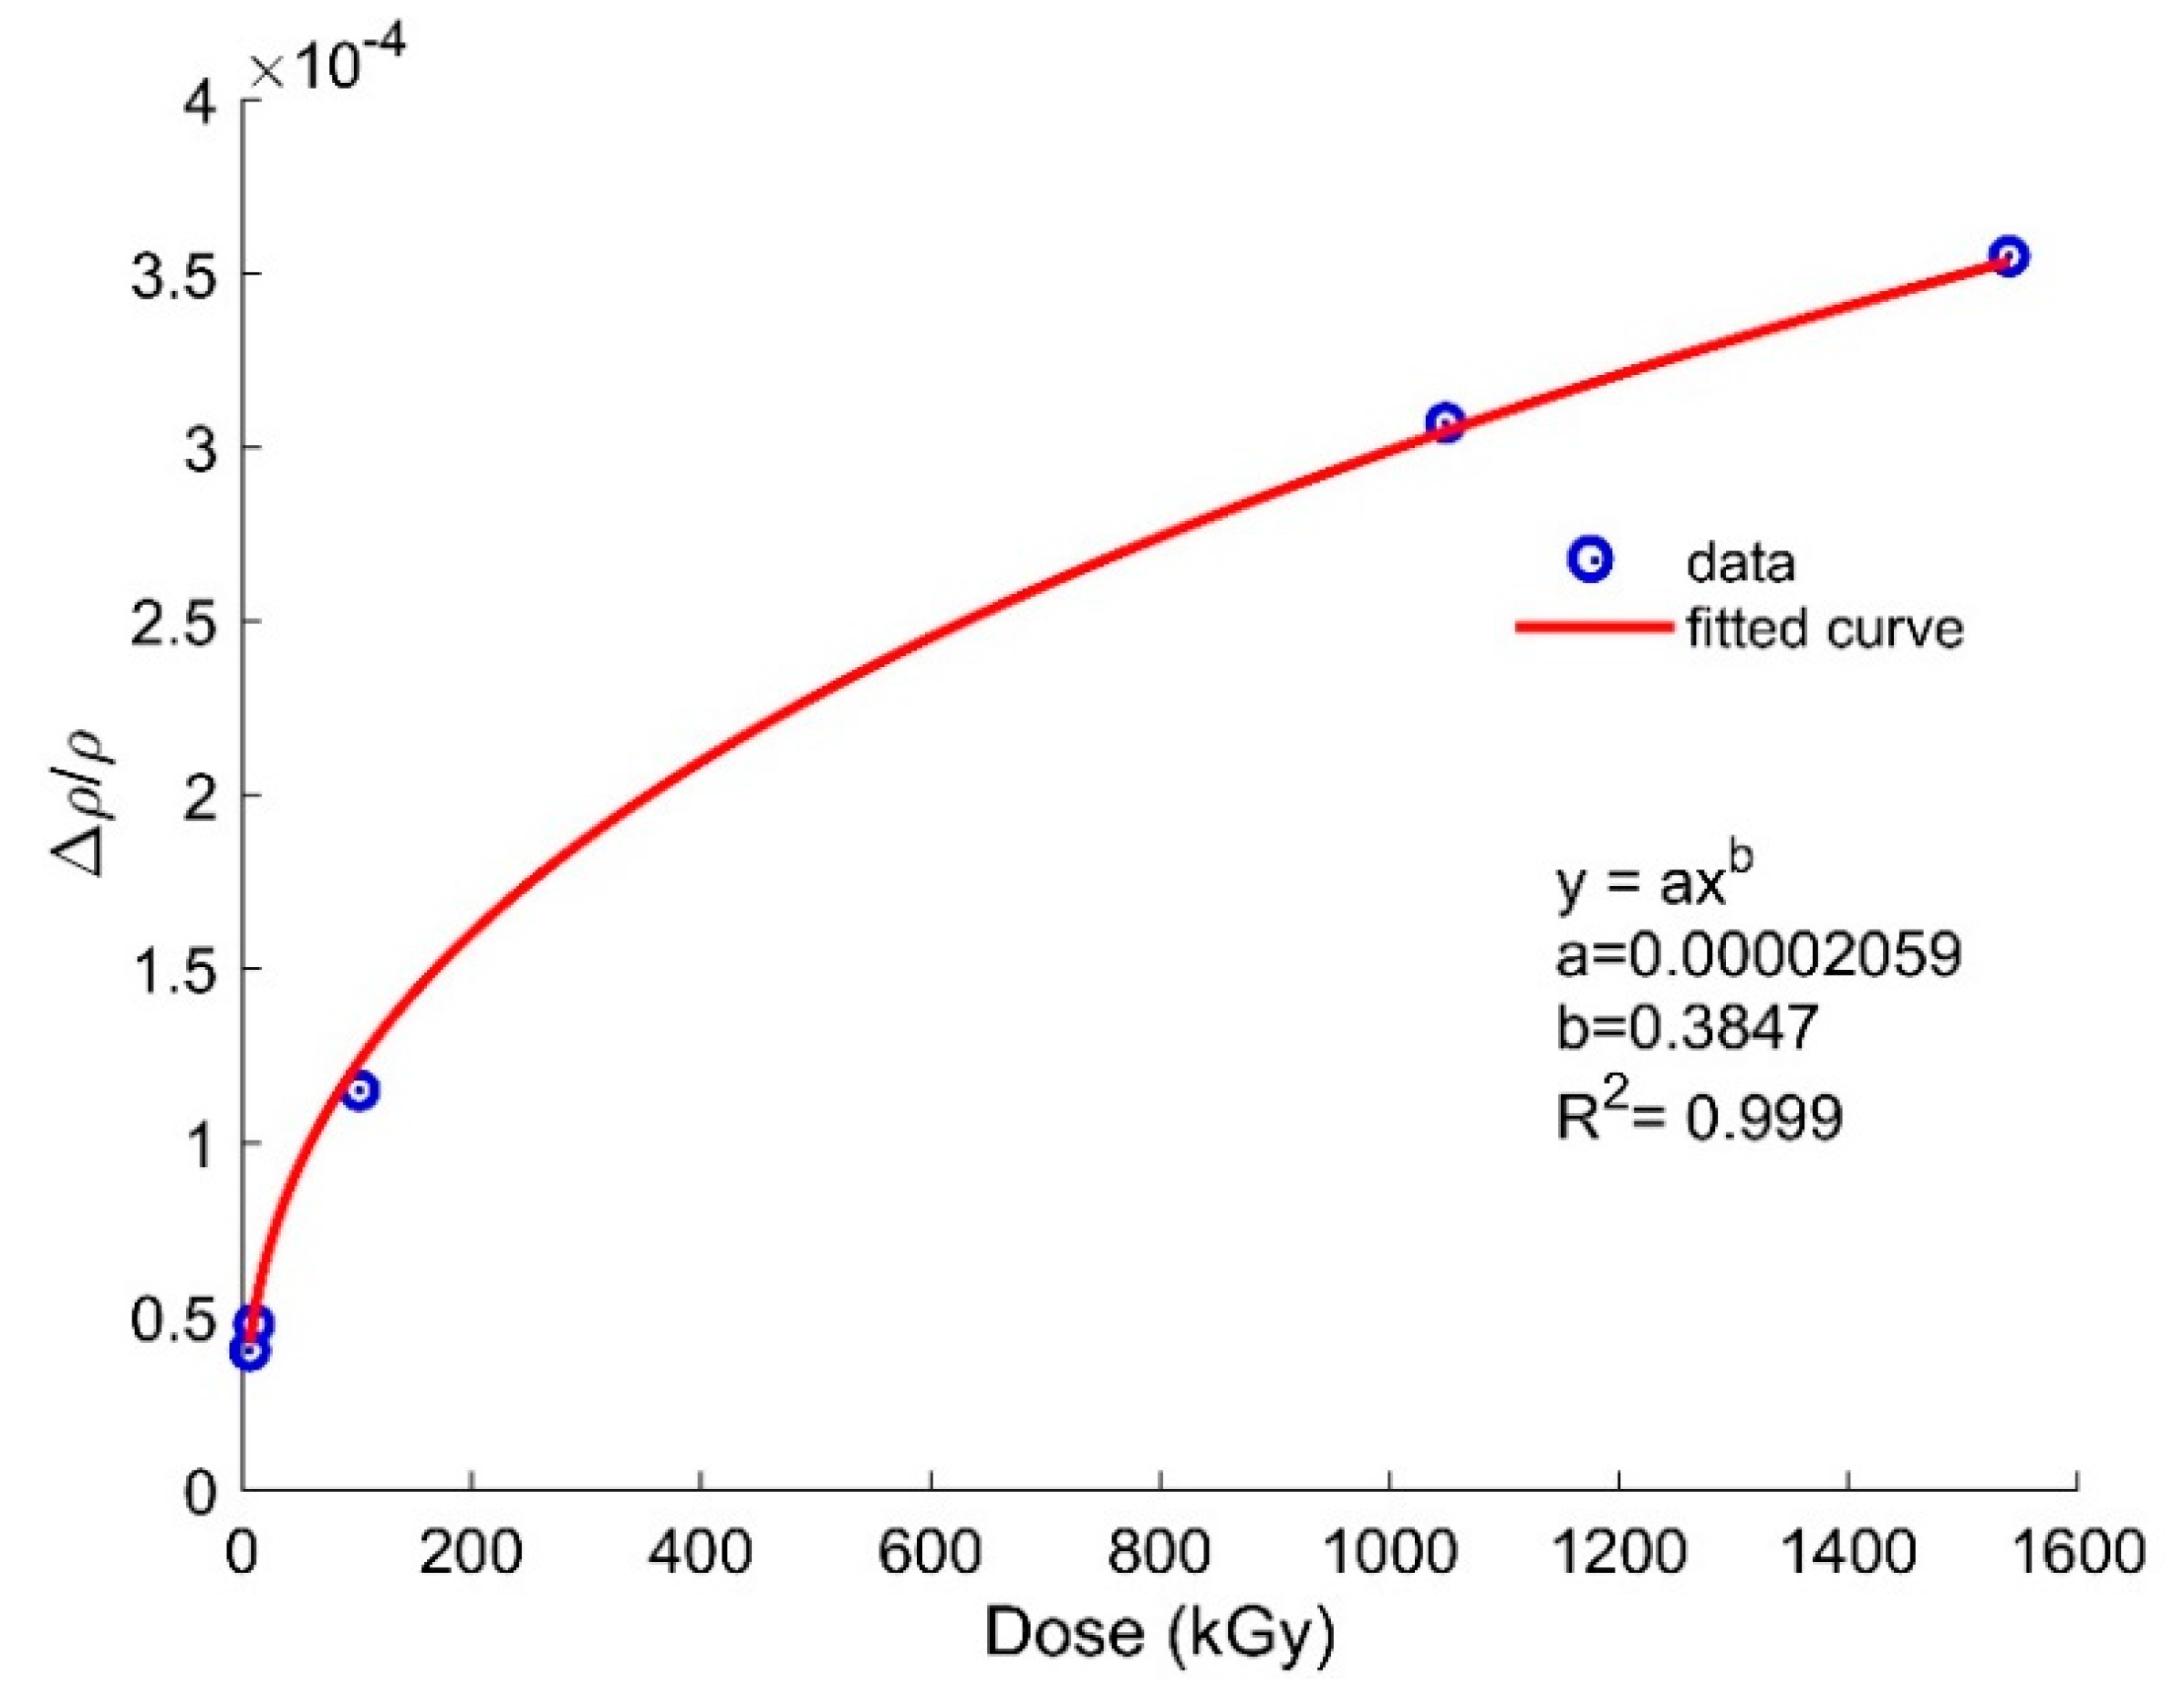
As discussed earlier, radiation alters the RI by means of compactions and creating diferetnt types of defects in the host fiber. Several works have observed the gamma-radiation-induced change in RI values in MGy doses [39,40,41], which are shown in Table 3. It is seen that the change in RI is not consistent with the accumulated doses since several factors, such as dose rate, composition of fibers, and irradiation temperature, can affect the RI change. So far, we have considered radiation effects at lower doses. To study the effects on OFS at high doses, we used the radiation-induced density values from Table 2 and fitted the relative density vs. dose plot using a power law fit (see Figure 10). Using the fitting constant values, we calculated the density, RI, and length changes for the sensors at higher doses of up to 7 MGy via the following power law equation [37]:
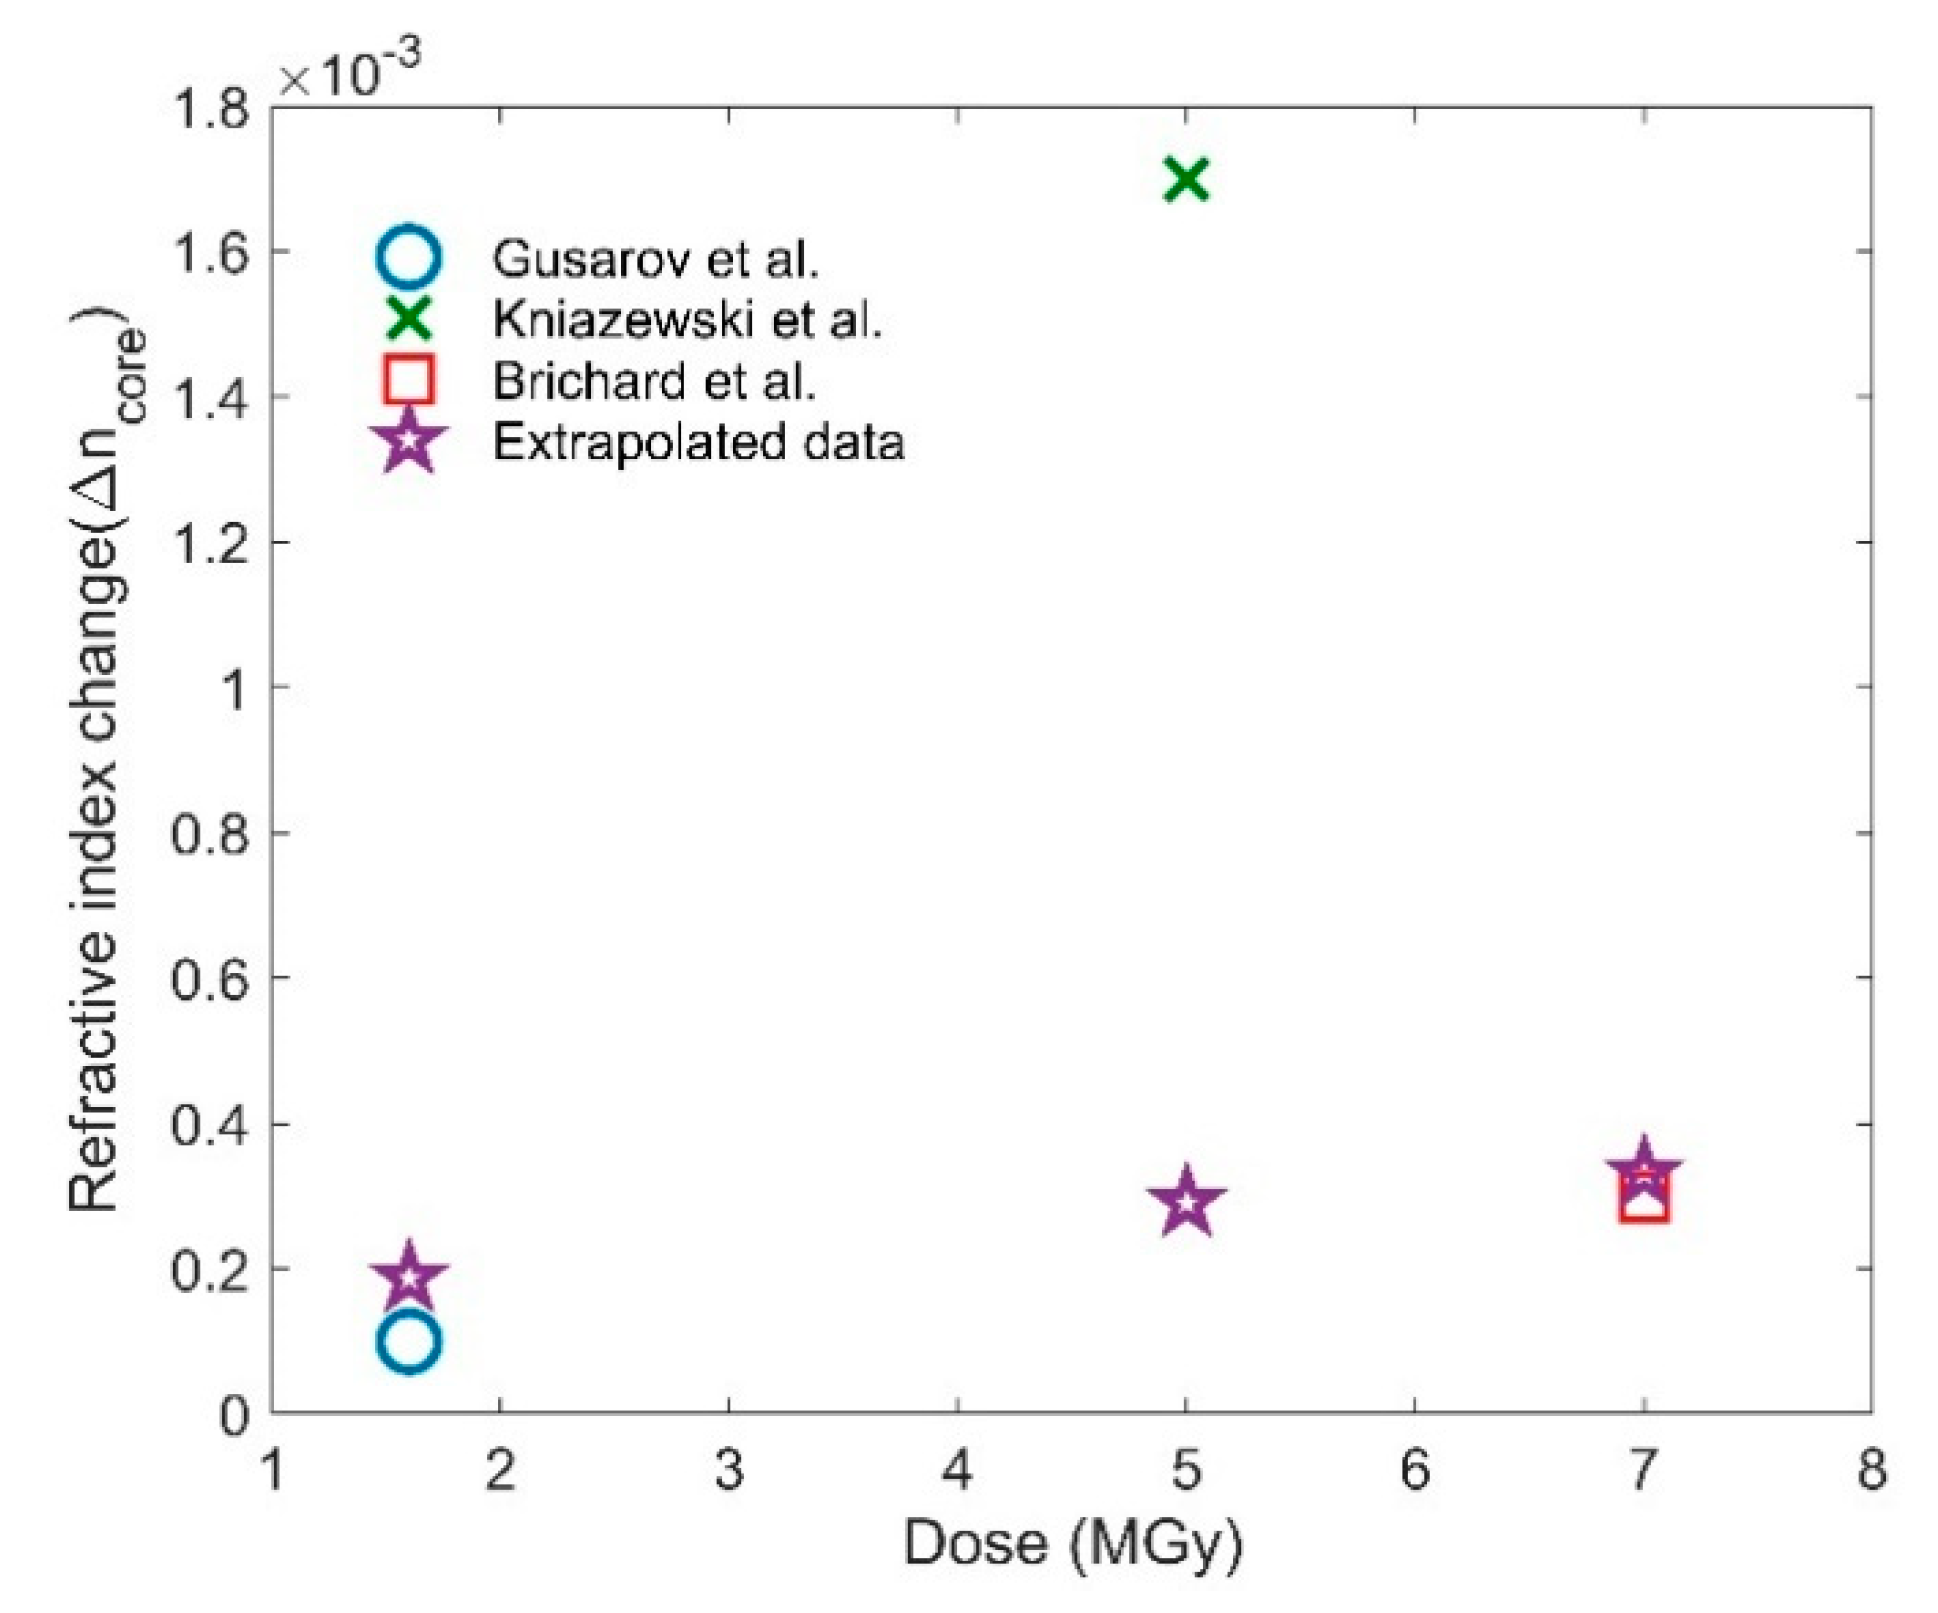
where A is the material-dependent constant and C is another constant [37]. Based on fitting parameters, we determined the values of A and C to be 0.00002059 and 0.3847, respectively. By inserting the values of the fitting constants into Equation (6), the RI and length compaction were calculated for doses of 1.6, 5, and 7 MGy. The extrapolated data calculated by our approach is shown in Table 4. To validate our extrapolation, we found three experimental works within MGy regime with their modified change in RI [37,38,39] within the core shown in Figure 11 along with our extrapolated data (star marker). The details of the three experimental works are given in Table 3.
It can be seen that our extrapolated data is consistent with the RI change reported by Gusarov et al. [37] and Brichard et al. [38], while the data provided by Kniazewski et al. [39] for 5 MGy is within the order of magnitude of our prediction. We limit our work to MGy as we only found experimental validations within MGy levels. Please note that there are different factors that alter the optical and mechanical properties of the fiber exposed to gamma radiation, which has been discussed in the Section 1. In the next subsections, we analyzed the effects of both RI and length change at these MGy doses for the three sensor types.
4.1. RIC Effects on FBG
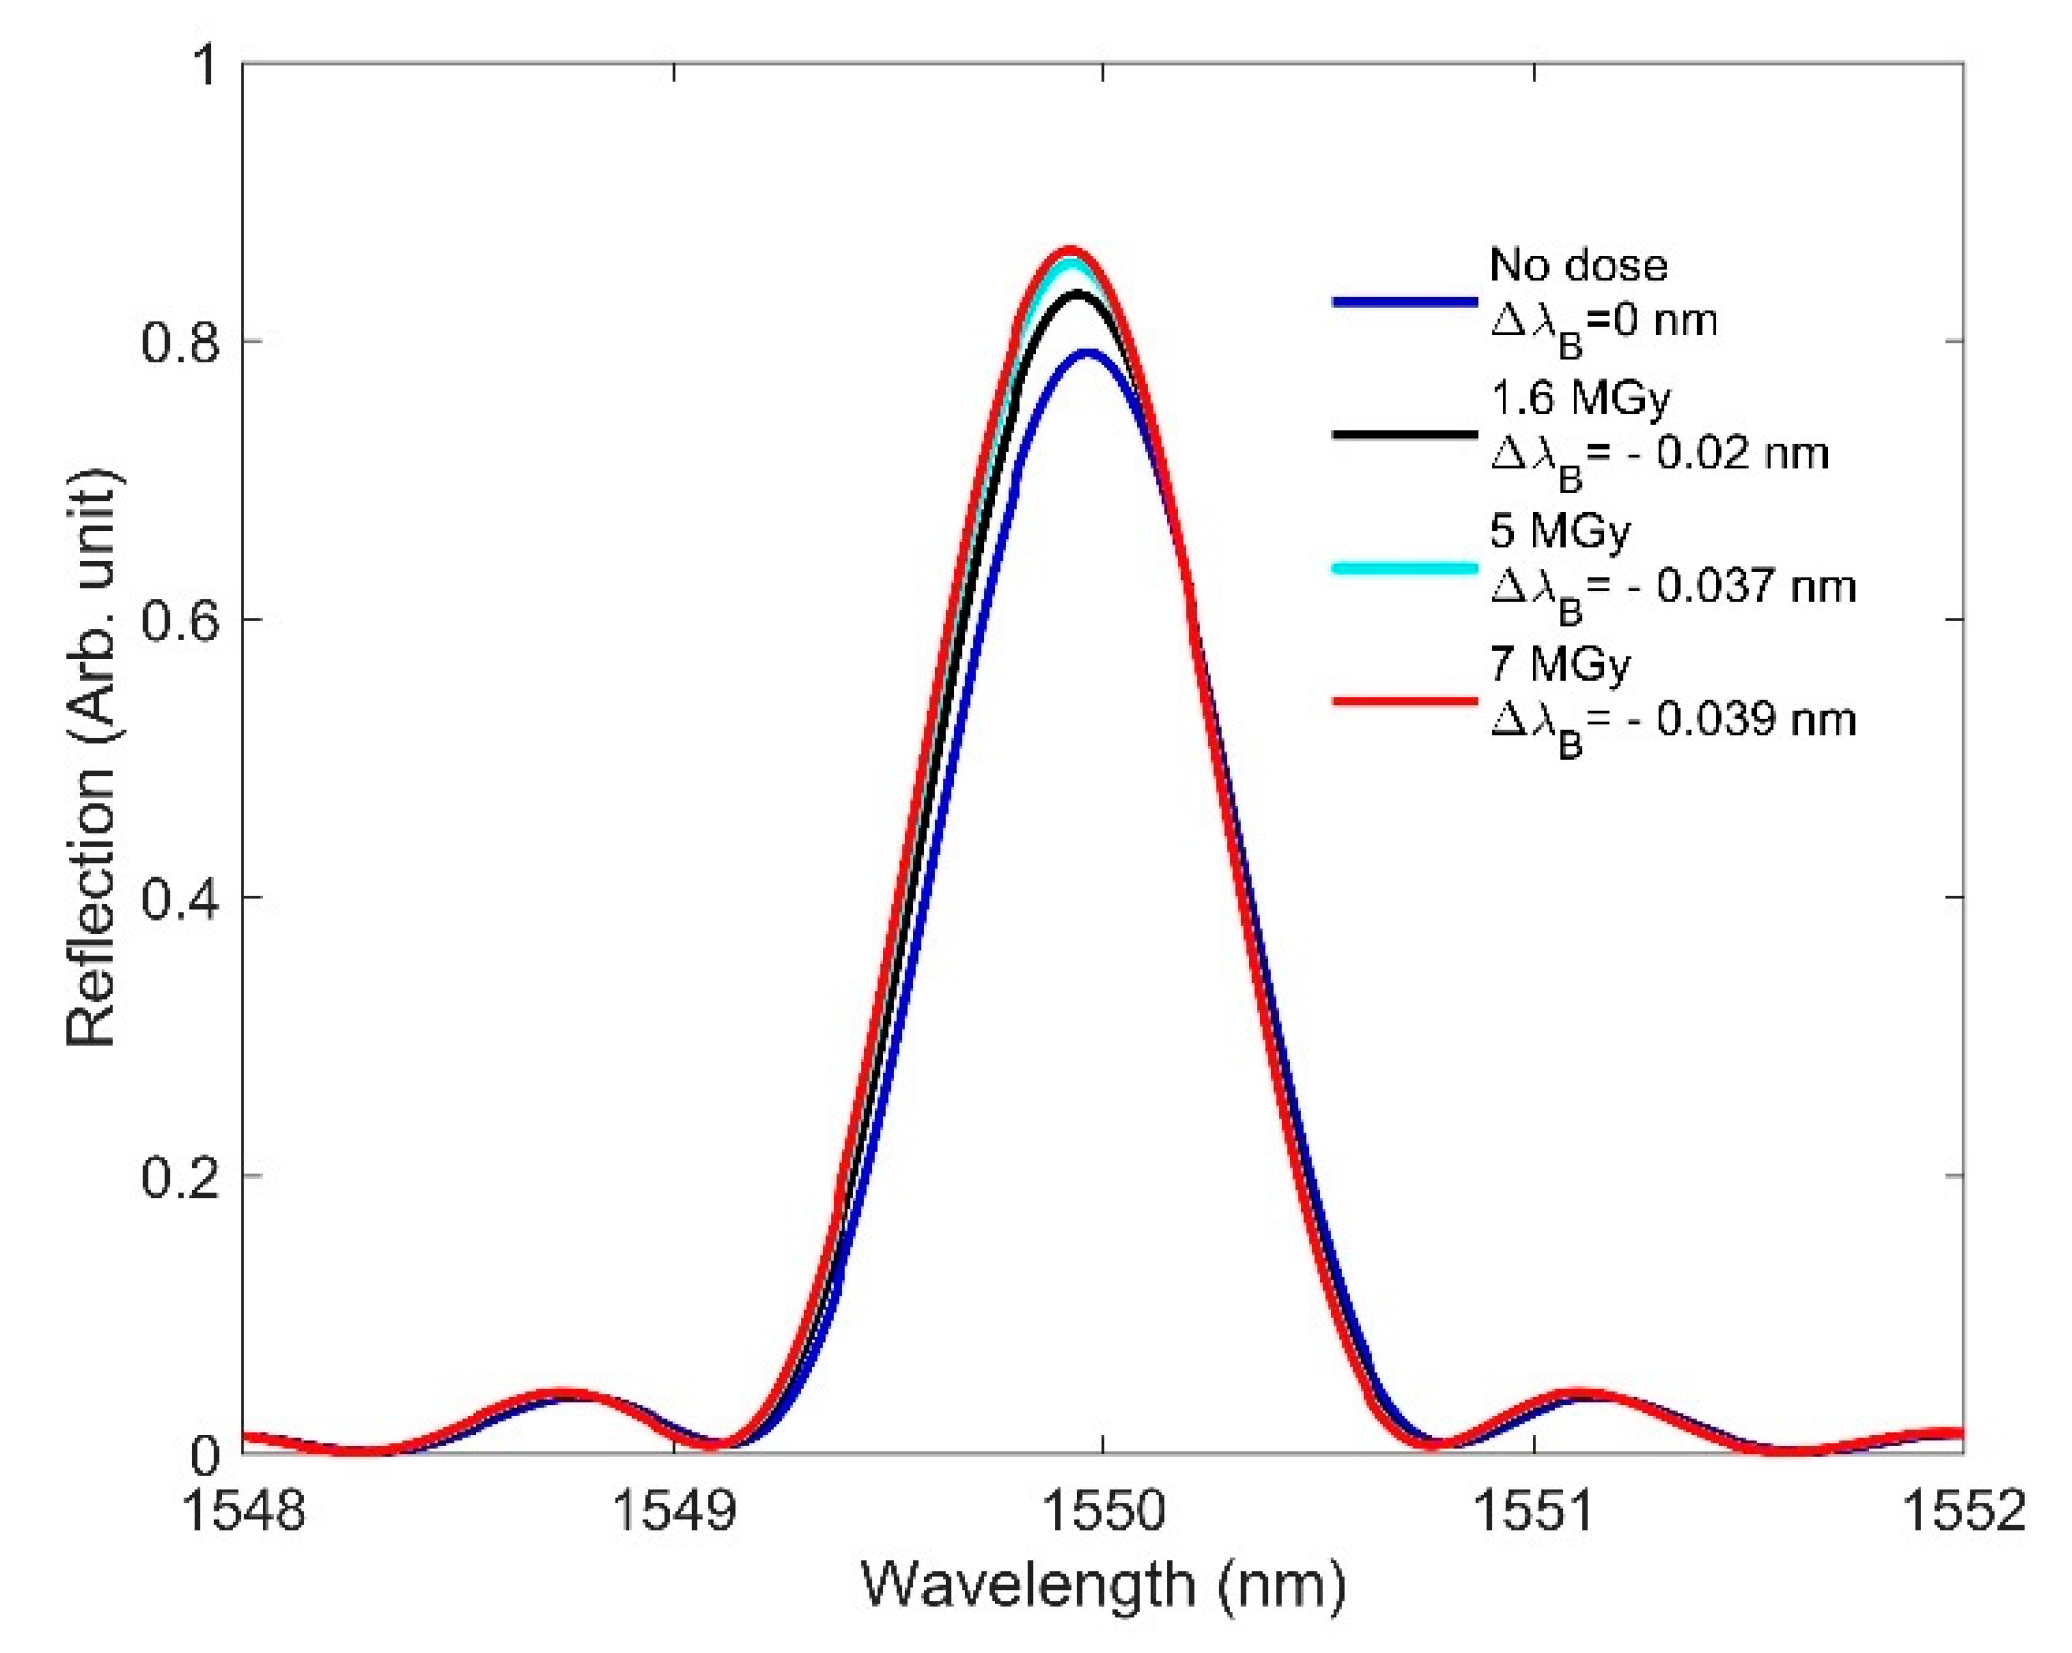
The effects of RIC on the FBG spectra at high doses, which are similar to those observed at low doses, are shown in Figure 12, wherein, as is consistent with earlier observation, we see a significant blueshift in the Bragg wavelength when increasing the dose from 0 to 7 MGy. As the radiation-induced changes in length compaction and RI are significant at high doses, the Bragg wavelength shows a large blueshift of 0.039 nm. At high doses, the length compaction effects on the Bragg wavelength completely dominate the RI effect by producing a blueshift.
4.2. RIC Effects on LPG
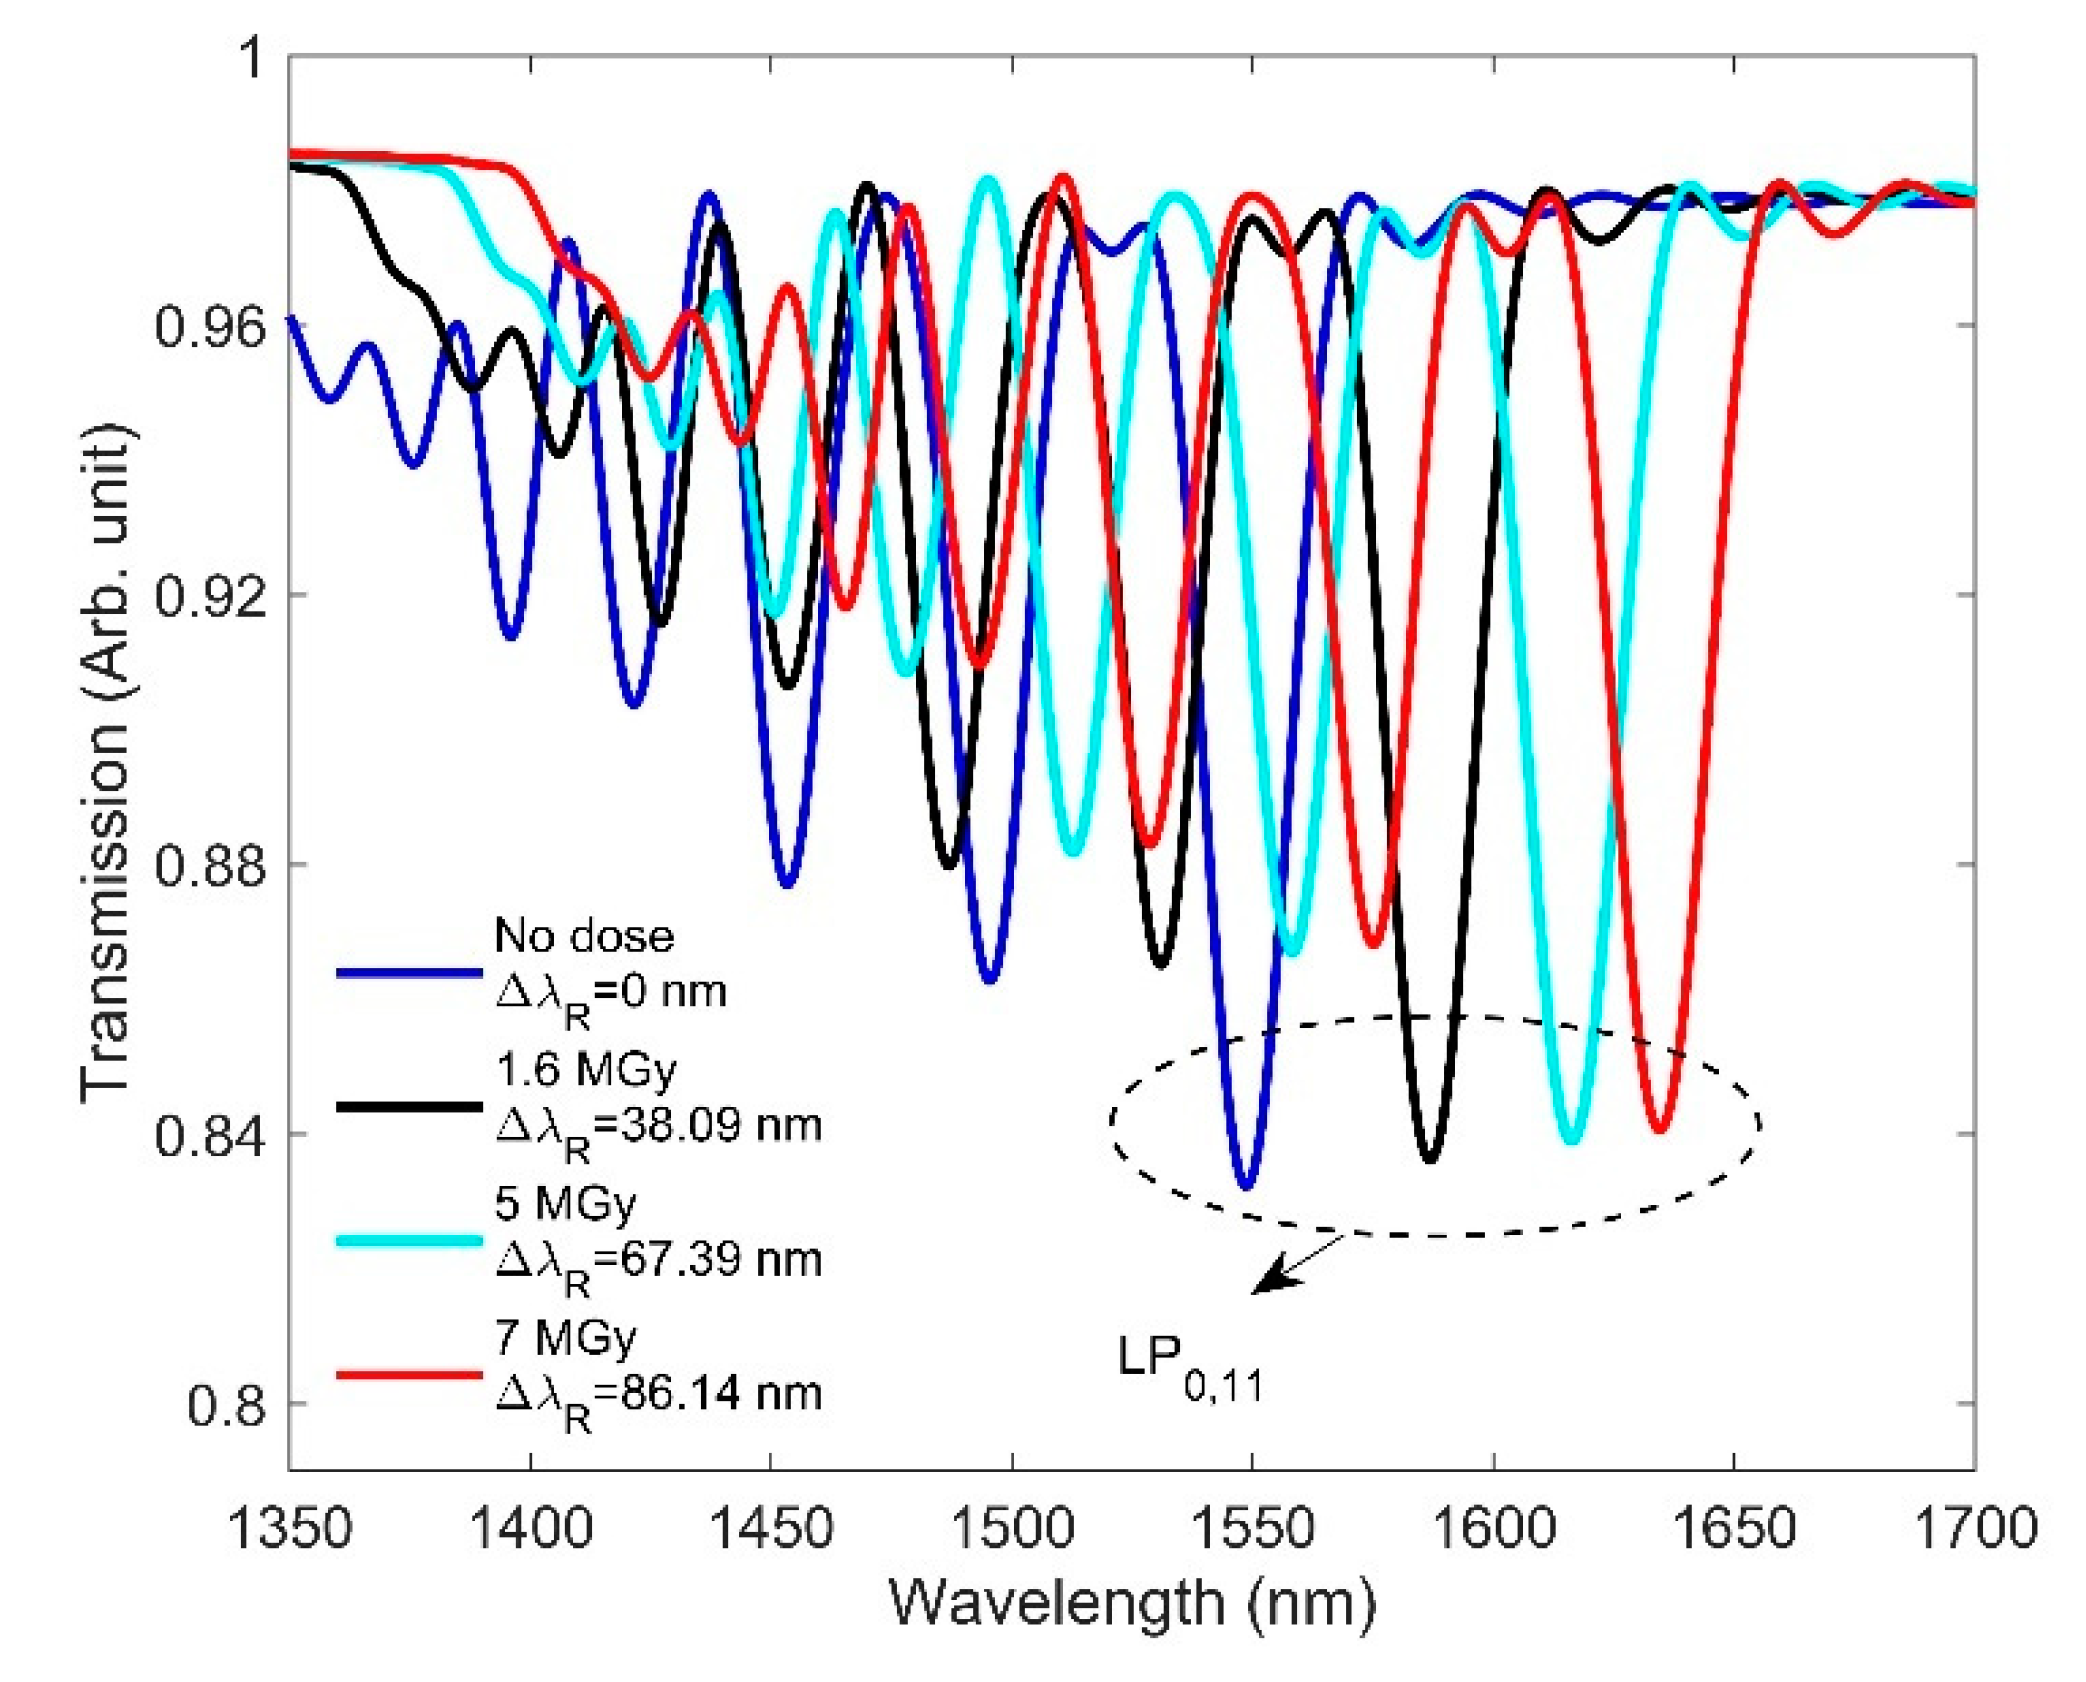
The effect of RIC on LPG at high doses is shown in Figure 13. It is seen that, as the dose increases from 0 to 7 MGy, the resonance wavelength shifts significantly towards longer wavelengths. As mentioned in Section 3.2, a small radiation-induced RI change creates a large effective RI difference () between the core and cladding modes. Table 4 shows that the radiation-induced RI change is large enough to produce a 86.14 nm redshift of the resonance wavelength at a dose of 7 MGy. Although the radiation-induced length compaction is large at high doses, it has little effect on the resonance wavelength shift. This is because, compared to the grating period of the designed LPG, it is still very small. For a better understanding of how radiation affects LPG, it is important to consider the RI change in the coupled cladding modes from the phase matching curve in order to correct the excessive shift of the resonance wavelength [42].
4.3. RIC Effects on F-P
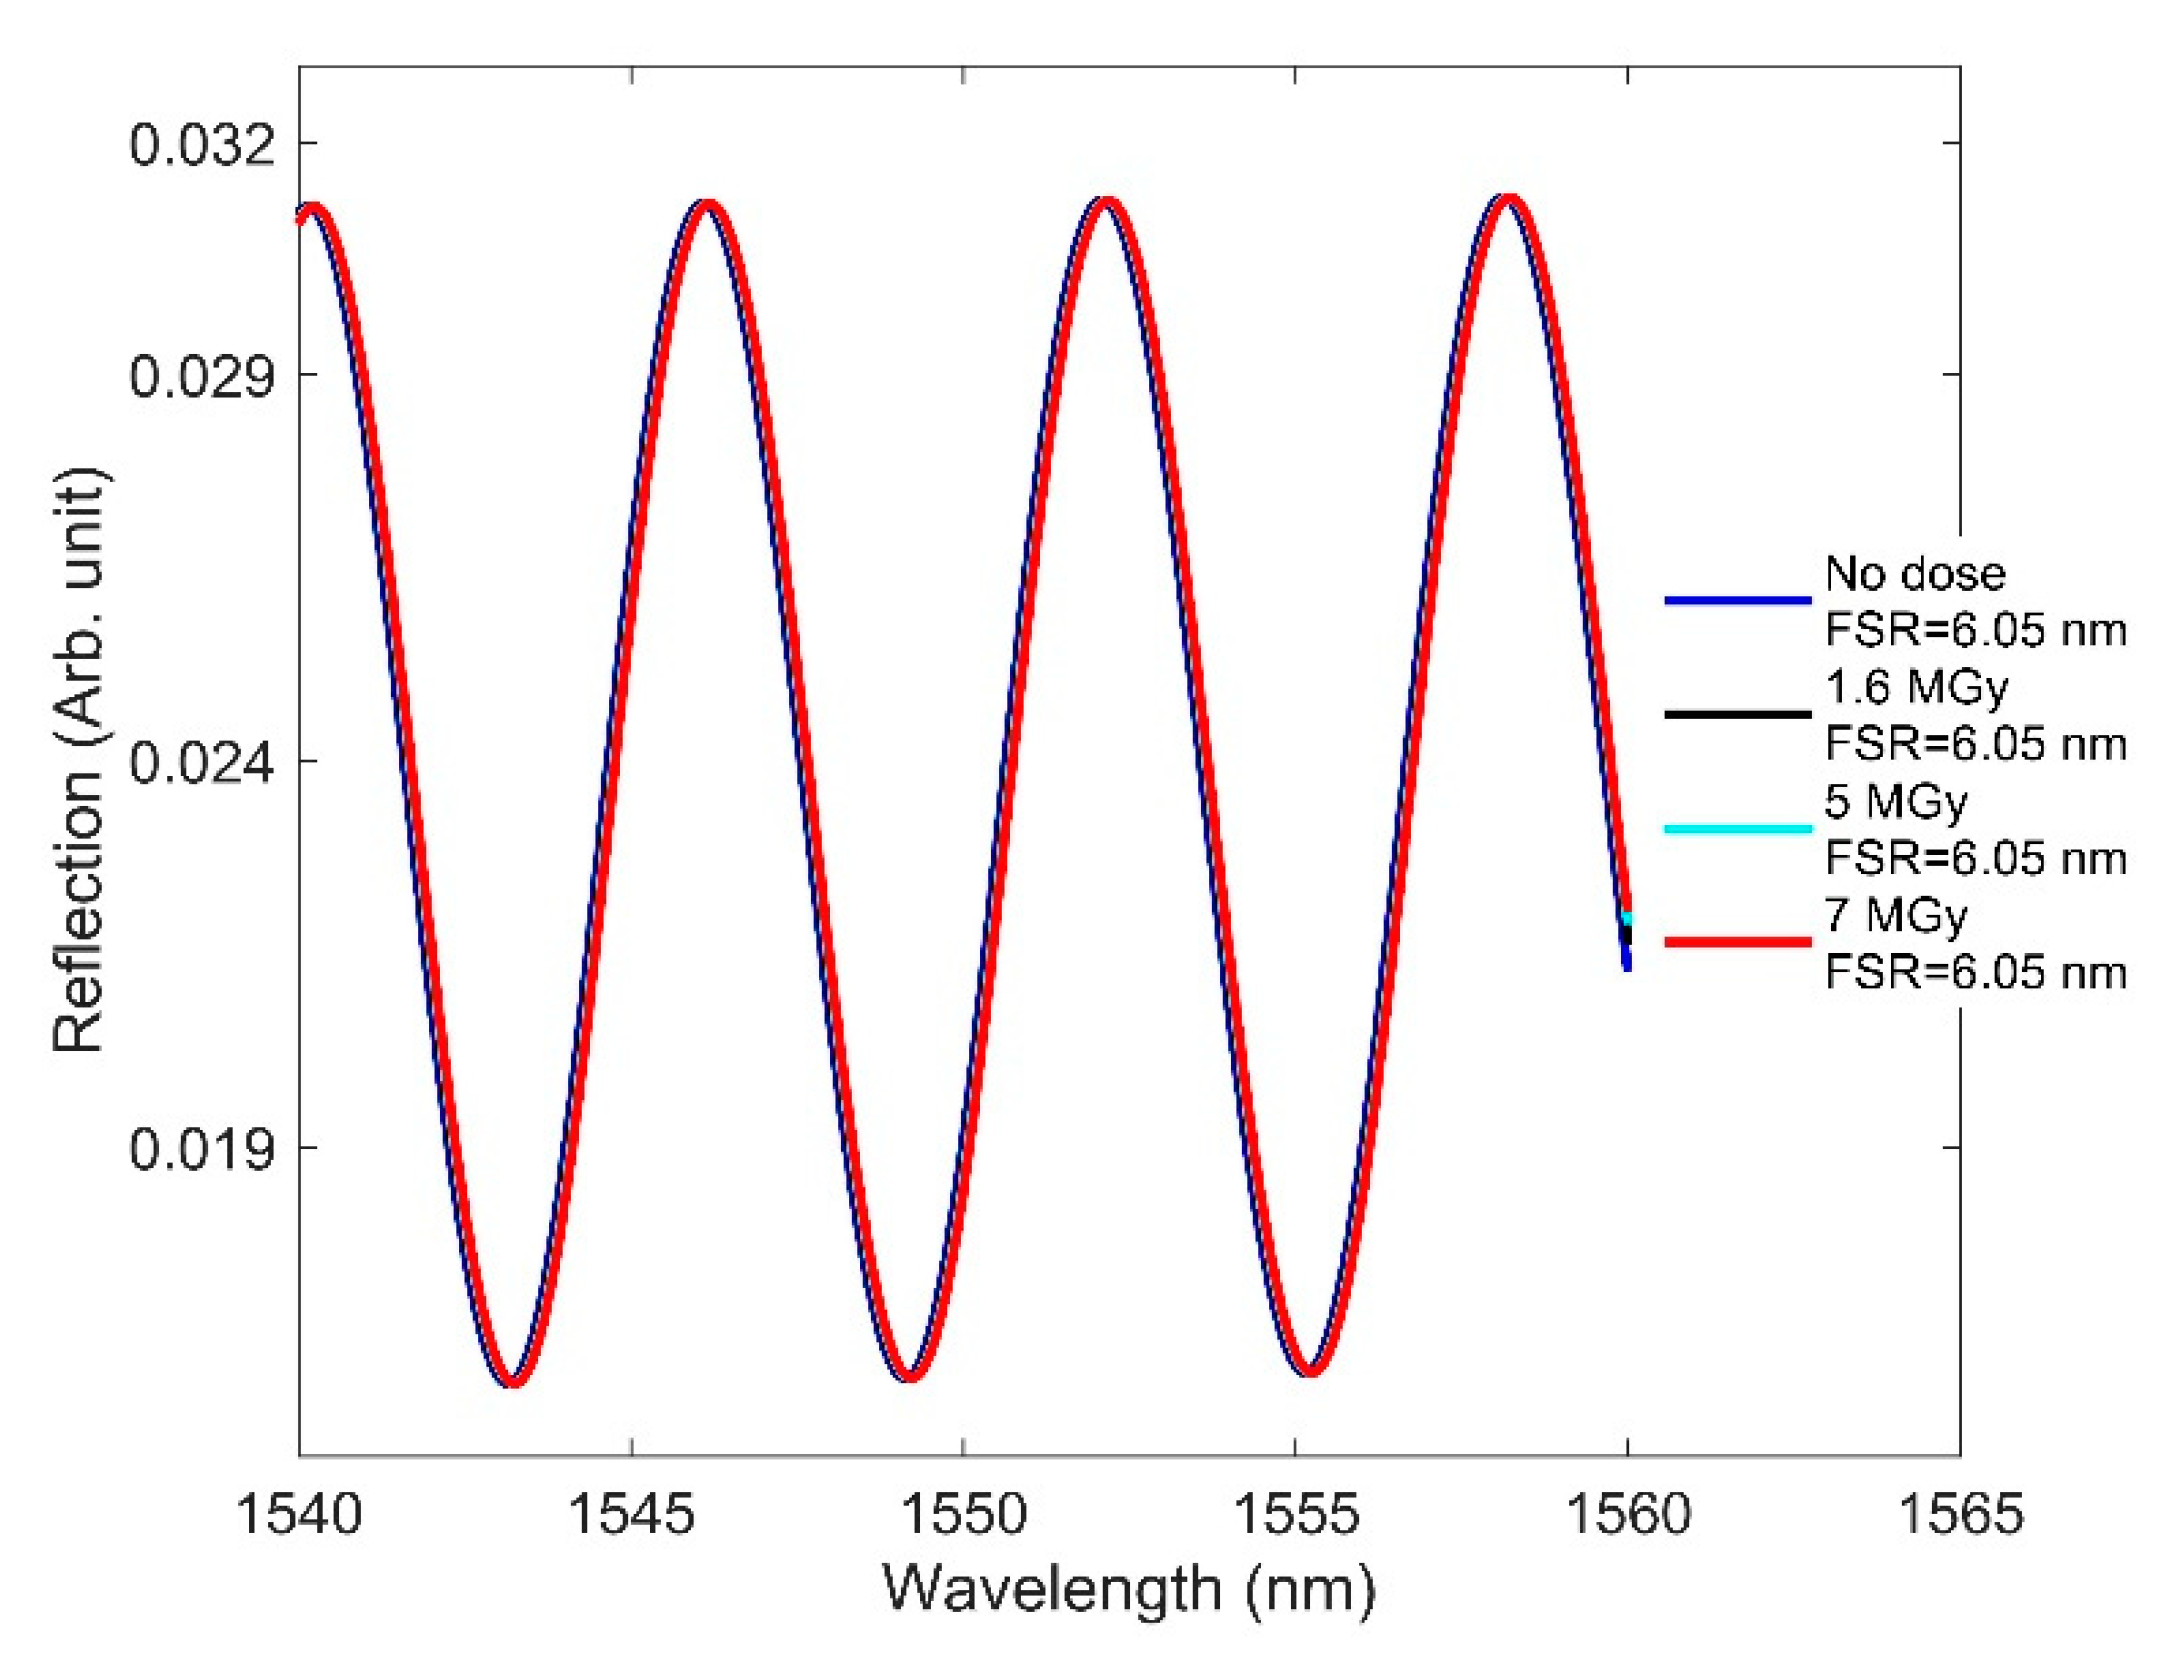
The effect of RIC on the spectrum of the F-P interferometer at high doses is shown in Figure 14. Even at high doses, no change of fringe spacing can be observed. As the exposed length utilized to observe the compaction effect was only 50 µm in our designed F-P sensor, the radiation-induced length compaction remains very small compared to the cavity length of 200 µm. The cavity length will change significantly—and hence the FSR as well—if the length exposed to the radiation is large and the compaction is assessed using that large length.
4.4. RIC-Induced Temperature Error
The temperature sensitivities of SMF-28-based FBG and LPG sensors are 10 and 92 pm/°C, respectively [9,16,29,31]. For F-P sensors, depending on their structure, the sensitivity can differ: 13.6 pm/°C [43], 1.56 and 1.87 nm/°C [44], 5.2 nm/°C [45], and 11.86 and 19.55 nm/°C [46]. Radiation-induced shift in wavelength of fiber sensors causes temperature error if these sensors are used for temperature sensing. Table 5 shows the temperature errors of these three types of sensors at different doses. Please note that the temperature error for the F-P sensor was calculated by considering the lowest sensitivity of 13.6 pm/°C. We observe that, in LPG, a small change in core RI due to radiation induces a significant wavelength shift and hence the radiation-induced temperature error, most probably as a result of not considering the radiation-induced RI change of the coupled cladding modes. For FBG and F-P, even at high doses the radiation-induced temperature error is quite small, as is acceptable in nuclear environments. We calculated errors based on the wavelength shift for all sensors. While the maximum error in temperature measurement for FBG is 3.9 °C, it is only 0 °C for F-P. Based on the wavelength shifts of the three types of sensors, the F-P sensor seems to show the most radiation-resistant response under high-radiation environments, both at low and high doses.
5. RIA Effects on OFSs
In this section, we present the independent effect of RIA on the three types of OFS. RIA darkens fibers under radiation environments, and is heavily dependent upon dopants and defects [3,16,17]. Each different fiber composition will produce a different RIA effect. However, the overall trends remain consistent for any type of fiber. The RIA values obtained in [47,48] are shown in Table 6, and these were used when designing sensors in FIMMWAVE. To compute the effect of RIA, we inserted into our sample FBG, LPG, and F-P models (discussed in Section 2) the loss values from Table 6, as obtained from [47,48]. To observe how RIA affects FBG and F-P, we assumed that a 5-m length of fiber was exposed to radiation.
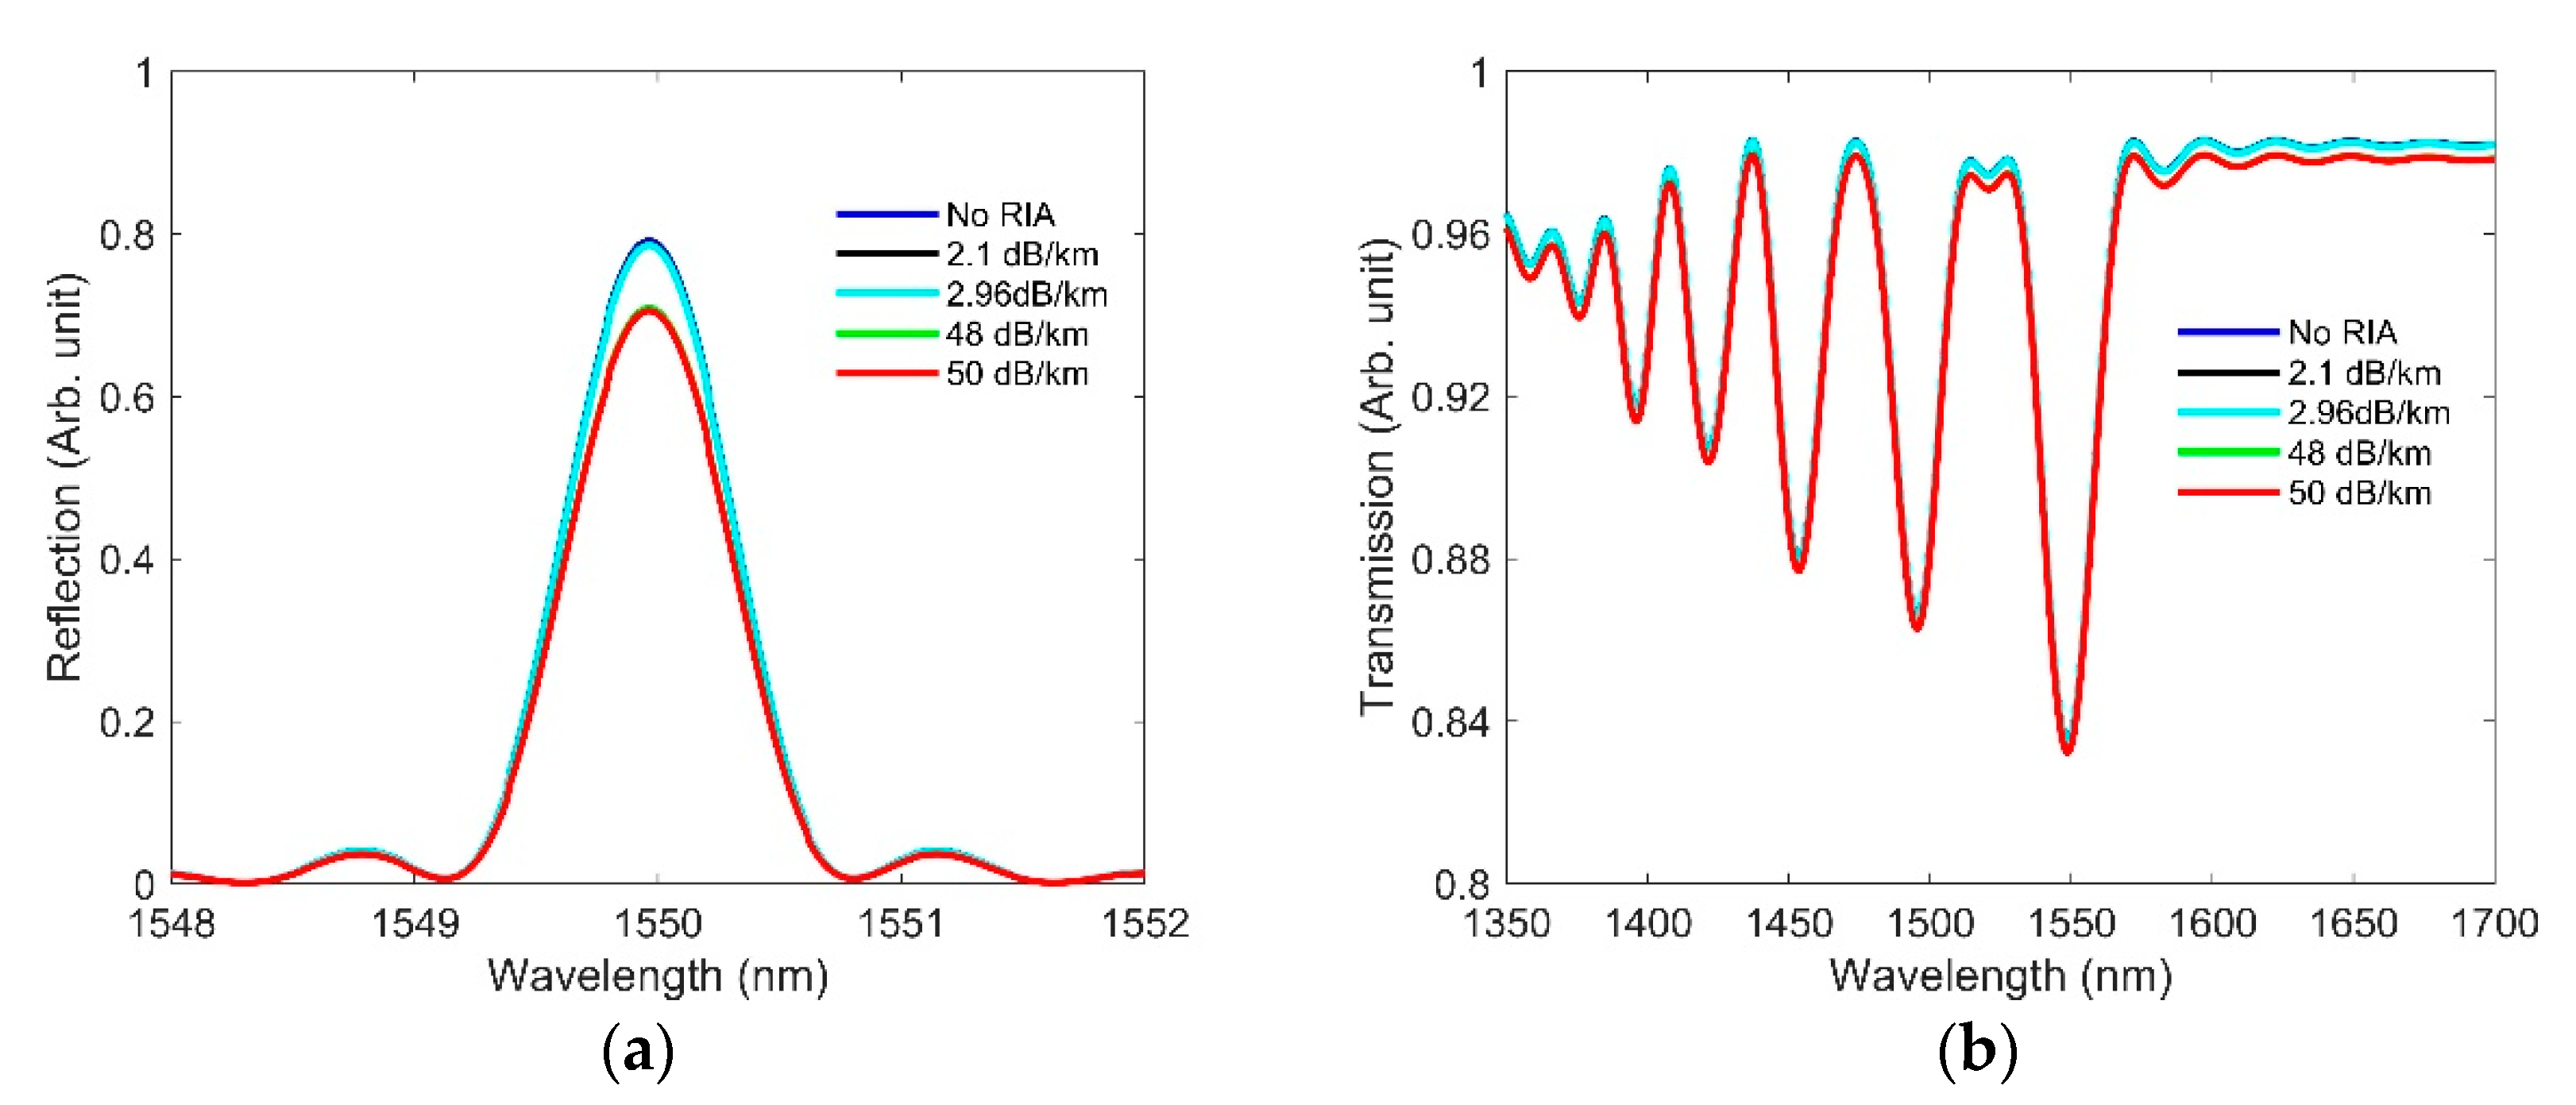
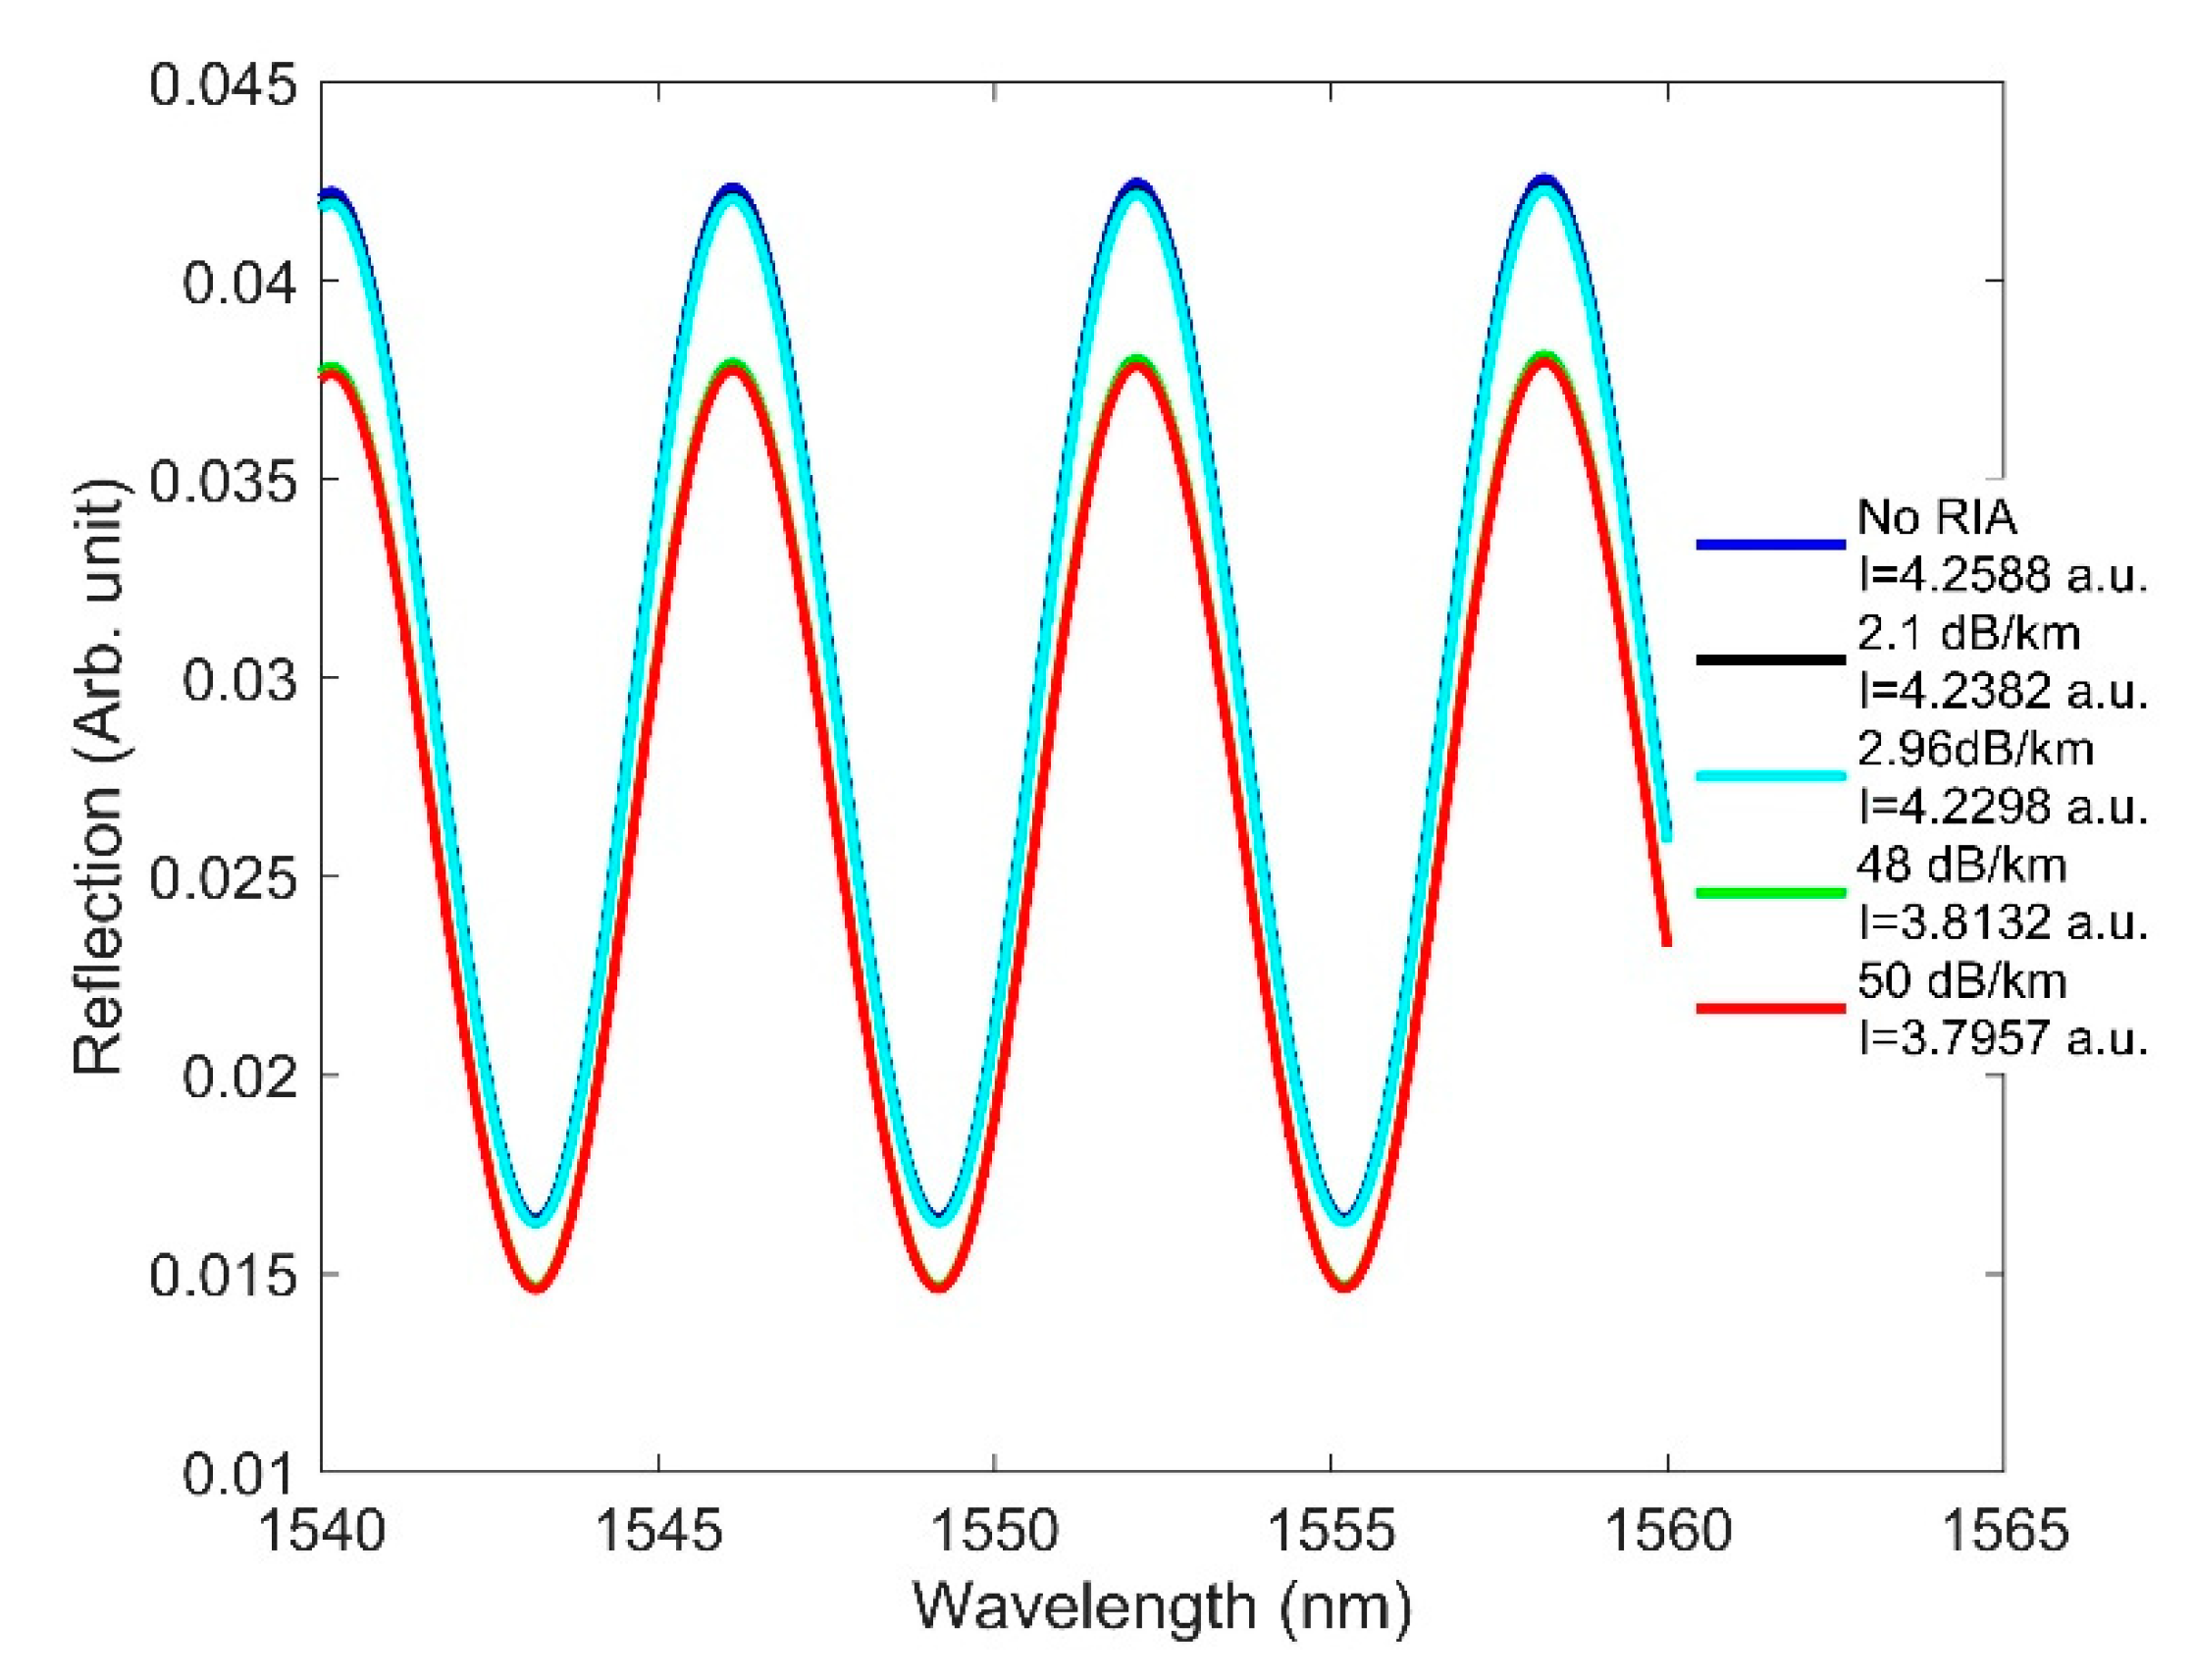
The intensity was then calculated using different radiation values for these sensors. The RIA effects on the three types of sensors are shown in Figure 15 and Figure 16. The amplitude of the reflected light in FBG (Figure 15a) and F-P (Figure 16) is seen to reduce with increasing RIA, as expected. The LPG sensor responded to increasing RIA with a larger dip in its transmitted spectrum (improved contrast), whereas no change in contrast occurred for FBG and F-P as a result of RIA. We believe this is because the sensor lengths for FBG and F-P are very small compared to that of LPG. In the case of FBG, there was no contrast variation, since RIA affects the Bragg and sidelobe peaks equally. It is also apparent from Figure 15 and Figure 16 that RIA only reduces the signal strength, without affecting the resonance wavelength position. Future work is needed to include the effects of both RIC and RIA and compare them against experimental results.
6. Conclusions
The RIC effects on the three types of OFS have been explored at both low and high doses. We modeled the base design for the three types of OFS and plotted their corresponding spectra under no-dose conditions. Next, we showed numerically how a radiation-induced change in RI and length affect the spectra of sensors at doses of up to 1540 kGy. Upon observation of wavelength shift due to radiation, FBG, LPG, and F-P showed a wavelength shift of 0.02, 37.5, and 0 nm at a dose of 1540 kGy, which corresponded to a temperature errors of 2°, 407°, and 0 °C, respectively. The temperature errors indicated that the F-P sensor has a radiation-insensitive response among the three discussed resonance-based sensors. Next, we calculated the change in density, RI, and linear compaction at high doses based on the values at low doses using power law equation. Then, the calculated values were used in our model to study the effects of RIC at up to 7 MGy. Even at high doses, the F-P sensor showed no shift of wavelength and hence no error in temperature measurement, making it the best candidate for a nuclear environment, followed by FBG and then LPG.
Author Contributions
Conceptualization, S.R. and N.K.; methodology, S.R., H.S., and N.K.; software, S.R.; validation, S.R., H.S. and N.K.; formal analysis, S.R., H.S. and N.K.; investigation, S.R., H.S., A.F. and N.K.; resources, S.R.; data curation, S.R.; writing—original draft preparation, S.R.; writing—review and editing, H.S., A.F. and N.K.; visualization, S.R., H.S., A.F. and N.K.; supervision, H.S. and N.K.; project administration, N.K.; funding acquisition, N.K. All authors have read and agreed to the published version of the manuscript.
Funding
This work was supported in part through the Department of Energy Advanced Sensors and Instrumentation program under DOE Idaho Operations Office Contract DE-AC07-05ID14517. The views and opinions of authors expressed herein do not necessarily state or reflect those of the U.S. Government or any agency thereof.
Institutional Review Board Statement
Not applicable.
Informed Consent Statement
Not applicable.
Data Availability Statement
Not applicable.
Conflicts of Interest
The authors declare no conflict of interest.
References
- Pioro, I.; Duffey, R. Nuclear power as a basis for future electricity generation. J. Nucl. Eng. Rad. Sci. 2015, 1, 011001. [Google Scholar] [CrossRef]
- Lake, J.A.; Bennett, R.G.; Kotek, J.F. Next generation nuclear power. Sci. Am. 2002, 286, 72–81. [Google Scholar] [CrossRef]
- Girard, S.; Kuhnhenn, J.; Gusarov, A.; Brichard, B.; Van Uffelen, M.; Ouerdane, Y.; Boukenter, A.; Marcandella, C. Radiation effects on silica-based optical fibers: Recent advances and future challenges. IEEE Trans. Nucl. Sci. 2013, 60, 2015–2036. [Google Scholar] [CrossRef]
- Bagatin, M.; Gerardin, S.; Gerardin, S. Ionizing Radiation Effects in Electronics: From Memories to Imagers, 1st ed.; CRC Press Taylor and Francis: Boca Raton, FL, USA, 2015. [Google Scholar]
- Girard, S.; Morana, A.; Ladaci, A.; Robin, T.; Mescia, L.; Bonnefois, J.-J.; Boutillier, M.; Mekki, J.; Paveau, A.; Cadier, B.; et al. Recent advances in radiation-hardened fiber-based technologies for space applications. J. Opt. 2018, 20, 093001. [Google Scholar] [CrossRef] [Green Version]
- Girard, S.; Alessi, A.; Richard, N.; Martin-Samos, L.; De Michele, V.; Giacomazzi, L.; Agnello, S.; Francesca, D.D.; Morana, A.; Winkler, B.; et al. Overview of radiation induced point defects in silica-based optical fibers. Rev. Phys. 2019, 4, 100032. [Google Scholar] [CrossRef]
- Berghmans, F.; Brichard, B.; Fernandez, A.F.; Gusarov, A.; Uffelen, M.V.; Girard, S. An introduction to radiation effects on optical components and fiber optic sensors. In NATO Science for Peace and Security Series; Bock, W.J., Gannot, I., Tanev, S., Eds.; Springer: Dordrecht, The Netherlands, 2008; pp. 127–165. [Google Scholar]
- Gusarov, A.; Hoeffgen, S.K. Radiation effects on fiber gratings. IEEE Trans. Nucl. Sci. 2013, 60, 2037–2053. [Google Scholar] [CrossRef]
- Morana, A.; Girard, S.; Marin, E.; Marcandella, C.; Paillet, P.; Périsse, J.; Macé, J.-R.; Boukenter, A.; Cannas, M.; Ouerdane, Y. Radiation tolerant fiber Bragg gratings for high temperature monitoring at MGy dose levels. Opt. Lett. 2014, 39, 5313–5316. [Google Scholar] [CrossRef] [Green Version]
- Zaghloul, M.A.S.; Wang, M.; Huang, S.; Hnatovsky, C.; Grobnic, D.; Mihailov, S.; Li, M.-J.; Carpenter, D.; Hu, L.-W.; Daw, J.; et al. Radiation resistant fiber Bragg grating in random air-line fibers for sensing applications in nuclear reactor cores. Opt. Express 2018, 26, 11775–11786. [Google Scholar] [CrossRef] [Green Version]
- Esposito, F.; Srivastava, A.; Iadicicco, A.; Campopiano, S. Multi-parameter sensor based on single long period grating in panda fiber for the simultaneous measurement of sri, temperature and strain. Opt. Laser Technol. 2019, 113, 198–203. [Google Scholar] [CrossRef]
- Esposito, F.; Stăncălie, A.; Neguţ, D.; Iadicicco, A.; Sporea, D.; Campopiano, S. Response of long period gratings to gamma and neutron-gamma radiations. In Proceedings of the Seventh European Workshop on Optical Fibre Sensors, Limassol, Cyprus, 1–4 October 2019; International Society for Optics and Photonics: Bellingham, WA, USA; p. 111990B. [Google Scholar]
- Stancălie, A.; Esposito, F.; Ranjan, R.; Bleotu, P.; Campopiano, S.; Iadicicco, A.; Sporea, D. Arc-induced long period gratings in standard and speciality optical fibers under mixed neutron-gamma irradiation. Sci. Rep. 2017, 7, 15845. [Google Scholar] [CrossRef] [Green Version]
- Cheymol, G.; Villard, J.F.; Gusarov, A.; Brichard, B. Fibre optic extensometer for high radiation and high temperature nuclear applications. IEEE Trans. Nucl. Sci. 2013, 60, 3781–3784. [Google Scholar] [CrossRef]
- Cheymol, G.; Gusarov, A.; Gaillot, S.; Destouches, C.; Caron, N. Dimensional measurements under high radiation with optical fibre sensors based on white light interferometry—Report on irradiation tests. IEEE Trans. Nucl. Sci. 2014, 61, 2075–2081. [Google Scholar] [CrossRef]
- Morana, A. Gamma-Rays and Neutrons Effects on Optical Fibers and Bragg Gratings for Temperature Sensors, Université Jean Monnet—Saint-Etienne; Università degli studi di Palermo: Palerme, Italy, 2013. [Google Scholar]
- Cheymol, G.; Remy, L.; Gusarov, A.; Kinet, D.; Mégret, P.; Laffont, G.; Blanchet, T.; Morana, A.; Marin, E.; Girard, S. Study of fiber Bragg grating samples exposed to high fast neutron fluences. IEEE Trans. Nucl. Sci. 2018, 65, 2494–2501. [Google Scholar] [CrossRef]
- Kher, S.; Chaubey, S.; Oak, S.M.; Gusarov, A. Measurement of γ-radiation induced refractive index changes in B/Ge doped fiber using LPGs. IEEE Photon. Technol. Lett. 2013, 25, 2070–2073. [Google Scholar] [CrossRef]
- Primak, W.; Kampwirth, R. The radiation compaction of vitreous silica. J. Appl. Phys. 1968, 39, 5651–5658. [Google Scholar] [CrossRef]
- Lell, E.; Kreidl, N.J.; Hensler, J.R. Radiation effects in quartz, silica, and glasses. In Progress in Ceramic Science; Burke, J.E., Ed.; Pergamon Press, Inc.: New York, NY, USA, 1966; Volume 4, pp. 1–93. [Google Scholar]
- Girard, S.; Marcandella, C.; Morana, A.; Perisse, J.; Di Francesca, D.; Paillet, P.; Macé, J.-R.; Boukenter, A.; Léon, M.; Gaillardin, M.; et al. Combined high dose and temperature radiation effects on multimode silica-based optical fibers. IEEE Trans. Nucl. Sci. 2013, 60, 4305–4313. [Google Scholar] [CrossRef]
- Cheymol, G.; Long, H.; Villard, J.F.; Brichard, B. High Level Gamma and Neutron Irradiation of Silica Optical Fibers in CEA OSIRIS Nuclear Reactor. IEEE Trans. Nucl. Sci. 2008, 55, 2252–2258. [Google Scholar] [CrossRef]
- Mode Solvers for Optical Waveguides–FIMMWAVE. Available online: https://www.photond.com/products/fimmwave/fimmwave_features_20.htm (accessed on 16 January 2021).
- Optical Fiber. Available online: https://en.wikipedia.org/wiki/Optical_fiber (accessed on 31 May 2021).
- Berghmans, F.; Fernandez, A.F.; Brichard, B.; Vos, F.; Decreton, M.C.; Gusarov, A.I.; Deparis, O.; Megret, P.; Blondel, M.; Caron, S.; et al. Radiation hardness of fiber optic sensors for monitoring and remote handling applications in nuclear environments. In Process Monitoring with Optical Fibers and Harsh Environment Sensors; Marcus, M.A., Wang, A., Eds.; SPIE: Bellingham, WA, USA, 1999; Volume 3538, pp. 28–39. [Google Scholar]
- Remy, L.; Cheymol, G.; Gusarov, A.; Morana, A.; Marin, E.; Girard, S. Compaction in optical fibres and fibre Bragg gratings under nuclear reactor high neutron and gamma fluence. IEEE Trans. Nucl. Sci. 2016, 63, 2317–2322. [Google Scholar] [CrossRef]
- Werneck, M.M.; Allil, R.C.S.B.; Ribeiro, B.A.; De Nazaré, F.V.B. A guide to fiber Bragg grating sensors. In Current Trends in Short- and Long-Period Fiber Gratings; InTech: Rijeka, Croatia, 2013; pp. 1–24. [Google Scholar]
- Esposito, F.; Stăncălie, A.; Neguţ, C.-D.; Campopiano, S.; Sporea, D.; Iadicicco, A. Comparative investigation of gamma radiation effects on long period gratings and optical power in different optical fibers. J. Lightw. Technol. 2019, 37, 4560–4566. [Google Scholar] [CrossRef]
- Bhatia, V. Properties and Sensing Applications of Long-Period Gratings; Virginia Tech: Blacksburg, VA, USA, 1996. [Google Scholar]
- James, S.W.; Tatam, R.P. Optical fibre long-period grating sensors: Characteristics and application. Meas. Sci. Technol. 2003, 14, R49–R61. [Google Scholar] [CrossRef] [Green Version]
- Bhatia, V. Applications of long-period gratings to single and multi-parameter sensing. Opt. Express 1999, 4, 457–466. [Google Scholar] [CrossRef]
- Hromadka, J.; Korposh, S.; Partridge, M.C.; James, S.W.; Davis, F.; Crump, D.; Tatam, R.P. Multi-parameter measurements using optical fibre long period gratings for indoor air quality monitoring. Sens. Actuators B Chem. 2017, 244, 217–225. [Google Scholar] [CrossRef]
- Erdogan, T. Cladding-mode resonances in short- and long-period fiber grating filters. J. Opt. Soc. Am. A 1997, 14, 1760–1773. [Google Scholar] [CrossRef]
- Cheymol, G.; Brichard, B.; Villard, J.F. Fiber optics for metrology in nuclear research reactors—Applications to dimensional measurements. IEEE Trans. Nucl. Sci. 2011, 58, 1895–1902. [Google Scholar] [CrossRef]
- Berruti, G.M.; Vaiano, P.; Quero, G.; Pimentel Das Neves, T.F.; Boniello, A.; Consales, M.; Petagna, P.; Cusano, A. Analysis of Uncoated LPGs Written in B-Ge Doped Fiber under Proton Irradiation for Sensing Applications at CERN. Sci Rep 2020, 10, 1344. [Google Scholar] [CrossRef] [PubMed]
- Petrie, C.M.; Birri, A.; Blue, T.E. High-dose temperature-dependent neutron irradiation effects on the optical transmission and dimensional stability of amorphous fused silica. J. Non Cryst. Solids 2019, 525, 119668. [Google Scholar] [CrossRef]
- Piao, F.; Oldham, W.G.; Haller, E.E. The mechanism of radiation-induced compaction in vitreous silica. J. Non Cryst. Solids 2000, 276, 61–71. [Google Scholar] [CrossRef]
- Tomashuk, A.L.; Zabezhailov, M.O. Formation Mechanisms of Precursors of Radiation-Induced Color Centers during Fabrication of Silica Optical Fiber Preform. J. Appl. Phys. 2011, 109, 083103. [Google Scholar] [CrossRef]
- Gusarov, A.I.; Berghmans, F.; Fernandez, A.F.; Deparis, O.; Defosse, Y.; Starodubov, D.; Decreton, M.; Megret, P.; Bondel, M. Behavior of Fibre Bragg Gratings under High Total Dose Gamma Radiation. IEEE Trans. Nucl. Sci. 2000, 47, 688–692. [Google Scholar] [CrossRef] [Green Version]
- Brichard, B.; Butov, O.V.; Golant, K.M.; Fernandez Fernandez, A. Gamma Radiation-Induced Refractive Index Change in Ge- and N-Doped Silica. J. Appl. Phys. 2008, 103, 054905. [Google Scholar] [CrossRef] [Green Version]
- Kniazewski, P.; Kujawinska, M.; Berghmans, F.; Fernandez, A.; Goussarov, A.; Uffelen, M.V. Application of the Microinterferometric Tomography Setup to the Reliability Tests of the Fiber Sensors Exposed to Cumulated Gamma Radiation. In Proceedings of the Nano- and Micro-Metrology, Munich, Germany, 29 August 2005; Volume 5858, p. 585805. [Google Scholar]
- Wong, R.Y.-N.; Juan, D.H.J.; Ibsen, M.; Shum, P.P. Optical fibre long-period grating sensors operating at and around the phase matching turning point. In Applications of Optical Fibers for Sensing; InTech: Rijeka, Croatia, 2019. [Google Scholar]
- Chen, Z.; Xiong, S.; Gao, S.; Zhang, H.; Wan, L.; Huang, X.; Huang, B.; Feng, Y.; Liu, W.; Li, Z. High-temperature sensor based on Fabry-Perot interferometer in microfiber tip. Sensors 2018, 18, 202. [Google Scholar] [CrossRef] [PubMed] [Green Version]
- Li, L.; Feng, Z.; Qiao, X.; Yang, H.; Wang, R.; Su, D.; Wang, Y.; Bao, W.; Li, J.; Shao, Z.; et al. Ultrahigh sensitive temperature sensor based on Fabry–Pérot interference assisted by a graphene diaphragm. IEEE Sens. J. 2015, 15, 505–509. [Google Scholar] [CrossRef]
- Zhang, G.; Yang, M.; Wang, M. Large Temperature sensitivity of fiber-optic extrinsic Fabry–Perot interferometer based on polymer-filled glass capillary. Opt. Fiber Technol. 2013, 19, 618–622. [Google Scholar] [CrossRef]
- Wang, F.; Liu, Y.; Lu, Y.; Zhang, L.; Ma, J.; Wang, L.; Sun, W. High-sensitivity Fabry-Perot interferometer temperature sensor probe based on liquid crystal and the vernier effect. Opt. Lett. 2018, 43, 5355–5358. [Google Scholar] [CrossRef] [PubMed]
- Ott, M.N. Radiation effects data on commercially available optical fiber: Database summary. In Proceedings of the IEEE Radiation Effects Data Workshop, Phoenix, AZ, USA, 15–19 July 2002; pp. 24–31. [Google Scholar]
- Van Uffelen, M.; Berghmans, F.; Brichard, B.; Vos, F.; Decreton, M.; Nowodzinski, A.; Lecompte, J.-C.; Le Neve, F.; Jucker, P. Long-term prediction of radiation induced losses in single mode optical fibers exposed to gamma rays using a pragmatic approach. In Proceedings of the 2000 IEEE Radiation Effects Data Workshop. Workshop Record. Held in conjunction with IEEE Nuclear and Space Radiation Effects Conference (Cat. No.00TH8527), Reno, NV, USA, 24–28 July 2000; pp. 80–84. [Google Scholar]
Figure 1.
(a) FBG schematic, where ,, and are the RIs of the core, cladding, and grating period, respectively; (b) the reflection spectrum of the designed FBG for = 0.5353 µm and grating strength (.
Figure 1.
(a) FBG schematic, where ,, and are the RIs of the core, cladding, and grating period, respectively; (b) the reflection spectrum of the designed FBG for = 0.5353 µm and grating strength (.

Figure 2.
(a) LPG schematic, where ,, and are the RIs of the core, cladding, and grating period, respectively; (b) transmission spectrum of the designed LPG for = 348 µm and grating strength (.
Figure 2.
(a) LPG schematic, where ,, and are the RIs of the core, cladding, and grating period, respectively; (b) transmission spectrum of the designed LPG for = 348 µm and grating strength (.

Figure 3.
(a) Schematic of an EFPI, where ,, and are the incoming light, reflected light, and cavity length, respectively; (b) interferometric fringes obtained due to interference within the cavity length = 200 µm.
Figure 3.
(a) Schematic of an EFPI, where ,, and are the incoming light, reflected light, and cavity length, respectively; (b) interferometric fringes obtained due to interference within the cavity length = 200 µm.

Figure 4.
RIC effects on FBG: redshift in the Bragg wavelength from 1550 to 1550.16 nm as the dose is increased from 0 to 1540 kGy, where denotes the Bragg wavelength shift.
Figure 4.
RIC effects on FBG: redshift in the Bragg wavelength from 1550 to 1550.16 nm as the dose is increased from 0 to 1540 kGy, where denotes the Bragg wavelength shift.

Figure 5.
RIC effects on FBG: blueshift in the Bragg wavelength from 1550 to 1549.98 nm as the dose is increased from 0 to 1540 kGy, where denotes the Bragg wavelength shift.
Figure 5.
RIC effects on FBG: blueshift in the Bragg wavelength from 1550 to 1549.98 nm as the dose is increased from 0 to 1540 kGy, where denotes the Bragg wavelength shift.

Figure 6.
RIC effects on the transmission spectrum of the designed LPG along with the resonance wavelength shift ( for the LP0,11 cladding mode when dose is increased from 0 to 1540 kGy.
Figure 6.
RIC effects on the transmission spectrum of the designed LPG along with the resonance wavelength shift ( for the LP0,11 cladding mode when dose is increased from 0 to 1540 kGy.

Figure 7.
RIC effects on the transmission spectrum of the designed LPG along with the resonance wavelength shift ( for the LP0,11 cladding mode when the dose is increased from 0 to 1540 kGy.
Figure 7.
RIC effects on the transmission spectrum of the designed LPG along with the resonance wavelength shift ( for the LP0,11 cladding mode when the dose is increased from 0 to 1540 kGy.

Figure 8.
RIC effects on the interferometric fringes of the designed F-P when the dose is increased from 0 to 1540 kGy, where FSR is the spectral distance between two adjacent fringe peaks for a given radiation.
Figure 8.
RIC effects on the interferometric fringes of the designed F-P when the dose is increased from 0 to 1540 kGy, where FSR is the spectral distance between two adjacent fringe peaks for a given radiation.

Figure 9.
RIC effects on the interferometric fringes of the designed F-P when the dose is increased from 0 to 1540 kGy, where FSR is the spectral distance between two adjacent fringe peaks for a given radiation.
Figure 9.
RIC effects on the interferometric fringes of the designed F-P when the dose is increased from 0 to 1540 kGy, where FSR is the spectral distance between two adjacent fringe peaks for a given radiation.

Figure 10.
Curve fitting for relative density as a function of dose using the values from Table 2.
Figure 10.
Curve fitting for relative density as a function of dose using the values from Table 2.

Figure 11.
Calculated RI with the experimental values at MGy dose.

Figure 12.
RIC effects on FBG at high doses: blueshift of 0.039 nm in the Bragg wavelength when the dose is increased from 0 to 7 MGy and radiation-induced changes in length and RI are considered.
Figure 12.
RIC effects on FBG at high doses: blueshift of 0.039 nm in the Bragg wavelength when the dose is increased from 0 to 7 MGy and radiation-induced changes in length and RI are considered.

Figure 13.
RIC effects on the transmission spectrum of the designed LPG at high doses.

Figure 14.
RIC effects on the interferometric fringes of the designed F-P sensor at high doses.

Figure 15.
Effect of RIA on the spectra of (a) FBG and (b) LPG, using the same design parameters applied earlier.
Figure 15.
Effect of RIA on the spectra of (a) FBG and (b) LPG, using the same design parameters applied earlier.

Figure 16.
Effect of RIA on F-P at various doses, using the same design parameters applied earlier.


Table 1.
Radiation-induced RI changes in a B/Ge codoped fiber reported by Kher et al. Adapted with permission from ref. [18]. Copyright 2013 IEEE.
Table 1.
Radiation-induced RI changes in a B/Ge codoped fiber reported by Kher et al. Adapted with permission from ref. [18]. Copyright 2013 IEEE.
| Dose (kGy) | |
|---|---|
| 6.5 | |
| 10.4 | |
| 102 | |
| 1049 | |
| 1540 |
Table 2.
Calculated values of density and length compaction (based on the RI values) using Equations (3)–(5).
Table 2.
Calculated values of density and length compaction (based on the RI values) using Equations (3)–(5).
| Dose (kGy) | ||||
|---|---|---|---|---|
| 0 | 0 | 0 | 0 | 0 |
| 6.5 | 0.00403 | 0.00403 | 0.00134 | |
| 10.4 | 0.00479 | 0.00479 | 0.00159 | |
| 102 | 0.01152 | 0.01152 | 0.00384 | |
| 1049 | 0.03071 | 0.03069 | 0.01023 | |
| 1540 | 0.03551 | 0.03549 | 0.01183 |
Table 3.
Gamma-radiation-induced RI change in different compositional fibers at MGy dose.
| Type of Fiber | Dose Rate | Total Dose | Refs. | |
|---|---|---|---|---|
| Telecom grade | N/A | 1.6 MGy | Gusarov et al. [39] | |
| SMF-28 | 23 kGy/h | 5 MGy | Kniazewski et al. [41] | |
| Ge, N doped | 20 kGy/h | 7 MGy | Brichard et al. [40] |
Table 4.
Calculated values for higher doses, as obtained by inputting the fitting constant values from Figure 10 into Equation (6).
Table 4.
Calculated values for higher doses, as obtained by inputting the fitting constant values from Figure 10 into Equation (6).
| Dose | ||||
|---|---|---|---|---|
| 1.6 MGy | 0.03589 | 0.03587 | 0.01196 | |
| 5 MGy | 0.05580 | 0.05577 | 0.01859 | |
| 7 MGy | 0.06357 | 0.06353 | 0.02118 |
Table 5.
Radiation-induced temperature errors in FBG, LPG, and F-P sensors at higher doses.
| Dose | Temperature Error | ||
|---|---|---|---|
| FBG | LPG | F-P | |
| 1.6 MGy | 2 °C | 414 °C | 0 |
| 5 MGy | 3.7 °C | 732 °C | 0 |
| 7 MGy | 3.9 °C | 936 °C | 0 |
Publisher’s Note: MDPI stays neutral with regard to jurisdictional claims in published maps and institutional affiliations. |
© 2021 by the authors. Licensee MDPI, Basel, Switzerland. This article is an open access article distributed under the terms and conditions of the Creative Commons Attribution (CC BY) license (https://creativecommons.org/licenses/by/4.0/).
Share and Cite
MDPI and ACS Style
Rana, S.; Subbaraman, H.; Fleming, A.; Kandadai, N. Numerical Analysis of Radiation Effects on Fiber Optic Sensors. Sensors 2021, 21, 4111. https://doi.org/10.3390/s21124111
AMA Style
Rana S, Subbaraman H, Fleming A, Kandadai N. Numerical Analysis of Radiation Effects on Fiber Optic Sensors. Sensors. 2021; 21(12):4111. https://doi.org/10.3390/s21124111
Chicago/Turabian StyleRana, Sohel, Harish Subbaraman, Austin Fleming, and Nirmala Kandadai. 2021. "Numerical Analysis of Radiation Effects on Fiber Optic Sensors" Sensors 21, no. 12: 4111. https://doi.org/10.3390/s21124111
Note that from the first issue of 2016, this journal uses article numbers instead of page numbers. See further details here.