
Markerless Image Alignment Method for Pressure-Sensitive Paint Image
by
 , , , and
Kyosuke Suzuki
1, 
Tomoki Inoue
1,
Takayuki Nagata
2,
Miku Kasai
2,
Taku Nonomura
2 and
Yu Matsuda
1,3,* 1
Department of Modern Mechanical Engineering, Waseda University, 3-4-1 Ookubo, Shinjuku-ku, Tokyo 169-8555, Japan
2
Department of Aerospace Engineering, Tohoku University, 6-6-01 Aoba, Arakaki, Aoba-ku, Sendai 980-8579, Miyagi, Japan
3
Japan Science and Technology Agency (JST), PRESTO, 4-1-8 Honcho, Kawaguchi 332-0012, Saitama, Japan
*
Author to whom correspondence should be addressed.
Sensors 2022, 22(2), 453; https://doi.org/10.3390/s22020453
Submission received: 22 November 2021
/
Revised: 29 December 2021
/
Accepted: 29 December 2021
/
Published: 7 January 2022
(This article belongs to the Special Issue Optical Sensors for Flow Diagnostics)
Abstract
:We propose a markerless image alignment method for pressure-sensitive paint measurement data replacing the time-consuming conventional alignment method in which the black markers are placed on the model and are detected manually. In the proposed method, feature points are detected by a boundary detection method, in which the PSP boundary is detected using the Moore-Neighbor tracing algorithm. The performance of the proposed method is compared with the conventional method based on black markers, the difference of Gaussian (DoG) detector, and the Hessian corner detector. The results by the proposed method and the DoG detector are equivalent to each other. On the other hand, the performances of the image alignment using the black marker and the Hessian corner detector are slightly worse compared with the DoG and the proposed method. The computational cost of the proposed method is half of that of the DoG method. The proposed method is a promising for the image alignment in the PSP application in the viewpoint of the alignment precision and computational cost.
1. Introduction
The pressure-sensitive paint (PSP) technique is an optical flow diagnosis method for measuring pressure on a model to which a PSP coating is applied [1,2,3,4]. The PSP technique has received much attention, as it enables non-intrusively measuring pressure distribution. Indeed, the PSP technique has been applied to various fluid dynamic experiments: wind tunnel testing [5,6,7,8,9], rotating machineries [10,11,12], and micro devices [13,14,15,16,17]. In the PSP technique, pressure is measured by the variation of the luminescence intensity from the PSP coating with a CCD/CMOS camera [2,3]. To improve the measurement accuracy of the PSP technique, a temperature compensation method is intensively investigated [18,19,20,21,22,23,24,25]. In addition, there are many studies on measurement system [26,27] and post-processing [28,29,30,31] for the noise reduction in the PSP image. On the other hand, there is less research on an image alignment method. The alignment of the reference and the run images is an important procedure in the post-processing of PSP data, because the misalignment of the images leads to large measurement error. In conventional techniques, black markers placed on a model surface are used to image alignment [32,33]. Sant et al. [32] proposed an automatic method that detects black markers and links those of the reference and the run images. The linking method is based on the distance between the markers, and the method requires an iterative calculation. Since the positions of the markers in both reference and run images are detected and linked manually in the method proposed by Fujimatsu et al. [33], the method is time consuming for practical applications. The advantage of the method proposed by Fujimatsu et al. also uses corners of a model for the image alignment to improve the alignment accuracy. In general, since the positions of black markers are heuristically determined, the performance of the image alignment will vary by the researchers. In these conventional methods using black markers, pressures at the markers cannot be measured.
In this study, we focus on features of images such as corners, edges, and contours [34]. We propose an image alignment method using features and its feature values, while the above-mentioned methods do not use feature values; that is, the existing method only uses the information of the marker positions. The use of feature values, characterizing the neighborhood of the features [35], enables us to easily link the features between the reference and the run images and to align the images without using black markers. Although there are many studies on image alignment/registration in various fields such as computer vision and medical image fields [34,35], these methods are not directly applicable to the PSP images. This is because the images obtained in the PSP measurement usually consist of white solid color (luminescence from PSP) and black solid color (background) parts with few features. Kuzub et al. [36] proposed the method using feature points. Since the features on the PSP such as small scratches and defects are usually affected by the illumination, the mismatching of the features between the reference and the run images will occur due to the change of the illumination condition. Then, Kuzub et al. also used the black markers. In this study, we propose a markerless image alignment method based on a boundary detection method. The performance of the proposed method is compared with the conventional method based on black markers, the difference of Gaussian (DoG) detector, and the Hessian corner detector.
2. Lifetime-Based PSP Measurements
A PSP coating consists of phosphorescence dye and binder and is applied to a model surface. When the dye is photoexcited, the phosphorescence is emitted from the dye. The intensity/lifetime of the phosphorescence depends on pressure due to oxygen quenching. Therefore, the pressure on the model can be measured by detecting the variation of the intensity/lifetime; there are two approaches for measuring pressure distribution: the intensity-based method and lifetime-based one [2,3]. In the intensity-based method, the change in position of the model will induce the error due to the change in the illumination distribution. As a demonstration of the image alignment methods, we used a lifetime-based method known as the two-gated lifetime method [37,38,39,40] in this study. Two images are captured in the two-gated lifetime method: Gate 1 image is captured during the excitation of PSP, and Gate 2 one is captured during the decay of the luminescence of PSP after excitation light is off. Then, the image ratio is calculated as
where and are Gate 1 and Gate 2 images, respectively. Theoretically, the image ratio obtained at the run condition relates to pressure. However, it is difficult to obtain pressure distribution from due to the non-uniformity of the lifetime spatial distribution. To compensate for the effect of this non-uniformity, the image ratio obtained at the reference condition is used. Then, the ratio of and is used for pressure measurement [41].
where are calibration constants.
3. Image Alignment Method
3.1. Feature Point Detection
There are many feature point detection methods detecting rotation invariant and scale-variant feature points. However, the scale of PSP images is usually not changed. As feature point detection methods, we use the following three methods: the difference of Gaussian (DoG) detector, the Hessian corner detector, and the proposed method. It is noted that PSP image is usually a grayscale one. In the DoG detector, the DoG operator, which is an approximation form of the Laplacian of Gaussian (LoG) operator, is applied to image to detect feature point [35,42]. The DoG operator is written as
where is the two-dimensional Gaussian filter at pixel of image with the standard deviation . After applying the DoG operator, the points with higher values than a threshold are adopted as feature points. In this study, the threshold was determined to detect the feature points near the corners and edges, because the feature points on the model usually lead to mismatching due to the change of the illumination condition between the images.
In the Hessian corner detector, the following Hessian matrix is considered [35,43]:
where indicates the intensity of the image at pixel and the subscript indicates the gradient in the or direction. For example, is the gradient in the direction, and is the direction gradient. Since the computational cost for Equation (4) is high, we treat the approximation form using box filters [44]. Following Ref. [44], the box filters are used to approximately express , , and . The approximated gradients , , and are denoted as , , and , respectively. Then, the determinant of the Hessian matrix is considered
where is the relative weight of the filter responses and is in this study following Ref. [44]. Calculating Equation (4), we adopt the points with higher value of the determinant as feature points.
The proposed method is as follows. The boundary of the PSP/model is traced using the Moore-Neighbor tracing algorithm [45,46]. In the algorithm, the image is binarized, and the outline of the PSP/model is traced in the binary image. A pixel on the boundary of an object has to be specified as a starting point of the tracing. The Harris corner detector [35,47] is used to find the pixel on the boundary (corner) of PSP. The traced outline is varied due to a binarization threshold value; thus, we trace the outlines under six binarized images based on six binarization threshold values. The 0.04, 0.08, 0.12, 0.16, 0.20, and 0.24 are used as binarization threshold values in the PSP image normalized by the maximum intensity value. The obtained six outlines are adopted as feature points. The advantage of this method is its lower computational cost than the conventional method.
3.2. Description of Feature Point
As a feature descriptor, a vector of the descriptor with 64 dimensions is used in this study and is calculated from the neighborhood around the feature point following Ref. [44]. For obtaining a rotation-invariant descriptor, the Haar wavelet (size of ) responses in the horizontal and vertical axes of the image are calculated for each point within a circular neighborhood of radius around the point of interest, where is following Ref. [44] in this study. Then, the responses are filtered by the Gaussian filter with the standard deviation of . The response angles are calculated as the arctangent of the ratio of the horizontal response to the vertical one. The responses are summed in the sliding angle window of . The orientation of the feature point is determined by the ratio of the summed horizontal response to the vertical one in the region with the maximum summed response. The square region of around the featured point is considered and is rotated in the calculated orientation. Then, the region is divided into subregions. The Haar wavelet responses (size of 2) in the horizontal and vertical axes are calculated from regularly sampled points for each subregion. The absolute values of them are also calculated. The Gaussian filter with the standard deviation of is also applied following Ref. [44]. These four Haar wavelet responses are obtained for subregions; thus, the descriptor with 64 dimensions is obtained for each feature point. In this study, we used OpenSURF code and calculated the descriptor [48].
3.3. Matching of Feature Points between Images
Based on the calculated descriptor, the corresponding feature points between the reference and the run image are estimated using the Harris algorithm. We used “matchFeatures” of MATLAB [49], where the pairwise distance between feature vectors are calculated. In the input arguments for “matchFeatures”, the “MaxRatio” was set at 0.9. The default values were used for other arguments. Based on the matched feature points, the geometric transformation matrix is calculated using “estimateGeometricTransform” function [50]. We used “affine” for “transformType” in the function. In this function, the outliers are excluded based on the M-estimator sample consensus [50]. Then, the reference and run images are aligned by applying the transformation matrix.
4. Experimental Method
We investigated the performance of the methods using the PSP data of a two-bladed rotor model [51]. In this paper, we briefly introduce the experimental method. The details are provided in Nagata et al. [51]. The chord and the span of the blade were 44.7 mm and 89.4 mm, respectively. The rotor diameter was 303 mm. In this study, we used platinum (II) mesotetra(pentafluorophenyl)porphine (PtTFPP) as a pressure-sensitive dye and poly(isobutyl-co-1,1,1,3,3,3-hexafluoroisopropyl methacrylate) (PHFIPM) as a polymer binder. We painted PSP on only one blade in the following procedure. First, a white polyester film (1080-M10, 3M Japan, Japan) was stuck onto the model. Second, a PHFIPM solution without PtTFPP was applied to it as a buffer layer to prevent a chemical interaction between PtTFPP and the white polyester film. Then, the PSP (PtTFPP/PHFIPM) was applied to it. We also painted six black circular markers on the blade to compare the proposed markerless method with the conventional marker-based one.
The PSP coating was illuminated by an LED device with a central wavelength of 395 nm (IL-106UV LED, HARDsoft Microprocessor Systems, Kraków, Poland). The emission of the PSP coating was captured with repeatedly short exposure time by a CCD camera (PCO1600, PCO, Germany). In this study, we obtained two image ratios with a difference position of the blade, (before rotation) and (after rotation), to examine the image alignment methods. It is noted that both image ratio images were obtained under an atmospheric pressure without rotating motion, and the pressure on the blade was uniform; thus, we can evaluate the accuracy of the image alignment by calculating the ratio of the image ratios, , which is ideally unity for a well-aligned image.
5. Results and Discussion
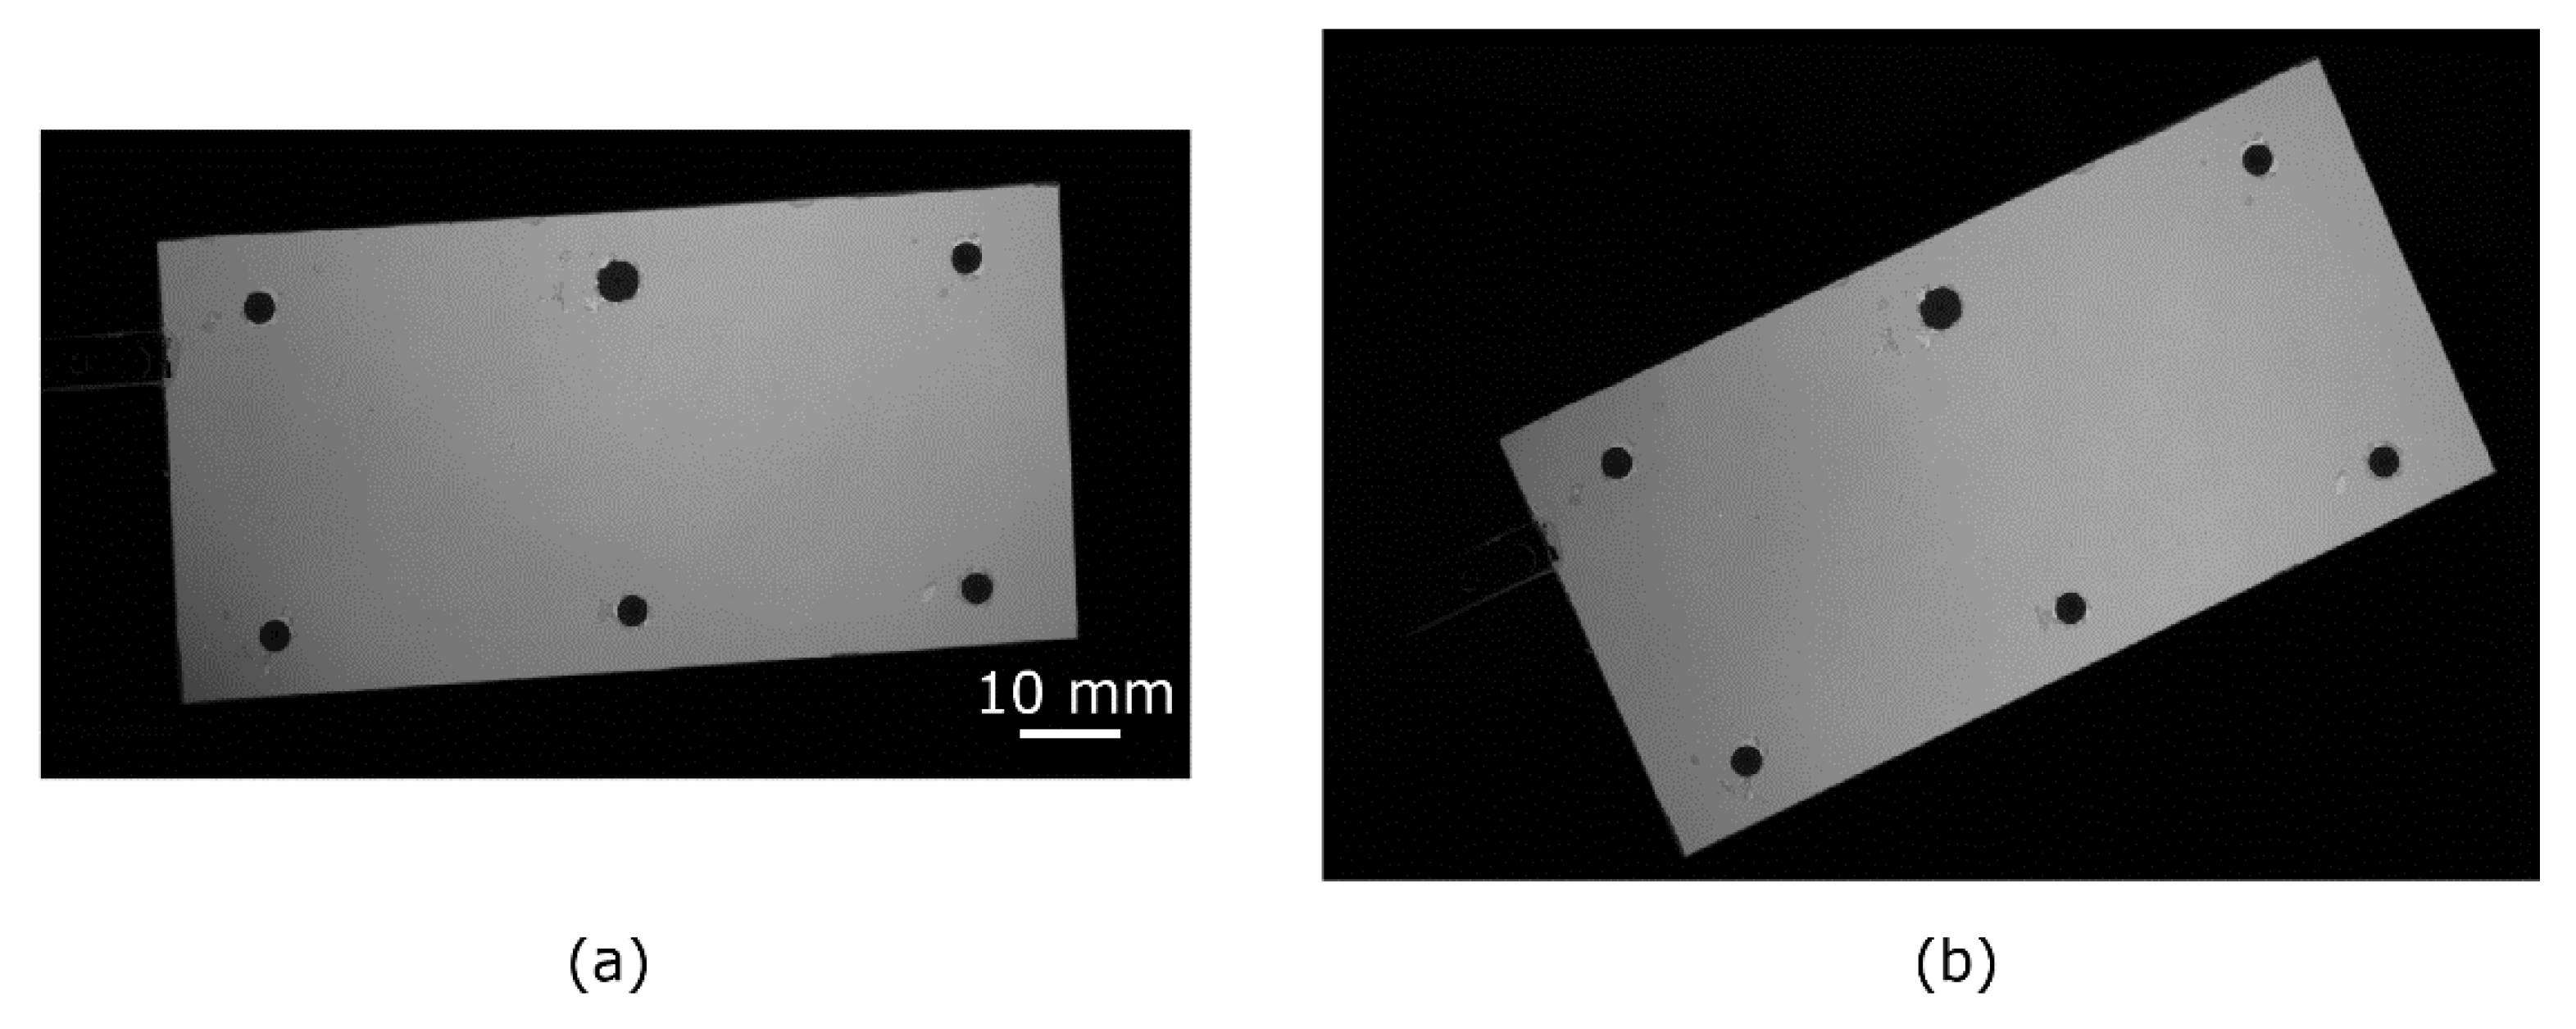
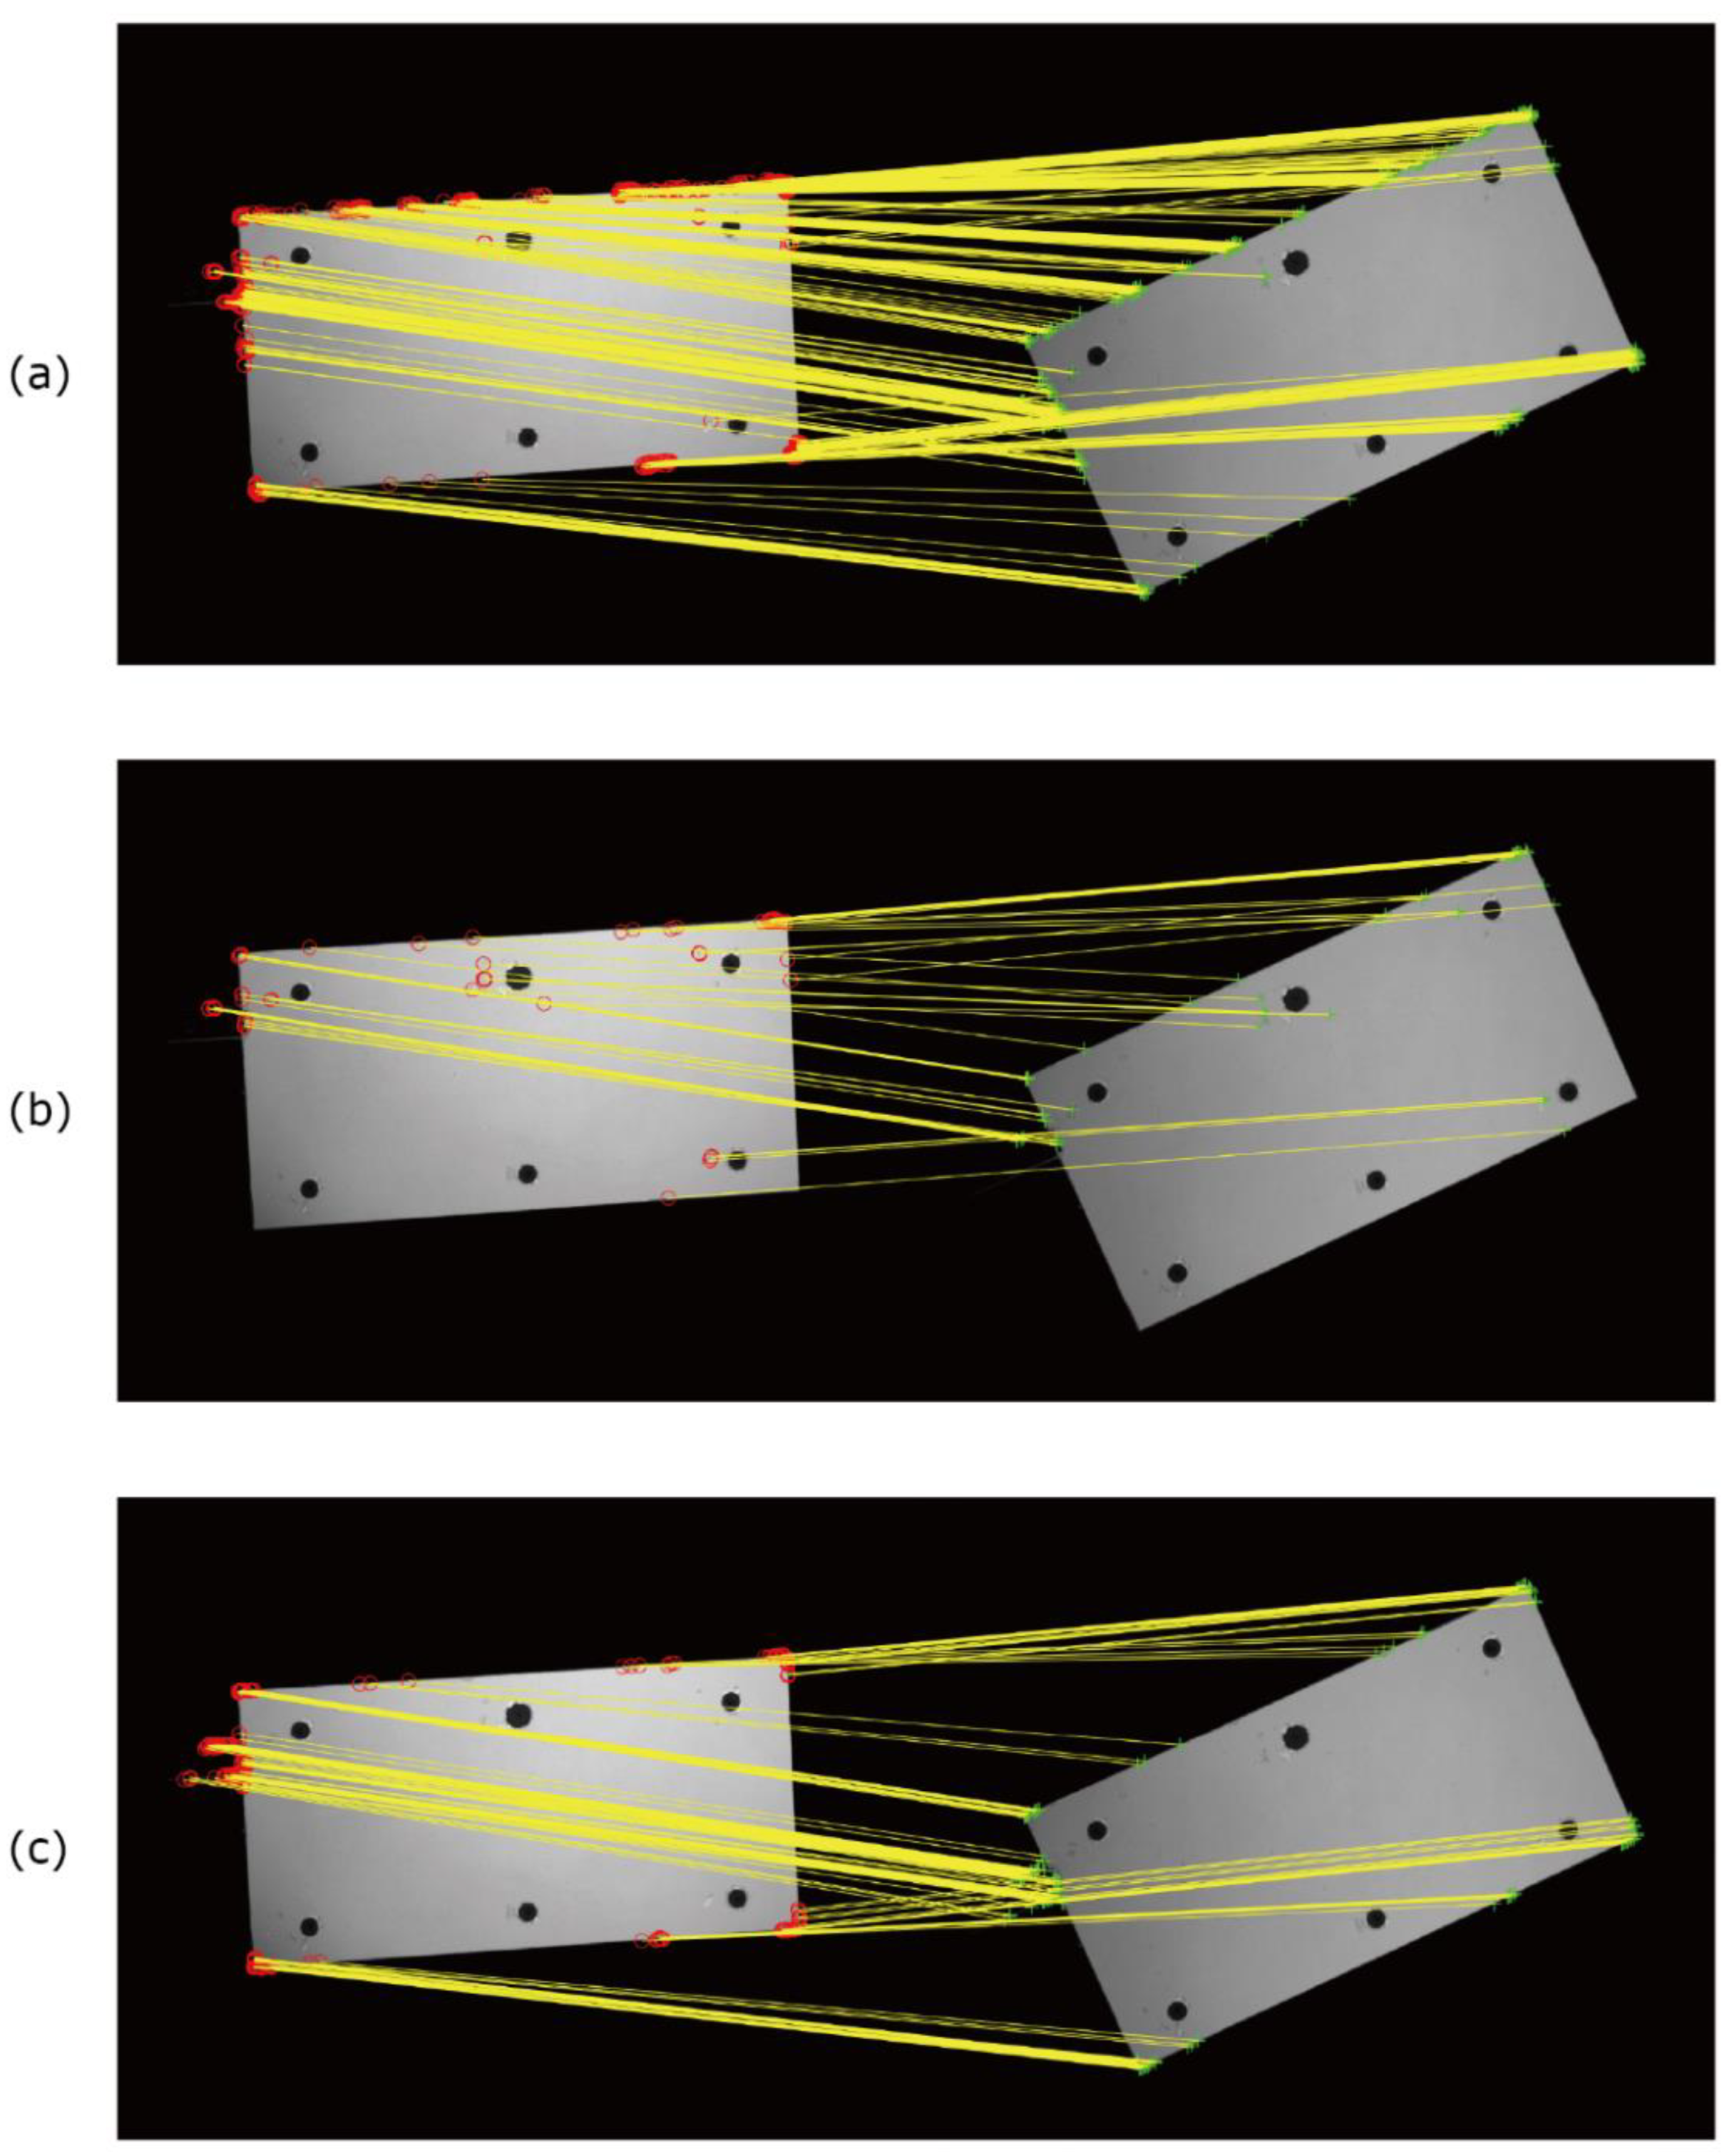
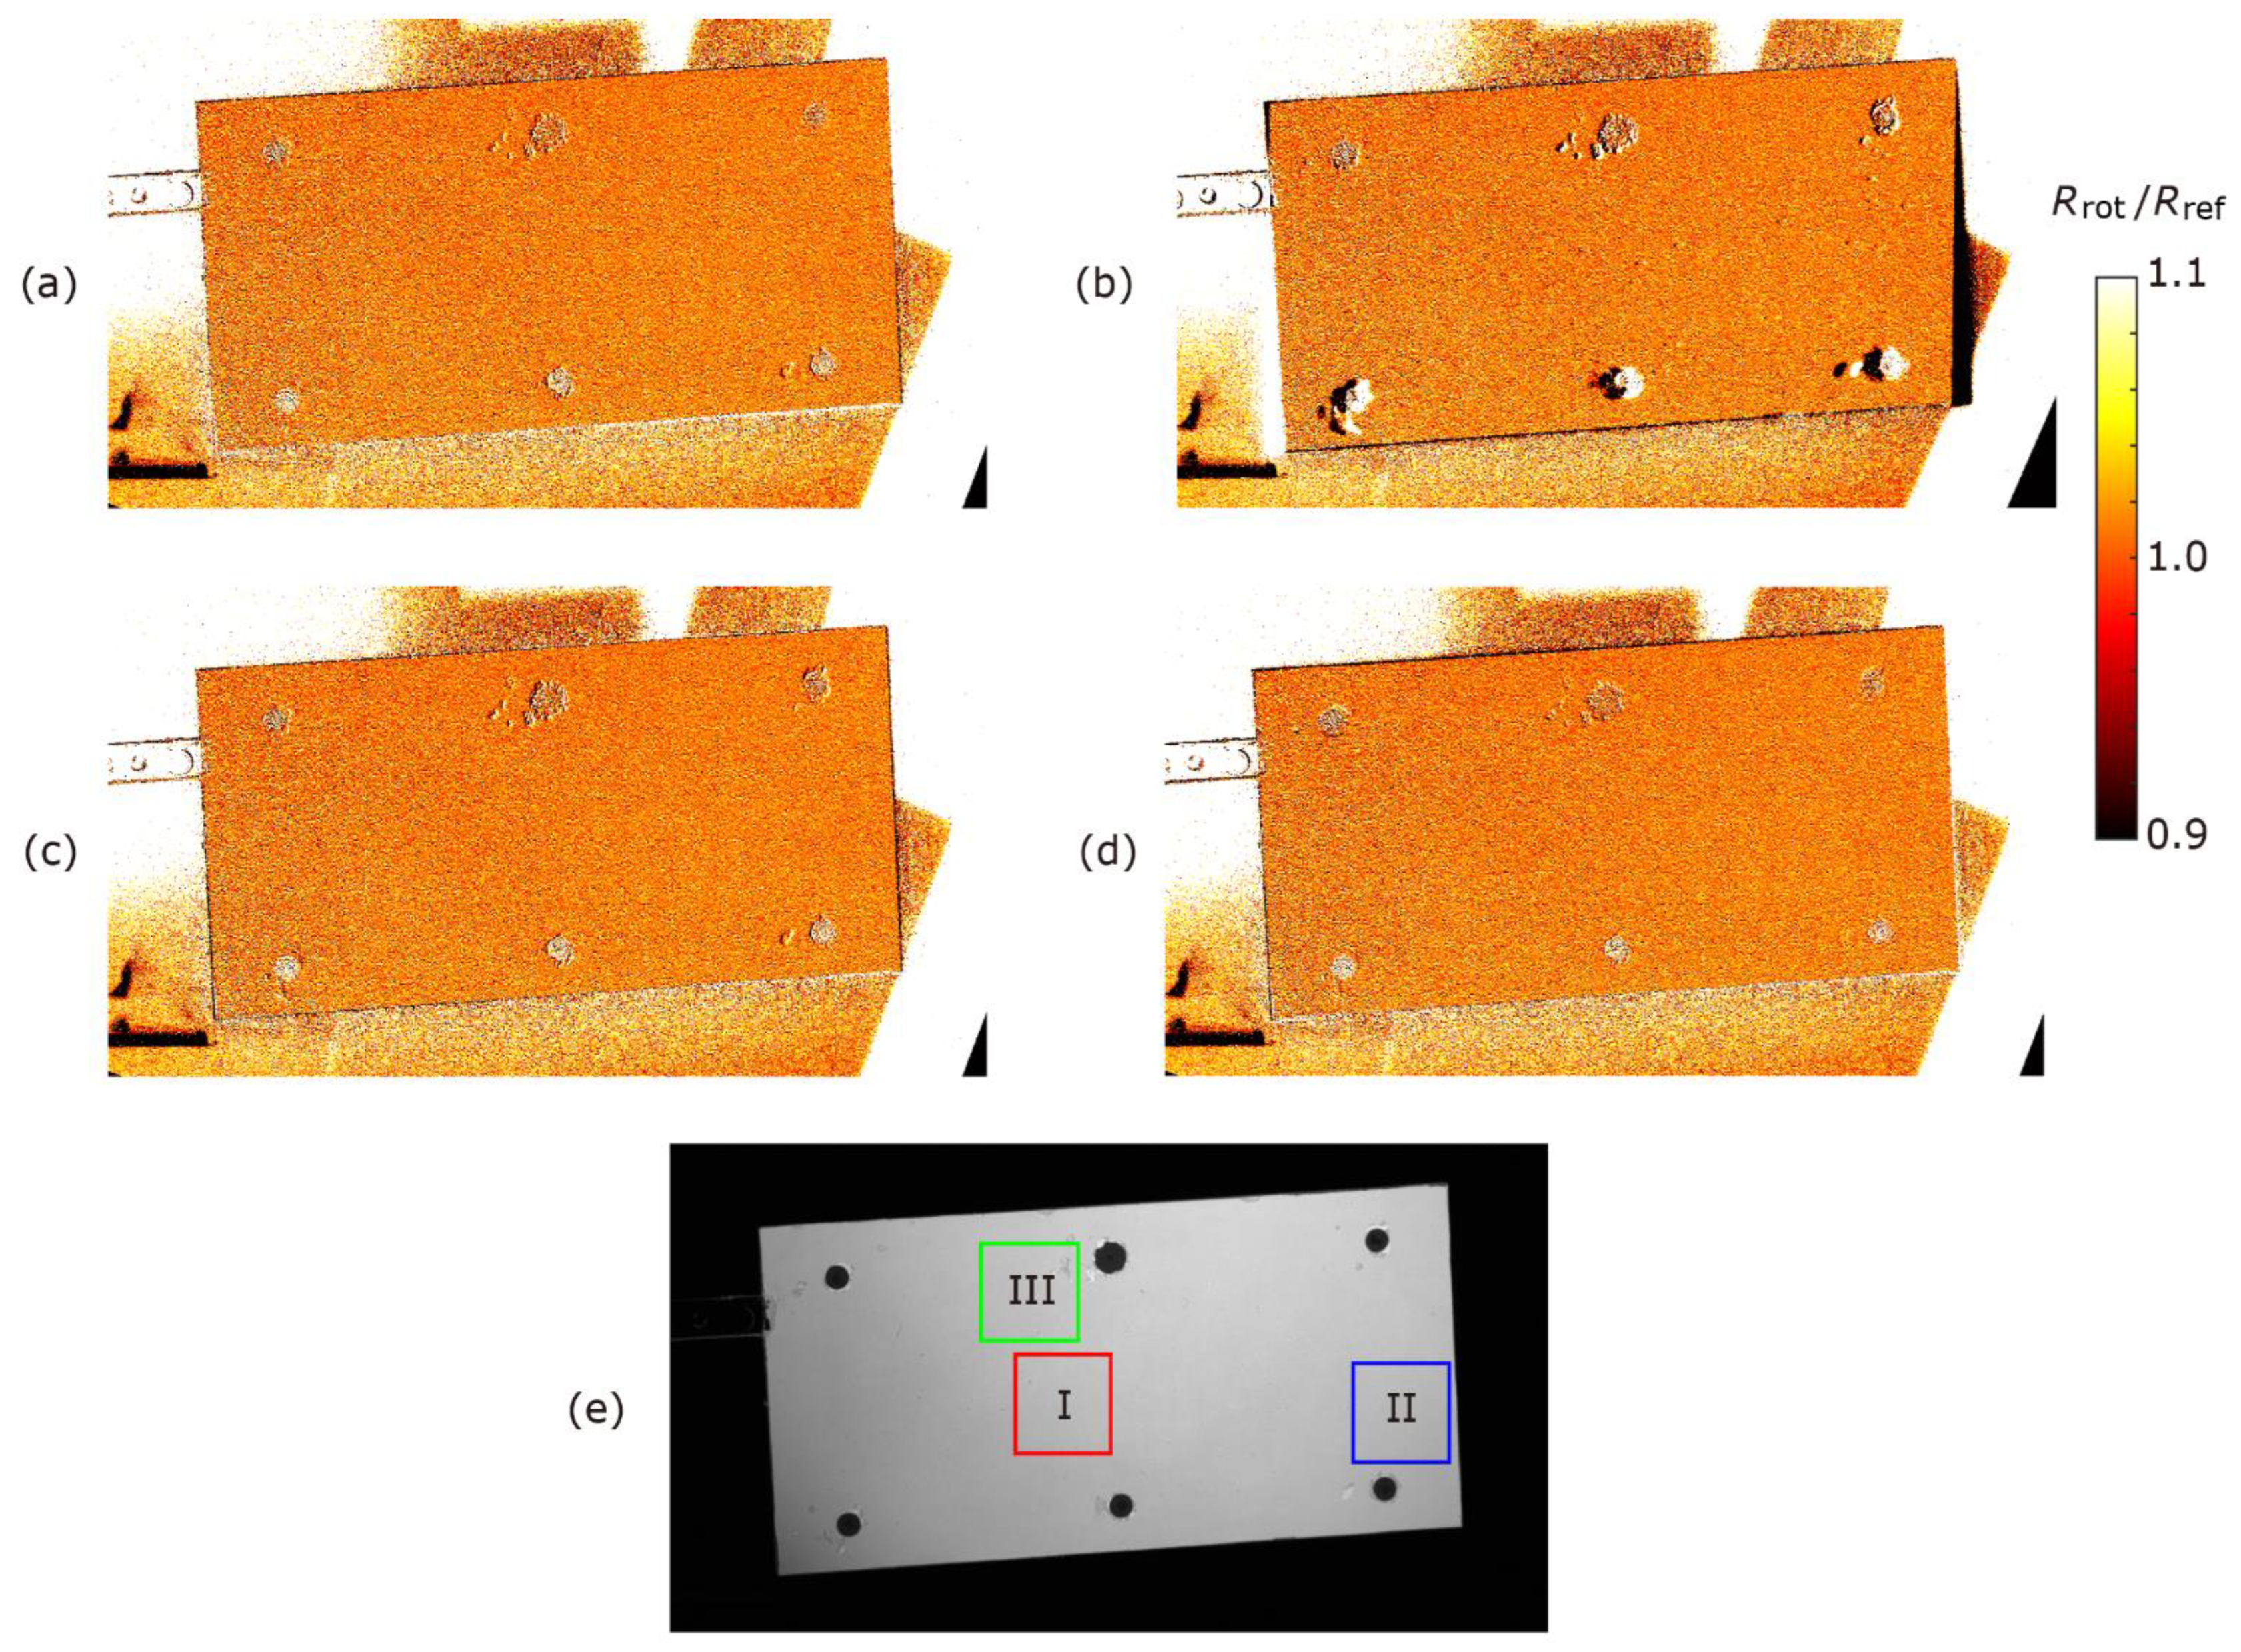
Figure 1 shows the images of the blade before rotation and rotated 25°. The images were aligned by the methods introduced in Section 3. As a comparison, the images were aligned by the conventional method using black markers. Figure 2 shows the feature points obtained by each method and the results of feature point matching. The matched points are connected by yellow solid lines. The resultant ratios of the image ratios, , are shown in Figure 3. As described in the previous section, this ratio is ideally unity for the well-aligned image. We computed the mean value and standard deviation of for the pixels at the center and near edge areas (shown in Figure 3e) of the blade to evaluate the alignment performance. The results are summarized in Table 1. The results shown in here are the best results for each method. The mean values and the standard deviation of at the center portion of the blade were equal for each method, as shown in Table 1. Due to the shot noise of the camera, the standard deviations of were approximately 0.04 for all cases except for the result of the Hessian corner detector.
Figure 2 and Figure 3 illustrate that the results using the conventional black marker method, the DoG detector, and the proposed method were similar. However, the values of were approximately 0.9 (it is observed as the black line) at the upper portion (leading edge) of the blade for the conventional black marker method. It is considered that the number of the point used for the image alignment was only six, and there were no points for the alignment near the leading edge of the blade in this study. Since the black markers are generally not placed the boundary of the PSP or the edge of the model, the alignment accuracy will be worse near these areas. This indicates that the image alignment accuracy of the conventional black marker method is slightly worse compared with those of the DoG detector and the proposed method. The result obtained by the Hessian corner detector was worse. For example, the values of at the right side and bottom (trailing edge) of the blade were approximately 0.9. Then, the mean and standard deviation of at area II were respectively lower and higher than those of the other methods. This is because there was no matching feature point in the lower-left corner of the blade, as shown in Figure 2b. The luminescent intensity at the lower-left corner area was lower than that at other areas, as shown in Figure 1a, and the feature point was not detected by the Hessian corner detector using a single threshold. As shown in Figure 3 and Table 1, the results obtained by the DoG detector and the proposed method were equivalent. However, the number of matched points was approximately 2.5 times larger in the DoG method than in the proposed method. In other words, the number of matching points of the proposed method was enough to correctly align the images. It is noted that the computational cost of the DoG method (about 2.5 min in a laptop PC of Windows 10 professional with CPU of Intel(R) Core(TM) i7-7500U, Matlab 2020a) was higher than that of the proposed method (approximately 1 min). The proposed method was also confirmed to be successfully applied to the PSP images used in Ref. [31].
6. Conclusions
A markerless image alignment method for pressure-sensitive paint (PSP) measurement data was proposed. Since the images are generally aligned using feature points, the performance of image alignment mainly depends on whether the preferred feature points are detected or not. Conventionally, the PSP images are aligned based on black markers placed on a model surface. The positions of the markers are detected manually, and this method is time consuming for practical applications. Since the positions of black markers are heuristically determined, the performance of the image alignment will vary by the researchers. Moreover, pressures at the markers cannot be measured in the method using black markers. Then, we proposed a feature point detection method based on the boundary detection method, in which the PSP/model boundary is detected using the Moore-Neighbor tracing algorithm. The proposed method uses the boundary as feature points instead of the points such as small scratches and defects of the paints, which are affected by the illumination condition. The performance of the image alignment by the proposed method was compared with the conventional method based on black markers, the difference of Gaussian (DoG) detector, and the Hessian corner detector. For this purpose, we measured the PSP images before and after rotation of a rotor blade, to which a PSP was applied. In this study, we used a lifetime-based method to eliminate the effect of illumination distribution before and after rotation. The results obtained by the proposed method and the DoG detector were equivalent to each other. On the other hand, the performances of the image alignment using the black marker and the Hessian corner detector were worse compared with the DoG and the proposed method. In the black marker and the Hessian corner detector, the feature points were not prepared (black marker) or detected (the Hessian corner detector) near or on the edge and corner of the PSP; thus, the alignment accuracy decreased such areas. Now, if we focus on the proposed method and the DoG detector, the number of matched points was approximately 2.5 times larger in the DoG method than in the proposed method. In other words, the number of matching points of the proposed method was enough to correctly align the images and reduces the computational cost. The computational cost of the proposed method is 2/5 of the DoG detector without losing the alignment accuracy. The proposed method will be a powerful markerless alignment method for the PSP data.
Author Contributions
Conceptualization, Y.M.; methodology, K.S., T.N. (Taku Nonomura) and Y.M.; formal analysis, K.S. and T.I.; investigation, K.S., T.I., T.N. (Takayuki Nagata) and M.K.; data curation, K.S., T.I. and T.N. (Takayuki Nagata); writing—original draft preparation, Y.M.; writing—review and editing, T.N. (Takayuki Nagata), T.N. (Taku Nonomura) and Y.M.; visualization, K.S. and Y.M.; supervision, Y.M.; project administration, Y.M.; funding acquisition, Y.M. All authors have read and agreed to the published version of the manuscript.
Funding
This work was partially supported by JST PRESTO Grant Number JPMJPR187A.
Institutional Review Board Statement
Not applicable.
Informed Consent Statement
Not applicable.
Data Availability Statement
Data sharing not applicable.
Conflicts of Interest
The authors declare no conflict of interest.
References
- Liu, T.; Campbell, B.T.; Burns, S.P.; Sullivan, J.P. Temperature- and Pressure-Sensitive Luminescent Paints in Aerodynamics. Appl. Mech. Rev. 1997, 50, 227–246. [Google Scholar] [CrossRef]
- Bell, J.H.; Schairer, E.T.; Hand, L.A.; Mehta, R.D. Surface Pressure Measurements using Luminescent coatings. Annu. Rev. Fluid Mech. 2001, 33, 155–206. [Google Scholar] [CrossRef]
- Liu, T.; Sullivan, J.P. Pressure and Temperature Sensitive Paints; Springer: Berlin, Germany, 2005. [Google Scholar]
- Gregory, J.W.; Asai, K.; Kameda, M.; Liu, T.; Sullivan, J.P. A review of pressure-sensitive paint for high-speed and unsteady aerodynamics. Proc. Inst. Mech. Eng. Part G J. Aerosp. Eng. 2008, 222, 249–290. [Google Scholar] [CrossRef]
- Sugioka, Y.; Koike, S.; Nakakita, K.; Numata, D.; Nonomura, T.; Asai, K. Experimental analysis of transonic buffet on a 3D swept wing using fast-response pressure-sensitive paint. Exp. Fluids 2018, 59, 108. [Google Scholar] [CrossRef]
- Running, C.L.; Sakaue, H.; Juliano, T.J. Hypersonic boundary-layer separation detection with pressure-sensitive paint for a cone at high angle of attack. Exp. Fluids 2019, 60, 23. [Google Scholar] [CrossRef]
- Peng, D.; Xie, F.; Liu, X.; Lin, J.; Li, Y.; Zhong, J.; Zhang, Q.; Liu, Y. Experimental study on hypersonic shock–body interaction between bodies in close proximity using translucent fast pressure- and temperature-sensitive paints. Exp. Fluids 2020, 61, 120. [Google Scholar] [CrossRef]
- Egami, Y.; Hasegawa, A.; Matsuda, Y.; Ikami, T.; Nagai, H. Ruthenium-based fast-responding pressure-sensitive paint for measuring small pressure fluctuation in low-speed flow field. Meas. Sci. Technol. 2021, 32, 024003. [Google Scholar] [CrossRef]
- Disotell, K.J.; Nikoueeyan, P.; Naughton, J.W.; Gregory, J.W. Global surface pressure measurements of static and dynamic stall on a wind turbine airfoil at low Reynolds number. Exp. Fluids 2016, 57, 82. [Google Scholar] [CrossRef]
- Kameya, T.; Matsuda, Y.; Yamaguchi, H.; Egami, Y.; Niimi, T. Pressure-sensitive paint measurement on co-rotating disks in a hard disk drive. Opt. Lasers Eng. 2012, 50, 82–86. [Google Scholar] [CrossRef]
- Disotell, K.J.; Peng, D.; Juliano, T.J.; Gregory, J.W.; Crafton, J.W.; Komerath, N.M. Single-shot temperature- and pressure-sensitive paint measurements on an unsteady helicopter blade. Exp. Fluids 2014, 55, 1671. [Google Scholar] [CrossRef] [Green Version]
- Peng, D.; Jiao, L.; Yu, Y.; Liu, Y.; Oshio, T.; Kawakubo, T.; Yakushiji, A. Single-shot lifetime-based PSP and TSP measurements on turbocharger compressor blades. Exp. Fluids 2017, 58, 127. [Google Scholar] [CrossRef]
- Huang, C.-Y.; Lai, C.-M. Pressure measurements with molecule-based pressure sensors in straight and constricted PDMS microchannels. J. Micromech. Microeng. 2012, 22, 065021. [Google Scholar] [CrossRef]
- Nagai, H.; Naraoka, R.; Sawada, K.; Asai, K. Pressure-Sensitive Paint Measurement of Pressure Distribution in a Supersonic Micronozzle. AIAA J. 2008, 46, 215–222. [Google Scholar] [CrossRef]
- Matsuda, Y.; Uchida, T.; Suzuki, S.; Misaki, R.; Yamaguchi, H.; Niimi, T. Pressure-sensitive molecular film for investigation of micro gas flows. Microfluid. Nanofluid. 2011, 10, 165–171. [Google Scholar] [CrossRef]
- Matsuda, Y.; Misaki, R.; Yamaguchi, H.; Niimi, T. Pressure-sensitive channel chip for visualization measurement of micro gas flows. Microfluid. Nanofluid. 2011, 11, 507–510. [Google Scholar] [CrossRef]
- Huang, C.-Y.; Matsuda, Y.; Gregory, J.W.; Nagai, H.; Asai, K. The applications of pressure-sensitive paint in microfluidic systems. Microfluid. Nanofluid. 2015, 18, 739–753. [Google Scholar] [CrossRef]
- Nakakita, K.; Kurita, M.; Mitsuo, K.; Watanabe, S. Practical pressure-sensitive paint measurement system for industrial wind tunnels at JAXA. Meas. Sci. Technol. 2006, 17, 359–366. [Google Scholar] [CrossRef]
- Borisov, S.M.; Vasylevska, A.S.; Krause, C.; Wolfbeis, O.S. Composite Luminescent Material for Dual Sensing of Oxygen and Temperature. Adv. Funct. Mater. 2006, 16, 1536–1542. [Google Scholar] [CrossRef]
- Köse, M.E.; Carroll, B.F.; Schanze, K.S. Preparation and Spectroscopic Properties of Multiluminophore Luminescent Oxygen and Temperature Sensor Films. Langmuir 2005, 21, 9121–9129. [Google Scholar] [CrossRef]
- Hyakutake, T.; Taguchi, H.; Kato, J.; Nishide, H.; Watanabe, M. Luminescent Multi-Layered Polymer Coating for the Simultaneous Detection of Oxygen Pressure and Temperature. Macromol. Chem. Phys. 2009, 210, 1230–1234. [Google Scholar] [CrossRef]
- Kameya, T.; Matsuda, Y.; Egami, Y.; Yamaguchi, H.; Niimi, T. Dual luminescent arrays sensor fabricated by inkjet-printing of pressure- and temperature-sensitive paints. Sens. Actuators B Chem. 2014, 190, 70–77. [Google Scholar] [CrossRef]
- Matsuda, Y.; Kameya, T.; Suzuki, Y.; Yoshida, Y.; Egami, Y.; Yamaguchi, H.; Niimi, T. Fine printing of pressure- and temperature-sensitive paints using commercial inkjet printer. Sens. Actuators B Chem. 2017, 250, 563–568. [Google Scholar] [CrossRef]
- Peng, D.; Jiao, L.; Sun, Z.; Gu, Y.; Liu, Y. Simultaneous PSP and TSP measurements of transient flow in a long-duration hypersonic tunnel. Exp. Fluids 2016, 57, 188. [Google Scholar] [CrossRef]
- Peng, D.; Liu, Y. A grid-pattern PSP/TSP system for simultaneous pressure and temperature measurements. Sens. Actuators B Chem. 2016, 222, 141–150. [Google Scholar] [CrossRef]
- Yorita, D.; Nagai, H.; Asai, K.; Narumi, T. Unsteady PSP Technique for Measuring Naturally-Disturbed Periodic Phenomena. In Proceedings of the 48th AIAA Aerospace Sciences Meeting Including the New Horizons Forum and Aerospace Exposition, Orlando, FL, USA, 4–7 January 2010. AIAA 2010-307. [Google Scholar]
- Matsuda, Y.; Yorita, D.; Egami, Y.; Kameya, T.; Kakihara, N.; Yamaguchi, H.; Asai, K.; Niimi, T. Unsteady pressure-sensitive paint measurement based on the heterodyne method using low frame rate camera. Rev. Sci. Instrum. 2013, 84. [Google Scholar] [CrossRef]
- Pastuhoff, M.; Yorita, D.; Asai, K.; Alfredsson, P.H. Enhancing the signal-to-noise ratio of pressure sensitive paint data by singular value decomposition. Meas. Sci. Technol. 2013, 24, 075301. [Google Scholar] [CrossRef]
- Sugioka, Y.; Hiura, K.; Chen, L.; Matsui, A.; Morita, K.; Nonomura, T.; Asai, K. Unsteady pressure-sensitive-paint (PSP) measurement in low-speed flow: Characteristic mode decomposition and noise floor analysis. Exp. Fluids 2019, 60, 108. [Google Scholar] [CrossRef]
- Wen, X.; Liu, Y.; Li, Z.; Chen, Y.; Peng, D. Data mining of a clean signal from highly noisy data based on compressed data fusion: A fast-responding pressure-sensitive paint application. Phys. Fluids 2018, 30, 097103. [Google Scholar] [CrossRef]
- Inoue, T.; Matsuda, Y.; Ikami, T.; Nonomura, T.; Egami, Y.; Nagai, H. Data-driven approach for noise reduction in pressure-sensitive paint data based on modal expansion and time-series data at optimally placed points. Phys. Fluids 2021, 33. [Google Scholar] [CrossRef]
- Sant, Y.L.; Deleglise, B.; Mebarki, Y. An automatic image alignment method applied to pressure sensitive paint measurements, ICIASF’97 Record. In Proceedings of the International Congress on Instrumentation in Aerospace Simulation Facilities, Pacific Grove, CA, USA, 29 September–2 October 1997; pp. 57–65. [Google Scholar]
- Fujimatsu, N.; Tamura, Y.; Fujii, K. Improvement of noise filtering and image registration methods for the Pressure Sensitive Paint experiments. J. Vis. 2005, 8, 225–233. [Google Scholar] [CrossRef]
- Zitová, B.; Flusser, J. Image registration methods: A survey. Image Vis. Comput. 2003, 21, 977–1000. [Google Scholar] [CrossRef] [Green Version]
- Goshtasby, A.A. Theory and Applications of Image Registration; John Wiley & Sons, Inc.: Hoboken, NJ, USA, 2017. [Google Scholar]
- Kuzub, J.; Mebarki, Y.; Whitehead, A. Improved Pressure Sensitive Paint Measurement Using Natural Feature Tracking and Piecewise Linear Resection. In Proceedings of the 2011 Canadian Conference on Computer and Robot Vision, St. John’s, NL, Canada, 25–27 May 2011; pp. 48–55. [Google Scholar]
- Goss, L.; Jones, G.; Crafton, J.; Fonov, S. Temperature Compensation for Temporal (Lifetime) Pressure Sensitive Paint Measurements. In Proceedings of the 43rd AIAA Aerospace Sciences Meeting and Exhibit, Reno, NV, USA, 10–13 January 2005. [Google Scholar]
- Sellers, M. Advances in AEDC’s Lifetime Pressure-Sensitive Paint Program. In Proceedings of the 2005 U.S. Air Force T&E Days, Nashville, TN, USA, 6–8 December 2005. [Google Scholar]
- Ruyten, W.; Sellers, M.; Baker, W. Spatially Nonuniform Self-Quenching of the Pressure-Sensitive Paint PtTFPP/FIB. In Proceedings of the 47th AIAA Aerospace Sciences Meeting including The New Horizons Forum and Aerospace Exposition, Orlando, FL, USA, 5–8 January 2009. [Google Scholar]
- Yorita, D.; Henne, U.; Klein, C. Improvement of Lifetime-based PSP Technique for Industrial Wind Tunnel Tests. In Proceedings of the 55th AIAA Aerospace Sciences Meeting, Grapevine, TX, USA, 9–13 January 2017. [Google Scholar]
- Bell, J.H. Accuracy limitations of lifetime-based pressure-sensitive paint (PSP) measurements, ICIASF 2001 Record. In Proceedings of the 19th International Congress on Instrumentation in Aerospace Simulation Facilities (Cat. No.01CH37215), Cleveland, OH, USA, 27–30 August 2001; pp. 5–16. [Google Scholar]
- Marr, D.; Hildreth, E.; Brenner, S. Theory of edge detection. Proc. R. Soc. London Ser. B. Biol. Sci. 1980, 207, 187–217. [Google Scholar]
- Beaudet, P. Rotationally invariant image operators. In Proceedings of the Fourth International Joint Conference on Pattern Recognition, Kyoto, Japan, 7–10 November 1978. [Google Scholar]
- Bay, H.; Ess, A.; Tuytelaars, T.; Van Gool, L. Speeded-Up Robust Features (SURF). Comput. Vis. Image Underst. 2008, 110, 346–359. [Google Scholar] [CrossRef]
- Gray, L. A Mathematician Looks at Wolfram’s New Kind of Science. Not. Amer. Math. Soc. 2003, 50, 200–211. [Google Scholar]
- MATLAB Bwtraceboundary. Available online: https://jp.mathworks.com/help/images/ref/bwtraceboundary.html?lang=en (accessed on 21 November 2021).
- Harris, C.; Stephens, M. A combined corner and edge detector. Proc. 4th Alvey Vision Conf. 1988, 15, 147–151. [Google Scholar]
- Kroon, D.-J. OpenSURF. Available online: https://jp.mathworks.com/matlabcentral/fileexchange/28300-opensurf-including-image-warp (accessed on 21 November 2021).
- MATLAB matchFeatures. Available online: https://jp.mathworks.com/help/vision/ref/matchfeatures.html?lang=en (accessed on 21 November 2021).
- MATLAB estimateGeometricTransform. Available online: https://jp.mathworks.com/help/vision/ref/estimategeometrictransform.html?lang=en (accessed on 21 November 2021).
- Nagata, T.; Sato, H.; Okochi, M.; Sugioka, Y.; Kusama, K.; Kasai, M.; Numata, D.; Nonomura, T.; Asai, K. Visualization of Pressure and Skin-Friction Fields on Rotating Blade under Low-Pressure Conditions. 2021; submitted. [Google Scholar]
Figure 1.
images of blade. (a) before rotation, (b) rotated 25°. The images are cropped around the blade.
Figure 1.
images of blade. (a) before rotation, (b) rotated 25°. The images are cropped around the blade.

Figure 2.
Results of feature point matching for obtained feature points by (a) the DoG detector, (b) the Hessian corner detector, and (c) the proposed method.
Figure 2.
Results of feature point matching for obtained feature points by (a) the DoG detector, (b) the Hessian corner detector, and (c) the proposed method.

Figure 3.
Ratio of image ratios, , for aligned images by (a) the DoG detector, (b) the Hessian corner detector, (c) the proposed method, and (d) the conventional method using black markers. (e) Processing area for Table 1.
Figure 3.
Ratio of image ratios, , for aligned images by (a) the DoG detector, (b) the Hessian corner detector, (c) the proposed method, and (d) the conventional method using black markers. (e) Processing area for Table 1.


Table 1.
Results of image alignment by each method.
| Method | Number of Matched Points for Image Alignment | |
|---|---|---|
| DoG detector | 443 | |
| Hessian corner detector | 60 | |
| Proposed method | 157 | |
| Black marker | — |
Publisher’s Note: MDPI stays neutral with regard to jurisdictional claims in published maps and institutional affiliations. |
© 2022 by the authors. Licensee MDPI, Basel, Switzerland. This article is an open access article distributed under the terms and conditions of the Creative Commons Attribution (CC BY) license (https://creativecommons.org/licenses/by/4.0/).
Share and Cite
MDPI and ACS Style
Suzuki, K.; Inoue, T.; Nagata, T.; Kasai, M.; Nonomura, T.; Matsuda, Y. Markerless Image Alignment Method for Pressure-Sensitive Paint Image. Sensors 2022, 22, 453. https://doi.org/10.3390/s22020453
AMA Style
Suzuki K, Inoue T, Nagata T, Kasai M, Nonomura T, Matsuda Y. Markerless Image Alignment Method for Pressure-Sensitive Paint Image. Sensors. 2022; 22(2):453. https://doi.org/10.3390/s22020453
Chicago/Turabian StyleSuzuki, Kyosuke, Tomoki Inoue, Takayuki Nagata, Miku Kasai, Taku Nonomura, and Yu Matsuda. 2022. "Markerless Image Alignment Method for Pressure-Sensitive Paint Image" Sensors 22, no. 2: 453. https://doi.org/10.3390/s22020453
Note that from the first issue of 2016, this journal uses article numbers instead of page numbers. See further details here.