
Current State of Hyperspectral Remote Sensing for Early Plant Disease Detection: A Review


1
All-Russian Institute of Plant Protection, 3 Podbelsokogo Str., Pushkin, 196608 Saint Petersburg, Russia
2
World-Class Research Center «Advanced Digital Technologies», Peter the Great St. Petersburg Polytechnic University, 29 Polytechnicheskaya Str., 195251 Saint Petersburg, Russia
*
Authors to whom correspondence should be addressed.
Sensors 2022, 22(3), 757; https://doi.org/10.3390/s22030757
Submission received: 25 October 2021
/
Revised: 13 January 2022
/
Accepted: 16 January 2022
/
Published: 19 January 2022
(This article belongs to the Special Issue Emerging Sensors Techniques and Technologies for Intelligent Environments)
Abstract
:The development of hyperspectral remote sensing equipment, in recent years, has provided plant protection professionals with a new mechanism for assessing the phytosanitary state of crops. Semantically rich data coming from hyperspectral sensors are a prerequisite for the timely and rational implementation of plant protection measures. This review presents modern advances in early plant disease detection based on hyperspectral remote sensing. The review identifies current gaps in the methodologies of experiments. A further direction for experimental methodological development is indicated. A comparative study of the existing results is performed and a systematic table of different plants’ disease detection by hyperspectral remote sensing is presented, including important wave bands and sensor model information.
Keywords:
remote sensing; hyperspectral; plant diseases; early detection; oil palm; citrus; cereals; solanaceae1. Introduction
The spread of various, including invasive, plant diseases and pests is one of the most important problems in modern agriculture [1]. Therefore, to solve these relevant problems, the timely monitoring of plant diseases and pests is necessary. Remote sensing methods hold great promise for solving these problems [2]. Remote sensing data can identify crop conditions, including diseases, and provide useful information for specific agricultural management practices [3,4].
There are two types of remote sensing technologies: passive (such as optical) and active remote sensing (such as LiDAR and radar). Passive optical remote sensing is usually divided into two groups based on the spectral resolution of the sensors used: multispectral and hyperspectral remote sensing [5]. Hyperspectral sensing shows great potential as a non-invasive and non-destructive tool for monitoring biotic and abiotic plant stress among passive remote sensing methods, which measure reflected solar radiation [6]. This method collects and stores information from the spectroscopy of an object in a spectral cube that contains spatial information and hundreds of contiguous wavelengths in the third dimension. Hyperspectral imaging offers many opportunities for the early recognition of plant diseases by providing preliminary indicators through subtle changes in spectral reflectance due to absorption or reflection. Hyperspectral images with hundreds of spectral bands can provide detailed spectral portraits, hence, they are better able to detect subtle variations in soil, canopies or individual leaves. Thus, hyperspectral images can be used to solve a wider class of problems for the accurate and timely determination of the physiological status of agricultural crops. The early identification of disease spread and pest outbreaks may avoid not only significant crop loss, but also reduce pesticides usage and mitigate their negative impacts on human health and the environment, thus, improving the existing IPM [7,8].
In recent years, a wide range of miniature hyperspectral sensors available for commercial use have been developed, such as Micro- and Nano-Hyperspec (Headwall Photonics Inc., Boston, MA, USA), HySpex VNIR (HySpex, Skedsmo, Skjetten, Norway) and FireflEYE (Cubert GmbH, Ulm, Germany) [9]. These sensors can be installed on manned or unmanned airborne platforms (for example, airplanes, helicopters, and UAVs) to obtain hyperspectral imaging and support various monitoring missions [10,11].
There are various types of hyperspectral cameras, e.g., push-broom cameras, whisk-broom cameras and snapshot cameras. The measurement principle of each sensor type depends on its ability to obtain the whole picture (snapshot) at one time, one line of the picture (push broom) or one point of the picture (whisk broom) [12].
The general routine of collecting and processing hyperspectral images is presented in Figure 1. The light reflected from plant leaves is collected by the hyperspectral camera (Figure 1A) [13]. A hyperspectral data cube (Figure 1B) is obtained from the hyperspectral camera. Then various data normalization (Figure 1C) and feature extraction (Figure 1D) algorithms are applied to reduce the data’s dimensionality. Finally, different automatization techniques are used to automate the classification process (Figure 1E).
Hyperspectral remote sensing provides image data with very high spectral resolution [16,17]. This high resolution allows subtle differences in plant health to be recognized. Such a multidimensional data space, generated by hyperspectral sensors, has given rise to new approaches and methods for analyzing hyperspectral data [18,19].
For a long time, feature extraction methods have been used that reduce the data dimension without loss (or with minimal loss) of the original information on which the classification of hyperspectral images is based [20]. One of the most widely used dimensionality reduction techniques in HRS is principal component analysis (PCA). PCA computes orthogonal projections that maximize data variance and outputs the dataset in a new, uncorrelated coordinate system. Unfortunately, the informational content of hyperspectral images does not always coincide with such projections [21]. Thus, other methods are also used for feature extraction. The common methods for extracting hyperspectral data used in pathological research traditionally include PCA [22], derivative analysis [23], wavelet methods and correlation plots [24]. Alternatively, the hyperspectral image data can be processed at the image level to extract either spatial representation alone or joint spatial spectral information. If only spatial features are considered, for example, when studying structural and morphological features, spatial patterns among neighboring pixels with relation to the current pixel in the hyperspectral image will be extracted. Machine vision techniques, such as using a two-dimensional CNN, with a p × p chunk of input pixel data have been implemented to automatically generate high-level spatial structures. Extraction of spatial characteristics, in tandem with spectral elements, has been shown to significantly improve model performance. [25]. The use of spatial spectral characteristics can be achieved using two approaches: (i) by separately extracting spatial characteristics using CNN [26,27] and combining data from a spectral extractor using RNN, or LSTM [27,28]; and (ii) by using three-dimensional patterns in hyperspectral data cubes (p × p × b) associated with p × p spatially adjacent pixels and b spectral bands to take full advantage of important distinctive patterns.
In preparing this review, we tried to determine whether there is a general experimental method by which to achieve consistent results in the detection of plant diseases using hyperspectral remote sensing (HRS). We planned to identify existing gaps and tried to find solutions to level those gaps by analyzing existing publications. We believed that the main gaps could be related to the biological aspect of the experiments [29,30,31] and to the incorrect definition and interpretation of wavebands important for plant disease detection, which is also strongly related to biological aspects, namely plant physiology and biochemistry [31,32,33,34]. Considering the machine methods for analyzing hyperspectral data, we believe that, despite the advances in such techniques, such as ANN, SVM and others, their usage for identifying plant diseases with HRS is only a matter of choosing methods for data processing automation. Thus, in this review we will not discuss the advantages or disadvantages of different machine learning methods, especially since these issues have already been discussed by other authors in [35,36,37,38] and other papers.
There are many works devoted to the topic of plant disease detection using HRS; therefore, an urgent task is to prepare a review of hyperspectral remote sensing according to those articles whose authors tried to solve the problem of early detection of plant diseases as one of the key tasks for improving the existing IPM [39,40,41,42]. The early detection of plant diseases is, for a number of reasons, much more difficult than detecting them at the stage of visible symptoms. We believe that the knowledge of methods for identifying plant diseases at the symptomatic stage is the basis for their early detection at the asymptomatic stage. For this reason, we have included these articles in the review along with articles on the early detection of plant diseases using HRS.
The primary search for data on the topic of early detection of plant diseases was carried out using the following keywords (hyperspectral; plant diseases; plant pests; early; detection) during the period from 2006 to 2021. The most important data, selected on the basis of an analysis of the experience gained on the topic, are presented in the form of tables concluding each section of the review.
The choice of plant cultures mentioned in the review was dictated by the need for a sufficient sample of information for analysis. Thus, after analyzing the available articles, we opted for four crops: oil palm, citruses, Solanaceae family plants and wheat. A number of articles devoted to the early detection of diseases in various crops also will be mentioned but without detailed analysis because of lack of sufficient information. Though the low number of articles devoted to the crops different from oil palm, citruses, Solanaceae family plants and wheat made it impossible to perform a deep study or detect dependences in the successful or unsuccessful usage of HRS for plant disease early detection of other species. Thus, the objective of the article was set to analyze the current state of hyperspectral remote sensing for early plant disease detection of four different crop types: oil palm, citruses, Solanaceae family plants and wheat. In our opinion, the selection of these plant species represents a sufficiently representative sample to identify the main advantages and disadvantages of HRS in relation to the early plant diseases detection with generalization to other crops.
So, the main objective of our article was to prove the possibility of early plant disease detection by hyperspectral remote sensing. Another scientific assumption that authors tried to verify is that the spectral reflectance (i.e., important bands) should coincide (possibly with some small shift) with the same diseases and plants. Another objective of this review, then, was to systematize the modern research carried out in the field of using HRS for the detection—Primarily the early detection—Of plant diseases. Within this analysis, the available results are summarized and the main gaps in the field of early detection of plant diseases with HRS are highlighted.
The rest of this paper is organized as follows. Section 2 reviews the current state of hyperspectral remote sensing for early plant disease detection in four types of plants in detail (Section 2.1 for oil palm, Section 2.2 for citrus, Section 2.3 for the Solanaceae family, Section 2.4 for wheat). Due to a lack of information for comprehensive analysis, all other crops are jointly reviewed in Section 2.5. Section 2.6 is the summary for the reviewed materials. Section 3 discussed found gaps and problems, and conclusions are presented in Section 4.
2. Materials and Methods
2.1. Hyperspectral Remote Sensing of Oil Palm Diseases
The palm oil is used in many different ways and is a leader amongst other vegetable oils on the world market; this is why it is very important to control palm oil pests and diseases [43]. There are not so many of them; nevertheless they may adversely affect the palm oil harvest [44]. This section highlights the articles on the detection of such diseases using HRS.
The most important disease of oil palm is basal stem rot (BSR) caused by Ganoderma boninense [45,46]. This disease is a major threat to sustainable oil palm production that can reduce yields by 80% [47,48]. Ganoderma boninense are capable of degrading lignin to carbon dioxide and water, and then use the celluloses as nutrients for the fungus, destroying the host plant in the process [49].
Lelong et al. studied the possibility of discriminating several levels of Ganoderma boninense fungus contamination on oil palm trees’ canopy hyperspectral reflectance data. Using the PLS-DA method, a global performance accuracy of 92–98% was achieved [50,51]. Shafri et al. investigated the possibility of identifying oil palm diseases using HRS, as well as applying various vegetation indices to such data. It was possible to achieve accuracy over 80% for various indices, however, it was concluded that red, edge-based techniques are more effective than vegetation indices in detecting BSR-infected oil palm trees [52,53,54]. In later studies, the possibility of discriminating between three classes of BSR disease severity (healthy, mild and severe symptoms) was examined. A dataset of hyperspectral snapshots of various distances was used to discriminate BSR severity with variable degrees of success [55]. The work continued, in the article, on an optimal SVI development for the early detection of BSR in oil palm seedlings. The authors used the developments and the experience of earlier studies; the significant and insignificant wavelengths and indices were selected from [52,53,54,55]. The wavelengths then were used to create a SVI for the early detection of BSR. The result of the work was the determination of the best indices, presumably most suitable for the early detection of BSR in oil palm [56]. In their next article, the authors continued to improve the technology by performing a thorough analysis of airborne hyperspectral images using different SVIs, red edge position, and continuum removal [57].
Concerning the early detection of BSR, in 2014 Liaghat et al., for the first time, achieved this goal. The authors investigated the capability of reflectance spectroscopy to detect BSR at three stages of infection, and the results confirmed the applicability of VIS-NIR spectroscopy to classify BSR-infected oil palm leaves from healthy samples in early stages of the infection. The goal was the possibility of detecting infected oil palms in early stages, which was successfully achieved with an overall accuracy rate of 97% (without false-negatives) when a k-NN-based classification model was used [58]. Ahmadi et al. took into account not only the HRS, but also the weather data (temperature, precipitation and relative humidity). Two datasets were generated under different weather conditions, the dry and rainy season respectively. The data processing was carried out by using various ANNs. The plants were classified into four groups, healthy and mildly, moderately and severely infected ones. It was possible to obtain 100% classification accuracy for the mildly infected palms that were not showing any visible symptoms, thus, achieving the goal of the early detection of BSR. An important observation concerns the fact that ANNs showed better performance in identifying the diseased palms rather than healthy ones, with the remark that although the studied healthy palms did not have BSR, they may have suffered from other diseases or stresses that influenced their spectral properties [59]. Azmi et al. used different types of SVM to identify disease symptoms. It should be noted that the authors studied a very large number of articles on the topic and presented their data in the form of a comparative table. Unlike other studies where the experiments were carried out on an oil palm plantation or nursery, this experiment was carried out in a greenhouse with artificial, constant conditions. In this study, NIR reflectance showed significant differences between the inoculated Ganoderma boninense and healthy subjects. The infection could be detected early even in the absence of physical symptoms of the disease using SVM classifiers with different numbers of NIR bands. It was mentioned that using a large number of bands provided high classification accuracy, while a lesser number of bands gave slightly less accuracy. The authors supposed that the developed method needs to be tested in an open environment in order to confirm its reliability for field usage, taking into account the peculiarities of work with sunlight angle, shade and weather conditions [60].
The Orange Spotting (OS) is an another oil palm disease, caused by the coconut cadang-cadang viroid (CCCV), which has killed over 40 million coconut palms only in the Philipinnes [61,62]. Currently, for oil palms this disease appears to be of minor importance. However, due to its high severity on coconut and other palms, it is being studied to prevent oil palm epiphytotics, which CCCV may cause in the future due to possible mutations. Interesting results were obtained by Selvaraja et al. studying OS on oil palm trees. Using a HRS dataset for various SVI, the authors discovered that OS could be detected in symptomatic oil palm trees. In an earlier study the authors were able to determinate oil palm trees with potassium stress from those with OS, which can be useful in oil palm plantation management [63,64]. Another group of authors conducted a number of studies, including the publication of a review article on various ANNs for plant disease detection using HRS [36]. On the subject of OS, the authors conducted and published a number of studies on SVI and ANN choice for disease determination, as well as chlorophyll content at the leaf scale of the diseased plants. The hyperspectral data of OS diseased and healthy oil palm seedlings was processed by five different ANNs for evaluation of four red-edge indices followed by the selection of spectral bands from the red edge (680–780 nm), with a result that a red-edge inflection point (at 700 nm) could serve as a good indicator of the plant stress caused by OS in oil palm seedlings [65,66]. A systematization of the reviewed materials is present in Table 1.
2.2. Hyperspectral Remote Sensing of Citrus Diseases
The citrus fruits, which are grown in more than 75 countries around the world, are an important commercial crop. The most threatening diseases in the citrus industry are citrus bacterial canker (CBC), caused by Xanthomonas citri [67,68], and citrus greening disease, also known as Huanglongbing (HLB), primarily caused by a bacterium, Candidatus liberibacter spp., spread by insects [69]. These bacteria interfere with the nutrient supply of citrus trees until the infected trees die. HLB’s diagnosis methods are mainly based on genetic methodologies, such as PCR. An effective and environmentally friendly method of treatment has not yet been found, and the only measure to slow down or reduce further infestation is to destroy the affected trees [70,71,72].
Various authors have published a number of articles devoted to the determination of HLB using HRS. Sankaran et al. used portable halogen lamps mounted on a platform to provide an additional illumination to citrus leaves in outdoor studies of HLB [73,74]. After several studies the authors achieved an average overall classification accuracy of 87% with a minimum number of false negatives, using SVM to analyze the dataset of healthy and diseased samples [75]. The effect of wind and the presence of HLB-infected leaves within the canopy were mentioned as an additional factor, which resulted in some spectral variations [73]. Li et al. used red-edge position in the field and laboratory experiments on Valencia and Hamlin orange cultivars to achieve a noticeable difference between healthy and HLB-damaged canopies. The indoor dataset achieved higher accuracy than the outdoor dataset (about 95% vs. about 90%) due to a better environment and more samples. Overall, different spectral feature analyses of different datasets were achieved between 43 and 95% accuracy [76]. Kumar et al. obtained more accurate results when using a multispectral rather than a hyperspectral camera (87% vs. 80% accuracy). The MTMF method proved to be the most successful for hyperspectral images, as was the SAM method for multispectral ones [77]. Weng et al. described the classification models for healthy, HLB-infected (asymptomatic and symptomatic) and nutrient-deficient citrus leaves of the citrus Unshiu and Ponkan, which achieved accuracies of 90.2%, 96.0% and 92.6% for the cool season, the hot season and the entire period, respectively, using LS-SVM. The authors have demonstrated the possibility of hyperspectral reflection imaging combined with analysis of citrus carbohydrate metabolism for the detection of HLB in different seasons and cultivars. The classification model developed for the Satsuma cultivar dataset was successfully used for HLB detection of the Ponkan cultivar by calibration model transfer, and obtained an overall detection accuracy of 93.5% with a low rate of false negatives [78].
A greatest success in early the detection of HLB was achieved by Deng et al., with a study on early non-destructive detection and grading of citrus HLB disease [79,80,81,82,83]. The research was able to provide three models of early diagnosis and the grading of HLB disease by taking advantage of the PLS-DA method, tested with a leave-one-out cross-validation strategy. In the third model established with preprocessed spectral reflectance data by Savitzky-Golay, the smoothing and first-derivative methods had the best discrimination, which achieved a prediction accuracy of no less than 92% on five kinds of leaf samples, and an overall classification accuracy rate of 96.4%. In subsequent works the authors used multiple machine learning algorithms (logistic regression, decision tree, SVM, k-NN, LDA and ensemble learning) to distinguish between the groups of healthy and HLB-infected (symptomatic and asymptomatic) samples, based on the reflectivity of leaves. In the three-group classification (healthy and symptomatic/asymptomatic HLB leaves), SVM achieved an accuracy of 90.8%, while in two-group classification (healthy and symptomatic HLB leaves) accuracy reached 96%. The results showed that a small number of bands is not enough for stable classification; meanwhile, 13 characteristic bands identified by the proposed method provided the best performance. The team continued the study, researching the possibility of determining HLB using two different hyperspectral cameras installed on a UAV. The pixel-level-based HLB classification accuracy was 99.33% for the training set and 99.72% for the verification set.
There are also two interesting studies on the successful (96–100% accuracy) early detection of decay in citrus using HRS. The fruit damage discussed in these publications was caused by Penicillium digitatum fungy. Although this topic relates more to the post-harvest crop storage than the plant diseases, we saw fit to mention these articles [84,85]. The systematization of the reviewed materials is presented in Table 2.
2.3. Hyperspectral Remote Sensing of Solanaceae Plant Diseases
The Solanaceae family, which includes tomatoes, potatoes, tobacco, peppers and other crops, is one of the most common vegetable crops, both in greenhouses and outdoors. There are a number of diseases affecting these crops, such as early and late blight [86,87], different viruses [88,89], bacterial and target spot [90] and others, that can cause serious losses to yields. Due to the high economic harmfulness of these diseases, it is very important to detect them at early stages in order to apply timely and proper control measures. This section highlights articles on the detection of such diseases using HRS, including their early detection.
Successful studies determining the pathogenic states of tomato plants using hyperspectral sensing have been undertaken by a number of research teams from different countries. Lu et al. studied yellow leaf curl virus and late blight caused by Phytophthora infestans, target spot caused by Corynespora cassicola and bacterial spot caused by Xanthomonas perforans on tomato leaves in laboratory conditions, using multiple spectral vegetation indices selected by PCA, and reached up to 100% accuracy, including early-stage detection [91,92]. Polder et al. investigated the possibility of detecting potato virus Y (PVY) with the CNN method and achieved 75–92% accuracy [93]. Griffel et al. used PLS-DA and SVM classification method to achieve 89.9% accuracy in PVY detection [94]. Van De Vijver et al. studied early blight caused by Alternaria solani in the Bintje potatoe variety with spectral analysis and reached up to 92% accuracy [95]. Abdulridha et al. studied yellow leaf curl, target spot and bacterial spot in tomato leaves of the Charger and FL-47 cultivars in field and laboratory conditions, using different vegetation indexes, and obtained accuracies of 94–100% for determining different diseases from each other and 98–100% for determining healthy from diseased plants [96,97]. Zhang et al. investigated late blight on potatoes using HS image processing with MNF and SAM and successfully detected the disease with unmentioned accuracy [98]. Fernandez et al. studied late blight on Shepody cultivar potatoes with different spectral indices applied in the 400–900-nm diapason and achieved 85–91% accuracy [99], and used the same method in red and red-edge diapasons (660–780 nm) with 89% accuracy [100]. Krezhova et al. used methods of statistical and derivative analyses to detect tomato spotted wilt virus (TSWV) on the tobacco cultivar Samsun NN. At the asymptomatic stage the differences in reflectance spectra were statistically significant [101]. Xie et al. detected early and late blight [102] and gray mold [103] on tomato leaves of the Zheza 809 cultivar. They used an ELM classifier model for late and early blight and a k-NN model for gray mold, with the former achieving 94 to 100% accuracy, while between 44 and 66% accuracy was achieved for detecting asymptomatic gray mold diseased tomato leaves, 1 day past inoculation.
All of the authors managed to achieve a stable definition of the symptoms of the diseases in the visible stages. Most of the experiments were carried out in the field. The articles [96,97] should be noted separately, as the field experiments in these studies were duplicated by laboratory ones, as recommended in [29,30,31], and we suppose that it was why the authors achieved the best results in the accuracies of determining both various diseases and the differences between healthy and diseased plants.
Wang et al. presented two studies on the early detection of TSWV on sweet pepper with CNN analysis of HRS data. In the first study, the authors processed hyperspectral shots taken with a camera in the range of 400–1000 nm under laboratory conditions with a new GAN architecture, named as OR-AC-GAN. For the pixel-level classification, the false positive accuracy rate was 1.47% for healthy plants [104,105]. In second study the OR-AC-GAN was further improved and achieved a result in of 96.25% accuracy in the early detection of TSWV before visible symptoms showed up. The statistic results from the proposed OR-AC-GAN model were superior to the results of direct CNN model and AC-GAN model [105]. Gu et al. also successfully detected TSWV on tobacco in the early stages using three wavelength selection methods (SPA, BRT and GA), and four machine learning techniques (BRT, SVM, RF and CART). Among the selected bands, most were located at the NIR region (780–1000 nm). The models built by the BRT algorithm using the wavelengths selected by SPA obtained the best overall accuracy of 85.2% [106]. Zhu et al. studied tobacco mosaic virus (TMV) on tobacco of the MS Yunyan 87 cultivar. It was shown that it is possible to detect the TMV disease in the range of 450 to 1000-nm wavelengths with the usage of different machine learning algorithms, i.e., SVM, BPNN, ELM, LS-SVM, PLS-DA, LDA and RF. Most of the classification models showed acceptable results, while the identification rate was greater than 85%. The distinction between the healthy tobacco leaves and diseased ones resulted in classification accuracies of up to 95% with the BPNN and ELM models. [107,108]. Morellos et al. studied the early detection of tomato chlorosis virus (ToCV) in Belladonna cultivar tomato plants. The NCA algorithm was used for the effective wavelengths and most important SVI selection. The XY-F network and MLP–ARD ANN detected the ToCV infection and its severity level, scoring an overall accuracy of over 85%, with MLP–ARD performing generally better than XY-F [109].
Bienkowski et al. studied the possibility of the early detection of late blight and black leg and a variety of soilborn diseases (R. solani, C. coccodes and S. subterranea) on five different potato cultivars, Maris Piper, Estima, King Edward, Desiree and Mayan Gold, using either PLS and BPNN in greenhouse and field experiments. Unfortunately, the authors did not specify the phenotypic and genotypic differences of the cultivars or whether there was a difference in the important wavelengths for each cultivar. The models detected and distinguish diseases with obvious symptoms, even asymptomatic ones, correctly classifying the spectra from the greenhouse experiments with an accuracy of 84.6%. When the diseases were analyzed separately, the models were able to distinguish between the healthy and asymptomatic spectra leaves, plus three kinds of late blight with an accuracy of 92%. Models constructed with whole-plant reflectance data from the field had less accuracy [110].
Franceschini et al. studied early and late blight detection in three different tomato cultivars, Raja, Connect, and Carolus, with different degrees of resistance to late blight. Both UAV and ground-level data were used, including leaf analysis of chlorophyll content and canopy height. The important bands were chosen due to their importance in describing changes in the biochemical and biophysical traits of vegetation at the leaf and canopy levels. The relationship of leaf and vegetation pigment content was found to be less important than changes associated with structural traits. It was possible to identify considerable spectral changes related to late blight at early stages in between 2.5 and 5.0% of affected leaf area. The authors mentioned that the characteristics of different potato cultivars may potentially affect the spectral response, and they recommend considering it in future studies [111].
Gold et al. investigated the pre-symptomatic detection and differentiation of late blight and early blight in potato on four different potato cultivars: Katahdin, Snowden, SP951 and russet Burbank. The authors mention that cultivar features had a strong influence on spectral reflectance, but not on the visible reflectance range alone. The cultivars differed biochemical and physiological indices at different time stages of disease. The spectral responses of the four potato cultivars to infection were very different, yet they had important commonalities that made discrimination easier. Using the RF, PLS-DA, PCoA and NDSI approaches, the authors could distinguish the infected plants with greater than 80% accuracy two–four days before visible symptoms appeared. The individual stages of disease development for each pathogen could be distinguished from the corresponding control samples with accuracies of 89–95%. The authors reported that they could distinguish latent Phytophthora infestans from both latent and symptomatic Alternaria solani infection with greater than 75% accuracy. The spectral characteristics important for the detection of late blight changed during infection, while the spectral characteristics important for the detection of early blight remained unchanged, reflecting the different biological characteristics of the pathogens concerned. The authors mentioned that phenolics concentration may be important for detecting symptomatic late and early blight infections. Finally, the authors reported their belief that this study establishes that the host genotype has a significant influence on spectral reflectivity and, therefore, on the biochemical and physiological characteristics of plants exposed to infection by pathogens. [112,113]. A systematization of the reviewed materials is presented in Table 3.
2.4. Hyperspectral Remote Sensing of Wheat Diseases
In the world’s agriculture, wheat occupies a leading place; it is cultivated almost everywhere and is of great importance for the population of the entire globe. There are a number of harmful diseases, mainly of micromicetal origin, affecting this crop, such as scab caused by Fusarium graminearum and other Fusarium spp., yellow rust caused by Puccinia striiformis, brown rust caused by Puccinia triticina, powdery mildew caused by Blumeria graminis f. sp. tritici and others, which can cause serious losses to the yield [114,115,116]. Due to the importance of wheat there are many articles dedicated to the detection of its diseases with HRS. In this this review, we concentrate on articles describing the most researched diseases of one crop, namely wheat Fusarium head blight (FHB) and wheat yellow rust (YR).
FHB or scab is a serious disease of cereal crops, such as wheat, rye, barley and oat, that may also affect other crops [117,118]. Affected grains rapidly lose mass and shrink, which results in high crop losses and quality reductions [119,120,121]. Fusarium genus fungi may produce dangerous mycotoxins that are harmful for humans and animals. These mycotoxins accumulate in living organisms and can enter the human diet along the food chain [122,123]. Due to the high economic and health harmfulness of this disease, it is very important to detect it at the early stages in order to apply timely and proper control measures. There are many species in the Fusarium genus, and their influence on host plants differs significantly in different environments, complicating the task of determining them.
The studies on determining FHB on wheat using HRS have been undertaken by a number of research teams from different countries. Delwiche et al. first studied the detection of FHB in three different wheat cultivars: Grandin, Gunner and oxen, reaching detection 83–98% accuracy. The models developed for just one variety were useless when applied to other varieties [124]. Barbedo et al. determined FHB (F. graminearum and F. meridionale) on wheat kernels with over 91% accuracy [125]. Mahlein et al. studied the F. graminearum, isolate S.19 and F. culmorum isolate 3.37 infestation on seven different wheat cultivars that had different resistances to the disease: Thasos, Triso, Passat, Scirocco, Chamsin, Taifun and Sonett (Descriptive List of Varieties, Bundessortenamt, Germany 2017). Using SVM, it was possible not only to differentiate between healthy and infected samples with accuracies of more than 76%, but to differentiate between F. graminearum and F. culmorum. The authors found it possible to use HRS for wheat FHB resistance phenotyping [126,127]. Ma et al. applied CWA in the detection of F. graminearum and obtained an overall accuracy of 88.7% [128]. Huang et al. obtained a detection accuracy of 75% with SVM optimized with a genetic algorithm, using correlation analysis and wavelet transform for the selection of important bands, vegetation indices and wavelet features [24]. Zhang et al. developed a new Fusarium disease index (FDI) after determining the best index from the existing indices with PLS regression, reaching 89.8 accuracy in detecting F. graminearum [129,130]. Whetton et al. studied FHB in the laboratory and field in the wheat cultivar Solstice, using PLSR to determine FHB from yellow rust in wheat and barley [131,132].
Baurigel et al. determined F. culmorum at early stages on wheat cultivar Taifun. The diseased and healthy wheat ear tissues spectra were differentiated with PCA. The authors noticed that spectral changes during disease development were based on variations in the content of carotenoids (500–533 nm) and, especially, that of chlorophylls (560–675 nm and 682–733 nm). Furthermore, spectral variations in the range of 927–931 nm reflected differences in the tissue water contents of healthy and diseased plant tissues. It was mentioned that the detection of FHB in the earliest stages is impossible due to missing symptoms. However, it was possible to detect FHB in later stages with the SAM method, with 91% accuracy. The mean detection accuracy was 67% during the whole study period (BBCH 65–89) [133].
Yellow rust (YR), in cereals, is a dangerous disease that can result in more than 60% yield shortage from outbreaks. The causative agent of YR is the mushroom Puccinia striiformis west, which affects more than 20 species of cultivated and wild cereals, including wheat, rye, triticale, barley and others. Until recently, the disease was of regional importance throughout the world. In 2000, the area of the pathogen expanded and its harmfulness increased [134,135,136,137]. Presently, YR epidemics can lead to extremely severe crop losses. It is very important to detect YR at the early stages in order to apply timely and proper control measures [138,139].
There are many studies dedicated to determining YR in wheat using HRS that have been undertaken by a number of research teams from different countries. Huang et al. used PRI to detect yellow rust in three different wheat cultivars, Jing 411, 98–100 and Xuezao, all differently resistant to yellow rust [140]. Zhang et al. studied another three cultivars, Jingdong8, Jing9428 and Zhongyou9507, and analyzed the relationship between nutrient stress and yellow rust injury, resulting in PhRI being the only index sensitive to yellow rust disease at all growth stages [141]. Krishna et al. used PLS, ANOVA and MLR to determine important bands and detect yellow rust with 92–96% accuracy. It was shown that the wheat crops affected by yellow rust have various symptoms and distinct spectra as compared with healthy ones [142]. Zhang et al. applied DCNN and RF to UAV data, wherein identification of the diseased and healthy plants was done by assessing NDVI data, reaching an overall accuracy of 85% [143]. Guo et al. used SVI (NRI, PHRI, GI and ARI) and spectral and textural features of hyperspectral images for YR detection in the wheat cultivar Mingxian 169, which is moderately susceptible to YR. The important bands were selected with SPA. During the research of wheat YR with UAV, the spatial resolution had lesser influence in the SVI methods, but significantly influenced the TF-based methods. The total YR detection accuracy in both studies was up to 95.8% [144,145]. Whetton et al. studied YR in the laboratory and field on the wheat cultivar Solstice using PLSR to determine FHB from yellow rust in wheat and barley [131,132].
The early detection of wheat YR was achieved by Bohnenkamp et al. who used two platforms with two different hyperspectral cameras: a ground-based vehicle (1–2-m height) and an UAV (20-m height). The data from the JB Asano cultivar, susceptible to YR, and the Bussard cultivar were analyzed with SAM and SVM to detect wheat YR. The most interesting moment in this study was the comparison of the hyperspectral data of the wheat canopy at the ground and UAV scales [146]. In another study Bohnenkamp et al. considered an interpretable decomposition of a spectral reflectance mixture under controlled laboratory conditions, studying a method of detecting and distinguishing between brown rust and yellow rust on the leaves of the wheat cultivars Taifun and Catargo. In this study, the authors took a very interesting approach to detecting spectral portraits of the pathogens themselves, studying the possibility of detecting YR uredinium on the surface of a wheat leaf, which made it possible to detect the disease at an early stage [147].
Zheng et al. were also able to solve the problem of early YR detection, continuing the research from [140] on the cultivars Jing 411, 98–100 and Xuezao, each differently resistant to yellow rust, by evaluating multiple different SVIs with LDA. Among those indices, SIPI, PRI, NDVI, PSRI, ARI, MSR, GI and NRI showed great potential for discriminating yellow rust disease in different growth stages, and PRI (570-, 525-, 705-nm ranges) for the early-mid stage and ARI (860-, 790-, 750-nm ranges) for the mid-late growth stage, were selected as the best spectral indices for monitoring yellow rust disease in wheat, with up to 93.2% classification accuracy [148]. A systematization of the reviewed materials is presented in Table 4.
2.5. Hyperspectral Remote Sensing of Other Crops and Their Diseases
A number of articles devoted to the early detection of diseases in various crops should also be mentioned, if without detailed analysis. These articles describe the detection of diseases such as: red leaf blotch on almond caused by Polystigma amygdalinum [149]; black sigatoka on bananas caused by Mycosphaerella fijiensis [150,151]; barley blast caused by Magnaporthe oryzae [152]; grapevine leafstripe [153]; grapevine leafroll caused by Grapevine leafroll-associated virus 3 [154]; verticillium wilt of olive caused by Verticillium dahliae [155,156]; Xylella fastidiosa disease on olive trees [157]; peanut early leaf spot caused by Cercospora arachidicola S. Hori and late leaf spot caused by Cercosporidium personatum [158]; peanut bacterial wilt caused by Ralstonia solanacearum [159]; charcoal rot on soybean caused by Macrophomina phaseolina (Tassi) Goid [160] and corn leaf spot caused by Phaeosphaeria maydis (Henn.) [161].
2.6. Summary
The reviewed works prove the possibility of detecting oil palm [36,50,51,52,53,54,55,56,57,63,64,65,66], citrus [73,74,75,76,77,78], Solanaceae family crops [91,92,93,94,95,96,97,98,99,100,101,102,103] and wheat [24,124,125,126,127,128,129,130,131,132,140,141,142,143,144,145] diseases using HRS.
The possibility of detecting oil palm [58,59,60], citrus [79,80,81,82], Solanaceae family crops [104,105,106,107,108,109,110,111,112,113] and wheat [133,146,147,148] diseases at an asymptomatic, early stages was also proved.
Due to the peculiarities of oil palm and citrus crops, most of the experiments concerning these cultures were carried out in the field, except the research from Azmi et al. [60], which was conducted in a greenhouse under constant conditions, and of Li et al. [76] and Weng et al. [78], who conducted laboratory tests.
From Table 1 and the articles cited [56,57,60], it can be concluded that the most convenient range for detecting oil palm diseases is the interval from 600 to 950 nm, in which most of the authors’ were able to confidently determine the symptoms of oil palm diseases, including those in early stages. However, a strong scatter in the definition of important waves in various works allows us to conclude that there are unaccounted factors influencing their manifestation and thus selection. The specific BSR disease progression and its control methods also can influence the research direction. Therefore, it might be interesting to collect more data from oil palm seedlings in nurseries, laboratories and greenhouses, to avoid planting diseased seedlings.
From Table 2 it is obvious that the spread of the important waves for determining the diseases of citrus plants is even greater than in the case of the oil palm. The reason may be the physiological difference caused by the varietal diversity of citrus crops and various abiotic factors, which are mentioned in [76,78]. The study [78] describes the differences in the spectral portraits of different citrus cultures and the possibility of using the classification model developed for the Satsuma cultivar for HLB detection in the Ponkan cultivar by calibration model transfer. It would be interesting to apply similar technologies to other varieties of citrus fruits and other crops for which it is possible to identify diseases using HRS. It would also be interesting to conduct studies comparing the spectral portraits of different varieties and species of citrus fruits and detecting their abiotic stresses using a hyperspectral camera. A study of not only citrus tree canopies but also the citrus fruits themselves, as in the work of Qin et al. [162], is perhaps also an interesting and promising direction.
From Table 3, we can conclude that, at the moment, it is difficult to identify universal band ranges associated with certain diseases of Solanaceae family plants, even in the same culture. This may be related to the observations mentioned in [112,113], that the spectral responses from different cultivars are highly variable and that the host genotype has a significant impact on spectral reflectance, and, thus, on the biochemical and physiological traits of the plants undergoing pathogen infection. It is noteworthy that, in study [110], the authors did not mention the differences between spectral responses from the different cultivars that they describe. Meanwhile, judging by the data from [163], the described cultivars have phenotypical differences, which, theoretically, should entail a difference in the types of chlorosis caused by the studied diseases and, accordingly, in their spectral responses. These facts open up a large field for further studies of diseases in Solanaceae crops using HRS. It is probably necessary to pay more attention to the study of plants’ phenotyping and abiotic stress diversity using HRS, in order to subsequently facilitate the task of identifying those band ranges that are important for the early detection of Solanaceae-infecting diseases. We also believe that the search for patterns in spectral responses from different cultivars should start from those most similar in genotype and phenotype, thereafter studying more different ones. It will probably be possible to create data processing algorithms for the adaptation of ANNs trained on certain cultivars of Solanaceae crops to other varieties, different from them, as mentioned in [78]. It would be expedient to focus efforts on laboratory research and industrial greenhouses, since this will eliminate or significantly reduce the influence of abiotic factors on experiments, which, in the future, will create a basis for obtaining stable, repeatable results in field experiments.
From Table 4 we can see that, at the moment, as in the case of Solanaceae it is difficult to identify universal band ranges associated with certain diseases of wheat. It should be noted that in articles dedicated to wheat disease detection with HRS from all other crops, the authors pay the greatest attention not only to the variety of cultivars of the studied culture, but also to the factors of plant resistance and pathogen diversity and take into account their possible influences on the results of their experiments [124,125,126,127,131,132,133,140,141,145,146,147,148]. We also want to note an interesting approach to detecting the spectral portraits of YR pathogens themselves, described in [147]. In general, the analysis of articles devoted to wheat diseases—As the most studied crop—Allowed us to finally identify the main gaps in the field of early detection of plant diseases with HRS.
3. Discussion
We believe that, due to the lack of interaction between specialists in engineering and biology, there is a significant gap in the scientific basis for planning an experiment to use remote sensing data in determining plant state. Although the review above demonstrates the practical possibility of late and early detection of plant diseases using HRS, it also reveals differences in the technical results (range of important bands) between researchers, which indicates an insufficient study of the experimental methodology, as can be seen from Table 1, Table 2, Table 3 and Table 4.
As a result of hyperspectral remote sensing, for each pixel of a scene, we get a random vector, which can be considered the result of a random experiment. The outcome of a random experiment can be favorable or unfavorable, which is associated with the detection or non-detection of a disease in the space reflected by a particular pixel. Accordingly, these vectors can be processed by methods developed in the theory of probability and in mathematical statistics, which make it possible to effectively determine the characteristics of a random experiment. In this case, the tasks of data normalization and the allocation of those frequency bands (important bands) that make the greatest contribution to the outcomes of experiments (favorable or unfavorable) and, accordingly, are the most informative for identifying diseases, can be solved. The selection of important bands is a critical step in the detection of plant diseases using HRS. As a rule, data normalization is carried out first to get rid of noise. Then, various algorithms are applied to identify important bands, such as Savitzky–Golay filtering [50,51,58,81,82,83,99,100,109,131,132,147]; the Mann–Whitney U test [52,54]; coefficient of variation [60]; PCA [74,76,79,92,95,99,109,133]; SPA [78,102,106,107,108,144]; GA and BRT [106]; SAM [112,113,129,146].
The listed algorithms make it possible to achieve the determination of important bands. Various methods of machine learning allow achieving a fairly high accuracy in identifying diseases (between 60 and 95% accuracy) based on those data. However, from Table 1, Table 2, Table 3 and Table 4, we can conclude that even under very similar experimental conditions—For example when studying oil palms—Different sets of important bands are obtained at the output, often with a spread of more than 100 nm [52,53,54,55,56,57,58,59,60]. Xie et al., in [103], used five different algorithms to select important bands, taken from five different studies: t-test [164], Kullback–Leibler divergence [165], Chernoff bound [166], receiver operating characteristics [167] and the Wilcoxon test [168]. It is noteworthy that, in 4 tests out of 5, only 1 frequency out of 15 matched closely. In this case, the scatter of the ranges of all initially selected important bands was in the range from 400 to 850 nm, (400, 402, 403, 411, 413, 418, 419, 420, 422, 473, 642, 690, 722, 756 and 850 nm), i.e., practically in the entire range of the used sensor (380–1020 nm).
Based on the data from Table 1, Table 2, Table 3 and Table 4, we assume that, in the experiments on the same section of a field, repeated in different years or seasons, different important bands will likely be allocated when using automatic selection methods. Unfortunately, at the moment it is not possible to test this theory, since there are very few articles in which such experiments would be described.
Summarizing the topic of choosing the important bands for plant disease detection, we assume that it would be logical to focus on studying the bands of biochemical changes occurring in diseased plants and screening out the bands not related to the given disease, rather than using machine learning.
To successfully conduct the biological component of experiments on the HRS of plant diseases, it is necessary to understand that plant diseases are a particular case of plant stress. Plant diseases are processes that occur in plants under the influences of various reasons and which lead to their oppression and decreased productivity. Plant diseases are divided into two main groups: infectious and non-infectious [29,30]. The infectious plant diseases are caused by microorganisms (mainly fungi, bacteria, viruses and nematodes) or parasitic plants. The non-infectious diseases can be caused by genetic disorders or physiological metabolic disorders resulting from unfavorable environmental conditions [29,30]. Plant diseases almost always have visible symptoms that we can observe in a certain spectral range. In their early stages, such symptoms appear in the form of various chloroses or, less often, necrosis or pustules, with a huge variety of manifestations [169,170]. In the case of an asymptomatic course of the disease in its early stages, for example barley Ramularia disease caused by Ramularia collo-cygni [171], Fusarium head blight of different cereals caused by Fusarium culmorum [133] or soybean Sudden death caused by Fusarium virguliforme [172], early detection by remote sensing can be challenging.
Plant stress is a state of the plant in which it is influenced by unfavorable abiotic (light, heat, air, humidity, soil composition and relief conditions) and biotic factors (phytogenic, zoogenic, microbogenic and mycogenic). Plant responses to both abiotic and biotic stress is usually complex and includes both nonspecific (common for different stressors) and specific components. In a state of stress plants stop their growth, sharply reduce the activity of their root systems and reduce the intensity of photosynthesis and protein synthesis [173,174,175]. In a significant number of stressful situations, an immune response causes an increase of certain metabolites content, such as jasmonates or salicylates [175,176,177,178,179,180]. These reactions can be detected using hyperspectral sensors [181,182,183,184,185,186,187,188]. The study of plant stress using hyperspectral sensors is presented in a number of works [189,190,191], including those comparing the spectral portraits of plants simultaneously exposed to biotic and abiotic stress [192,193,194,195]. It is necessary to take into account many abiotic factors in addition to the possible influence of pathogens to accurately determine the reasons for stress manifestation [59,60,63,73,78,92,98,112,113,124,126,127,133,141]. Our analysis indicates that there is no unified methodology for conducting hyperspectral studies of plant diseases that takes into account the influence of abiotic factors. That is why we believe it is best to carry out experiments in laboratory conditions or in industrial greenhouses in order to partially or completely eliminate abiotic factors. Attempts to create various mobile vehicles operating at ground level whose purpose is to replace natural light sources with artificial light when using hyperspectral sensors in field experiments are described in [73,74,75,92,94,123]. This solves one of the main problems associated with the inhomogeneity of the solar spectrum due to changing weather conditions. Nevertheless, this approach cannot completely solve the problem of the influence of abiotic factors.
It would also be interesting to continue studies describing the definition of the phenotype and/or genotype of a plant and its influence on changes in the spectral portrait thereof [196,197,198,199,200,201]. Several studies reviewed describe that the host plant genotype has a significant impact on spectral reflectance and on the biochemical and physiological traits of the plants undergoing pathogen infection [76,78,110,111,112,113,124,126,127,140,141,147,148]. Therefore, it is very important to indicate the culture and cultivar of the studied plants. The exact indication of pathogens used for inoculation is also very important. We believe that comparisons of the spectral portraits of plants of different cultivars of the same crop is a primary task in creating a general methodology for detecting plant diseases using hyperspectral sensors. It is possible that the influence of chlorophyll fluorescence on the spectral portraits of plants and their related SVI may be a significant contribution to the solution of this problem [155,202,203,204,205]. Success in this area may allow the creation of patterns for determining phenotypes and plant cultivars within one crop, which will become the basis for a database of hyperspectral portraits of plants.
If we can confidently detect different types of plant stresses and distinguish plants infected with pathogens from healthy one and/or those affected by abiotic stresses, we can study the influence of the genotypic characteristics of a pathogen on the spectral profile of an infected plant. To do this, it is necessary to identify the differences between plants of the same phenotype as affected by pathogens with different genotypes. Since, for many pathogens, primarily micromycetes, the intrageneric and even intraspecific diversity is extremely high, it is necessary to investigate the possible differences in the spectral manifestations of symptoms, for example, between different species of fungi of the genus Fusarium or between different races of the brown rust pathogen (Puccinia triticina). The aim of such experiment will be to study the effect of the phenotypic and genotypic diversity of pathogens on the variability of spectral portraits of host plants. The visual manifestations of symptoms of yellow rust (Puccinia striiformis) caused by different races or different strains of Fusarium graminearum are often very similar. In the early stages of the disease, chlorosis caused by pathogens of different species may have similar spectral portraits, which become more distinguishable in the later stages of the disease, and, thus, is also an important direction for research [91,92,96,97,102,103,110,111,112,125,126,127,131,132]. The influence of plant resistance on the symptomatology of pathogenesis and works describing the difference in the data obtained in such cases is also worth mentioning [110,111,112,113,126,127,132,140,141,144,145,146,148]. The determination of resistant cultivars using hyperspectral sensing is also a promising area of research with great applied potential [126].
One more direction, which is important for the early detection of plant diseases using HRS, is the study of spectral portraits of pathogens themselves. Unfortunately, this is only possible for a small number of diseases, such as wheat powdery mildew caused by Blumeria graminis and wheat yellow rust of wheat caused by Puccinia striiformis, which show characteristic external symptoms in the early stages. Usually, these are diseases of fungal origin, where the object of detection is micromycete mycelium or spores on the leaf surface of a diseased plant. Disease detection by this method is considered in the example of wheat yellow rust, using pure fungal spore spectra as reference [147].
Pest control is also an important aspect of plant protection. We hypothesize that HRS can also be used to early detect such dangerous pests as the Colorado potato beetle (Leptinotarsa decemlineata), sunn pest (Eurygaster integriceps) [206], or western corn rootworm (Diabrotica virgifera virgifera), using spectral portraits of imago and different ages of larvae. Currently, a small number of works have been published on this topic [191,206,207,208,209,210], but we consider this direction to be very promising, especially for use in industrial greenhouses. Another possible direction of research is the detection of local outbreaks of pests outside farmlands, for example, locusts (Acridoidea) or beet webworms (Loxostege sticticalis), in order to eliminate them early before these pests can cause damage to yields.
We believe that the effect of biochemical changes in plant tissues is critical for the early detection of plant diseases using passive sensors. The reflectance of light from plants leaves is dependent on multiple biophysical and biochemical interactions. The VIS range (400–700 nm) is influenced by pigment content. The NIR range (700–1100 nm) is influenced by leaf structure, internal scattering processes and by the light absorption by leaf water. The SWIR range (1100–2500) is influenced by chemicals and water composition [196,211,212,213,214,215,216].
The most investigated areas in this topic are the determination of changes in the content of water, nitrogen (N) in plants, as well as of chlorophyll or carotenoids, using various SVIs, which can be used to detect plant diseases. These techniques can be used to determine the nitrogen content of plants [217,218,219] and to detect plant stresses and diseases [56,57,78,220,221,222], including the early detection of plant diseases and pest infestations [147,154,156,157,223].
The topic of detecting individual chemical elements or chemical compounds, including volatiles, in plants is a less studied problem. In plant physiology, such elements are of great importance, such as nitrogen (N), one of the key components for chlorophyll; phosphorus (in the monovalent orthophosphate form H2PO4−), a key macronutrient; potassium (K+), influencing leaf color; calcium (Ca2+), which plays a fundamental physiological role in leaf structure and signaling; magnesium (Mg2+), an essential macronutrient for photosynthesis (as it is the central atom of chlorophyll); sulfur (S), in the form of sulfate; iron (Fe2+ or Fe3+), copper (Cu2+), manganese (Mn2+) and zinc (Zn2+), which are essential elements for plant growth and components of many enzymes; and the ions responsible for salination: Na+, K+, Ca2+, Mg2+ and Cl− [216]. The detection of these elements by HRS can be a key factor for identifying plant diseases at an early stage, since plant diseases are accompanied by a deficiency of some of the listed elements, which is the cause of chlorotic and necrotic changes in plant tissues [216]. Unfortunately, this task is difficult and poorly studied, but the following works prove the possibility of determining the chemical composition of plants in the VIS, NIR and SWIR ranges. Pandey et al. detected a wide range of macronutrients, namely N, P, K, Mg, Ca and S, and micronutrients, namely Fe, Mn, Cu and Zn, in maize and soybean plants [224]. Zhou et al. detected cadmium (Cd) concentrations in brown rice before harvest [225]. Ge et al. tried to analyze chlorophyll content (CHL), leaf water content (LWC), specific leaf area (SLA), nitrogen (N), phosphorus (P) and potassium (K) in maize using different SVIs but succeeded only with CHL and N [226]. Hu et al. proved to determine the content of Ca, Mg, Mo and Zn in wheat kernels [227].
The most difficult and interesting direction is the detection of the content of not individual elements, but more complex chemical compounds using HRS. As an example of such works, one can cite the articles by Gold et al., where the mechanisms of physiological changes in potato plants were considered when inoculated by Alternaria solani and Phytophthora infestans pathogens in the analytical example of the contents of foliar nitrogen, total phenolics, sugar and starch [112,113]. Fuentes et al. monitored the chemical fingerprints of different leaf samples and studied the correlation of aphid numbers in wheat plants with the presence and quantity alcohol, methane, hydrogen peroxide, aromatic compounds and amide functional groups compounds [228]. The paper [228] presented results on the implementation of SWIR HRS (1596–2396 nm) and a low-cost electronic nose (e-nose) coupled with machine learning. The authors believe that such study of plant physiology models open their use to assessing models of other biotic and abiotic stress effects on plants. Thus, the search for plant diseases at early stages using passive sensors, including hyperspectral ones, should be carried out in three main directions: the search for the characteristic immune response of the host plant to the pathogen, the search for characteristic symptoms of plant damage by the pathogen or the search for spectral portraits of the pathogen or pest itself. It is always necessary to take into account other stress factors affecting the spectral portrait of a diseased plant, which will allow us to accurately determine plant diseases using passive remote sensing.
Further development of experiment planning should be considered, preferably using a common methodology, so that there is an opportunity to adequately compare the results. An experiment tree, which will consider the physiological parameters of the plant should be designed [229]. All phases of the experiment should be considered and planned in advance, on the basis of the science of experiment planning, which is sufficiently well developed for applied physical research, based on the methods of probability theory and mathematical statistics. The following research phases for each type of sensors should be developed: laboratory research in deterministic conditions of deterministic parameters; the allocation of spectral bands responsible for certain parameters of plants (including diseases) in laboratory experiments; repetition (possibly multiple) of a laboratory experiment to collect statistics and validate; transfer of the experiment to field conditions to verify the correctness of the selected spectral bands. Such planning of experiments and the creation of a methodology for conducting them fills in the gaps associated with the lack of consideration of such factors as: different phenotypes of plants and their different spectral responses; various diseases and also their different spectral responses; the need to create and take into account a model of light propagation from an irradiating source to normalize hyperspectral imagery data [229,230,231,232].
It would be interesting to see more data comparing datasets collected from the same crops with different models of hyperspectral sensors. There are several articles that mention the use of two different sensors during the same experiment [76,80,147], but there is no data on how sensor model can affect data variability. The different types of hyperspectral sensors, i.e., spectroradiometers and hyperspectral cameras, have their own strengths and weaknesses, and experiments are needed to compare the results obtained from their usage. It is mentioned that a spectrometer device has a limitation when compared with a camera, where it can only take one reading per time for a small sample point, thus requiring a longer duration of data collection [60], but this should not affect the outcomes of experiments. It is assumed that the spectral portraits of plants should be the same regardless of the sensor model and type, which should allow developing a unified platform for the early detection of plant diseases. We believe that it is also possible, together with the use of hyperspectral sensors, to use active sensors in laboratory studies, which are successfully used to determine plant diseases, such as Raman spectrometers [233,234]. Comparison of spectral portraits obtained from the same samples using two different types of sensors may help to understand which factors most strongly affect hyperspectral portraits and to either make appropriate changes to the experiments or to create algorithms for correcting hyperspectral portraits. Such approach was used by Mahlein et al. in study [127], wherein HRS data are compared with those of chlorophyll fluorescence and thermal sensors, and by Fuentes et al. in study [228], wherein an electronic nose was used to determine the content of certain volatile chemical compounds to refine the HRS data in a SWIR diapason.
We have summarized the available data in a pivot table (Table 5), from which the following conclusions can be made. Spectrometers used without a connection to a photo camera have the least efficiency, both in obtaining a high percentage of detection of diseased plants and in determining the early stages of diseases. However, when used in conjunction with a photo camera, their effectiveness increases significantly. Hyperspectral cameras have the highest percentage of use for early detection and good results in obtaining a high percentage of detection of diseased plants. We can conclude that these results indicate that it is better to use hyperspectral cameras or a combination of a photo camera and a spectrograph to study plant diseases in the early stages. In the future, it is possible to switch to using a combination of a photo camera and a spectrograph for practical purposes, since this solution is economically more profitable.
The topic of HRS under consideration is quite new, so we did not add to this comparative analysis table (Table 5) data on the number of articles in which, from our point of view, the technical and physical parts of an experiment are correctly stated, which is the subject of a separate discussion.
We hope that the analysis carried out in this review of the main errors and gaps will help solve problems regarding experiment planning and undertaking.
The main disadvantage (which should be mentioned separately, since almost all the articles under consideration contain it) is the lack of repeatability in the experiments performed. It is critical for scientific validity to run an experiment at least twice. If we are talking about a field experiment, then a repeated experiment is carried out, as a rule, in the next growing season. In the laboratory, the experiment is carried out at least twice, and the test of the effectiveness of training any AI algorithms used by researchers should be carried out on a second dataset without additional training. Only if such experiment is successful can we talk about the scientific nature of the results thereof and its success in detecting plant disease. We also want to repeat the importance of understanding the physiology of the processes occurring in a diseased plant, since, from our point of view, the chemical composition of the tissues of diseased plants is of primary importance for the selection of the ranges of important bands for determining disease. These ranges should be very similar for phenotypically similar plants of the same species, however, from Table 1, Table 2, Table 3 and Table 4 it can be seen that there are practically no exact matches of important bands. In any case, we believe that such coincidences are insufficient.
Additionally, as we have mentioned earlier, the methods of analyzing the data obtained (machine learning, neural networks, statistical analysis, manual analysis), in our opinion, are only methods of automation that do not make a significant contribution to solving the problem of the early detection of plant diseases with HRS [90,91,92,93,94,97,105,142,143].
The definition of plant diseases with remote sensing cannot be considered in isolation from other parameters and related factors—i.e., the phase of plant development, phenotype, multiple external factors. Therefore, the main task that needs to be addressed when using hyperspectral imaging for early detection of plant diseases, in our opinion, is the application of a systematic approach. That is, determining the place in a complex natural–technical system at which it is necessary to analyze the elements of the system and their interrelationships within the framework of a specific organizational structure to detect violations of this structure (that is, plant parameters violations during development).
Summing up our review, we would like to point out the articles that, in our opinion, best describe certain aspects of this problem in relation to various plant crops [35,60,76,78,79,80,104,105,109,110,113,126,127,133,146,147,192,203,213]. We would especially like to acknowledge the work of a team of authors from the Institute of Crop Science and Resource Conservation (INRES) Plant Diseases and Plant Protection, University of Bonn [2,35,126,127,146,147,182,196,197]. We believe that these works are the most relevant, the most widely disclosing of the topic and which offer the greatest number of interesting solutions and new approaches.
4. Conclusions
At the moment, a sufficient number of articles are available in the field of using HRS to conduct successful experiments for the early detection of plant diseases. From the articles reviewed, it is also clear that the usage of machine learning methods for early detection requires a significant HRS source data of plant diseases.
We have made a number of assumptions about possible knowledge gaps preventing the successful replication of experiments in plant disease detection using HRS. Differences in spectral portraits can be caused by various abiotic and biotic factors that cause plant stress. The manifestation of disease can also be influenced by the phenotype or genotype of the host plant, which determine the level of plant resistance. The presence of a mixed infection may also be an important factor influencing the spectral portrait. Finally, last but not least, it is important to understand the biochemical changes that occur within the plant during stress, in what wave range they manifest themselves and how they may affect the spectral portrait of the plant.
In terms of technical and physical aspects, it is necessary to consider the propagation model of sunlight when conducting field experiments or to consider the characteristics of artificial light sources used when conducting laboratory experiments, because HRS is a passive remote sensing method that depends on external light-source conditions. Other technical issues may include the incorrect use of the equipment. The correct calibration of a hyperspectral sensor or camera is needed for proper data collection. Such calibration depends on hyperspectral sensor temperature; thus, the equipment must be recalibrated after some continuous period of work due to its warming during operation. It is best if the experiment description includes information about the times of day when the HRS data was obtained.
We have reached the main objective of our study by proving the possibility of early plant disease detection by hyperspectral remote sensing. Our assumption about the coincidence of important bands for the same diseases and plants is partially proved by the results of the reviewed articles. From the other side, many of the reviewed articles demonstrate a mismatch of such bands, which highlights one of the found methodological gaps—That a model of light propagation in different conditions should be developed to normalize data obtained thereawith.
The systematization of modern relevant works about the early detection of plant diseases is present in the Discussion and in Table 1, Table 2, Table 3, Table 4 and Table 5.
In our opinion, the direction of further research should be as follows. To successfully solve the problem of the early detection of plant diseases using HRS, the joint work of specialists in plant physiology, phytopathology, plant resistance, phenomics, bioinformatics, information technologies, system analysis and optics or photonics is required. We also believe that, at this stage of research development, it is more logical to conduct experiments in laboratory conditions or in industrial greenhouses of the latest generation, where the variability of abiotic factors is minimized. The creation of databases of hyperspectral portraits of plants of various crops and cultivars exposed to the influence of various pathogens should probably be postponed until the general principles of remote sensing of plant diseases using HRS are developed to avoid possible confusion.
Author Contributions
Conceptualization, A.F. and A.T.; data curation, A.T. and D.E.; formal analysis, A.T., V.D. and A.F; methodology, A.F. and A.T.; supervision, V.D.; writing—Original draft, A.T.; writing—Review and editing, A.T., A.F., V.D. and D.E. All authors have read and agreed to the published version of the manuscript.
Funding
The research is partially funded by the Ministry of Science and Higher Education of the Russian Federation as part of World-Class Research Center program: Advanced Digital Technologies (contract No. 075-15-2020-934 dated 17 November 2020).
Institutional Review Board Statement
Not applicable.
Informed Consent Statement
Not applicable.
Data Availability Statement
Not applicable.
Acknowledgments
We are very grateful to the All-Russian Institute of Plant Protection researchers O.S. Afanasenko; T.Yu. Gagkaeva; Gannibal; E.I. Gultyaeva; Yu.S. Tokarev and A.N. Frolov for their help and consultations. We are very grateful to Peter the Great St. Petersburg Polytechnic University researcher V.L. Badenko for his help and consultations.
Conflicts of Interest
The authors declare no conflict of interest.
Abbreviations
The following abbreviations are used in this manuscript:
| ANN | artificial neural network |
| ANOVA | analysis of variance |
| ARI | anthocyanin reflectance index |
| BPNN | back propagation neural network |
| BRT | boosted regression tree |
| BSR | basal stem rot |
| CART | classification and regression trees |
| CBC | citrus bacterial canker |
| CCCV | coconut cadang-cadang viroid |
| CNN | convolutional neural network |
| CWA | continuous wavelet analysis |
| CWT | continuous wavelet transform |
| DCNN | deep convolutional neural network |
| ELM | extreme learning machine |
| FDI | fusarium disease index |
| FHB | fusarium head blight |
| GA | genetic algorithm |
| GAN | generative adversarial nets |
| GI | greenness index |
| GPR | Gaussian process regression |
| HLB | huanglongbing (citrus greening) |
| HRS | hyperspectral remote sensing |
| HIS | hue, saturation, intensity |
| IPM | integrated pest management |
| k-NN | k-nearest neighbors algorithm |
| LDA | linear discriminant analysis |
| LRDSI | leaf rust disease severity index |
| LSM | least squares method |
| LS-SVM | least squares–support vector machine |
| LSTM | long-term short–term memory |
| MLP–ARD | multilayer perceptron with automated relevance determination |
| MLR | multiple linear regression |
| MNF | minimum noise fraction |
| MSR | modified simple ratio |
| MTMF | mixture tuned matched filtering |
| NBNDVI | narrow-band normalized difference vegetation index |
| NCA | neighborhood component analysis |
| NDSI | normalized difference spectral index |
| NDVI | normalized difference vegetation index, |
| NIR | near-infrared wavelength diapason |
| NRI | nitrogen reflectance index |
| OR-AC-GAN | outlier removal auxiliary classifier generative adversarial nets |
| OS | orange spotting |
| PCA | principal component analysis |
| PCoA | principal coordinate analysis |
| PCR | polymerase chain reaction |
| PhRI | physiological reflectance index |
| PLS-DA | partial least squares-discriminate analysis |
| PLSR | partial least square regression |
| RNN | recurrent neural network |
| PRI | photochemical reflectance index |
| PSRI | plant senescence reflectance index, |
| PVY | potato virus y |
| REP | red-edge position or red-edge point |
| RWP | red-well point |
| RF | random forest |
| RVSI | red-edge vegetation stress index |
| SAM | spectral angle mapping |
| SID | spectral information divergence |
| SIPI | structural independent pigment index |
| SMA | spectral mixture analysis |
| SPA | successive projections algorithm |
| SVI | spectral vegetation index |
| SVM | support vector machine |
| SVR | support vector regression |
| SWIR | short-wave infrared region |
| ToCV | tomato chlorosis virus |
| TMV | tobacco mosaic virus |
| TSWV | tomato spotted wilt virus |
| UAV | unmanned aerial vehicle |
| VIS | visible wavelength diapason |
| VIS-NIR | visible and near-infrared wavelength diapason |
| ν-SVR | ν support vector regression |
| XY-F | xy-fusion network |
| YR | yellow rust |
References
- Elad, Y.; Pertot, I. Climate change impacts on plant pathogens and plant diseases. J. Crop Improv. 2014, 28, 99–139. [Google Scholar] [CrossRef]
- Mahlein, A.K.; Kuska, M.T.; Behmann, J.; Polder, G.; Walter, A. Hyperspectral sensors and imaging technologies in phytopathology: State of the art. Annu. Rev. Phytopathol. 2018, 56, 535–558. [Google Scholar] [CrossRef]
- Weiss, M.; Jacob, F.; Duveiller, G. Remote sensing for agricultural applications: A meta-review. Remote Sens. Environ. 2020, 236, 111402. [Google Scholar] [CrossRef]
- Liu, J.; Miller, J.R.; Haboudane, D.; Pattey, E.; Nolin, M.C. Variability of seasonal CASI image data products and potential application for management zone delineation for precision agriculture. Can. J. Remote Sens. 2005, 31, 400–411. [Google Scholar] [CrossRef]
- Jensen, J.R. Remote Sensing of the Environment: An Earth Resource Perspective; Prentice Hall: Upper Saddle River, NJ, USA, 2006. [Google Scholar]
- Jones, H.G.; Vaughan, R.A. Remote Sensing of Vegetation: Principles, Techniques, and Applications; Oxford University Press: Oxford, UK, 2010. [Google Scholar]
- Lucieer, A.; Malenovský, Z.; Veness, T.; Wallace, L. HyperUAS-imaging spectroscopy from a multirotor unmanned aircraft system. J. Field Robot. 2014, 31, 571–590. [Google Scholar] [CrossRef] [Green Version]
- Gonzalez-Dugo, V.; Hernandez, P.; Solis, I.; Zarco-Tejada, P. Using High-Resolution Hyperspectral and Thermal Airborne Imagery to Assess Physiological Condition in the Context of Wheat Phenotyping. Remote Sens. 2015, 7, 13586–13605. [Google Scholar] [CrossRef] [Green Version]
- Adao, T.; Hruška, J.; Pádua, L.; Bessa, J.; Peres, E.; Morais, R.; Sousa, J. Hyperspectral Imaging: A Review on UAV-Based Sensors, Data Processing and Applications for Agriculture and Forestry. Remote Sens. 2017, 9, 1110. [Google Scholar] [CrossRef] [Green Version]
- Metternicht, G. Vegetation indices derived from high-resolution airborne videography for precision crop management. Int. J. Remote Sens. 2003, 24, 2855–2877. [Google Scholar] [CrossRef]
- Schell, J.; Deering, D. Monitoring vegetation systems in the Great Plains with ERTS. NASA Spec. Publ. 1973, 351, 309. [Google Scholar]
- Thomas, S.; Kuska, M.T.; Bohnenkamp, D.; Brugger, A.; Alisaac, E.; Wahabzada, M.; Behmann, J.; Mahlein, A.K. Benefits of hyperspectral imaging for plant disease detection and plant protection: A technical perspective. JPDP 2018, 125, 5–20. [Google Scholar] [CrossRef]
- De Jong, S.M.; Van Der Meer, F.D.; Clevers, J.G. Basics of Remote Sensing. Remote Sensing Image Analysis: Including the Spatial Domain; Springer: Dordrecht, The Netherlands, 2004. [Google Scholar]
- Mishra, P.; Asaari, M.S.M.; Herrero-Langreo, A.; Lohumi, S.; Diezma, B.; Scheunders, P. Close range hyperspectral imaging of plants: A review. Biosyst. Eng. 2017, 164, 49–67. [Google Scholar] [CrossRef]
- Chen, Y.; Lin, Z.; Zhao, X.; Wang, G.; Gu, Y. Deep learning-based classification of hyperspectral data. IEEE J. Sel. Top. Appl. 2014, 7, 2094–2107. [Google Scholar] [CrossRef]
- Landgrebe, D.A. Signal Theory Methods in Multispectral Remote Sensing; John Wiley & Sons: Hoboken, NJ, USA, 2003. [Google Scholar]
- Green, R.O.; Eastwood, M.L.; Sarture, C.M.; Chrien, T.G.; Aronsson, M.; Chippendale, B.J.; Faust, J.A.; Pavri, B.E.; Chovit, C.J.; Solis, M.; et al. Imaging spectroscopy and the airborne visible/infrared imaging spectrometer (AVIRIS). Remote Sens. Environ. 1998, 65, 227–248. [Google Scholar] [CrossRef]
- Chang, C.-I. Hyperspectral Imaging: Techniques for Spectral Detection and Classification; Kluwer/Plenum: New York, NY, USA, 2003. [Google Scholar]
- Jia, X.; Richards, J.A.; Ricken, D.E. Remote Sensing Digital Image Analysis: An Introduction; Springer: Berlin/Heidelberg, Germany, 1999. [Google Scholar]
- Serpico, S.B.; D’Inca, M.; Melgani, F.; Moser, G. Comparison of feature reduction techniques for classification of hyperspectral remote-sensing data. In Image and Signal Processing for Remote Sensing VIII; International Society for Optics and Photonics: Bellingham, WA, USA, 2003; Volume 4885, pp. 347–358. [Google Scholar]
- Kaewpijit, S.; Le Moigne, J.; El-Ghazawi, T. Automatic reduction of hyperspectral imagery using wavelet spectral analysis. IEEE Trans. Geosci. Remote Sens. 2003, 41, 863–871. [Google Scholar] [CrossRef]
- Xie, C.; He, Y. Spectrum and image texture features analysis for early blight disease detection on eggplant leaves. Sensors 2016, 16, 676. [Google Scholar] [CrossRef] [Green Version]
- Barreto, A.; Paulus, S.; Varrelmann, M.; Mahlein, A.K. Hyperspectral imaging of symptoms induced by Rhizoctonia solani in sugar beet: Comparison of input data and different machine learning algorithms. J. Plant Dis. Prot. 2020, 127, 441–451. [Google Scholar] [CrossRef]
- Huang, L.; Zhang, H.; Ruan, C.; Huang, W.; Hu, T.; Zhao, J. Detection of scab in wheat ears using in situ hyperspectral data and support vector machine optimized by genetic algorithm. Int. J. Agric. Biol. Eng. 2020, 13, 182–188. [Google Scholar] [CrossRef]
- Nguyen, C.; Sagan, V.; Maimaitiyiming, M.; Maimaitijiang, M.; Bhadra, S.; Kwasniewski, M.T. Early Detection of Plant Viral Disease Using Hyperspectral Imaging and Deep Learning. Sensors 2021, 21, 742. [Google Scholar] [CrossRef] [PubMed]
- Liu, F.; Xiao, Z. Disease Spots Identification of Potato Leaves in Hyperspectral Based on Locally Adaptive 1D-CNN. In Proceedings of the 2020 IEEE International Conference on Artificial Intelligence and Computer Applications (ICAICA), Dalian, China, 27–29 June 2020. [Google Scholar]
- Jin, X.; Jie, L.; Wang, S.; Qi, H.J.; Li, S.W. Classifying wheat hyperspectral pixels of healthy heads and Fusarium head blight disease using a deep neural network in the wild field. Remote Sens. 2018, 10, 395. [Google Scholar] [CrossRef] [Green Version]
- Hruška, J.; Adão, T.; Pádua, L.; Marques, P.; Peres, E.; Sousa, A.; Morais, R.; Sousa, J.J. Deep Learning-Based Methodological Approach for Vineyard Early Disease Detection Using Hyperspectral Data. In Proceedings of the IGARSS 2018-2018 IEEE International Geoscience and Remote Sensing Symposium, Valencia, Spain, 22–27 July 2018. [Google Scholar]
- Van der Plank, J.E. Plant Diseases: Epidemics and Control; Academic: New York, NY, USA, 1963. [Google Scholar]
- Wheeler, B.E.J. An Introduction to Plant Diseases; John Wiley: London, UK, 1969. [Google Scholar]
- Kranz, J.; Rotem, J. Experimental Techniques in Plant Disease Epidemiology; Springer Science and Business Media: Berlin/Heidelberg, Germany, 2012. [Google Scholar]
- Wang, F.-M.; Huang, J.-F.; Wang, X.-Z. Identification of Optimal Hyperspectral Bands for Estimation of Rice Biophysical Parameters. J. Integr. Plant Biol. 2008, 50, 291–299. [Google Scholar] [CrossRef] [PubMed]
- Monteiro, P.F.C.; Angulo Filho, R.; Xavier, A.C.; Monteiro, R.O.C. Assessing biophysical variable parameters of bean crop with hyperspectral measurements. Sci. Agric. 2012, 69, 87–94. [Google Scholar] [CrossRef] [Green Version]
- Casas, A.; Riaño, D.; Ustin, S.L.; Dennison, P.; Salas, J. Estimation of water-related biochemical and biophysical vegetation properties using multitemporal airborne hyperspectral data and its comparison to MODIS spectral response. Remote Sens. Environ. 2014, 148, 28–41. [Google Scholar] [CrossRef]
- Rumpf, T.; Mahlein, A.-K.; Steiner, U.; Oerke, E.-C.; Dehne, H.-W.; Plümer, L. Early detection and classification of plant diseases with Support Vector Machines based on hyperspectral reflectance. Comput. Electron. Agric. 2010, 74, 91–99. [Google Scholar] [CrossRef]
- Golhani, K.; Balasundram, S.K.; Vadamalai, G.; Pradhan, B. A review of neural networks in plant disease detection using hyperspectral data. Inf. Process. Agric. 2018, 5, 354–371. [Google Scholar] [CrossRef]
- Nagaraju, M.; Chawla, P. Systematic review of deep learning techniques in plant disease detection. Int. J. Syst. Assur. 2020, 11, 547–560. [Google Scholar] [CrossRef]
- Lu, J.; Tan, L.; Jiang, H. Review on Convolutional Neural Network (CNN) Applied to Plant Leaf Disease Classification. Agriculture 2021, 11, 707. [Google Scholar] [CrossRef]
- He, Y.; Zeng, H.; Fan, Y.; Ji, S.; Wu, J. Application of Deep Learning in Integrated Pest Management: A Real-Time System for Detection and Diagnosis of Oilseed Rape Pests. Mob. Inf. Syst. 2019, 2019, 1–14. [Google Scholar] [CrossRef] [Green Version]
- Boissard, P.; Martin, V.; Moisan, S. A cognitive vision approach to early pest detection in greenhouse crops. Comput. Electron. Agric. 2008, 62, 81–93. [Google Scholar] [CrossRef] [Green Version]
- Lamichhane, J.R.; Aubertot, J.-N.; Begg, G.; Birch, A.N.E.; Boonekamp, P.; Dachbrodt-Saaydeh, S.; Hansen, J.G.; Hovmoller, M.S.; Jensen, J.E.; Jorgensen, L.N.; et al. Networking of integrated pest management: A powerful approach to address common challenges in agriculture. Crop Prot. 2016, 89, 139–151. [Google Scholar] [CrossRef]
- Tsushima, S. Integrated control and integrated pest management in Japan: The need for various strategies in response to agricultural diversity. J. Gen. Plant Pathol. 2014, 80, 389–400. [Google Scholar] [CrossRef]
- Corley, R.H.V.; Tinker, P.B. The Oil Palm, 4th ed.; Blackwell Science: Oxford, UK, 2003; pp. 25–26. [Google Scholar]
- Aderungboye, F.O. Diseases of the Oil Palm. Int. J. Pest. Manag. 1977, 23, 305–326. [Google Scholar] [CrossRef]
- Turner, P.D. The incidence of Ganoderma disease of oil palms in Malaya and its relation to previous crop. Ann. Appl. Biol. 1965, 55, 417–423. [Google Scholar] [CrossRef]
- Singh, G. Ganoderma—The scourge of oil palms in the coast areas. In Proceedings of the Ganoderma workshop, Bangi, Selangor, Malaysia, 11 September 1990; Darus, A., Sukaimi, J., Eds.; Palm Oil Research Institute of Malaysia: Kuala Lumpur, Malaysia, 1991; Volume 67, pp. 421–444. [Google Scholar]
- Pilotti, C.A. Stem rots of oil palm caused by Ganoderma boninense: Pathogen biology and epidemiology. Mycopathologia 2005, 159, 129–137. [Google Scholar] [CrossRef]
- Ariffin, D.; Idris, A.S.; Singh, G. Status of Ganoderma in oil palm. In Ganoderma. Diseases of Perennial Crops, 1st ed.; Flood, J., Bridge, P.D., Holderness, M., Eds.; CABI Bioscience: Egham, UK, 2000; Volume 1, pp. 49–68. [Google Scholar]
- Paterson, R.R.M. Ganoderma disease of oil palm—A white rot perspective necessary for integrated control. Crop Prot. 2007, 26, 1369–1376. [Google Scholar] [CrossRef] [Green Version]
- Lelong, C.C.D.; Roger, J.-M.; Bregand, S.; Dubertret, F.; Lanore, M.; Sitorus, N.A.; Raharjo, D.A.; Caliman, J.-P. Discrimination of fungal disease infestation in oil-palm canopy hyperspectral reflectance data. In Proceedings of the First Workshop on Hyperspectral Image and Signal Processing: Evolution in Remote Sensing, Grenoble, France, 26–28 August 2009. [Google Scholar]
- Lelong, C.C.D.; Roger, J.-M.; Bregand, S.; Dubertret, F.; Lanore, M.; Sitorus, N.; Raharjo, D.A.; Caliman, J.-P. Evaluation of Oil-Palm Fungal Disease Infestation with Canopy Hyperspectral Reflectance Data. Sensors 2010, 10, 734–747. [Google Scholar] [CrossRef]
- Shafri, H.Z.M.; Anuar, M.I. Hyperspectral Signal Analysis for Detecting Disease Infection in Oil Palms. In Proceedings of the International Conference on Computer and Electrical Engineering, Phuket, Thailand, 20–22 December 2008. [Google Scholar]
- Shafri, H.Z.M.; Hamdan, N. Hyperspectral Imagery for Mapping Disease Infection in Oil Palm Plantation Using Vegetation Indices and Red Edge Techniques. Am. J. Appl. Sci. 2009, 6, 1031–1035. [Google Scholar]
- Anuar, M.I. Modified vegetation indices for Ganoderma disease detection in oil palm from field spectroradiometer data. J. Appl. Remote Sens. 2009, 3, 033556. [Google Scholar] [CrossRef]
- Shafri, H.Z.M.; Anuar, M.I.; Seman, I.A.; Noor, N.M. Spectral discrimination of healthy and Ganoderma-infected oil palms from hyperspectral data. Int. J. Remote Sens. 2011, 32, 7111–7129. [Google Scholar] [CrossRef]
- Anuar, M.I.; Abu, S.I.; Nisfariza, M.N.; Nordiana, A.A.; Shafri, H.Z.M.; Ezzati, B. The development of spectral indices for early detection of Ganoderma disease in oil palm seedlings. Int. J. Remote Sens. 2017, 38, 6505–6527. [Google Scholar]
- Anuar, M.I.; Nisfariza, M.N.; Ezzati, B.; Idris, A.S.; Steven, M.D.; Boyd, D. Analysis of airborne hyperspectral image using vegetation indices, red edge position and continuum removal for detection of Ganoderma disease in oil palm. J. Oil Palm Res. 2018, 30, 416–428. [Google Scholar]
- Liaghat, S.; Ehsani, R.; Mansor, S.; Shafri, H.Z.M.; Meon, S.; Sankaran, S.; Azam, S.H.M.N. Early detection of basal stem rot disease (Ganoderma) in oil palms based on hyperspectral reflectance data using pattern recognition algorithms. Int. J. Remote Sens. 2014, 35, 3427–3439. [Google Scholar] [CrossRef]
- Ahmadi, P.; Muharam, F.M.; Ahmad, K.; Mansor, S.; Abu, S.I. Early Detection of Ganoderma Basal Stem Rot of Oil Palms Using Artificial Neural Network Spectral Analysis. Plant Dis. 2017, 101, 1009–1016. [Google Scholar] [CrossRef] [PubMed] [Green Version]
- Azmi, A.N.N.; Bejo, S.K.; Jahari, M.; Muharam, F.M.; Yule, I.; Husin, N.A. Early Detection of Ganoderma boninense in Oil Palm Seedlings Using Support Vector Machines. Remote Sens. 2020, 12, 3920. [Google Scholar] [CrossRef]
- Hanold, D.; Randles, J.W. Detection of Coconut cadangcadang viroid-like sequences in oil and coconut palm and other monocotyledons in the south-west Pacific. Ann. Appl. Biol. 1991, 118, 139–151. [Google Scholar] [CrossRef]
- Wu, Y.H.; Cheong, L.C.; Meon, S.; Lau, W.H.; Kong, L.L.; Joseph, H.; Vadamalai, G. Characterization of Coconut cadang-cadang viroid variants from oil palm affected by orange spotting disease in Malaysia. Arch. Virol. 2013, 158, 1407–1410. [Google Scholar] [CrossRef]
- Selvaraja, S.; Balasundram, S.K.; Vadamalai, G.; Husni, M.H.A. Use of Spectral Reflectance to Discriminate between Potassium Deficiency and Orange Spotting Symptoms in Oil Palm (Elaeis guineensis). Life Sci. J. 2013, 10, 947–951. [Google Scholar]
- Selvaraja, S.; Balasundram, S.K.; Vadamalai, G.; Husni, M.H.A.; Khosla, R. Remote Sensing as a Tool to Assess Orange Spotting Disease in Oil Palm (Elaies guineensis). Mitt. Klosterneubg. 2014, 64, 12–26. [Google Scholar]
- Golhani, K.; Balasundram, S.K.; Vadamalai, G.; Pradhan, B. Use of reflectance spectroscopy as a tool for screening viroid-inoculated oil palm seedlings. OAJAR 2017, 2, 1–4. [Google Scholar]
- Golhani, K.; Balasundram, S.K.; Vadamalai, G.; Pradhan, B. Selection of a spectral index for detection of orange spotting disease in oil palm (Elaeis guineensis jacq.) using red edge and neural network techniques. J. Indian Soc. Remote Sens. 2019, 47, 639–646. [Google Scholar] [CrossRef]
- Schubert, T.S.; Rizvi, S.A.; Sun, X.A.; Gottwald, T.R.; Graham, J.H.; Dixon, W.N. Meeting the challenge of eradicating citrus canker in Florida—Again. Plant Dis. 2001, 85, 340–356. [Google Scholar] [CrossRef] [PubMed] [Green Version]
- Das, A.K. Citrus canker—A review. J. Appl. Hortic. 2003, 5, 52–60. [Google Scholar] [CrossRef]
- Deng, X.; Tang, W. The studies on detection of citrus Huanglongbing pathogen by polymerase chain reaction. J. South China Agric. Univ. 1996, 17, 119–120. [Google Scholar]
- Jagoueix, S.; Bové, J.M.; Gamier, M. Techniques for the Specific Detection of the Two Huanglongbing (Greening) Liberobacter Species: DNA/DNA Hybridization and DNA Amplification by PCR. In International Organization of Citrus Virologists Conference Proceedings; Department of Plant Pathology, University of California: Riverside, CA, USA, 1996; Volume 13. [Google Scholar]
- Fan, G.; Liu, B.; Wu, R. Thirty years of research on citrus Huanglongbing in China. Fujian J. Agric. Sci. 2009, 24, 183–190. [Google Scholar]
- Mishra, A.R.; Karimi, D.; Ehsani, R.; Lee, W.S. Identification of Citrus Greening (HLB) Using a VIS-NIR Spectroscopy Technique. Trans. ASABE 2012, 55, 711–720. [Google Scholar] [CrossRef]
- Sankaran, S.; Mishra, A.; Maja, J.M.; Ehsani, R. Visible-near infrared spectroscopy for detection of Huanglongbing HLB) Using a VIS-NIR Spectroscopy Technique. Comput. Electron. Agric. 2011, 77, 127–134. [Google Scholar] [CrossRef]
- Sankaran, S.; Ehsani, R. Visible-near infrared spectroscopy based citrus greening detection: Evaluation of spectral feature extraction techniques. Crop Prot. 2011, 30, 1508–1513. [Google Scholar] [CrossRef]
- Sankaran, S.; Maja, J.; Buchanon, S.; Ehsani, R. Huanglongbing (Citrus Greening) Detection Using Visible, Near Infrared and Thermal Imaging Techniques. Sensors 2013, 13, 2117–2130. [Google Scholar] [CrossRef] [Green Version]
- Li, X.; Lee, W.S.; Li, M.; Ehsani, R.; Mishra, A.R.; Yang, C.; Mangan, R.L. Spectral difference analysis and airborne imaging classification for citrus greening infected trees. Comput. Electron. Agric. 2012, 83, 32–46. [Google Scholar] [CrossRef]
- Kumar, A.; Lee, W.S.; Ehsani, R.J.; Albrigo, L.G.; Yang, C.; Mangane, R.L. Citrus greening disease detection using aerial hyperspectral and multispectral imaging techniques. J. Appl. Remote Sens. 2012, 6, 063542. [Google Scholar]
- Weng, H.; Lu, J.; Cen, H.; He, M.; Zeng, Y.; Hua, S.; Li, H.; Meng, Y.; Fang, H.; He, Y. Hyperspectral reflectance imaging combined with carbohydrate metabolism analysis for diagnosis of citrus Huanglongbing in different seasons and cultivars. Sens. Actuators B Chem. 2018, 275, 50–60. [Google Scholar] [CrossRef]
- Deng, X.; Huang, Z.; Zheng, Z.; Lan, Y.; Dai, F. Field detection and classification of citrus Huanglongbing based on hyperspectral reflectance. Comput. Electron. Agric. 2019, 167, 105006. [Google Scholar] [CrossRef]
- Deng, X.; Zhu, Z.; Yang, J.; Zheng, Z.; Huang, Z.; Yin, X.; Wei, S.; Lan, Y. Detection of Citrus Huanglongbing Based on Multi-Input Neural Network Model of UAV HRS. Remote Sens. 2020, 12, 2678. [Google Scholar] [CrossRef]
- Lan, Y.; Zhu, Z.; Deng, X.; Lian, B.; Huang, J.; Huang, Z.; Hu, J. Monitoring and classification of Huanglongbing plants of citrus based on UAV HRS. Trans. Chin. Soc. Agric. Eng. 2019, 35, 92–100. [Google Scholar]
- Lan, Y.; Huang, Z.; Deng, X.; Zhu, Z.; Huang, H.; Zheng, Z.; Lian, B.; Zeng, G.; Tong, Z. Comparison of machine learning methods for citrus greening detection on UAV multispectral images. Comput. Electron. Agric. 2020, 171, 105234. [Google Scholar] [CrossRef]
- Mei, H.; Deng, X.; Hong, T.; Luo, X.; Deng, X. Early detection and grading of citrus huanglongbing using hyperspectral imaging technique. Trans. Chin. Soc. Agric. Eng. 2014, 30, 140–147. [Google Scholar]
- Li, J.; Huang, W.; Tian, X.; Wang, C.; Fan, S.; Zhao, C. Fast detection and visualization of early decay in citrus using Vis-NIR hyperspectral imaging. Comput. Electron. Agric. 2016, 127, 582–592. [Google Scholar] [CrossRef]
- Tian, X.; Fan, S.; Huang, W.; Wang, Z.; Li, J. Detection of early decay on citrus using hyperspectral transmittance imaging technology coupled with principal component analysis and improved watershed segmentation algorithms. Postharvest Biol. Technol. 2020, 161, 111071. [Google Scholar] [CrossRef]
- Foolad, M.R.; Merk, H.L.; Ashrafi, H. Genetics, Genomics and Breeding of Late Blight and Early Blight Resistance in Tomato. Crit. Rev. Plant Sci. 2008, 27, 75–107. [Google Scholar] [CrossRef]
- Akino, S.; Takemoto, D.; Hosaka, K. Phytophthora infestans: A review of past and current studies on potato late blight. J. Gen. Plant Pathol. 2013, 80, 24–37. [Google Scholar] [CrossRef]
- Roselló, S.; Díez, M.J.; Nuez, F. Viral diseases causing the greatest economic losses to the tomato crop. I. The Tomato spotted wilt virus—A review. Sci. Hortic. 1996, 67, 117–150. [Google Scholar] [CrossRef]
- Karasev, A.V.; Gray, S.M. Continuous and Emerging Challenges of Potato virus Y in Potato. Annu. Rev. Phytopathol. 2013, 51, 571–586. [Google Scholar] [CrossRef]
- Hardwick, N.V. Disease forecasting. In The Epidemiology of Plant Diseases, 2nd ed.; Cooke, B.M., Jones, D.G., Kaye, B., Eds.; Springer: Dordrecht, The Netherlands, 2006; pp. 239–267. [Google Scholar]
- Lu, J.; Zhou, M.; Gao, Y.; Jiang, H. Using hyperspectral imaging to discriminate yellow leaf curl disease in tomato leaves. Precis. Agric. 2017, 19, 379–394. [Google Scholar] [CrossRef]
- Lu, J.; Ehsani, R.; Shi, Y.; de Castro, A.I.; Wang, S. Detection of multi-tomato leaf diseases (late blight, target and bacterial spots) in different stages by using a spectral-based sensor. Sci. Rep. 2018, 8, 2793. [Google Scholar] [CrossRef] [Green Version]
- Polder, G.; Blok, P.M.; de Villiers, H.A.C.; Van der Wolf, J.M.; Kamp, J. Potato Virus Y Detection in Seed Potatoes Using Deep Learning on Hyperspectral Images. Front. Plant Sci. 2019, 10, 209. [Google Scholar] [CrossRef] [Green Version]
- Griffel, L.M.; Delparte, D.; Edwards, J. Using Support Vector Machines classification to differentiate spectral signatures of potato plants infected with Potato Virus Y. Comput. Electron. Agric. 2018, 153, 318–324. [Google Scholar] [CrossRef]
- Van de Vijvera, R.; Mertensa, K.; Heungensb, K.; Somersc, B.; Nuyttensa, D.; Borra-Serranoc, I.; Lootensd, P.; Roldán-Ruizd, I.; Vangeytea, J.; Saeys, W. In-field detection of Alternaria solani in potato crops using hyperspectral imaging. Comput. Electron. Agric. 2019, 168, 105106. [Google Scholar] [CrossRef]
- Abdulridha, J.; Ampatzidis, Y.; Qureshi, J.; Robert, P. Detection of target spot and bacterial spot diseases in tomato using UAV based and benchtop based hyperspectral imaging techniques. Precis. Agric. 2019, 21, 955–978. [Google Scholar] [CrossRef]
- Abdulridha, J.; Ampatzidis, Y.; Kakarla, S.C.; Robert, P. Laboratory and UAV-Based Identification and Classification of Tomato Yellow Leaf Curl, Bacterial Spot, and Target Spot Diseases in Tomato Utilizing Hyperspectral Imaging and Machine Learning. Remote Sens. 2020, 21, 3843. [Google Scholar] [CrossRef]
- Zhang, M.; Qin, Z.; Liu, X.; Ustin, S.L. Detection of stress in tomatoes induced by late blight disease in California, USA, using HRS. Int. J. Appl. Earth. Obs. 2003, 4, 295–310. [Google Scholar] [CrossRef]
- Fernandez, C.I.; Leblon, B.; Haddadi, A.; Wang, J.; Wang, K. Potato Late Blight Detection at the Leaf and Canopy Level Using Hyperspectral Data. Can. J. Remote Sens. 2020, 46, 390–413. [Google Scholar] [CrossRef]
- Fernandez, C.I.; Leblon, B.; Haddadi, A.; Wang, K.; Wang, J. Potato Late Blight Detection at the Leaf and Canopy Levels Based in the Red and Red-Edge Spectral Regions. Remote Sens. 2020, 12, 1292. [Google Scholar] [CrossRef] [Green Version]
- Krezhova, D.; Dikova, B.; Maneva, S. Ground based HRS for disease detection of tobacco plants. Bulg. J. Agric. Sci. 2014, 20, 1142–1150. [Google Scholar]
- Xie, C.; Shao, Y.; Li, X.; He, Y. Detection of early blight and late blight diseases on tomato leaves using hyperspectral imaging. Sci. Rep. 2015, 5, 16564. [Google Scholar] [CrossRef] [PubMed]
- Xie, C.; Yang, C.; He, Y. Hyperspectral imaging for classification of healthy and gray mold diseased tomato leaves with different infection severities. Comput. Electron. Agric. 2017, 135, 154–162. [Google Scholar] [CrossRef]
- Wang, D.; Vinson, R.; Holmes, M.; Seibel, G.; Bechar, A.; Nof, S.; Luo, Y.; Tao, Y. Early Tomato Spotted Wilt Virus Detection using Hyperspectral Imaging Technique and Outlier Removal Auxiliary Classifier Generative Adversarial Nets (OR-AC-GAN). In Proceedings of the ASABE Annual International Meeting, Detroit, MI, USA, 29 July–1 August 2018. [Google Scholar]
- Wang, D.; Vinson, R.; Holmes, M.; Seibel, G.; Bechar, A.; Nof, S.; Tao, Y. Early Detection of Tomato Spotted Wilt Virus by Hyperspectral Imaging and Outlier Removal Auxiliary Classifier Generative Adversarial Nets (OR-AC-GAN). Sci. Rep. 2019, 9, 4377. [Google Scholar] [CrossRef]
- Gu, Q.; Sheng, L.; Zhang, T.; Lu, Y.; Zhang, Z.; Zheng, K.; Hu, H.; Zhou, H. Early detection of tomato spotted wilt virus infection in tobacco using the hyperspectral imaging technique and machine learning algorithms. Comput. Electron. Agric. 2019, 167, 105066. [Google Scholar] [CrossRef]
- Zhu, H.; Cen, H.; Zhang, C.; He, Y. Early Detection and Classification of Tobacco Leaves Inoculated with Tobacco Mosaic Virus Based on Hyperspectral Imaging Technique. In Proceedings of the ASABE Annual International Meeting, Orlando, FL, USA, 17–20 July 2016. [Google Scholar]
- Zhu, H.; Chu, B.; Zhang, C.; Liu, F.; Jiang, L.; He, Y. Hyperspectral imaging for presymptomatic detection of tobacco disease with successive projections algorithm and machine-learning classifiers. Sci. Rep. 2017, 7, 4125. [Google Scholar] [CrossRef] [PubMed] [Green Version]
- Morellos, A.; Tziotzios, G.; Orfanidou, C.; Pantazi, X.E.; Sarantaris, C.; Maliogka, V.; Alexandridis, T.K.; Moshou, D. Non-Destructive Early Detection and Quantitative Severity Stage Classification of Tomato Chlorosis Virus (ToCV) Infection in Young Tomato Plants Using Vis–NIR Spectroscopy. Remote Sens. 2020, 12, 1920. [Google Scholar] [CrossRef]
- Bienkowski, D.; Aitkenhead, M.J.; Lees, A.K.; Gallagher, C.; Neilson, R. Detection and differentiation between potato (Solanum tuberosum) diseases using calibration models trained with non-imaging spectrometry data. Comput. Electron. Agric. 2019, 167, 105056. [Google Scholar] [CrossRef]
- Franceschini, M.H.D.; Bartholomeus, H.; van Apeldoorn, D.F.; Suomalainen, J.; Kooistra, L. Feasibility of unmanned aerial vehicle optical imagery for early detection and severity assessment of late blight in potato. Remote Sens. 2019, 11, 224. [Google Scholar] [CrossRef] [Green Version]
- Gold, K.M.; Townsend, P.A.; Herrmann, I.; Gevens, A.J. Investigating potato late blight physiological differences across potato cultivars with spectroscopy and machine learning. Plant Sci. 2019, 110316. [Google Scholar] [CrossRef] [PubMed]
- Gold, K.M.; Townsend, P.A.; Chlus, A.; Herrmann, I.; Couture, J.J.; Larson, E.R.; Gevens, A.J. Hyperspectral Measurements Enable Pre-Symptomatic Detection and Differentiation of Contrasting Physiological Effects of Late Blight and Early Blight in Potato. Remote Sens. 2020, 12, 286. [Google Scholar] [CrossRef] [Green Version]
- Hazell, P.B.R. Sources of Increased Instability in Indian and U.S. Cereal Production. Am. J. Agric. Econ. 1984, 66, 302. [Google Scholar] [CrossRef]
- Poole, N.F.; Arnaudin, M.E. The role of fungicides for effective disease management in cereal crops. Can. J. Plant Pathol. 2014, 36, 1–11. [Google Scholar] [CrossRef]
- Choudhury, N.; Saurav, S.; Kumar, R.R.; Budhlakoti1, N. Modelling and Forecasting of Total Area, Irrigated Area, Production and Productivity of Important Cereal Crops in India towards Food Security. Int. J. Curr. Microbiol. Appl. Sci. 2017, 6, 2591–2600. [Google Scholar] [CrossRef]
- Simpson, D.R.; Weston, G.E.; Turner, J.A.; Jennings, P.; Nicholson, P. Differential control of head blight pathogens of wheat by fungicides and consequences for mycotoxin contamination of grain. Eur. J. Plant Pathol. 2001, 107, 421–431. [Google Scholar] [CrossRef]
- Stack, R.W. History of Fusarium head blight with emphasis on North America. In Fusarium Head Blight of Wheat and Barley; Leonard, K.J., Bushnell, W.R., Eds.; APS Press: St. Paul, MN, USA, 2003; pp. 1–34. [Google Scholar]
- Gale, L.R. Population biology of Fusarium species causing head blight of grain crops. In Fusarium Head Blight of Wheat and Barley; Leonard, K.J., Bushnell, W.R., Eds.; APS Press: St. Paul, MN, USA, 2003; pp. 120–143. [Google Scholar]
- Johnson, D.D.; Flakerud, G.K.; Taylor, R.D.; Satyanarayana, V. Quantifying economic impacts of Fusarium head blight in wheat. In Fusarium Head Blight of Wheat and Barley; Leonard, K.J., Bushnell, W.R., Eds.; APS Press: St. Paul, MN, USA, 2005; pp. 461–484. [Google Scholar]
- Xu, X.; Nicholson, P. Community Ecology of Fungal Pathogens Causing Wheat Head Blight. Annu. Rev. Phytopathol. 2009, 47, 83–103. [Google Scholar] [CrossRef] [PubMed]
- Yli-Mattila, T.; Gagkaeva, T.Y. Fusarium toxins in cereals in Northern Europe and Asia. In Fungi: Applications and Management Strategies, 1st ed.; Deshmukh, S.K., Misra, J.K., Tewari, J.P., Papp, T., Eds.; CRC Press: Boca Raton, FL, USA, 2016; pp. 293–317. [Google Scholar]
- Gagkaeva, T.; Gavrilova, O.; Orina, A.; Lebedin, Y.; Shanin, I.; Petukhov, P.; Eremin, S. Analysis of Toxigenic Fusarium Species Associated with Wheat Grain from Three Regions of Russia: Volga, Ural, and West Siberia. Toxins 2019, 11, 252. [Google Scholar] [CrossRef] [PubMed] [Green Version]
- Delwiche, S.R.; Kim, M.S. Biological Quality and Precision Agriculture, II. DeShazer, J.A., Meyer, G.E., Eds.; SPIE: Bellingham, WA, USA, 2000; Volume 4203. [Google Scholar]
- Barbedo, J.G.A.; Tibola, C.S.; Fernandes, J.M.C. Detecting Fusarium head blight in wheat kernels using hyperspectral imaging. Biosyst. Eng. 2015, 131, 65–76. [Google Scholar] [CrossRef]
- Alisaac, E.; Behmann, J.; Kuska, M.T.; Dehne, H.-W.; Mahlein, A.-K. Hyperspectral quantification of wheat resistance to Fusarium head blight: Comparison of two Fusarium species. Eur. J. Plant Pathol. 2018, 152, 869–884. [Google Scholar] [CrossRef]
- Mahlein, A.-K.; Alisaac, E.; Al Masri, A.; Behmann, J.; Dehne, H.-W.; Oerke, E.-C. Comparison and Combination of Thermal, Fluorescence, and Hyperspectral Imaging for Monitoring Fusarium Head Blight of Wheat on Spikelet Scale. Sensors 2019, 19, 2281. [Google Scholar] [CrossRef] [Green Version]
- Ma, H.; Huang, W.; Jing, Y.; Pignatti, S.; Laneve, G.; Dong, Y.; Ye, H.; Liu, L.; Guo, A.; Jiang, J. Identification of Fusarium Head Blight in Winter Wheat Ears Using Continuous Wavelet Analysis. Sensors 2019, 20, 20. [Google Scholar] [CrossRef] [Green Version]
- Zhang, N.; Pan, Y.; Feng, H.; Zhao, X.; Yang, X.; Ding, C.; Yang, G. Development of Fusarium head blight classification index using hyperspectral microscopy images of winter wheat spikelets. Biosyst. Eng. 2019, 186, 83–99. [Google Scholar] [CrossRef]
- Zhang, D.; Wang, Q.; Lin, F.; Yin, X.; Gu, C.; Qiao, H. Development and Evaluation of a New Spectral Disease Index to Detect Wheat Fusarium Head Blight Using Hyperspectral Imaging. Sensors 2020, 20, 2260. [Google Scholar] [CrossRef]
- Whetton, R.L.; Hassall, K.L.; Waine, T.W.; Mouazen, A.M. Hyperspectral measurements of yellow rust and fusarium head blight in cereal crops: Part 1: Laboratory study. Biosyst. Eng. 2018, 166, 101–115. [Google Scholar] [CrossRef] [Green Version]
- Whetton, R.L.; Waine, T.W.; Mouazen, A.M. Hyperspectral measurements of yellow rust and fusarium head blight in cereal crops: Part 2: On-line field measurement. Biosyst. Eng. 2018, 167, 144–158. [Google Scholar] [CrossRef] [Green Version]
- Bauriegel, E.; Giebel, A.; Geyer, M.; Schmidt, U.; Herppich, W.B. Early detection of Fusarium infection in wheat using hyper-spectral imaging. Comput. Electron. Agric. 2011, 75, 304–312. [Google Scholar] [CrossRef]
- Wellings, C.R. Global status of stripe rust: A review of historical and current threats. Euphytica 2011, 179, 129–141. [Google Scholar] [CrossRef]
- Chen, W.; Wellings, C.; Chen, X.; Kang, Z.; Liu, T. Wheat stripe (yellow) rust caused by Puccinia striiformis f. sp. tritici. Mol. Plant Pathol. 2014, 15, 433–446. [Google Scholar] [CrossRef]
- Ali, S.; Rodriguez-Algaba, J.; Thach, T.; Sørensen, C.K.; Hansen, J.G.; Lassen, P.; Nazari, K.; Hodson, D.P.; Justesen, A.F.; Hovmøller, M.S. Yellow Rust Epidemics Worldwide Were Caused by Pathogen Races from Divergent Genetic Lineages. Front. Plant Sci. 2017, 8, 1057. [Google Scholar] [CrossRef] [Green Version]
- Shaydayuk, E.L.; Yakovleva, D.R.; Abdullaev, K.M.; Pyukkenen, V.P.; Gultyaeva, E.I. Population genetics studies of Puccinia striiformis f. sp. tritici in Dagestan and Northwestern Russia. Proc. Appl. Bot. Genet. Breed. 2021, 182, 174–181 (In Russian). [Google Scholar] [CrossRef]
- Saari, E.E.; Prescott, J. World Distribution in Relation to Economic Losses; CIMMYT: Veracruz, Mexico, 1985. [Google Scholar]
- Singh, R.P.; Huerta-Espino, J.; Roelfs, A.P. The Wheat Rusts. In Bread Wheat: Improvement and Production; Curtis, B.C., Rajaram, S., Gomez Macpherson, H., Eds.; Plant Production and Protection Series No. 30; FAO: Rome, Italy, 2002; pp. 317–330. [Google Scholar]
- Huang, W.; Lamb, D.W.; Niu, Z.; Zhang, Y.; Liu, L.; Wang, J. Identification of yellow rust in wheat using in-situ spectral reflectance measurements and airborne hyperspectral imaging. Precis. Agric. 2007, 8, 187–197. [Google Scholar] [CrossRef]
- Zhang, J.; Pu, R.; Huang, W.; Yuan, L.; Luo, J.; Wang, J. Using in-situ hyperspectral data for detecting and discriminating yellow rust disease from nutrient stresses. Field Crops Res. 2012, 134, 165–174. [Google Scholar] [CrossRef]
- Krishna, G.; Sahoo, R.N.; Pargal, S.; Gupta, V.K.; Sinha, P.; Bhagat, S.; Saharan, M.S.; Singh, R.; Chattopadhyay, C. Assessing Wheat Yellow Rust Disease through Hyperspectral Remote Sensing. ISPRS Int. Arch. Photogramm. Remote Sens. Spat. Inf. Sci. 2014, XL-8, 1413–1416. [Google Scholar] [CrossRef] [Green Version]
- Zhang, X.; Han, L.; Dong, Y.; Shi, Y.; Huang, W.; Han, L.; González-Moreno, P.; Ma, H.; Ye, H.; Sobeih, T. A Deep Learning-Based Approach for Automated Yellow Rust Disease Detection from High-Resolution Hyperspectral UAV Images. Remote Sens. 2019, 11, 1554. [Google Scholar] [CrossRef] [Green Version]
- Guo, A.; Huang, W.; Ye, H.; Dong, Y.; Ma, H.; Ren, Y.; Ruan, C. Identification of Wheat Yellow Rust Using Spectral and Texture Features of Hyperspectral Images. Remote Sens. 2020, 12, 1419. [Google Scholar] [CrossRef]
- Guo, A.; Huang, W.; Dong, Y.; Ye, H.; Ma, H.; Liu, B.; Wu, B.; Ren, Y.; Ruan, C.; Geng, Y. Wheat Yellow Rust Detection Using UAV-Based Hyperspectral Technology. Remote Sens. 2021, 13, 123. [Google Scholar] [CrossRef]
- Bohnenkamp, D.; Behmann, J.; Mahlein, A.-K. In-Field Detection of Yellow Rust in Wheat on the Ground Canopy and UAV Scale. Remote Sens. 2019, 11, 2495. [Google Scholar] [CrossRef] [Green Version]
- Bohnenkamp, D.; Kuska, M.T.; Mahlein, A.-K.; Behmann, J. Utilising pure fungal spore spectra as reference for a hyperspectral signal decomposition and symptom detection of wheat rust diseases on leaf scale. Plant Pathol. 2019, 68, 1188–1195. [Google Scholar] [CrossRef]
- Zheng, Q.; Huang, W.; Cui, X.; Dong, Y.; Shi, Y.; Ma, H.; Liu, L. Identification of Wheat Yellow Rust Using Optimal Three-Band Spectral Indices in Different Growth Stages. Sensors 2018, 19, 35. [Google Scholar] [CrossRef] [Green Version]
- López-López, M.; Calderón, R.; González-Dugo, V.; Zarco-Tejada, P.; Fereres, E. Early Detection and Quantification of Almond Red Leaf Blotch Using High-Resolution Hyperspectral and Thermal Imagery. Remote Sens. 2016, 8, 276. [Google Scholar] [CrossRef] [Green Version]
- Fajardo, J.U.; Andrade, O.B.; Bonilla, R.C.; Cevallos-Cevallos, J.; Mariduena-Zavala, M.; Donoso, D.O.; Villardón, J.L.V. Early detection of black Sigatoka in banana leaves using hyperspectral images. Appl. Plant Sci. 2020, 8, e11383. [Google Scholar]
- Ochoa, D.; Cevallos, J.; Vargas, G.; Criollo, R.; Romero, D.; Castro, R.; Bayona, O. Hyperspectral imaging system for disease scanning on banana plants. In Sensing for Agriculture and Food Quality and Safety VIII; International Society for Optics and Photonics: Bellingham, WA, USA, 2016. [Google Scholar]
- Zhou, R.-Q.; Jin, J.-J.; Li, Q.-M.; Su, Z.-Z.; Yu, X.-J.; Tang, Y.; Luo, S.-M.; He, Y.; Li, X.-L. Early Detection of Magnaporthe oryzae-Infected Barley Leaves and Lesion Visualization Based on Hyperspectral Imaging. Front. Plant Sci. 2019, 9, 1962. [Google Scholar] [CrossRef]
- Junges, A.; Ducati, J.; Scalvi Lampugnani, C.; Almança, M.A. Detection of Grapevine Leaf Stripe Disease Symptoms by Hyperspectral Sensor. Phytopathol. Mediterr. 2018, 57, 399–406. [Google Scholar]
- Gao, Z.; Khot, L.R.; Naidu, R.A.; Zhang, Q. Early detection of grapevine leafroll disease in a red-berried wine grape cultivar using hyperspectral imaging. Comput. Electron. Agric. 2020, 179, 105807. [Google Scholar] [CrossRef]
- Calderón, R.; Navas-Cortés, J.A.; Lucena, C.; Zarco-Tejada, P.J. High-resolution airborne hyperspectral and thermal imagery for early detection of Verticillium wilt of olive using fluorescence, temperature and narrow-band spectral indices. Remote Sens. Environ. 2013, 139, 231–245. [Google Scholar] [CrossRef]
- Calderón, R.; Navas-Cortés, J.; Zarco-Tejada, P. Early Detection and Quantification of Verticillium Wilt in Olive Using Hyperspectral and Thermal Imagery over Large Areas. Remote Sens. 2015, 7, 5584–5610. [Google Scholar] [CrossRef] [Green Version]
- Zarco-Tejada, P.J.; Camino, C.; Beck, P.S.A.; Calderon, R.; Hornero, A.; Hernández-Clemente, R.; Kattenborn, T.; Montes-Borrego, M.; Susca, L.; Morelli, M.; et al. Previsual symptoms of Xylella fastidiosa infection revealed in spectral plant-trait alterations. Nat. Plants 2018, 4, 432–439. [Google Scholar] [CrossRef] [PubMed]
- Omran, E.-S.E. Early sensing of peanut leaf spot using spectroscopy and thermal imaging. Arch. Acker Pflanzenbau Bodenkd. 2016, 63, 883–896. [Google Scholar] [CrossRef]
- Chen, T.; Yang, W.; Zhang, H.; Zhu, B.; Zeng, R.; Wang, X.; Wang, S.; Wang, L.; Qi, H.; Lan, Y.; et al. Early detection of bacterial wilt in peanut plants through leaf-level hyperspectral and unmanned aerial vehicle data. Comput. Electron. Agric. 2020, 177, 105708. [Google Scholar] [CrossRef]
- Nagasubramanian, K.; Jones, S.; Sarkar, S.; Singh, A.K.; Singh, A.; Ganapathysubramanian, B. Hyperspectral band selection using genetic algorithm and support vector machines for early identification of charcoal rot disease in soybean stems. Plant Methods 2018, 14, 1–13. [Google Scholar] [CrossRef] [PubMed]
- Adam, E.; Deng, H.; Odindi, J.; Abdel-Rahman, E.M.; Mutanga, O. Detecting the Early Stage of Phaeosphaeria Leaf Spot Infestations in Maize Crop Using In Situ Hyperspectral Data and Guided Regularized Random Forest Algorithm. J. Spectrosc. 2017, 2017, 6961387. [Google Scholar] [CrossRef]
- Qin, J.; Burks, T.F.; Ritenour, M.A.; Bonn, W.G. Detection of citrus canker using hyperspectral reflectance imaging with spectral information divergence. J. Food. Eng. 2009, 93, 183–191. [Google Scholar] [CrossRef]
- AHDB Potato Variety Database. Available online: https://varieties.ahdb.org.uk (accessed on 5 November 2021).
- Mansour, K.; Mutanga, O.; Adam, E.; Abdel-Rahman, E.M. Multispectral remote sensing for mapping grassland degradation using the key indicators ofgrass species and edaphic factors. Geocarto Int. 2016, 31, 477–491. [Google Scholar] [CrossRef]
- Martínez-Usó, A.; Pla, F.; Sotoca, J.M.; García-Sevilla, P. Clustering-based hyperspectral band selection using information measures. IEEE Trans. Geosci. Remote 2007, 45, 4158–4171. [Google Scholar] [CrossRef]
- Guo, B.F.; Damper, R.I.; Gunn, S.R.; Nelson, J.D.B. A fast separability-based feature-selection method for high-dimensional remotely sensed image classification. Pattern Recogn. 2008, 41, 1653–1662. [Google Scholar] [CrossRef] [Green Version]
- Lorente, D.; Aleixos, N.; Gómez-Sanchis, J.; Cubero, S.; Blasco, J. Selection of optimal wavelengths features for decay detection in citrus fruit using the ROC curve and neural networks. Food Bioprocess Technol. 2013, 6, 530–541. [Google Scholar] [CrossRef] [Green Version]
- Andries, J.P.M.; Heyden, Y.V.; Buydens, L.M.C. Predictive-property-ranked variable reduction in partial least squares modelling with final complexity adapted models: Comparison of properties for ranking. Anal. Chim. Acta 2013, 760, 34–45. [Google Scholar] [CrossRef]
- Hale, M.G.; Orcutt, D.M. The Physiology of Plants Under Stress; John Wiley & Sons: New York, NY, USA, 1987. [Google Scholar]
- Fox, R.; Narra, H. Plant disease diagnosis. In The Epidemiology of Plant Diseases, 2nd ed.; Cooke, B.M., Jones, D.G., Kaye, B., Eds.; Springer: Dordrecht, The Netherlands, 2006; pp. 1–42. [Google Scholar]
- Afanasenko, O.S.; Mironenko, N.V.; Bespalova, L.A.; Ablova, I.B.; Lashina, N.M. Ramularia spot blotch in Russian Federation: Distribution and diagnosis. Mikol. Fitopatol. 2019, 53, 236–245. [Google Scholar]
- Kolander, T.M.; Bienapfl, J.C.; Kurle, J.E.; Malvick, D.K. Symptomatic and Asymptomatic Host Range of Fusarium virguliforme, the Causal Agent of Soybean Sudden Death Syndrome. Plant Dis. 2012, 96, 1148–1153. [Google Scholar] [CrossRef] [PubMed] [Green Version]
- Bray, E.A. Plant responses to water deficit. Trends Plant Sci. 1997, 2, 48–54. [Google Scholar] [CrossRef]
- Bohnert, H.J.; Sheveleva, E. Plant stress adaptations—Making metabolism move. Curr. Opin. Plant Biol. 1998, 1, 267–274. [Google Scholar] [CrossRef]
- Shabala, S. Plant Stress Physiology. CAB International: Oxford, UK; Oxford, MS, USA, 2012. [Google Scholar]
- Senaratna, T.; Touchell, D.; Bunn, E.; Dixon, K. Acetyl salicylic acid (Aspirin) and salicylic acid induce multiple stress tolerance in bean and tomato plants. Plant Growth Regul. 2000, 30, 157–161. [Google Scholar] [CrossRef]
- Khan, M.I.R.; Fatma, M.; Per, T.S.; Anjum, N.A.; Khan, N.A. Salicylic acid-induced abiotic stress tolerance and underlying mechanisms in plants. Front. Plant Sci. 2015, 6, 462. [Google Scholar] [CrossRef] [PubMed] [Green Version]
- Koo, Y.M.; Heo, A.Y.; Choi, H.W. Salicylic Acid as a Safe Plant Protector and Growth Regulator. Plant Pathol. J. 2020, 36, 1–10. [Google Scholar] [CrossRef]
- Wasternack, C.; Hause, B. Jasmonates and octadecanoids: Signals in plant stress responses and development. Prog. Nucleic Acid Res. Mol. Biol. 2002, 165–221. [Google Scholar]
- Dar, T.A.; Uddin, M.; Khan, M.M.A.; Hakeem, K.R.; Jaleel, H. Jasmonates counter plant stress: A Review. Environ. Exp. Bot. 2015, 115, 49–57. [Google Scholar] [CrossRef]
- Goel, P.; Prasher, S.; Landry, J.; Patel, R.; Bonnell, R.; Viau, A.; Miller, J. Potential of airborne hyperspectral remote sensing to detect nitrogen deficiency and weed infestation in corn. Comput. Electron. Agric. 2003, 38, 99–124. [Google Scholar] [CrossRef]
- Behmann, J.; Steinrücken, J.; Plümer, L. Detection of early plant stress responses in hyperspectral images. ISPRS J. Photogramm. Remote Sens. 2014, 93, 98–111. [Google Scholar] [CrossRef]
- Zhao, F.; Huang, Y.; Guo, Y.; Reddy, K.; Lee, M.; Fletcher, R.; Thomson, S. Early Detection of Crop Injury from Glyphosate on Soybean and Cotton Using Plant Leaf Hyperspectral Data. Remote Sens. 2014, 6, 1538–1563. [Google Scholar] [CrossRef]
- Huang, Y.; Yuan, L.; Reddy, K.N.; Zhang, J. In-situ plant hyperspectral sensing for early detection of soybean injury from dicamba. Biosyst. Eng. 2016, 149, 51–59. [Google Scholar] [CrossRef]
- Sayyari, M.; Salehi, F.; Valero, D. New Approaches to Modeling Methyl Jasmonate Effects on Pomegranate Quality during Postharvest Storage. Int. J. Fruit Sci. 2017, 17, 374–390. [Google Scholar] [CrossRef]
- Do Prado Ribeiro, L.; Klock, A.L.S.; Filho, J.A.W.; Tramontin, M.A.; Trapp, M.A.; Mithöfer, A.; Nansen, C. Hyperspectral imaging to characterize plant–plant communication in response to insect herbivory. Plant Methods 2018, 14, 54. [Google Scholar] [CrossRef] [PubMed] [Green Version]
- Zovko, M.; Žibrat, U.; Knapič, M.; Kovačić, M.B.; Romić, D. Hyperspectral remote sensing of grapevine drought stress. Precis. Agric. 2019, 20, 335–347. [Google Scholar] [CrossRef]
- Wang, J.; Zhang, C.; Shi, Y.; Long, M.; Islam, F.; Yang, C.; He, Y.; Zhou, W. Evaluation of quinclorac toxicity and alleviation by salicylic acid in rice seedlings using ground-based visible/near-infrared hyperspectral imaging. Plant Methods 2020, 16, 30. [Google Scholar] [CrossRef] [Green Version]
- Jackson, R.D. Remote Sensing of Biotic and Abiotic Plant Stress. Annu. Rev. Phytopathol. 1986, 24, 265–287. [Google Scholar] [CrossRef]
- Irmak, S.; Haman, D.Z.; Bastug, R. Determination of Crop Water Stress Index for Irrigation Timing and Yield Estimation of Corn. J. Agron. 2000, 92, 1221. [Google Scholar] [CrossRef]
- Nansen, C.; Macedo, T.; Swanson, R.; Weaver, D.K. Use of spatial structure analysis of hyperspectral data cubes for detection of insect-induced stress in wheat plants. Int. J. Remote Sens. 2009, 30, 2447–2464. [Google Scholar] [CrossRef]
- Lowe, A.; Harrison, N.; French, A.P. Hyperspectral image analysis techniques for the detection and classification of the early onset of plant disease and stress. Plant Methods 2017, 13, 80. [Google Scholar] [CrossRef] [PubMed]
- Nansen, C.; Sidumo, A.J.; Capareda, S. Variogram Analysis of Hyperspectral Data to Characterize the Impact of Biotic and Abiotic Stress of Maize Plants and to Estimate Biofuel Potential. Appl. Spectrosc. 2010, 64, 627–636. [Google Scholar] [CrossRef]
- Susič, N.; Žibrat, U.; Širca, S.; Strajnar, P.; Razinger, J.; Knapič, M.; Voncuna, A.; Urek, G.; Gerič Stare, B. Discrimination between abiotic and biotic drought stress in tomatoes using hyperspectral imaging. Sens. Actuators B Chem. 2018, 273, 842–852. [Google Scholar] [CrossRef] [Green Version]
- Das, B.; Mahajan, G.R.; Singh, R. HRS: Use in Detecting Abiotic Stresses in Agriculture. Adv. Crop. Environ. Interact. 2018, 317–335. [Google Scholar]
- Mahlein, A.-K. Plant Disease Detection by Imaging Sensors—Parallels and Specific Demands for Precision Agriculture and Plant Phenotyping. Plant Dis. 2016, 100, 241–251. [Google Scholar] [CrossRef] [PubMed] [Green Version]
- Behmann, J.; Acebron, K.; Emin, D.; Bennertz, S.; Matsubara, S.; Thomas, S.; Bohnenkamp, D.; Kuska, M.T.; Jussila, J.; Salo, H.; et al. Specim IQ: Evaluation of a new, miniaturized handheld hyperspectral camera and its application for plant phenotyping and disease detection. Sensors 2018, 18, 441. [Google Scholar] [CrossRef] [PubMed] [Green Version]
- Singh, A.K.; Ganapathysubramanian, B.; Sarkar, S.; Singh, A. Deep Learning for Plant Stress Phenotyping: Trends and Future Perspectives. Trends Plant Sci. 2018, 23, 883–898. [Google Scholar] [CrossRef] [Green Version]
- Brugger, A.; Behmann, J.; Paulus, S.; Luigs, H.-G.; Kuska, M.T.; Schramowski, P.; Kersting, K.; Steiner, U.; Mahlein, A.-K. Extending Hyperspectral Imaging for Plant Phenotyping to the UV-Range. Remote Sens. 2019, 11, 1401. [Google Scholar] [CrossRef] [Green Version]
- Mutka, A.M.; Bart, R.S. Image-based phenotyping of plant disease symptoms. Front. Plant Sci. 2015, 5, 734. [Google Scholar] [CrossRef] [Green Version]
- Mutka, A.M.; Fentress, S.J.; Sher, J.W.; Berry, J.C.; Pretz, C.; Nusinow, D.A.; Bart, R. Quantitative, Image-Based Phenotyping Methods Provide Insight into Spatial and Temporal Dimensions of Plant Disease. Plant Physiol. 2016, 172, 650–660. [Google Scholar] [CrossRef] [Green Version]
- Roháček, K.; Soukupová, J.; Barták, M. Chlorophyll fluorescence: A wonderful tool to study plant physiology and plant stress. Res. Signpost. 2008, 37, 41–104. [Google Scholar]
- Bauriegel, E.; Giebel, A.; Herppich, W.B. Hyperspectral and Chlorophyll Fluorescence Imaging to Analyse the Impact of Fusarium culmorum on the Photosynthetic Integrity of Infected Wheat Ears. Sensors 2011, 11, 3765–3779. [Google Scholar] [CrossRef] [Green Version]
- Yu, K.; Leufen, G.; Hunsche, M.; Noga, G.; Chen, X.; Bareth, G. Investigation of Leaf Diseases and Estimation of Chlorophyll Concentration in Seven Barley Varieties Using Fluorescence and Hyperspectral Indices. Remote Sens. 2013, 6, 64–86. [Google Scholar] [CrossRef] [Green Version]
- Pérez-Bueno, M.L.; Pineda, M.; Barón, M. Phenotyping Plant Responses to Biotic Stress by Chlorophyll Fluorescence Imaging. Front. Plant Sci. 2019, 10, 1135. [Google Scholar] [CrossRef] [PubMed]
- Basati, Z.; Jamshidi, B.; Rasekh, M.; Abbaspour-Gilandeh, Y. Detection of sunn pest-damaged wheat samples using visible/near-infrared spectroscopy based on pattern recognition. Spectrochim. Acta A Mol. Biomol. Spectrosc. 2018, 203, 308–314. [Google Scholar] [CrossRef]
- Kumar, J.; Vashisth, A.; Sehgal, V.K.; Gupta, V.K. Assessment of Aphid Infestation in Mustard by Hyperspectral Remote Sensing. J. Indian Soc. Remote Sens. 2012, 41, 83–90. [Google Scholar] [CrossRef]
- Canário, D.V.P.; Figueiredo, E.; Franco, J.C.; Guerra, R. Detecting early mealybug infestation stages on tomato plants using optical spectroscopy. Eur. J. Hortic. Sci. 2017, 82, 141–148. [Google Scholar]
- Zhang, J.; Huang, Y.; Pu, R.; Gonzalez-Moreno, P.; Yuan, L.; Wu, K.; Huang, W. Monitoring plant diseases and pests through remote sensing technology: A review. Comput. Electron. Agric. 2019, 165, 104943. [Google Scholar] [CrossRef]
- Yan, T.; Xu, W.; Lin, J.; Duan, L.; Gao, P.; Zhang, C.; Lu, X. Combining Multi-Dimensional Convolutional Neural Network (CNN) With Visualization Method for Detection of Aphis gossypii Glover Infection in Cotton Leaves Using Hyperspectral Imaging. Front. Plant Sci. 2021, 12, 74. [Google Scholar] [CrossRef] [PubMed]
- Carter, G.A.; Knapp, A.K. Leaf optical properties in higher plants: Linking spectral characteristics to stress and chlorophyll concentration. Am. J. Bot. 2001, 88, 677–684. [Google Scholar] [CrossRef] [PubMed] [Green Version]
- Gitelson, A.A.; Merzlyak, N.M.; Chivkunova, B.O. Optical properties and non-destructive estimation of anthocyanin content in plant leaves. Photochem. Photobiol. 2001, 74, 38–45. [Google Scholar] [CrossRef]
- Carter, G.A.; Spiering, B.A. Optical Properties of Intact Leaves for Estimating Chlorophyll Concentration. J. Environ. Qual. 2002, 31, 1424. [Google Scholar] [CrossRef]
- Jacquemoud, S.; Baret, F. PROSPECT: A model of leaf optical properties spectra. Remote Sens. Environ. 1990, 34, 75–91. [Google Scholar] [CrossRef]
- Jacquemoud, S.; Ustin, S.L. Leaf optical properties: A State of the art. In Proceedings of the 8th International Symposium of Physical Measurements & Signatures in Remote Sensing—CNES, Aussois, France, 8–12 January 2001. [Google Scholar]
- Jacquemoud, S.; Ustin, S. Leaf Optical Properties; Cambridge University Press: Cambridge, UK, 2019. [Google Scholar]
- Yao, X.; Zhu, Y.; Tian, Y.; Feng, W.; Cao, W. Exploring hyperspectral bands and estimation indices for leaf nitrogen accumulation in wheat. Appl. Earth. Obs. Geoinf. 2010, 12, 89–100. [Google Scholar] [CrossRef]
- Stellacci, A.M.; Castrignanò, A.; Troccoli, A.; Basso, B.; Buttafuoco, G. Selecting optimal hyperspectral bands to discriminate nitrogen status in durum wheat: A comparison of statistical approaches. Environ. Monit. Assess. 2016, 188, 1–15. [Google Scholar] [CrossRef] [PubMed]
- Thompson, L.J.; Puntel, L.A. Transforming Unmanned Aerial Vehicle (UAV) and Multispectral Sensor into a Practical Decision Support System for Precision Nitrogen Management in Corn. Remote Sens. 2020, 12, 1597. [Google Scholar] [CrossRef]
- Devadas, R.; Lamb, D.W.; Simpfendorfer, S.; Backhouse, D. Evaluating ten spectral vegetation indices for identifying rust infection in individual wheat leaves. Precis. Agric. 2008, 10, 459–470. [Google Scholar] [CrossRef]
- Zhao, Y.-R.; Li, X.; Yu, K.-Q.; Cheng, F.; He, Y. Hyperspectral Imaging for Determining Pigment Contents in Cucumber Leaves in Response to Angular Leaf Spot Disease. Sci. Rep. 2016, 6, 27790. [Google Scholar] [CrossRef] [PubMed]
- He, R.; Li, H.; Qiao, X.; Jiang, J. Using wavelet analysis of hyperspectral remote-sensing data to estimate canopy chlorophyll content of winter wheat under stripe rust stress. Int. J. Remote Sens. 2018, 39, 4059–4076. [Google Scholar] [CrossRef]
- Zhao, Y.; Yu, K.; Feng, C.; Cen, H.; He, Y. Early Detection of Aphid (Myzus persicae) Infestation on Chinese Cabbage by Hyperspectral Imaging and Feature Extraction. Trans. ASABE 2017, 60, 1045–1051. [Google Scholar] [CrossRef]
- Pandey, P.; Ge, Y.; Stoerger, V.; Schnable, J.C. High Throughput In vivo Analysis of Plant Leaf Chemical Properties Using Hyperspectral Imaging. Front. Plant Sci. 2017, 8, 1348. [Google Scholar] [CrossRef] [Green Version]
- Zhou, W.; Zhang, J.; Zou, M.; Liu, X.; Du, X.; Wang, Q.; Liu, Y.; Liu, Y.; Li, J. Prediction of cadmium concentration in brown rice before harvest by hyperspectral remote sensing. Environ. Sci. Pollut. Res. 2018, 26, 1848–1856. [Google Scholar] [CrossRef] [PubMed]
- Ge, Y.; Atefi, A.; Zhang, H.; Miao, C.; Ramamurthy, R.K.; Sigmon, B.; Yang, J.; Schnable, J.C. High-throughput analysis of leaf physiological and chemical traits with VIS–NIR–SWIR spectroscopy: A case study with a maize diversity panel. Plant Methods 2019, 15, 66. [Google Scholar] [CrossRef] [PubMed] [Green Version]
- Hu, N.; Li, W.; Du, C.; Zhang, Z.; Gao, Y.; Sun, Z.; Yang, L.; Yu, K.; Zhang, Y.; Wang, Z. Predicting micronutrients of wheat using hyperspectral imaging. Food Chem. 2021, 343, 128473. [Google Scholar] [CrossRef] [PubMed]
- Fuentes, S.; Tongson, E.; Unnithan, R.R.; Gonzalez Viejo, C. Early Detection of Aphid Infestation and Insect-Plant Interaction Assessment in Wheat Using a Low-Cost Electronic Nose (E-Nose), Near-Infrared Spectroscopy and Machine Learning Modeling. Sensors 2021, 21, 5948. [Google Scholar] [CrossRef] [PubMed]
- Fang, Y.; Ramasamy, R.P. Current and prospective methods for plant disease detection. Biosensors 2015, 5, 537–561. [Google Scholar] [CrossRef] [PubMed] [Green Version]
- Müller, C.; Hosgood, B.; Andreoli, G. Physical mechanisms in hyperspectral BRDF data of grass and watercress. Remote Sens. Environ. 1998, 66, 222–233. [Google Scholar]
- Ferwerda, J.G.; Skidmore, A.K.; Mutanga, O. Nitrogen detection with hyperspectral normalized ratio indices across multiple plant species. Int. J. Remote Sens. 2005, 26, 4083–4095. [Google Scholar] [CrossRef]
- López-Higuera, J.M. Sensing Using Light: A Key Area of Sensors. Sensors 2021, 21, 6562. [Google Scholar] [CrossRef]
- Farber, C.; Mahnke, M.; Sanchez, L.; Kurouski, D. Advanced Spectroscopic Techniques for Plant Disease Diagnostics. A Review. Trends Anal. Chem. 2019, 118, 43–49. [Google Scholar] [CrossRef]
- Weng, S.; Hu, X.; Wang, J.; Tang, L.; Li, P.; Zheng, S.; Zheng, L.; Huang, L.; Xin, Z. Advanced Application of Raman Spectroscopy and Surface-Enhanced Raman Spectroscopy in Plant Disease Diagnostics: A Review. J. Agric. Food Chem. 2021, 69, 2950–2964. [Google Scholar] [CrossRef]
Figure 1.
Hyperspectral data retrieval and processing (remastered from [14,15]). (A) Reflected light collection by the hyperspectral camera, (B) a hyperspectral data cube, (C) data normalization, (D) feature extraction, (E) automation of the classification process.


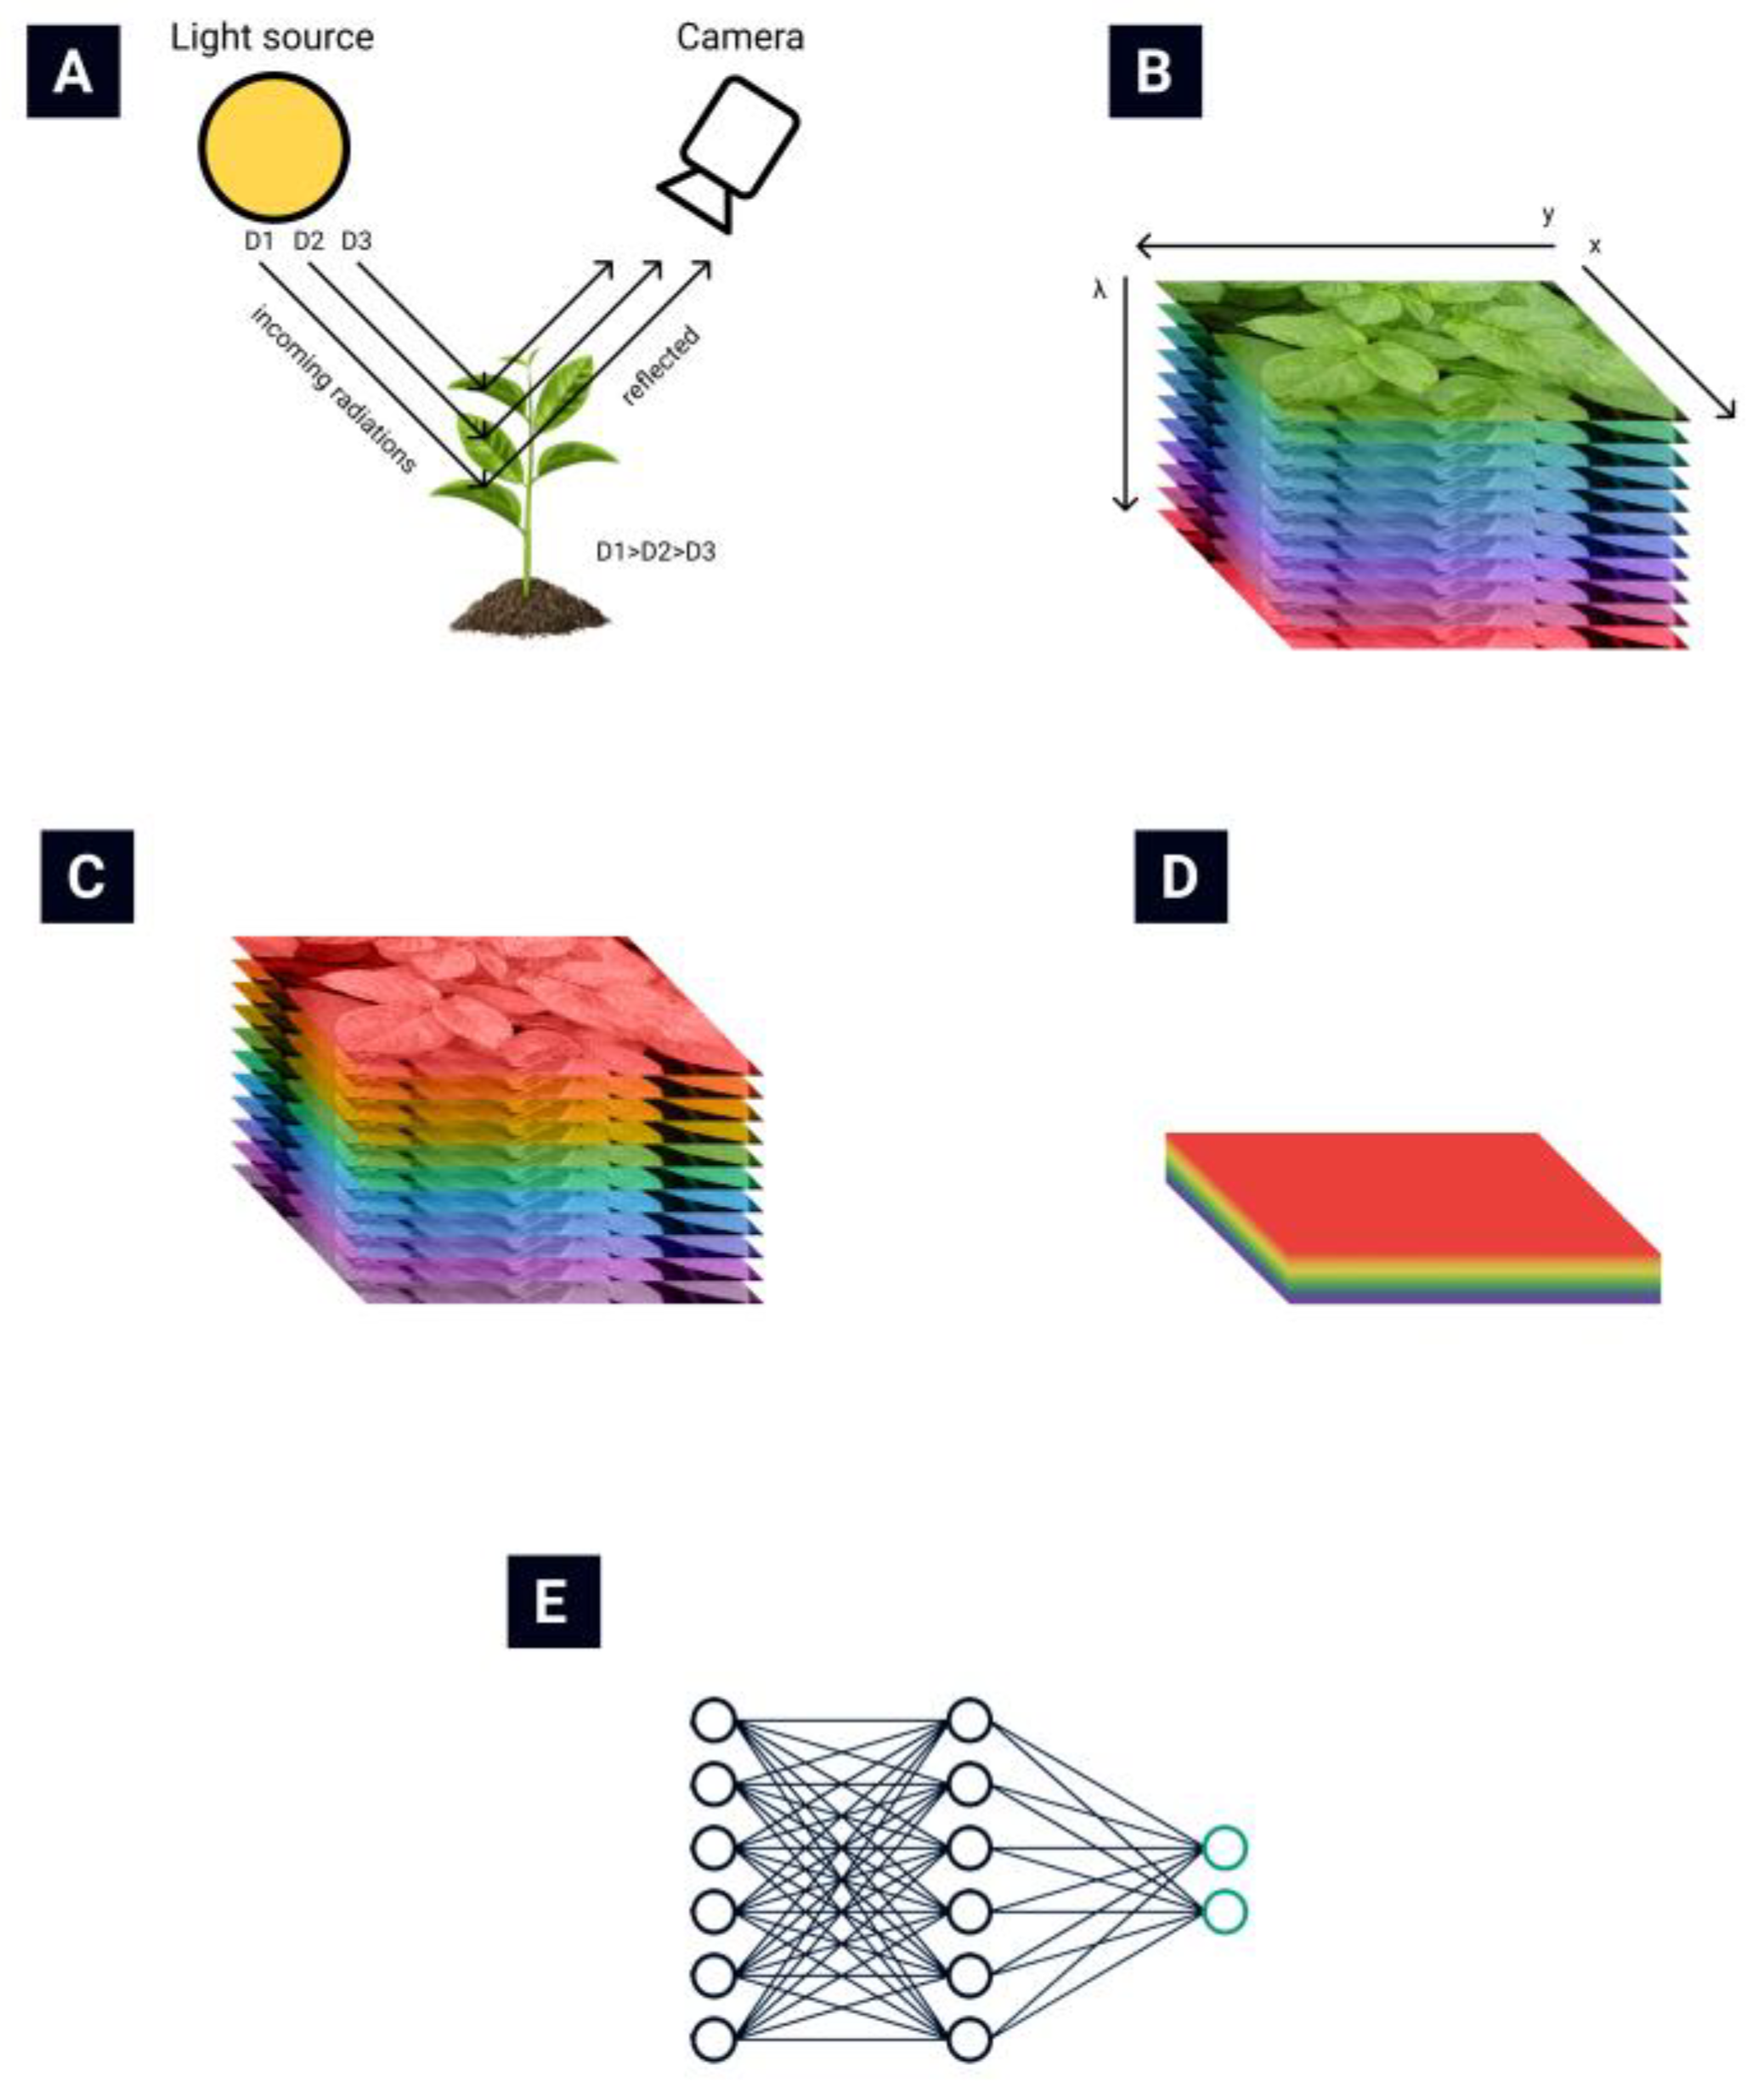
Table 1.
Oil palm disease early detection by HRS.
| Publication Year | Culture | Treat | Equipment | Studied Bands | Important Bands | Study Type | Reference | Location |
|---|---|---|---|---|---|---|---|---|
| 2009 | oil palm | basal stem rot | APOGEE spectroradiometer of unmentioned model | 450–1100 | 715, 734, 791 | field | [52] | Malaysia |
| 2009 | oil palm | basal stem rot | APOGEE spectroradiometer of unmentioned model | 300–1000 | 462, 487, 610.5, 738, 749 | field | [53] | Malaysia |
| 2010 | oil palm | basal stem rot | PP Systems Unispec-SC spectrometer | 310–1130 | 670–715, 490–520, 730–770, 920–970 | field | [50,51] | Indonesia |
| 2011 | oil palm | basal stem rot | APOGEE spectroradiometer of unmentioned model | 350–1000 | 495, 495.5, 496, 651.5, 652, 652.5, 653, 653.5, 654, 654.5, 655, 655.5, 656, 656.5, 657, 657.5, 658, 658.5, 659, 659.5, 660, 660.5, 661, 908 | field | [55] | Malaysia |
| 2014 | oil palm | basal stem rot | ASD spectrometer of unmentioned model | 325–1040 | not mentioned | field | [58] | Malaysia |
| 2017 | oil palm | basal stem rot | APOGEE spectroradiometer of unmentioned model | 325–1000 | 495, 495.5, 496, 651.5, 652, 652.5, 653, 653.5, 654, 654.5, 655, 655.5, 656, 656.5, 657, 657.5, 658, 658.5, 659, 659.5, 660, 660.5, 661, 908 | field | [56] | Malaysia |
| 2017 | oil palm | basal stem rot | GER 1500 spectrometer | 273–1100 | 540–560, 650–780 | field | [59] | Malaysia |
| 2018 | oil palm | basal stem rot | Specim spectrograph of unmentioned model | 350–1000 | 650–750 | field | [57] | Malaysia |
| 2020 | oil palm | basal stem rot | Cubert S185 camera | 325–1075 | 800–950 | greenhouse | [60] | Malaysia |
| 2014 | oil palm | orange spotting | ASD FieldSpec 4 spectrometer | 300–1050 | 400–401, 404–405, 455–499, 500–599, 600–699, 700–712 | field | [63,64] | Malaysia |
| 2019 | oil palm | orange spotting | ASD HandHeld 2 spectrometer | 400–1050 | 601–630 | field | [36] | Malaysia |
| 2019 | oil palm | orange spotting | ASD HandHeld 2 spectrometer | 325–1075 | 680–780 | field | [65,66] | Malaysia |
Table 2.
Citrus disease early detection by HRS.
| Publication Year | Culture | Treat | Equipment | Studied Bands | Important Bands | Study Type | Reference | Location |
|---|---|---|---|---|---|---|---|---|
| 2012 | citrus | citrus greening | Spectra Vista SVC HR-1024 spectrometer | 350–2500 | 537, 612, 638, 662, 688, 713, 763, 813, 998, 1066, 1120, 1148, 1296, 1445, 1472, 1546, 1597, 1622, 1746, 1898, 2121, 2172, 2348, 2471, 2493 | field | [73,74,75] | USA |
| 2012 | citrus (orange) | citrus greening | Spectra Vista SVC HR-1024 spectrometer & Varian Cary 500 Scan | 457–921 | 650–850 | field and lab | [76] | USA |
| 2012 | citrus (orange) | citrus greening | Specim Aisa Eagle camera | 457–921 | 410–432, 440–509, 634–686, 734–927, 932, 951, 975, 980 | field | [77] | USA |
| 2018 | citrus | citrus greening | Specim Imspector V10E spectrograph combined with camera | 379–1023 | 493, 515, 665, 716, 739 | lab | [78] | China |
| 2019 | citrus | citrus greening | Cubert S185 camera and ASD HandHeld 2 spectrometer | 400–1000 | 544, 718, 753, 760, 764, 930, 938, 943, 951, 969, 985, 998, 999 | field | [80] | China |
| 2020 | citrus | citrus greening | Cubert S185 camera & ASD HandHeld 2 spectrometer | 450–950, 325–1075 | 468, 504, 512, 516, 528, 536, 632, 680, 688, 852 | field | [79] | China |
| 2020 | citrus | citrus greening | ASD HandHeld 2 spectrometer | 370–1000 | not mentioned | field | [83] | China |
Table 3.
Solanaceae disease early detection by HRS.
| Publication Year | Culture | Treat | Equipment | Studied Bands | Important Bands | Study Type | Reference | Location |
|---|---|---|---|---|---|---|---|---|
| 2003 | tomato | late blight | Megatech GER-2600 spectrometer | 400–2500 | 750–930, 950–1030, 1040–1130 | field | [98] | USA |
| 2014 | tobacco | TSWV | Ocean Optics USB2000 spectrometer | 450–850 | 475.22, 489.37, 524.29, 539.65, 552.82, 667.33, 703.56, 719.31, 724.31, 758.39 | greenhouse | [101] | Bulgaria |
| 2015 | tomato | late blight, early blight | Specim Imspector V10E spectrograph combined with camera | 400–1000 | 442, 508, 573, 696, 715 | lab | [102] | China |
| 2017 | tomato | gray mold | Specim Imspector V10E spectrograph combined with camera | 380–1023 | 655, 746, 759–761 | lab | [103] | China |
| 2017 | tomato | yellow leaf curl | Specim Imspector V10E spectrograph combined with camera | 450–1000 | 560–575, 712–729, 750–950 | lab | [91] | China |
| 2017 | tobacco | TMV | Specim Imspector V10E spectrograph combined with camera | 450–1000 | 697.44, 639.04, 938.22, 719.15, 749.90, 874.91, 459.58, 971.78 | lab, greenhouse | [107,108] | China |
| 2018 | tomato | late blight, target and bacterial spot | Spectra Vista SVC HR-1024 spectrometer | 350–2500 | 445, 450, 690, 707, 750, 800, 1070, 1200 | lab | [92] | USA |
| 2018 | tomato | TSWV | Specim Imspector V10E spectrograph combined with camera | 400–1000 | 700–1000 | lab | [104] | Israel |
| 2018 | potato | PVY | ASD FieldSpec 4 spectrometer | 350–2500 | 500–900, 720–1300 | field | [94] | USA |
| 2019 | tomato | late blight, blackleg | StellarNet Blue Wave spectrometer | 400–1000 | not mentioned | greenhouse, field | [110] | UK |
| 2019 | tobacco | TSWV | Surface optics SOC710VP camera | 400–1000 | 780–1000 | lab | [106] | China |
| 2019 | potato | PVY | Specim FX10 camera | 400–1000 | not mentioned | field | [93] | The Netherlands |
| 2019 | potato | early blight | Specim Imspector V10E spectrograph combined with camera | 430–900 | 550, 680, 720–750 | field | [95] | Belgium |
| 2019 | tomato | bacterial spot, target spot | Resonon Pika L camera | 380–1020 | 408–420, 630–650, 730–750 | lab and field | [97] | USA |
| 2019 | pepper early | TSWV | Specim Imspector V10E spectrograph combined with a camera | 400–1000 | 700–1000 | lab | [105] | Israel |
| 2019 | potato | late blight | Senop Oy Rikola camera | 500–900 | 620, 724, 803 | field | [111] | The Netherlands |
| 2020 | tomato | yellow leaf curl, bacterial spot | Resonon Pika L camera | 380–1020 | 550–850 | lab and field | [97] | USA |
| 2020 | tomato early | ToCV | PP Systems Unispec-SC spectrometer | 310–1100 | 402.2, 405.5, 412.2, 415.6, 425.7, 429.0, 449.2, 556.4, 559.7, 563.0, 566.4, 676.4, 679.7, 722.9, 726.3, 862.1 | lab | [109] | Greece |
| 2020 | potato | late blight | ASD FieldSpec 4 spectrometer | 400–900 | 439–481, 554–559, 654–671, 702–709 | lab | [99] | Canada |
| 2020 | potato | late blight | ASD FieldSpec 4 spectrometer | 660–780 | 668, 705, 717, 740 | lab | [100] | Canada |
| 2020 | potato early | late blight, early blight | Spectra Vista SVC HR-1024 spectrometer | 350–2500 | 700, 857, 970, 990, 1100, 1241, 1380, 1890, 2300 | lab | [112,113] | USA |
Table 4.
Wheat disease early detection by HRS.
| Publication Year | Culture | Treat | Equipment | Studied Bands | Important Bands | Study Type | Reference | Location |
|---|---|---|---|---|---|---|---|---|
| 2000 | wheat | fusarium | Specim Imspector V9 spectrometer combined with camera | 425–860 | not mentioned | lab | [124] | USA |
| 2011 | wheat | fusarium | Specim Imspector V10E spectrograph combined with camera | 400–1000 | 500–533, 560–675, 682–733 | lab and field | [133] | Germany |
| 2015 | wheat | fusarium | Headwall Photonics Hyperspec Model 1003B-10151 spectrometer combined with a camera | 520–1785 | 1411 | lab | [125] | Brazil |
| 2018 | wheat | fusarium | Specim Imspector V10E and ImSpector N25E spectrographs | 400–1000, 1000–2500 | 430–525, 560–710, 1115–2500 | greenhouse | [126,127] | Germany |
| 2018 | wheat | fusarium, yellow rust | Gilden Photonics camera | 400–1000 | 650–700 | lab, field | [131,132] | UK |
| 2019 | wheat | fusarium | ASD FieldSpec Pro spectrometer | 350–2500 | 471, 696, 841, 963, 1069, 2272 | field | [128] | China |
| 2019 | wheat | fusarium | Surface optics SOC710VP camera | 400–1000 | 447, 539, 668, 673 | field | [129] | China |
| 2020 | wheat | fusarium | Surface optics SOC710VP camera | 400–1000 | 560, 565, 570, 661, 663, 678 | field | [130] | China |
| 2020 | wheat | fusarium | ASD FieldSpec Pro spectrometer | 350–2500 | 350–400, 500–600, 720–1000 | field | [24] | China |
| 2007 | wheat | yellow rust | ASD FieldSpec Pro spectrometer | 350–2500 | not mentioned | field | [140] | China |
| 2012 | wheat | yellow rust | ASD FieldSpec Pro spectrometer | 350–2500 | not mentioned | field | [141] | China |
| 2014 | wheat | yellow rust | ASD FieldSpec Pro spectrometer | 350–2500 | 428, 672, 1399 | field | [142] | India |
| 2019 | wheat | yellow rust | ASD FieldSpec Pro spectrometer | 350–1000 | 460–720, 568–709, 725–1000 | field | [148] | China |
| 2019 | wheat | yellow rust | Specim ImSpector PFD V10E camera, Senop Oy Rikola camera | 400–1000, 500–900 | 594, 601, 706, 780, 797, 874, 881 | field | [146,147] | Germany |
| 2019 | wheat | yellow rust | Cubert S185 camera | 450–950 | not mentioned | field | [143] | China |
| 2019 | wheat | yellow rust | Headwall Photonics VNIR imaging sensor, Cubert S185 camera | 400–1000 | 538, 598, 689, 702, 751, 895 | lab, field | [144,145] | China |
Table 5.
Comparative analysis of hyperspectral remote sensing usage.
| Spectrometer | Spectrometer with a Camera | Hyperspectral Camera | |
|---|---|---|---|
| total articles | 32 | 13 | 16 |
| early detection | 8 | 4 | 6 |
| total/early ratio | 25% | 33.33% | 37.50% |
| accuracy > 90% | 15 | 13 | 11 |
| accuracy > 90%/total articles ratio | 46.88% | 100% | 68.75% |
Publisher’s Note: MDPI stays neutral with regard to jurisdictional claims in published maps and institutional affiliations. |
© 2022 by the authors. Licensee MDPI, Basel, Switzerland. This article is an open access article distributed under the terms and conditions of the Creative Commons Attribution (CC BY) license (https://creativecommons.org/licenses/by/4.0/).
Share and Cite
MDPI and ACS Style
Terentev, A.; Dolzhenko, V.; Fedotov, A.; Eremenko, D. Current State of Hyperspectral Remote Sensing for Early Plant Disease Detection: A Review. Sensors 2022, 22, 757. https://doi.org/10.3390/s22030757
AMA Style
Terentev A, Dolzhenko V, Fedotov A, Eremenko D. Current State of Hyperspectral Remote Sensing for Early Plant Disease Detection: A Review. Sensors. 2022; 22(3):757. https://doi.org/10.3390/s22030757
Chicago/Turabian StyleTerentev, Anton, Viktor Dolzhenko, Alexander Fedotov, and Danila Eremenko. 2022. "Current State of Hyperspectral Remote Sensing for Early Plant Disease Detection: A Review" Sensors 22, no. 3: 757. https://doi.org/10.3390/s22030757
Note that from the first issue of 2016, this journal uses article numbers instead of page numbers. See further details here.