
Indoor Location Data for Tracking Human Behaviours: A Scoping Review

 ,
,
Abstract
:1. Introduction
2. Methods
2.1. Search Strategy
2.2. Study Selection
2.3. Data Extraction
3. Results
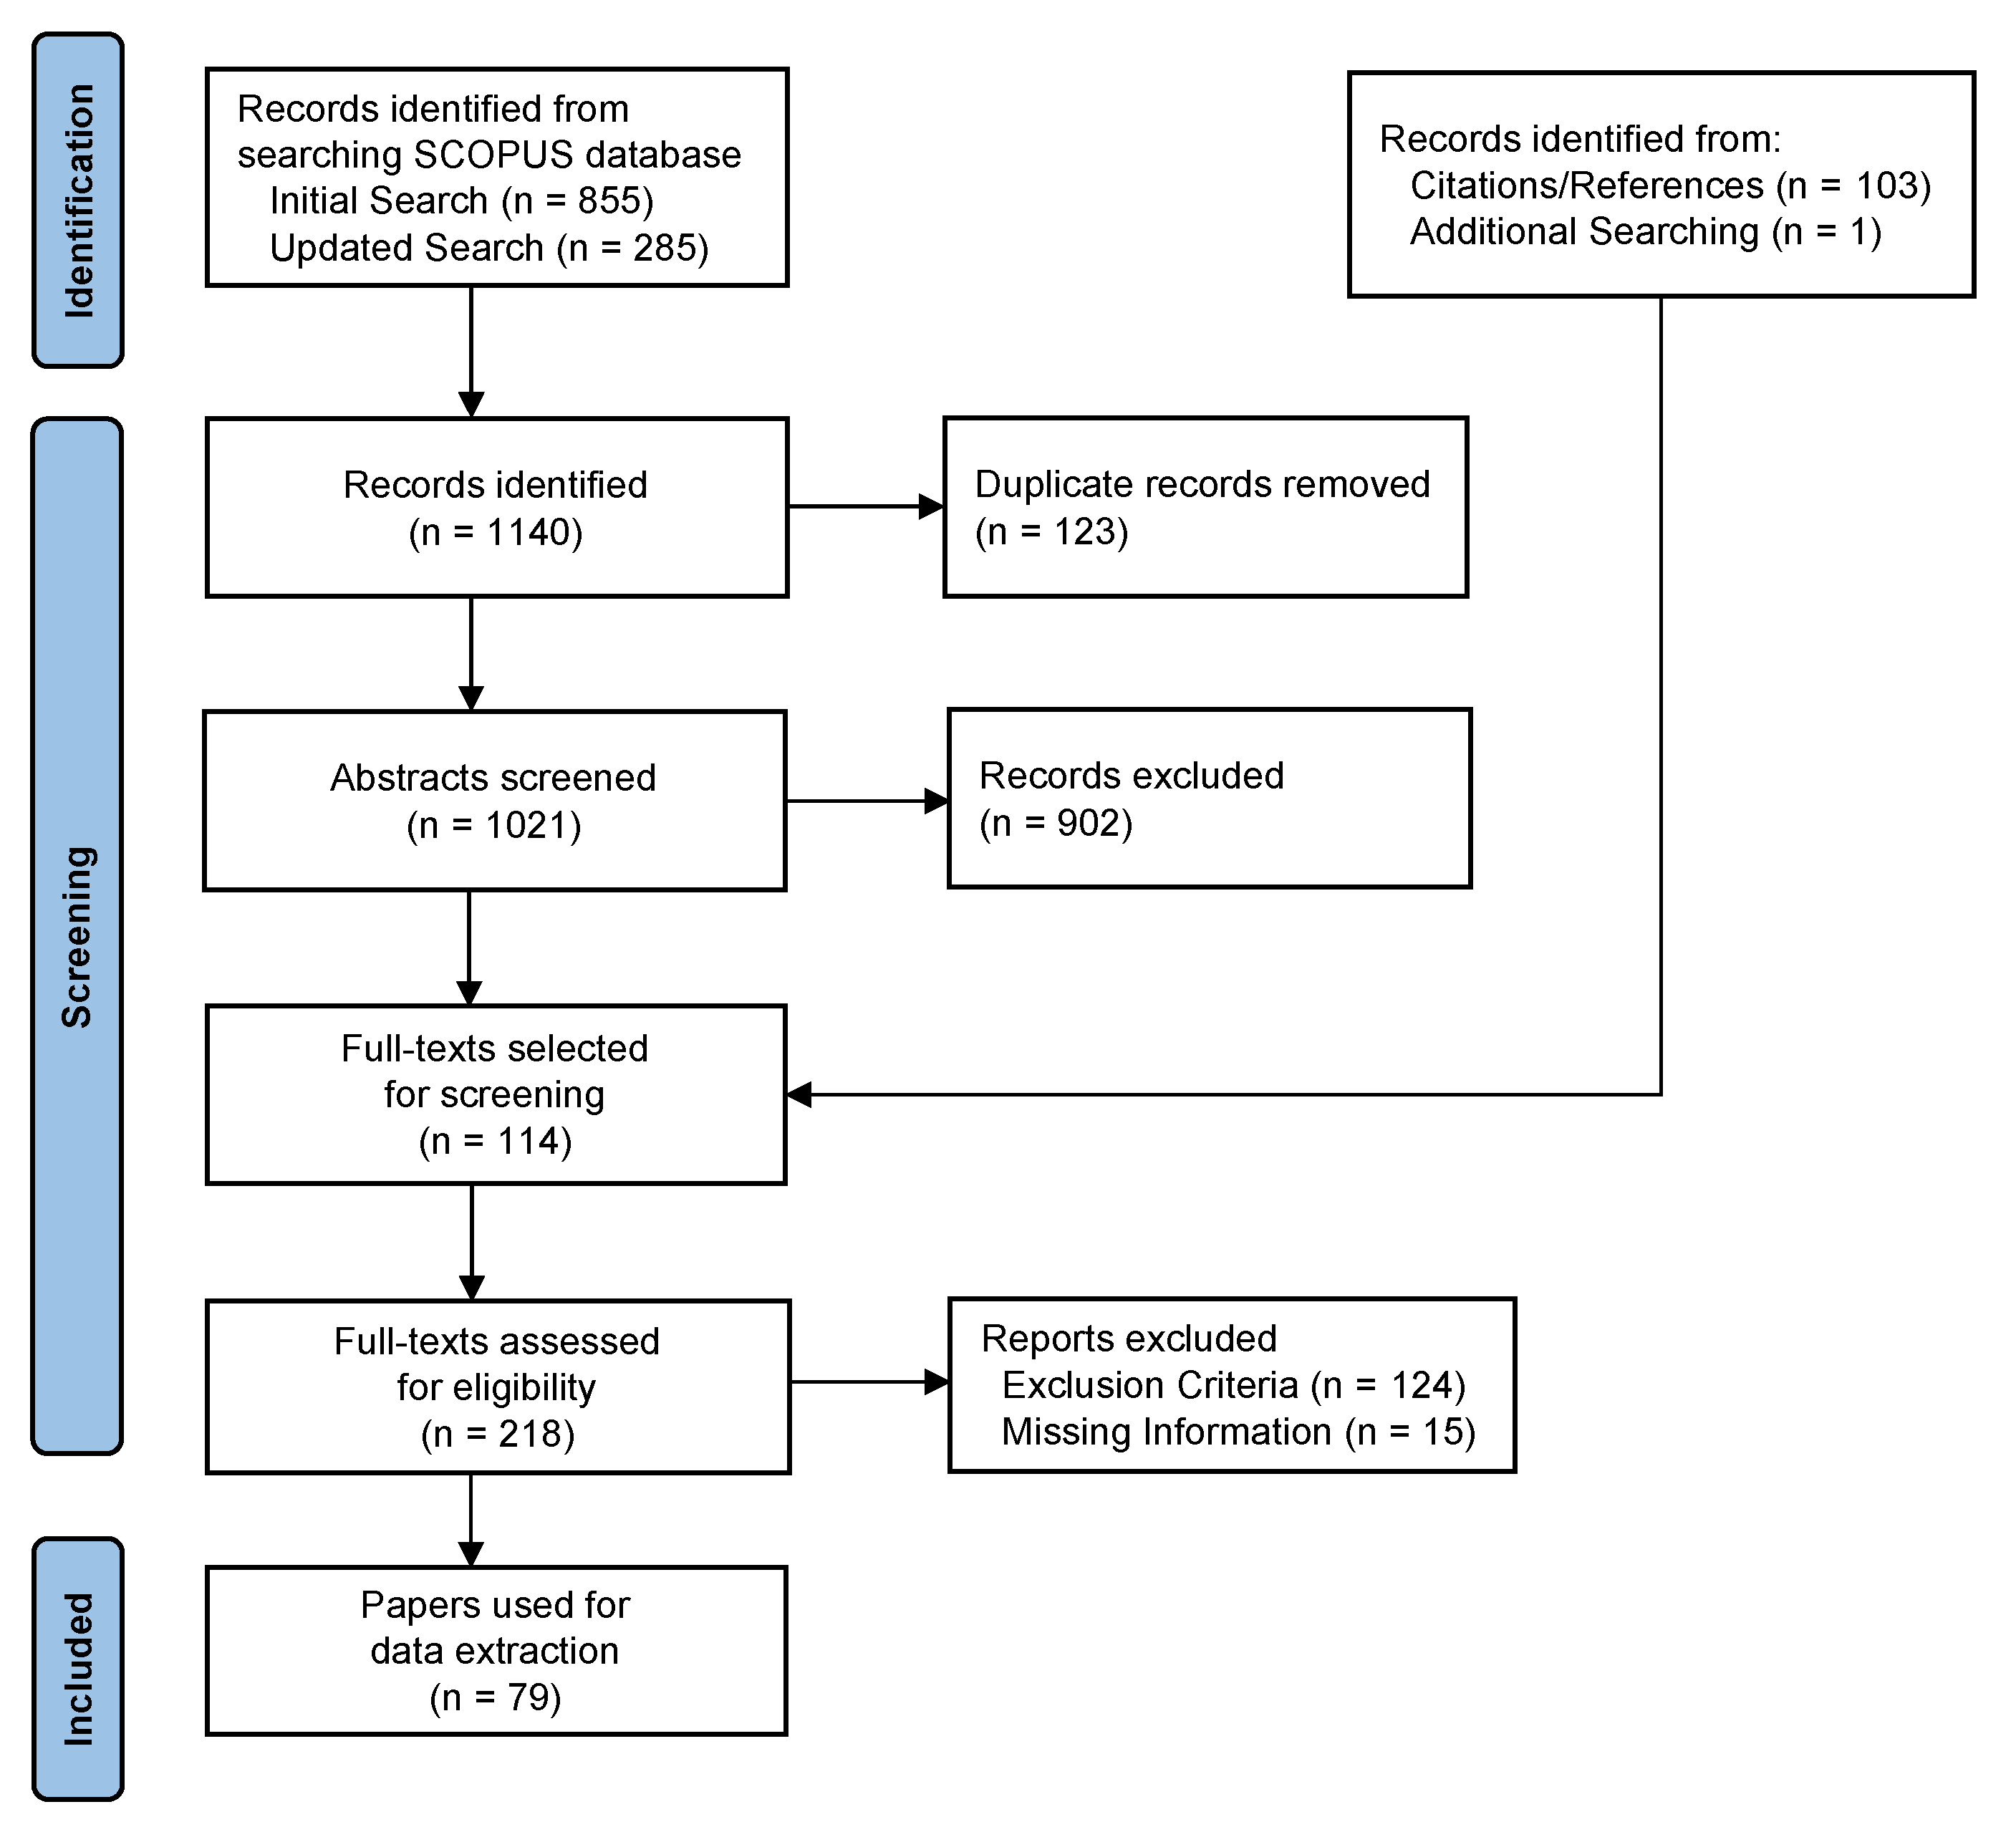
3.1. Search Results
3.2. Application Sectors and Study Populations
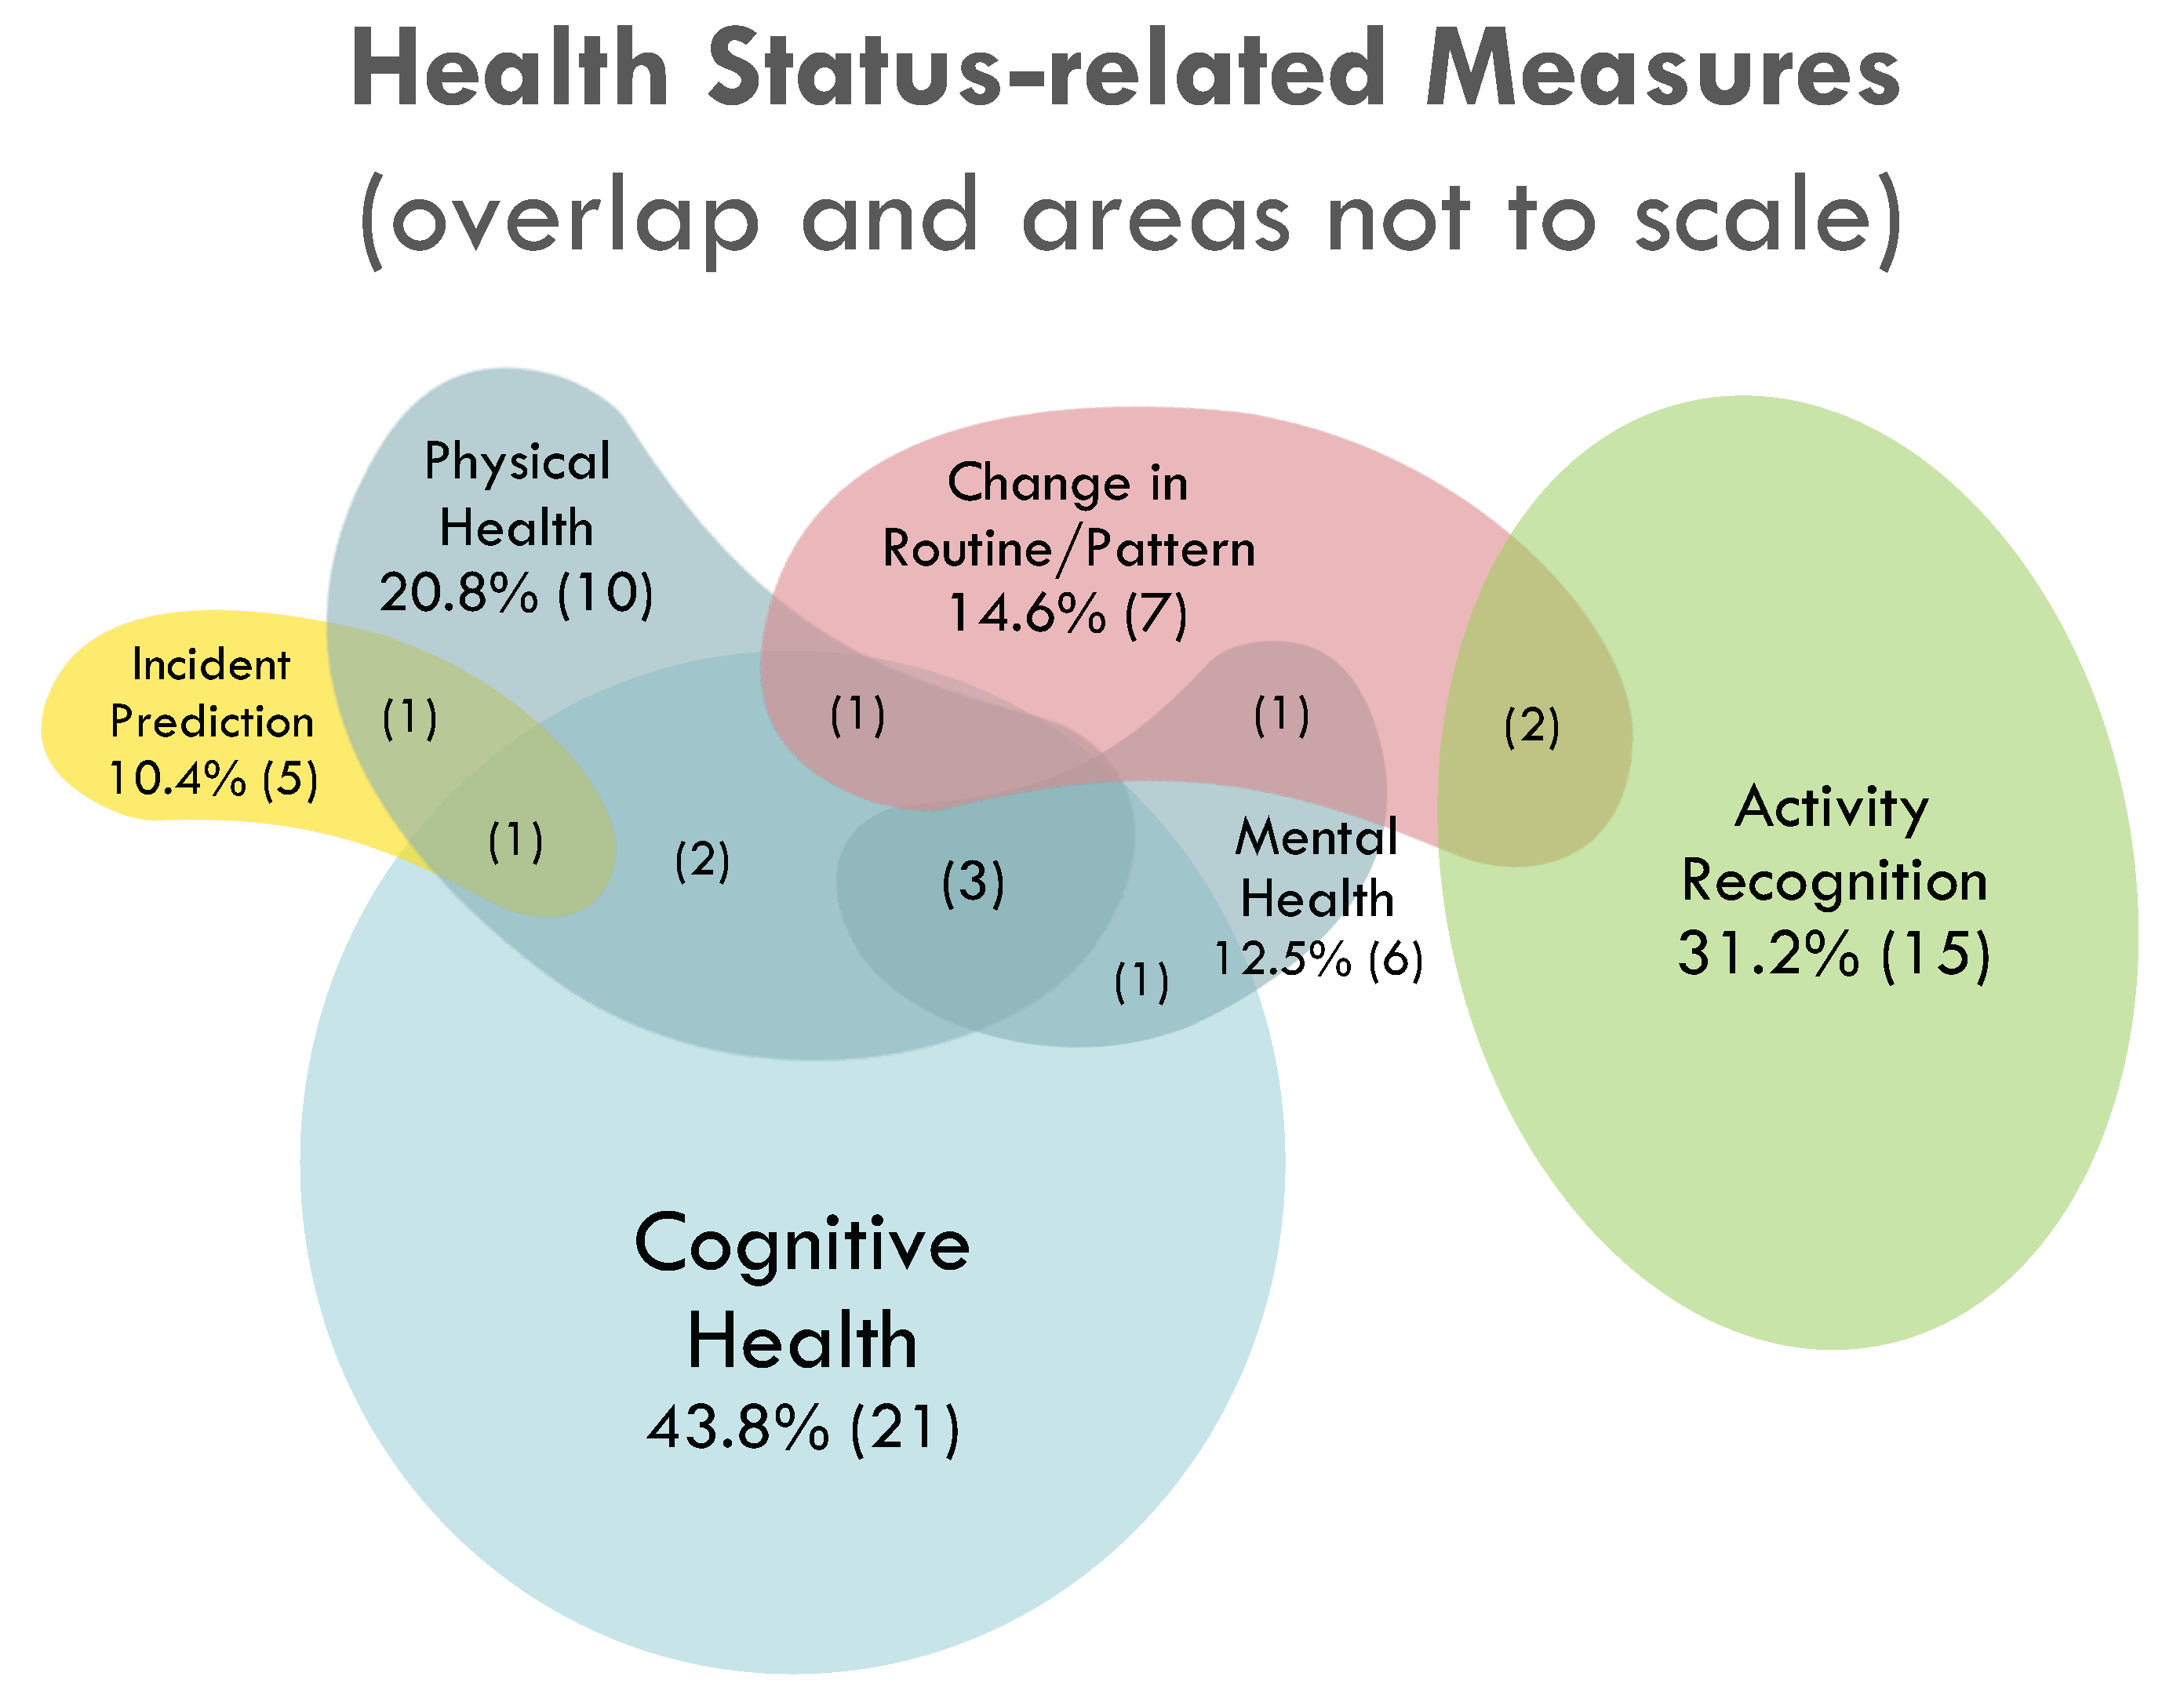
3.3. Types of Symptoms and Measures
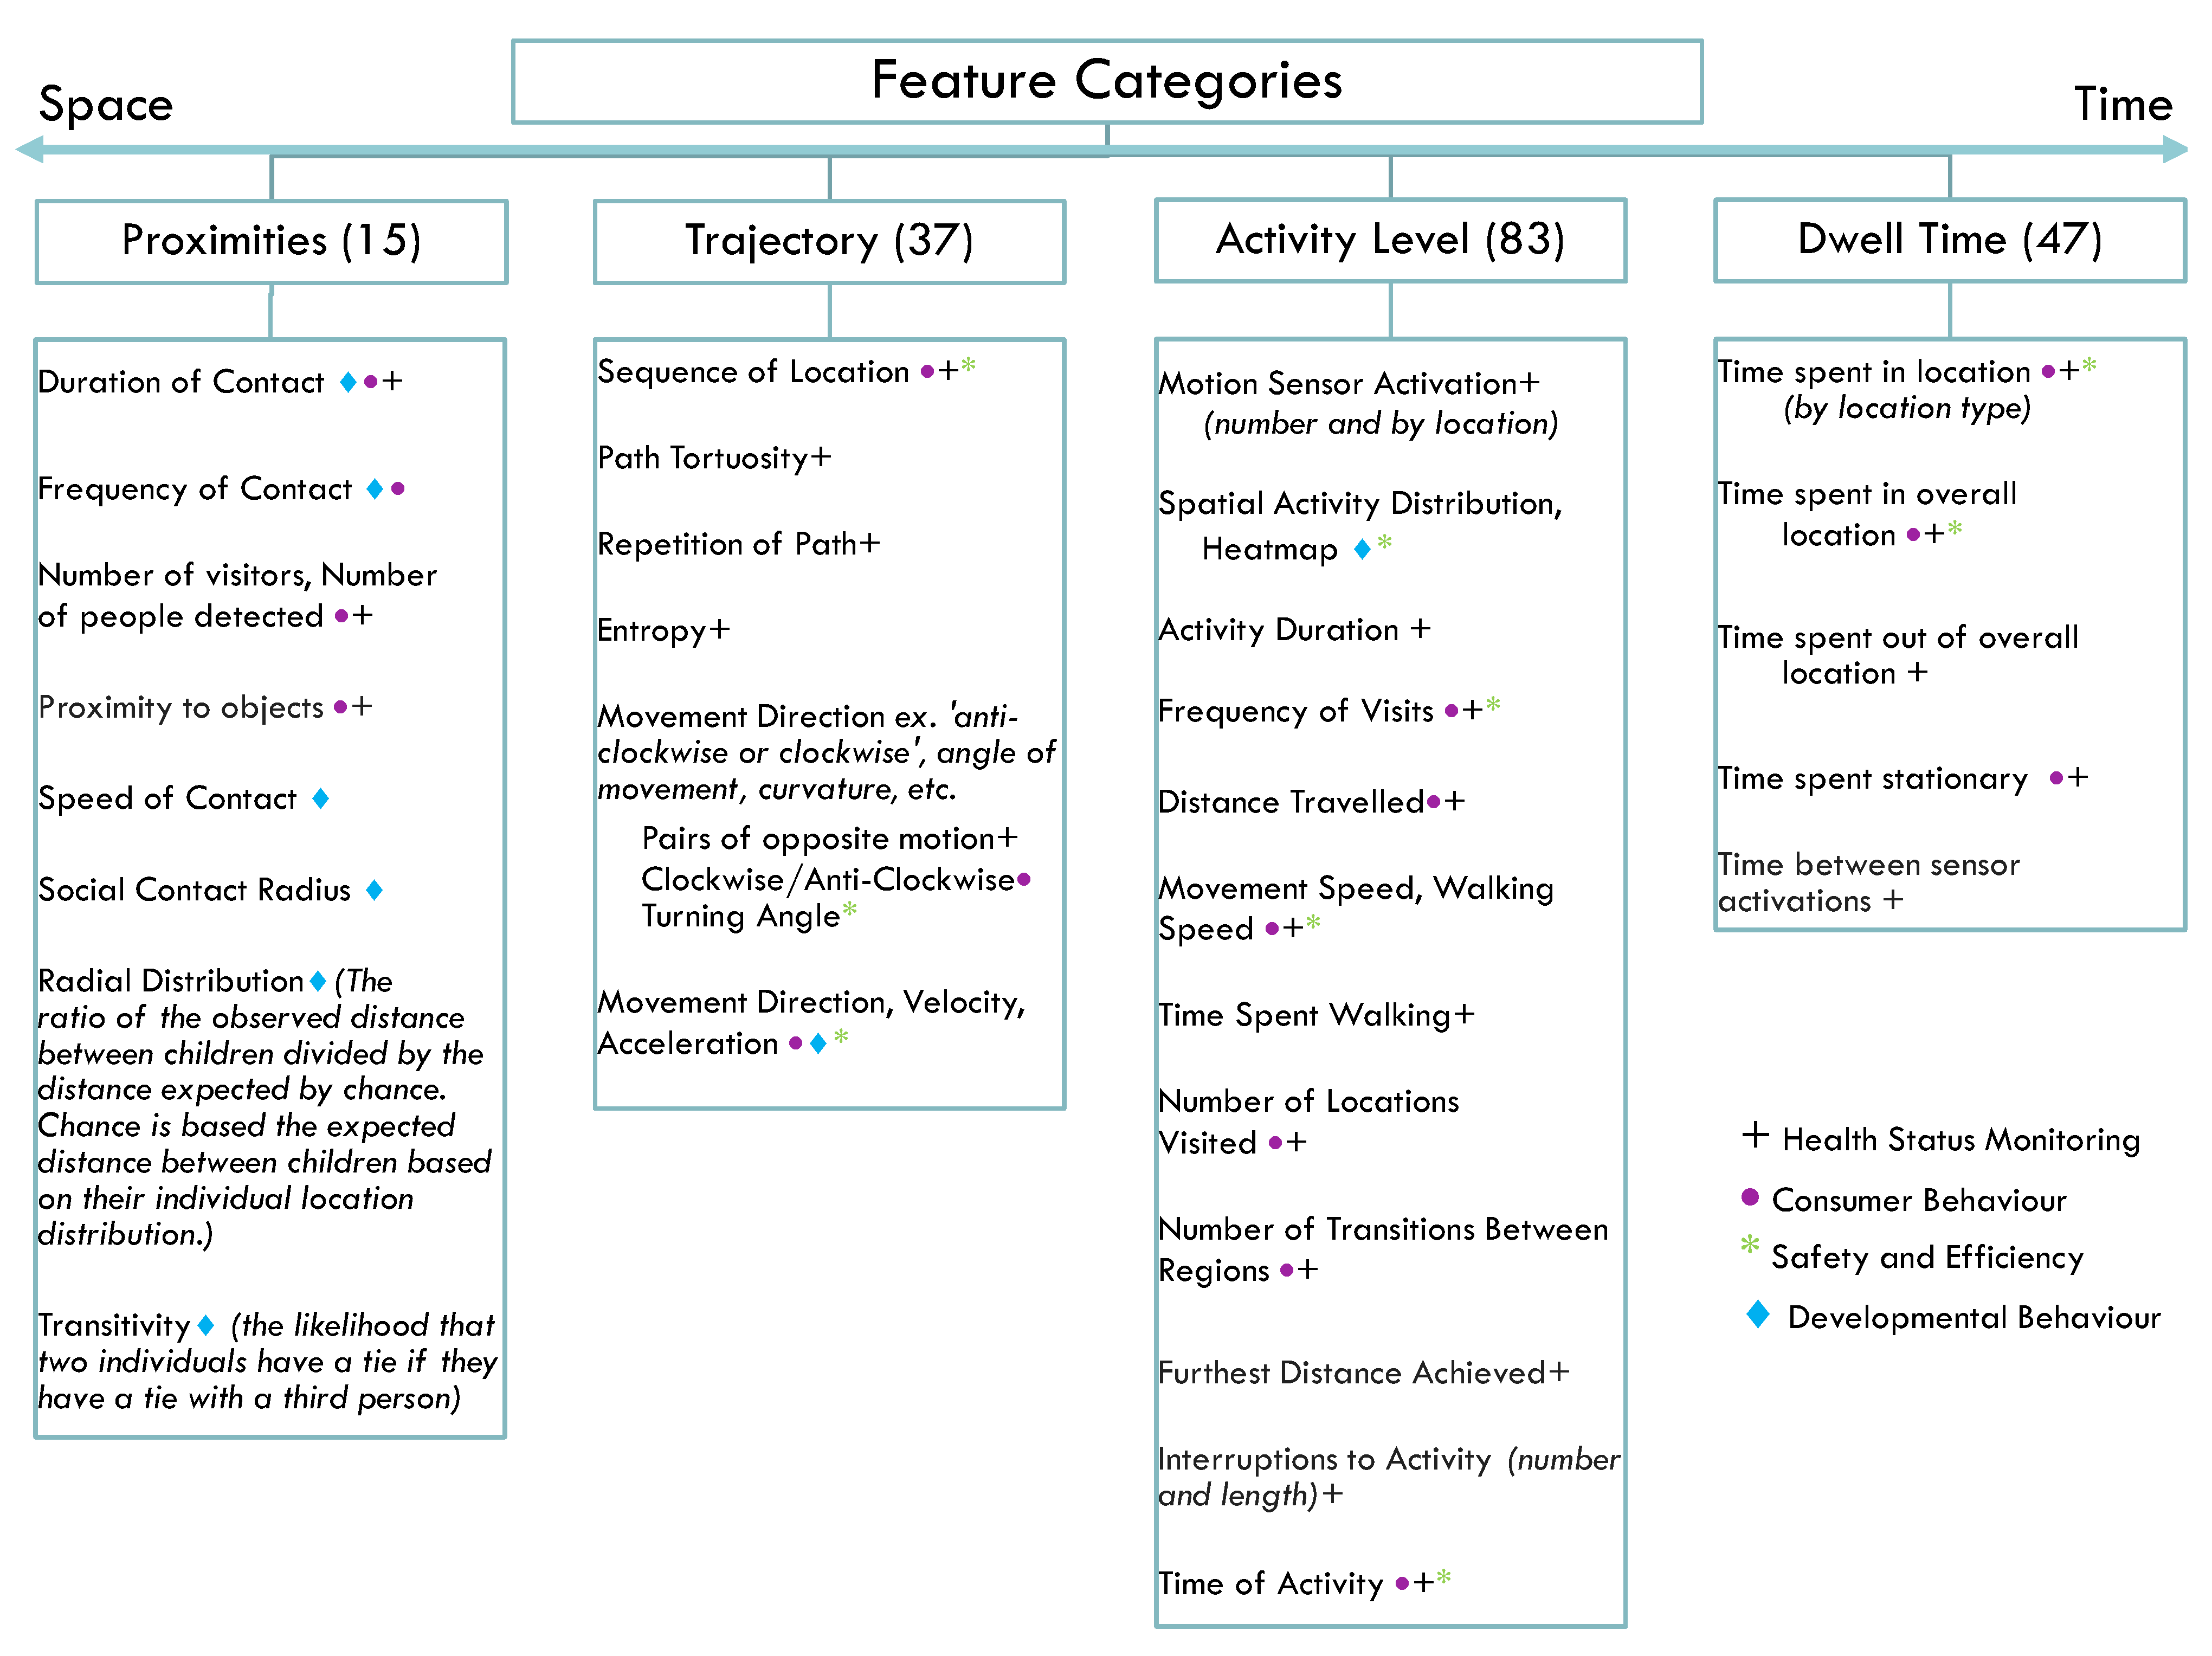
3.4. Location-Based Features and Analyses
- Proximities—features using spatial placement of multiple study subjects and how long they were in a measured proximity to each other (two or more locations at a time);
- Trajectory—features indicating direction of movement or generate vectors in 2D space based on a combination of recorded locations (two dimensions of space in time);
- Activity Level—features measuring amount and/or intensity of movement during a period of time (e.g., time spent walking, count of total spaces in which time was spent, number of motion events) (multiple measures of time);
- Dwell Time—features measuring a period of time in specified locations or comparison of duration in pre-defined activities (one measure of time).
3.5. Types of Sensors and Technological Systems
4. Discussion
Limitations and Future Work
5. Conclusions
Supplementary Materials
Author Contributions
Funding
Data Availability Statement
Acknowledgments
Conflicts of Interest
References
- Kamel Boulos, M.N.; Berry, G. Real-time locating systems (RTLS) in healthcare: A condensed primer. Int. J. Health Geogr. 2012, 11, 1–8. [Google Scholar] [CrossRef] [PubMed] [Green Version]
- Islam, S.K.; Fathy, A.; Wang, Y.; Kuhn, M.; Mahfouz, M. Hassle-Free Vitals: BioWireleSS for a patient-centric health-care paradigm. IEEE Microw. Mag. 2014, 15, 525–533. [Google Scholar] [CrossRef]
- Ray, P.P.; Dash, D.; Kumar, N. Sensors for internet of medical things: State-of-the-art, security and privacy issues, challenges and future directions. Comput. Commun. 2020, 160, 111–131. [Google Scholar] [CrossRef]
- Jeong, I.; Bychkov, D.; Hiser, S.; Kreif, J.; Klein, L.; Hoyer, E.; Searson, P. Using a Real-Time Location System for Assessment of Patient Ambulation in a Hospital Setting. Arch. Phys. Med. Rehabil. 2017, 98, 1366–1373. [Google Scholar] [CrossRef] [PubMed]
- Jansen, C.P.; Diegelmann, M.; Schnabel, E.L.; Wahl, H.W.; Hauer, K. Life-space and movement behavior in nursing home residents: Results of a new sensor-based assessment and associated factors. BMC Geriatr. 2017, 17, 36. [Google Scholar] [CrossRef] [Green Version]
- Akl, A.; Taati, B.; Mihailidis, A. Autonomous unobtrusive detection of mild cognitive impairment in older adults. IEEE Trans. Biomed. Eng. 2015, 62, 1383–1394. [Google Scholar] [CrossRef] [Green Version]
- Galambos, C.; Skubic, M.; Wang, S.; Rantz, M. Management of dementia and depression utilizing in-home passive sensor data. Gerontechnology 2013, 11, 457–468. [Google Scholar] [CrossRef] [Green Version]
- Bowen, M.E.; Crenshaw, J.; Stanhope, S.J. Balance ability and cognitive impairment influence sustained walking in an assisted living facility. Arch. Gerontol. Geriatr. 2018, 77, 133–141. [Google Scholar] [CrossRef]
- Bowen, M.E.; Rowe, M. Intraindividual Changes in Ambulation Associated With Falls in a Population of Vulnerable Older Adults in Long-Term Care. Arch. Phys. Med. Rehabil. 2016, 97, 1963–1968. [Google Scholar] [CrossRef]
- Grigorovich, A.; Kulandaivelu, Y.; Newman, K.; Bianchi, A.; Khan, S.S.; Iaboni, A.; McMurray, J. Factors affecting the implementation, use, and adoption of real-time location system technology for persons living with cognitive disabilities in long-term care homes: Systematic review. J. Med. Int. Res. 2021, 23, e22831. [Google Scholar] [CrossRef]
- Bazo, R.; da Costa, C.A.; Seewald, L.A.; da Silveira, L.G.; Antunes, R.S.; Righi, R.d.R.; Rodrigues, V.F. A Survey About Real-Time Location Systems in Healthcare Environments. J. Med. Syst. 2021, 45, 1–13. [Google Scholar] [CrossRef] [PubMed]
- Pancham, J.; Millham, R.; Fong, S.J. Evaluation of Real Time Location System technologies in the health care sector. In Proceedings of the 2017 17th International Conference on Computational Science and Its Applications, ICCSA 2017, Trieste, Italy, 3–6 July 2017. [Google Scholar] [CrossRef]
- Irvin, D.; Crutchfield, S.; Greenwood, C.; Kearns, W.; Buzhardt, J. An automated approach to measuring child movement and location in the early childhood classroom. Behav. Res. Methods 2018, 50, 890–901. [Google Scholar] [CrossRef] [PubMed] [Green Version]
- Bdiwi, R.; Runz, C.d.; Faiz, S.; Cherif, A.A. Smart learning environment: Teacher’s role in assessing classroom attention. Res. Learn. Technol. 2019, 27, 2072. [Google Scholar] [CrossRef] [Green Version]
- Ferracuti, N.; Norscini, C.; Frontoni, E.; Gabellini, P.; Paolanti, M.; Placidi, V. A business application of RTLS technology in Intelligent Retail Environment: Defining the shopper’s preferred path and its segmentation. J. Retail. Consum. Serv. 2019, 47, 184–194. [Google Scholar] [CrossRef]
- M’hand, M.A.; Boulmakoul, A.; Badir, H.; Lbath, A. A scalable real-time tracking and monitoring architecture for logistics and transport in RoRo terminals. Procedia Comput. Sci. 2019, 151, 218–225. [Google Scholar] [CrossRef]
- Soltanmohammadlou, N.; Sadeghi, S.; Hon, C.K.; Mokhtarpour-Khanghah, F. Real-time locating systems and safety in construction sites: A literature review. Saf. Sci. 2019, 117, 229–242. [Google Scholar] [CrossRef]
- Zhao, J.; Seppänen, O.; Peltokorpi, A.; Badihi, B.; Olivieri, H. Real-time resource tracking for analyzing value-adding time in construction. Autom. Constr. 2019, 104, 52–65. [Google Scholar] [CrossRef]
- Tricco, A.C.; Lillie, E.; Zarin, W.; O’Brien, K.K.; Colquhoun, H.; Levac, D.; Moher, D.; Peters, M.D.; Horsley, T.; Weeks, L.; et al. PRISMA extension for scoping reviews (PRISMA-ScR): Checklist and explanation. Ann. Intern. Med. 2018, 169, 467–473. [Google Scholar] [CrossRef] [Green Version]
- Covidence—Better Systematic Review Management. Available online: https://www.covidence.org/ (accessed on 8 May 2021).
- Bishop, C.M. Pattern Recognition and Machine Learning; Springer: New York, NY, USA, 2006; p. 738. [Google Scholar]
- Judah, G.; De Huberts, J.W.; Drassal, A.; Aunger, R. The development and validation of a real time location system to reliably monitor everyday activities in natural contexts. PLoS ONE 2017, 12, e0171610. [Google Scholar] [CrossRef] [Green Version]
- Kaye, J.; Mattek, N.; Dodge, H.; Buracchio, T.; Austin, D.; Hagler, S.; Pavel, M.; Hayes, T. One walk a year to 1000 within a year: Continuous in-home unobtrusive gait assessment of older adults. Gait Posture 2012, 35, 197–202. [Google Scholar] [CrossRef] [PubMed] [Green Version]
- Hayes, T.L.; Abendroth, F.; Adami, A.; Pavel, M.; Zitzelberger, T.A.; Kaye, J.A. Unobtrusive assessment of activity patterns associated with mild cognitive impairment. Alzheimer’s Dement. 2008, 4, 395–405. [Google Scholar] [CrossRef]
- Lymberopoulos, D.; Bamis, A.; Savvides, A. Extracting spatiotemporal human activity patterns in assisted living using a home sensor network. Univers. Access Inf. Soc. 2011, 10, 125–138. [Google Scholar] [CrossRef] [Green Version]
- Petersen, J.; Austin, D.; Kaye, J.A.; Pavel, M.; Hayes, T.L. Unobtrusive In-Home Detection of Time Spent Out-of-Home with Applications to Loneliness and Physical Activity. IEEE J. Biomed. Health Inf. 2014, 18, 1590–1596. [Google Scholar] [CrossRef]
- Fiorini, L.; Cavallo, F.; Dario, P.; Eavis, A.; Caleb-Solly, P. Unsupervised machine learning for developing personalised behaviour models using activity data. Sensors 2017, 17, 1034. [Google Scholar] [CrossRef] [Green Version]
- Enshaeifar, S.; Zoha, A.; Markides, A.; Skillman, S.; Acton, S.T.; Elsaleh, T.; Hassanpour, M.; Ahrabian, A.; Kenny, M.; Klein, S.; et al. Health management and pattern analysis of daily living activities of people with dementia using in-home sensors and machine learning techniques. PLoS ONE 2018, 13, e0195605. [Google Scholar] [CrossRef] [Green Version]
- Akl, A.; Mihailidis, A. Estimating in-home walking speed distributions for unobtrusive detection of mild cognitive impairment in older adults. In Proceedings of the Annual International Conference of the IEEE Engineering in Medicine and Biology Society, EMBS, Milan, Italy, 25–29 August 2015; pp. 5175–5178. [Google Scholar] [CrossRef] [Green Version]
- Akl, A.; Chikhaoui, B.; Mattek, N.; Kaye, J.; Austin, D.; Mihailidis, A. Clustering home activity distributions for automatic detection of mild cognitive impairment in older adults 1. J. Ambient Intell. Smart Environ. 2016, 8, 437–451. [Google Scholar] [CrossRef] [Green Version]
- Akl, A.; Snoek, J.; Mihailidis, A. Unobtrusive Detection of Mild Cognitive Impairment in Older Adults Through Home Monitoring. IEEE J. Biomed. Health Inf. 2017, 21, 339–348. [Google Scholar] [CrossRef] [Green Version]
- Dodge, H.H.; Mattek, N.C.; Austin, D.; Hayes, T.L.; Kaye, J.A. In-home walking speeds and variability trajectories associated with mild cognitive impairment. Neurology 2012, 78, 1946–1952. [Google Scholar] [CrossRef] [Green Version]
- Yahaya, S.W.; Lotfi, A.; Mahmud, M. A Consensus Novelty Detection Ensemble Approach for Anomaly Detection in Activities of Daily Living. Appl. Soft Comput. J. 2019, 83, 105613. [Google Scholar] [CrossRef]
- Tan, T.H.; Gochoo, M.; Huang, S.C.; Liu, Y.H.; Liu, S.H.; Huang, Y.F. Multi-resident activity recognition in a smart home using RGB activity image and DCNN. IEEE Sens. J. 2018, 18, 9718–9727. [Google Scholar] [CrossRef]
- Gochoo, M.; Tan, T.H.; Liu, S.H.; Jean, F.R.; Alnajjar, F.S.; Huang, S.C. Unobtrusive Activity Recognition of Elderly People Living Alone Using Anonymous Binary Sensors and DCNN. IEEE J. Biomed. Health Inf. 2019, 23, 693–702. [Google Scholar] [CrossRef]
- Xu, Z.; Wang, G.; Guo, X. Comparative Studies on Activity Recognition of Elderly People Living Alone. In Proceedings of 2019 Chinese Intelligent Systems Conference; Springer: Singapore, 2020; Volume 592, pp. 276–291. [Google Scholar] [CrossRef]
- Eisa, S.; Moreira, A. A behaviour monitoring system (BMS) for ambient assisted living. Sensors 2017, 17, 1946. [Google Scholar] [CrossRef] [Green Version]
- Gochoo, M.; Liu, S.H.; Bayanduuren, D.; Tan, T.H.; Velusamy, V.; Liu, T.Y. Deep convolutional neural network classifier for travel patterns using binary sensors. In Proceedings of the 2017 IEEE 8th International Conference on Awareness Science and Technology, iCAST 2017, Taichung, Taiwan, 8–10 November 2017; Volume 2018, pp. 132–137. [Google Scholar] [CrossRef]
- Gochoo, M.; Tan, T.H.; Huang, S.C.; Liu, S.H.; Alnajjar, F.S. DCNN-based elderly activity recognition using binary sensors. In Proceedings of the 2017 International Conference on Electrical and Computing Technologies and Applications, ICECTA 2017, Ras Al Khaimah, United Arab Emirates, 21–23 November 2017; Volume 2018, pp. 1–5. [Google Scholar] [CrossRef]
- Zhang, T.; Fu, W.; Ye, J.; Fischer, M. Learning movement patterns of the occupant in smart home environments: An unsupervised learning approach. J. Ambient Intell. Humaniz. Comput. 2017, 8, 133–146. [Google Scholar] [CrossRef]
- Fang, X.; Lu, F.; Chen, X.; Huang, X. Accurate Indoor Positioning Prediction Using the LSTM and Grey Model. In Proceedings of the WISE 2020: 21st International Conference, Amsterdam, The Netherlands, 20–24 October 2020. [Google Scholar] [CrossRef]
- Fahad, L.G.; Ali, A.; Rajarajan, M. Long term analysis of daily activities in a smart home. In Proceedings of the ESANN 2013 Proceedings, European Symposium on Artificial Neural Networks, Computational Intelligence and Machine Learning, Bruges, Belgium, 24–26 April 2013; pp. 419–424. [Google Scholar]
- Su, C.F.; Fu, L.C.; Chien, Y.W.; Li, T.Y. Activity Recognition System for Dementia in Smart Homes based on Wearable Sensor Data. In Proceedings of the 2018 IEEE Symposium Series on Computational Intelligence (SSCI), Bangalore, India, 18–21 November 2018; pp. 463–469. [Google Scholar] [CrossRef]
- Li, T.Y.; Wu, C.L.; Chien, Y.W.; Fu, L.C.; Chou, C.C.; Chen, I.A. A supporting system for quick dementia screening using PIR motion sensor in smart home. In Proceedings of the 2017 IEEE International Conference on Systems, Man, and Cybernetics, SMC 2017, Banff, AB, Canada, 5–8 October 2017; Volume 2017, pp. 1369–1374. [Google Scholar] [CrossRef]
- Alberdi Aramendi, A.; Weakley, A.; Aztiria Goenaga, A.; Schmitter-Edgecombe, M.; Cook, D.J. Automatic assessment of functional health decline in older adults based on smart home data. J. Biomed. Inf. 2018, 81, 119–130. [Google Scholar] [CrossRef]
- Rantz, M.J.; Skubic, M.; Koopman, R.J.; Phillips, L.; Alexander, G.L.; Miller, S.J.; Guevara, R.D. Using sensor networks to detect urinary tract infections in older adults. In Proceedings of the 2011 IEEE 13th International Conference on e-Health Networking, Applications and Services, Columbia, MO, USA, 13–15 June 2011; pp. 142–149. [Google Scholar] [CrossRef]
- Skubic, M.; Guevara, R.D.; Rantz, M. Automated health alerts using in-home sensor data for embedded health assessment. IEEE J. Transl. Eng. Health Med. 2015, 3, 1–11. [Google Scholar] [CrossRef]
- Alberdi, A.; Weakley, A.; Schmitter-Edgecombe, M.; Cook, D.J.; Aztiria, A.; Basarab, A.; Barrenechea, M. Smart Home-Based Prediction of Multidomain Symptoms Related to Alzheimer’s Disease. IEEE J. Biomed. Health Inf. 2018, 22, 1720–1731. [Google Scholar] [CrossRef] [Green Version]
- Dawadi, P.N.; Cook, D.J.; Schmitter-Edgecombe, M. Modeling patterns of activities using activity curves. Pervasive Mob. Comput. 2016, 28, 51–68. [Google Scholar] [CrossRef] [Green Version]
- Gochoo, M.; Tan, T.H.; Jean, F.R.; Huang, S.C.; Kuo, S.Y. Device-free non-invasive front-door event classification algorithm for forget event detection using binary sensors in the smart house. In Proceedings of the 2017 IEEE International Conference on Systems, Man, and Cybernetics, SMC 2017, Banff, AB, Canada, 5–8 October 2017; Volume 2017, pp. 405–409. [Google Scholar] [CrossRef]
- Tan, T.H.; Gochoo, M.; Jean, F.R.; Huang, S.C.; Kuo, S.Y. Front-Door Event Classification Algorithm for Elderly People Living Alone in Smart House Using Wireless Binary Sensors. IEEE Access 2017, 5, 10734–10743. [Google Scholar] [CrossRef]
- Cheng, C.; Yang, H. Multi-scale graph modeling and analysis of locomotion dynamics towards sensor-based dementia assessment. IISE Trans. Healthc. Syst. Eng. 2019, 9, 95–102. [Google Scholar] [CrossRef]
- Bellini, G.; Cipriano, M.; De Angeli, N.; Gargano, J.P.; Gianella, M.; Goi, G.; Rossi, G.; Masciadri, A.; Comai, S. Alzheimer’s garden: Understanding social behaviors of patients with dementia to improve their quality of life. In Computers Helping People with Special Needs: 17th International Conference, ICCHP 2020; Miesenberger, K., Ed.; Springer: Cham, Switzerland, 2020; pp. 384–393. [Google Scholar] [CrossRef]
- Kearns, W.D.; Nams, V.O.; Fozard, J.L. Tortuosity in movement paths is related to cognitive impairment wireless fractal Estimation in assisted living facility residents. Methods Inf. Med. 2010, 49, 592–598. [Google Scholar] [CrossRef]
- Kearns, W.D.; Fozard, J.L.; Becker, M.; Jasiewicz, J.M.; Craighead, J.D.; Holtsclaw, L.; Dion, C. Path Tortuosity in Everyday Movements of Elderly Persons Increases Fall Prediction Beyond Knowledge of Fall History, Medication Use, and Standardized Gait and Balance Assessments. J. Am. Med. Dir. Assoc. 2012, 13, 665-e7. [Google Scholar] [CrossRef]
- Bowen, M.E.; Rowe, M. Wandering Behaviors and Activities of Daily Living Among Older Adults With Cognitive Impairment. Rehabil. Nurs. Off. J. Assoc. Rehabil. Nurses 2019, 44, 282–289. [Google Scholar] [CrossRef]
- Grünerbl, A.; Bahle, G.; Lukowicz, P.; Hanser, F. Using indoor location to assess the state of dementia patients: Results and experience report from a long term, real world study. In Proceedings of the 2011 Seventh International Conference on Intelligent Environments, Nottingham, UK, 25–28 July 2011; pp. 32–39. [Google Scholar] [CrossRef]
- Yang, A.C.H.; Lau, N.; Ho, J.C.F. The role of bedroom privacy in social interaction among elderly residents in nursing homes: An exploratory case study of Hong Kong. Sensors 2020, 20, 4101. [Google Scholar] [CrossRef]
- Okada, S.; Inoue, K.; Imai, T.; Noguchi, M.; Kuwamura, K. Dementia Scale Classification Based on Ubiquitous Daily Activity and Interaction Sensing. In Proceedings of the 2019 8th International Conference on Affective Computing and Intelligent Interaction, ACII 2019, Cambridge, UK, 3–6 September 2019; pp. 192–198. [Google Scholar] [CrossRef]
- Ramezani, R.; Zhang, W.; Xie, Z.; Shen, J.; Elashoff, D.; Roberts, P.; Stanton, A.; Eslami, M.; Wenger, N.; Sarrafzadeh, M.; et al. A combination of indoor localization and wearable sensor-based physical activity recognition to assess older patients undergoing subacute rehabilitation: Baseline study results. JMIR MHealth UHealth 2019, 7, e14090. [Google Scholar] [CrossRef]
- Vuong, N.K.; Chan, S.; Lau, C.T. Automated detection of wandering patterns in people with dementia. Gerontechnology 2014, 12, 127–147. [Google Scholar] [CrossRef]
- Kearns, W.D.; Scott, S.; Fozard, J.L.; Dillahunt-Aspillaga, C.; Jasiewicz, J.M. Decreased movement path tortuosity is associated with improved functional status in patients with traumatic brain injury. J. Head Trauma Rehabil. 2016, 31, E13–E19. [Google Scholar] [CrossRef]
- Jeong, I.C.; Healy, R.; Bao, B.; Xie, W.; Madeira, T.; Sussman, M.; Whitman, G.; Schrack, J.; Zahradka, N.; Hoyer, E.; et al. Assessment of Patient Ambulation Profiles to Predict Hospital Readmission, Discharge Location, and Length of Stay in a Cardiac Surgery Progressive Care Unit. JAMA Netw. Open 2020, 3, e201074. [Google Scholar] [CrossRef] [Green Version]
- Dogan, O.; Bayo-Monton, J.L.; Fernandez-Llatas, C.; Oztaysi, B. Analyzing of Gender Behaviors from Paths Using Process Mining: A Shopping Mall Application. Sensors 2019, 19, 557. [Google Scholar] [CrossRef] [Green Version]
- Liu, Y.; Cheng, D.; Pei, T.; Shu, H.; Ge, X.; Ma, T.; Du, Y.; Ou, Y.; Wang, M.; Xu, L. Inferring gender and age of customers in shopping malls via indoor positioning data. Environ. Plan. B Urban Anal. City Sci. 2020, 47, 1672–1689. [Google Scholar] [CrossRef]
- Dogan, O. Discovering Customer Paths from Location Data with Process Mining. Eur. J. Eng. Sci. Technol. 2020, 3, 139–145. [Google Scholar] [CrossRef]
- Kholod, M.; Takai, K.; Yada, K. Clockwise and anti-clockwise directions of customer orientation in a supermarket: Evidence from RFID data. In Proceedings of the International Conference on Knowledge-Based and Intelligent Information and Engineering Systems, Kaiserslautern, Germany, 12–14 September 2011; Volume 6883, pp. 304–309. [Google Scholar] [CrossRef]
- Popa, M.C.; Rothkrantz, L.J.M.; Shan, C.; Gritti, T.; Wiggers, P. Semantic assessment of shopping behavior using trajectories, shopping related actions, and context information. Pattern Recognit. Lett. 2013, 34, 809–819. [Google Scholar] [CrossRef]
- Paolanti, M.; Liciotti, D.; Pietrini, R.; Mancini, A.; Frontoni, E. Modelling and Forecasting Customer Navigation in Intelligent Retail Environments. J. Intell. Robot. Syst. Theory Appl. 2018, 91, 165–180. [Google Scholar] [CrossRef]
- Yang, L.; Cheng, B.; Deng, N.; Zhou, Z.; Huang, W. The influence of supermarket spatial layout on shopping behavior and product sales. In Proceedings of the 24th CAADRIA Conference, Victoria University of Wellington, Wellington, New Zealand, 15–18 April 2019; Volume 1, pp. 301–310. [Google Scholar]
- Takai, K.; Yada, K. Relation between stay-time and purchase probability based on RFID data in a Japanese supermarket. In Proceedings of the KES 2010: Knowledge-Based and Intelligent Information and Engineering Systems, Cardiff, UK, 8–10 September 2010; pp. 254–263. [Google Scholar] [CrossRef]
- Takai, K.; Yada, K. Finding latent groups of customers via the poisson mixture regression model. In Proceedings of the 2011 IEEE International Conference on Systems, Man, and Cybernetics, Anchorage, AL, USA, 9–12 October 2011; pp. 3603–3608. [Google Scholar] [CrossRef]
- Takai, K. Exploration of dependencies among sections in a supermarket using a tree-structured undirected graphical model. In Proceedings of the 2012 IEEE 12th International Conference on Data Mining Workshops, Brussels, Belgium, 10–13 December 2012; pp. 324–331. [Google Scholar] [CrossRef]
- Takai, K.; Yada, K. A framework for analysis of the effect of time on shopping behavior. J. Intell. Inf. Syst. 2013, 41, 91–107. [Google Scholar] [CrossRef]
- Kaneko, Y.; Yada, K. Bayesian Hidden Markov Model for Evaluating the Influence of In-Store Stationary Time of Customers on Their Purchase Behavior. In Proceedings of the 2018 5th Asia-Pacific World Congress on Computer Science and Engineering (APWC on CSE), Nadi, Fiji, 10–12 December 2018; pp. 142–148. [Google Scholar] [CrossRef]
- Nakahara, T.; Yada, K. Analyzing consumers’ shopping behavior using RFID data and pattern mining. Adv. Data Anal. Classif. 2012, 6, 355–365. [Google Scholar] [CrossRef]
- Zuo, Y.; Yada, K.; Kita, E. A Bayesian network approach for predicting purchase behavior via direct observation of in-store behavior. In AMBN 2015: Advanced Methodologies for Bayesian Networks; Springer: Cham, Switzerland, 2015; Volume 9505, pp. 61–75. [Google Scholar] [CrossRef]
- Li, Z.; Ishibashi, K.; Takai, K.; Yada, K. Shop area visit ratio, stay time, and sales outcomes: In-depth analysis based on RFID data. In Proceedings of the 2015 2nd Asia-Pacific World Congress on Computer Science and Engineering, Nadi, Fiji, 4–6 December 2016; pp. 1–7. [Google Scholar] [CrossRef]
- Gu, H.; Yada, K. The impact of self-control on search behavior. Procedia Comput. Sci. 2019, 159, 2137–2143. [Google Scholar] [CrossRef]
- Yoshimura, Y.; Sobolevsky, S.; Ratti, C.; Girardin, F.; Carrascal, J.P.; Blat, J.; Sinatra, R. An Analysis of Visitors’ Behavior in the Louvre Museum: A Study Using Bluetooth Data. Environ. Plan. B Plan. Des. 2014, 41, 1113–1131. [Google Scholar] [CrossRef] [Green Version]
- Yoshimura, Y.; Sinatra, R.; Krebs, A.; Ratti, C. Analysis of visitors’ mobility patterns through random walk in the Louvre Museum. J. Ambient Intell. Human. Comput. 2019, 2019, 1–16. [Google Scholar] [CrossRef] [Green Version]
- Kanda, T.; Shiomi, M.; Perrin, L.; Nomura, T.; Ishiguro, H.; Hagita, N. Analysis of people trajectories with ubiquitous sensors in a science museum. In Proceedings of the IEEE International Conference on Robotics and Automation, Rome, Italy, 10–14 April 2007; pp. 4846–4853. [Google Scholar] [CrossRef] [Green Version]
- Lanir, J.; Kuflik, T.; Dim, E.; Wecker, A.J.; Stock, O. The influence of a location-aware mobile guide on museum visitors’ behavior. Interact. Comput. 2013, 25, 443–460. [Google Scholar] [CrossRef]
- Martella, C.; Miraglia, A.; Frost, J.; Cattani, M.; van Steen, M. Visualizing, clustering, and predicting the behavior of museum visitors. Pervasive Mob. Comput. 2017, 38, 430–443. [Google Scholar] [CrossRef]
- Booth, B.M.; Feng, T.; Jangalwa, A.; Narayanan, S.S. Toward Robust Interpretable Human Movement Pattern Analysis in a Workplace Setting. In Proceedings of the IEEE International Conference on Acoustics, Speech and Signal Processing, Brighton, UK, 12–17 May 2019; pp. 7630–7634. [Google Scholar] [CrossRef]
- Feng, T.; Narayanan, S. Modeling Human Movement Behavior Among Nursing Profession. In Proceedings of the Annual International Conference of the IEEE Engineering in Medicine and Biology Society, Montreal, QC, Canada, 20–24 July 2020; pp. 4256–4260. [Google Scholar] [CrossRef]
- Feng, T.; Booth, B.M.; Narayanan, S.S. Modeling Behavior as Mutual Dependency between Physiological Signals and Indoor Location in Large-Scale Wearable Sensor Study. In Proceedings of the IEEE International Conference on Acoustics, Speech and Signal Processing, Barcelona, Spain, 4–8 May 2020; Volume 2020, pp. 1016–1020. [Google Scholar] [CrossRef]
- Lopez-De-Teruel, P.E.; Garcia, F.J.; Canovas, O.; Gonzalez, R.; Carrasco, J.A. Human behavior monitoring using a passive indoor positioning system: A case study in a SME. Procedia Comput. Sci. 2017, 110, 182–189. [Google Scholar] [CrossRef]
- Cheng, T.; Pradhananga, N.; Teizer, J. Automated evaluation of proximity hazards caused by workers interacting with equipment. In Proceedings of the 30th ISARC, Montréal, QC, Canada, 11–15 August 2013; pp. 1037–1045. [Google Scholar]
- Arslan, M.; Cruz, C.; Ginhac, D. Understanding worker mobility within the stay locations using HMMs on semantic trajectories. In Proceedings of the 14th International Conference on Emerging Technologies (ICET), Islamabad, Pakistan, 21–22 November 2018. [Google Scholar] [CrossRef]
- Arslan, M.; Cruz, C.; Ginhac, D. Semantic enrichment of spatio-temporal trajectories for worker safety on construction sites. Pers. Ubiquitous Comput. 2019, 23, 749–764. [Google Scholar] [CrossRef] [Green Version]
- Hwang, S.; Lee, Z.; Kim, J. Real-time pedestrian flow analysis using networked sensors for a smart subway system. Sustainability 2019, 11, 6560. [Google Scholar] [CrossRef] [Green Version]
- Jorge, C.C.; Atzmueller, M.; Heravi, B.M.; Gibson, J.L.; de Sá, C.R.; Rossetti, R.J.F. Mining Exceptional Social Behaviour. Progress Artif. Intell. 2019, 11805 LNCS, 460–472. [Google Scholar] [CrossRef] [Green Version]
- Messinger, D.S.; Prince, E.B.; Zheng, M.; Martin, K.; Mitsven, S.G.; Huang, S.; Stölzel, T.; Johnson, N.; Rudolph, U.; Perry, L.K.; et al. Continuous measurement of dynamic classroom social interactions. Int. J. Behav. Dev. 2019, 43, 263–270. [Google Scholar] [CrossRef]
- Cook, D.J.; Crandall, A.S.; Thomas, B.L.; Krishnan, N.C. CASAS: A smart home in a box. Computer 2013, 46, 62–69. [Google Scholar] [CrossRef] [Green Version]
- Masciadri, A.; Comai, S.; Salice, F. Wellness assessment of alzheimer’s patients in an instrumented health-care facility. Sensors 2019, 19, 3658. [Google Scholar] [CrossRef] [Green Version]
- Frascella, S. Visitor behavior and circulation in the national archaeological museum of Taranto (Italy). Int. J. Incl. Mus. 2020, 13, 21–41. [Google Scholar] [CrossRef]
- Zhou, Y.; Lau, B.P.L.; Koh, Z.; Yuen, C.; Ng, B.K.K. Understanding Crowd Behaviors in a Social Event by Passive WiFi Sensing and Data Mining. IEEE Internet Things J. 2020, 7, 4442–4454. [Google Scholar] [CrossRef] [Green Version]
- Versichele, M.; Neutens, T.; Delafontaine, M.; Van de Weghe, N. The use of Bluetooth for analysing spatiotemporal dynamics of human movement at mass events: A case study of the Ghent Festivities. Appl. Geogr. 2012, 32, 208–220. [Google Scholar] [CrossRef] [Green Version]
- Wang, Z.; Li, J.; Zhu, Y.; Li, Z.; Lu, W. Analyzing Spatiotemporal Characteristics of Taxi Drivers’ Cognition to Passenger Source Based on Trajectory Data. In Lecture Notes in Computer Science (Including Subseries Lecture Notes in Artificial Intelligence and Lecture Notes in Bioinformatics); Springer: Cham, Switzerland, 2020; Volume 12473 LNCS, pp. 90–94. [Google Scholar] [CrossRef]
- Andrienko, G.; Andrienko, N.; Demšar, U.; Dransch, D.; Dykes, J.; Fabrikant, S.; Jern, M.; Kraak, M.J.; Schumann, H.; Tominski, C. Space, Time, and Visual Analytics. Int. J. Geogr. Inf. 2010, 24, 1577–1600. [Google Scholar] [CrossRef] [Green Version]
- Dodge, S.; Weibel, R.; Lautenschütz, A.K. Towards a Taxonomy of Movement Patterns. Inf. Vis. 2008, 7, 240–252. [Google Scholar] [CrossRef] [Green Version]
- Andrienko, G.; Andrienko, N.; Bak, P.; Keim, D.; Kisilevich, S.; Wrobel, S. A conceptual framework and taxonomy of techniques for analyzing movement. J. Vis. Lang. Comput. 2011, 22, 213–232. [Google Scholar] [CrossRef]


| Search terms include three different concepts of location, indoor, and behaviour: |
| Location: real-time locating system and RTLS, geographic locations, location monitoring, geographic monitoring. indoor position, indoor positioning, sensor network, sensor data, sensor technology, motion sensor, motion density, motion mapping, motion tracking, tracking device, location management, motion density map |
| Indoor: indoor, school, childcare, long-term care, nursing home, residential facilities, community-dwelling, nursing facilities, hospital, shopping center, mall, site, retail store, school, classroom, warehouse, house, home, inside, inpatient, healthcare environment, daycare, living environment |
| Behaviours: task analysis, behavior analysis, behavior research, behavior pattern, digital phenotyping, shopper behavior, health status, smart health, agitation, wandering behaviors, ambulation, depression, life-space assessment, operations research, provider scheduling, pathways, lean management, production control, value adding time, walking path, stay time, spatiotemporal, dementia, behavior assessment, behavior monitoring, health assessment, health monitoring, health analysis, health pattern, task assessment, task pattern, task monitoring |
| Reference | Objective | Environment | Population | Sensor | Feature Categories |
|---|---|---|---|---|---|
| Health Status Monitoring | |||||
| Judah 2017 [22] | To develop and test a reliable RTLS system that can recognize various bathroom activities and behaviours of multiple individuals | Bathroom | Not Given | Combo (Elpas) | Trajectory, Proximity |
| Kaye 2012 [23] | To examine the relation between measures of walking activity and function | Private Home | Adults | IR | Activity Levels |
| Hayes 2008 [24] | To find distinguishable differences in the motor activity of healthy and cognitively impaired elders | Private Home | Older Adults | IR | Activity Levels |
| Lymberopoulos 2011 [25] | To develop a model that describes and determines a person’s routine based on their spatiotemporal activity | Private Home | Older Adults | IR | Dwell, Trajectory |
| Petersen 2014 [26] | To describe and validate a method for detecting time spent out-of-home using a logistic regression-based classifier with inputs derived from passive sensor data. | Private Home | Older Adults | IR | Activity Levels |
| Fiorini 2017 [27] | To describe and define groups of behavioural patterns starting from unannotated data analysis and a “blind” approach for activity recognition | Private Home | Older Adults | IR | Activity Levels |
| Enshaeifar 2018 [28] | To develop an algorithm that identifies daily routines, detects unusual patterns and possible agitation events | Private Home | Older Adults | Pressure | Activity, Trajectory |
| Akl 2015 a [6] | To explore the feasibility of autonomously detecting mild cognitive impairment (MCI) using various features of location-tracked data | Private Home | Older Adults | IR | Activity Levels |
| Akl 2015 b [29] | To detect mild cognitive impairment using differences in walking speed distributions | Private Home | Older Adults | Not Given | Activity levels |
| Akl 2016 [30] | To automatically detect MCI in older adults using the distribution of activity in different rooms of the home | Private Home | Older Adults | IR | Activity levels |
| Akl 2017 [31] | To develop models of home activity that can support early detection of dementia | Private Home | Older Adults | IR | Dwell, Trajectory |
| Dodge 2012 [32] | To test if the assessment of walking speed and its variability can distinguish those with mild cognitive impairment (MCI) from those with intact cognition | Private Home | Older Adults | IR | Activity, Dwell |
| Yahaya 2019 [33] | To develop a method of finding thresholds for abnormalities in Activities of Daily Living (ADL) correlated to changes in sleeping behaviour | Private Home | Adults | IR; CASAS | Activity Levels |
| Tan 2018 [34] | To develop a novel DCNN classifier to recognize different activities in a smart home | Private Home | Adults | CASAS | DCNN Classifier |
| Gochoo 2019 [35] | To develop an unobtrusive activity recognition classifier using deep convolutional neural network (DCNN) | Private Home | Adults | CASAS | DCNN Classifier |
| Xu 2020 [36] | To compare different classification algorithms in their ability to recognize the at-home activity of elderly people | Private home | Older Adults | CASAS | Activity Levels |
| Eisa 2017 [37] | To detect unusual changes in regular mobility behaviour by monitoring daily room-to-room transitions and permanence habits | Private Home | Older Adults | CASAS | Activity, Dwell, Trajectory |
| Gochoo 2017 b [38] | To classify walking/travel patterns of elderly people living alone using a Deep Convolutional Neural Network classifier (DCNN) | Private Home | Older Adults | CASAS | Activity, Dwell, Trajectory |
| Gochoo 2017 c [39] | To develop a Deep Convolutional Neural Network (DCNN) classifier for elderly activity recognition | Private Home | Older Adults | CASAS | Activity Levels |
| Zhang 2017 [40] | To propose an unsupervised learning approach that can determine movement patterns and daily activities without event annotations | Private Home | Older Adults | CASAS | Trajectory |
| Fang 2020 [41] | To locate and predict the position of the elderly, helping to detect the abnormal behaviours or irregular life routines | Private Home | Adults | State-change Sensors | Trajectory |
| Fahad 2013 [42] | To monitor the change in the repeated group of activities that make up the daily routine of a person living in a smart home | Private Home | Adults | State-change Sensors | Activity, Trajectory |
| Su 2018 [43] | To build an activity recognition system for elder persons with dementia via the classification of hand movements and indoor position data | Smart Home | Not Given | Bluetooth | Random Forest Model |
| Li 2017 [44] | To test a system for screening elders who are likely to have dementia from performing eight activities from IADL | Smart Home | Older Adults | CASAS | Activity, Trajectory |
| Aramendi 2018 [45] | To evaluate the correlation of different behavioural features derived from daily activities to IADL-C scores and their effectiveness in detecting change in functional health decline | Smart Home | Older Adults | CASAS | Activity Levels |
| Rantz 2011 [46] | To investigate the use of passive monitoring of residents to detect early signs of illness, functional decline, and/or urinary tract infection | Retirement Community | Older Adults | IR | Activity Levels |
| Skubic 2015 [47] | To exploring behavioural features that are more or less useful in detecting early changes in health status across different chronic health conditions and home layouts | Retirement Community | Older Adults | IR | Activity, Dwell, Proximity |
| Galambos 2013 [7] | To investigate whether visual features from motion density maps are sensitive enough to detect changes in mental health over time | Retirement Community | Older Adults | IR | Activity, Dwell |
| Alberdi 2018 [48] | To evaluate use activity behaviour data to detect the multimodal symptoms that are often found to be impaired in Alzheimer’s Disease (AD) and predict related clinical scores | Retirement Community | Older Adults | CASAS | Activity Levels |
| Dawadi 2016 [49] | To evaluate the effectiveness of an algorithm that can model daily activity routines and detect changes in behavioural routines | Retirement Community | Older Adults | CASAS | Activity, Trajectory |
| Gochoo 2017 a [50] | To develop an algorithm that determines what activity is occurring at the front door and detect memory lapses (forget events from brief-return-and-exit at door) | Retirement Community | Older Adults | CASAS | Activity, Dwell, Trajectory |
| Tan 2017 [51] | To classify front-door events (exit, enter, visitor, other, and brief-return-and-exit) of a resident in the smart house | Retirement Community | Older Adults | CASAS | Activity, Dwell, Trajectory |
| Cheng 2019 [52] | To estimate dementia conditions based on graph representations of daily locomotion | Assisted Living | Older Adults | UWB | Trajectory |
| Bellini 2020 [53] | To assesses both the degree of relations among residents and the popularity of the facility spaces as an indicator of accessibility | Assisted Living | Older Adults | Bluetooth | Proximity |
| Kearns 2010 [54] | To explore whether elders with greater path tortuosity (irregular movement) was associated with greater cognitive impairment | Assisted Living | Older Adults | UWB | Trajectory |
| Kearns 2012 [55] | To investigate whether variability in voluntary movement paths would be greater in the week preceding a fall compared with non-fallers | Assisted Living | Older Adults | UWB | Activity, Trajectory |
| Bowen 2016 [9] | To examine how intraindividual changes in ambulation characteristics may be used to predict falls. | Assisted Living | Older Adults | UWB | Activity Levels |
| Bowen 2018 [8] | To determine the influence of cognitive impairment (CI), gait quality, and balance ability on walking distance and speed | Nursing Home | Older Adults | UWB | Activity Levels |
| Bowen 2019 [56] | To examine the characteristics of wandering associated with preserved versus worsened ADL function. | Nursing Home | Older Adults | UWB | Activity Levels |
| Grunerbl 2011 [57] | To develop and evaluate a system for coarse assessment of the health status of dementia patients in a nursing home | Nursing Home | Older Adults | UWB | Activity, Dwell |
| Jansen 2017 [5] | To provide descriptive analysis of life-space movement patterns in nursing home residents and to identify associated factors of different patterns | Nursing Home | Older Adults | Not Given | Activity, Dwell |
| Yang 2020 [58] | To classify probable social interaction patterns and identify mobility patterns and associated levels of privacy with both social and movement patterns | Nursing Home | Older Adults | Bluetooth | Activity, Dwell, Trajectory |
| Okada 2019 [59] | To predict scores on the dementia scale using behavioural features as observed through human–robot interactions and indoor daily activity | Nursing Home | Older Adults | Bluetooth | Dwell Time |
| Ramezani 2019 [60] | To examine the ability of combination of physical activity and indoor location features to discriminate subacute care patients who are re-admitted to the hospital | Inpatient Unit | Older Adults | Bluetooth | Activity, Dwell |
| Vuong 2014 [61] | To determine an automated system for detecting and classifying travel patterns in people with dementia using movement data | Inpatient Unit | Older Adults | RFID | Trajectory |
| Jeong 2017 [4] | To assess the feasibility of using an infrared-based RTLS for measuring patient ambulation in a 2-min walk test (2MWT) | Inpatient Unit | Adults | IR | Activity Levels |
| Kearns 2016 [62] | To determine if improvements in cognitive function during traumatic brain injury treatment can be measured using movement path tortuosity in everyday ambulation | Inpatient Unit | Adults | UWB | Trajectory |
| Jeong 2020 [63] | To evaluate novel ambulation metrics in predicting 30-day readmission rates, discharge location, and length of stay of postoperative cardiac surgery patients | Inpatient Unit | Cardiac Patients | IR | Activity, Dwell |
| Consumer Behaviour | |||||
| Dogan 2019 [64] | To show the potential of process mining techniques to understand customer needs and behavioural trends based on gender differences | Shopping Mall | Shoppers | Bluetooth | Trajectory |
| Liu 2020 [65] | To produce a method to infer customer profiles, mainly gender and age, using indoor location data | Shopping Mall | Shoppers | WiFi | Activity, Dwell, Trajectory |
| Dogan 2020 [66] | To use process mining to determine customer visit time and describe different customer flows between customers who purchase and those who do not | Supermarket | Shoppers | Bluetooth | Dwell, Trajectory |
| Kholod 2011 [67] | To examine grocery shoppers’ moving direction within the store and its influence on their buying behaviour | Supermarket | Shoppers | RFID | Trajectory |
| Popa 2013 [68] | To develop a framework for automatic assessment of customers’ behaviours to categorize them into different shoppers’ types by goal | Supermarket | Shoppers | Camera | Trajectory |
| Paolanti 2017 [69] | To model and predict shopper’s behaviour in retail environments to predict the shopper’s trajectory | Supermarket | Shoppers | UWB | Activity, Dwell, Trajectory |
| Yang 2019 [70] | To define the relationship between the layout of the shelves, and shopping behaviour and product sales | Supermarket | Students | UWB | Activity, Dwell |
| Takai 2010 [71] | To describe the relation between the time customers spend in a store section and the probability they will make a purchase | Supermarket | Shoppers | RFID | Dwell Time |
| Takai 2011 [72] | To correlate the number of purchased items by stationary time and find a two-category model that groups shopper behaviours using this correlation | Supermarket | Shoppers | RFID | Dwell Time |
| Takai 2012 [73] | To capture dependencies among variables that describe purchasing behaviour based on section of stores | Supermarket | Shoppers | RFID | Dwell Time |
| Takai 2013 [74] | To find homogeneous groups of customers based on the number of purchased items and determine whether time period that the customer shops influences this group classification | Supermarket | Shoppers | RFID | Dwell Time |
| Kaneko 2018 [75] | To build a purchase behaviour model of customers and predict whether the customer will make a purchase or not | Supermarket | Shoppers | RFID | Dwell Time |
| Nakahara 2012 [76] | To propose models that clarify the relationship between product zone visit sequences and shopping behaviour and use them to characterize high-value purchasing customers and low-value purchasing customers | Supermarket | Shoppers | RFID | Activity, Dwell, Trajectory |
| Zuo 2015 [77] | To improve methods of predicting whether a customer will make a purchase or not | Supermarket | Shoppers | RFID | Dwell Time |
| Li 2016 [78] | To study relationships between different variables derived from the amount of time spent in different areas of the store, how much was purchased from each area, and the area type | Supermarket | Shoppers | RFID | Activity, Dwell |
| Gu 2019 [79] | To measure differences in product search behaviour and search benefits depending on the customer and their varying levels of self-control | Supermarket | Shoppers | RFID | Dwell Time |
| Yoshimura 2014 [80] | To identify aspects of visitor behaviour that could explain museum overcrowding | Museum | Museum Visitors | Bluetooth | Activity, Dwell, Trajectory |
| Yoshimura 2019 [81] | To compare museum visitor movements when more or fewer choices are offered | Museum | Museum Visitors | Bluetooth | Dwell, Trajectory |
| Kanda 2007 [82] | To estimate visitor trajectories to analyse space, visiting patterns, and relationships | Museum | Museum Visitors | RFID | Activity, Dwell, Trajectory, Proximity |
| Lanir 2013 [83] | To compare the movement of museum visitors who used a mobile multimedia location-aware guide to those who did not | Museum | Museum Visitors | RFID | Activity, Dwell, Proximity |
| Martella 2017 [84] | To understand the behaviour of museum visitors and the attraction power of different displays | Museum | Museum Visitors | RFID | Dwell, Trajectory, Proximity |
| Safety and Operational Efficiency | |||||
| Booth 2019 [85] | To develop a technique for clustering room purpose based on patterns in human movement data and to predict mental wellness levels of hospital staff | Hospital | Primary Care Staff | Bluetooth | Dwell, Trajectory |
| Feng 2020 a [86] | To detect and discover location-driven routines and physiological data to understand the movement intensity of nurses at different times in a work shift | Hospital | Nurses | Bluetooth | Dwell, Trajectory |
| Feng 2020 b [87] | To develop a method to quantify the relations between physiological signals and indoor locations at a real-world workplace. The method is validated on individuals’ workplace performance in a large hospital setting. | Hospital | Nurses | Bluetooth | Dwell Time |
| Lopez-de-Teruel 2017 [88] | To provide a method to differentiate location data of employees from non-employees and generate clusters related to the different working teams | Office | Workers | Custom wireless network + cell phones | Activity Levels |
| Cheng 2013 [89] | To design and validate a new method to analyse the spatio-temporal conflicts between workers and automatically defined hazard, and define an indicator that can measure the safety performance of workers | Construction | Workers | UWB | Activity, Dwell |
| Arslan 2018 [90] | To develop a model that uses worker mobility patterns to identify unsafe worker behaviours | Construction | Workers | Bluetooth | Activity, Trajectory |
| Arslan 2019 [91] | To test if semantic trajectories can visualize site-zone density to avoid congestion and provide proximity analysis to prevent collisions, accidents, and unauthorized access | Construction | Workers | Bluetooth | Activity, Dwell, Trajectory |
| Hwang 2019 [92] | To monitor pedestrian flow in a subway station and use sensor-based insights to improve pedestrian flow | Subway Station | Subway Commuters | Bluetooth/ Wi-Fi | Activity Levels |
| Developmental Behaviour | |||||
| Jorge 2019 [93] | To develop and validate an algorithm that detects unusual social behaviour and finds significant subgroups within the population | School Playground | Children | Set 1—IMU GNSS, Set 2—UWB | Proximity |
| Messinger 2019 [94] | To investigate differences in social interaction and movement within a classroom based on gender and describe the classroom social network | Classroom | Children | UWB | Activity, Trajectory, Proximity |
Publisher’s Note: MDPI stays neutral with regard to jurisdictional claims in published maps and institutional affiliations. |
© 2022 by the authors. Licensee MDPI, Basel, Switzerland. This article is an open access article distributed under the terms and conditions of the Creative Commons Attribution (CC BY) license (https://creativecommons.org/licenses/by/4.0/).
Share and Cite
Shum, L.C.; Faieghi, R.; Borsook, T.; Faruk, T.; Kassam, S.; Nabavi, H.; Spasojevic, S.; Tung, J.; Khan, S.S.; Iaboni, A. Indoor Location Data for Tracking Human Behaviours: A Scoping Review. Sensors 2022, 22, 1220. https://doi.org/10.3390/s22031220
Shum LC, Faieghi R, Borsook T, Faruk T, Kassam S, Nabavi H, Spasojevic S, Tung J, Khan SS, Iaboni A. Indoor Location Data for Tracking Human Behaviours: A Scoping Review. Sensors. 2022; 22(3):1220. https://doi.org/10.3390/s22031220
Chicago/Turabian StyleShum, Leia C., Reza Faieghi, Terry Borsook, Tamim Faruk, Souraiya Kassam, Hoda Nabavi, Sofija Spasojevic, James Tung, Shehroz S. Khan, and Andrea Iaboni. 2022. "Indoor Location Data for Tracking Human Behaviours: A Scoping Review" Sensors 22, no. 3: 1220. https://doi.org/10.3390/s22031220