Article

A Hybrid Deep Transfer Learning of CNN-Based LR-PCA for Breast Lesion Diagnosis via Medical Breast Mammograms

1
Department of Information Technology, College of Computer and Information Sciences, Princess Nourah bint Abdulrahman University, P.O. Box 84428, Riyadh 11671, Saudi Arabia
2
Department of Computer Sciences, College of Computer and Information Sciences, Princess Nourah bint Abdulrahman University, P.O. Box 84428, Riyadh 11671, Saudi Arabia
3
Biomedical Engineering Department, Helwan University, Cairo 11795, Egypt
4
Department of Artificial Intelligence, College of Software & Convergence Technology, Daeyang AI Center, Sejong University, Seoul 05006, Korea
5
Electrical and Computer Engineering Department, King Abdulaziz University, Jeddah 22254, Saudi Arabia
6
Biomedical Engineering Department, Cairo University, Giza 12613, Egypt
*
Author to whom correspondence should be addressed.
Sensors 2022, 22(13), 4938; https://doi.org/10.3390/s22134938
Submission received: 6 June 2022 / Revised: 22 June 2022 / Accepted: 27 June 2022 / Published: 30 June 2022
(This article belongs to the Special Issue Advances of Deep Learning in Medical Image Interpretation)

Abstract

:
One of the most promising research areas in the healthcare industry and the scientific community is focusing on the AI-based applications for real medical challenges such as the building of computer-aided diagnosis (CAD) systems for breast cancer. Transfer learning is one of the recent emerging AI-based techniques that allow rapid learning progress and improve medical imaging diagnosis performance. Although deep learning classification for breast cancer has been widely covered, certain obstacles still remain to investigate the independency among the extracted high-level deep features. This work tackles two challenges that still exist when designing effective CAD systems for breast lesion classification from mammograms. The first challenge is to enrich the input information of the deep learning models by generating pseudo-colored images instead of only using the input original grayscale images. To achieve this goal two different image preprocessing techniques are parallel used: contrast-limited adaptive histogram equalization (CLAHE) and Pixel-wise intensity adjustment. The original image is preserved in the first channel, while the other two channels receive the processed images, respectively. The generated three-channel pseudo-colored images are fed directly into the input layer of the backbone CNNs to generate more powerful high-level deep features. The second challenge is to overcome the multicollinearity problem that occurs among the high correlated deep features generated from deep learning models. A new hybrid processing technique based on Logistic Regression (LR) as well as Principal Components Analysis (PCA) is presented and called LR-PCA. Such a process helps to select the significant principal components (PCs) to further use them for the classification purpose. The proposed CAD system has been examined using two different public benchmark datasets which are INbreast and mini-MAIS. The proposed CAD system could achieve the highest performance accuracies of 98.60% and 98.80% using INbreast and mini-MAIS datasets, respectively. Such a CAD system seems to be useful and reliable for breast cancer diagnosis.

1. Introduction

According to the global cancer statistics in 2020, GLOBOCAN 2020 [1], an estimated 19.3 million new cancer cases have been diagnosed worldwide, with over 10.0 million cancer deaths in 2020. With an anticipated 2.3 million new cases, female breast cancer has surpassed lung cancer as the most diagnosed malignancy, followed by lung, colorectal, prostate, and stomach cancers. In Saudi Arabia, breast cancer is the most common type of cancer, and in 2018, the incidence and death age-standardized rates for Saudi women were 27.3 and 7.5 per 100,000, respectively [2]. The most efficient way to diagnose breast cancer is medical imaging examination. Digital mammography, magnetic resonance imaging (MRI), ultrasound, and infrared thermography are some of the imaging techniques utilized for diagnosis of breast cancer, while mammography imaging is the most important paradigm for its early detection [3]. The overall goal is to enable early breast cancer treatment, improve survival rates, and limit the need for severe treatments such as mastectomy [4,5]. On a mammography, dense breast tissue can appear white or light gray. This can make mammograms more difficult to read in younger women with denser breasts [6]. Many breast disorders have symptoms that are similar to cancer and require testing and, in some cases, a biopsy to diagnose. When a mammography detects something that appears to be cancer but turns out to be benign, it is called a false positive result. Based on the density of the breasts, radiologists may diagnose incorrectly with a percentage of 30% of breast cancers [7]. It is challenging for even experienced radiologists to interpret a huge number of screening mammography. Masses and microcalcifications are two types of cancer markers that can be detected by mammography technology. However, the mass detection is thought to be more difficult than microcalcification detection, not only because of the wide range of size and shape that masses can take on in a mammography, but also because masses often have poor image contrast [6,8]. Therefore, the CAD, has been developed to assist radiologists in analyzing the entire images and highlighting probable areas of concern that require further investigation. CAD can detect tumors that a radiologist may miss. It can be considered a second opinion automated tool that can assist the radiologists by automatically identifying the areas of abnormal contrast, suspicious regions [9].
Artificial intelligence, or AI, is a well-known technology that has recently been used in the development of effective CAD systems for the classification of lesions in mammograms. Numerous researchers have lately developed AI-based solutions for the automated detection and diagnosis of breast anomalies in mammography pictures. These solutions can be divided into two types: classical and deep learning models. Although the deep learning approach has achieved exceptional performance in the context of medical image analysis, several problems remain, as discussed in [10]. Over-fitting, the high complexity of deploying deep learning models, and the loss of some visual information owing to the preprocessing phase are some of these concerns. Overfitting is a key issue when applying deep learning models to medical data because of the small data size in comparison to the large number of network parameters [11,12,13]. As a result, the use of pretrained CNN models is recommended in this work to alleviate over-fitting and reduce the required high complexity in training deep learning models from scratch. However, the number of retrieved features from pretrained CNN is huge, which may cause significant problems throughout the data processing process, such as the multicollinearity problem. Multicollinearity occurs when input features of a dataset are strongly correlated. This affects regression and classification model effectiveness. Multicollinearity is reduced in this study by the utilization of feature reduction such as the Principal Components Analysis, PCA. The use of PCA is empowered in this study by using the Logistic Regression to pick the significant principal components returned from the PCA analysis [14,15].
To highlight our contribution, this study extends our prior work [16] in constructing an effective CAD system for the categorization of lesions in breast mammograms and contributes the following:
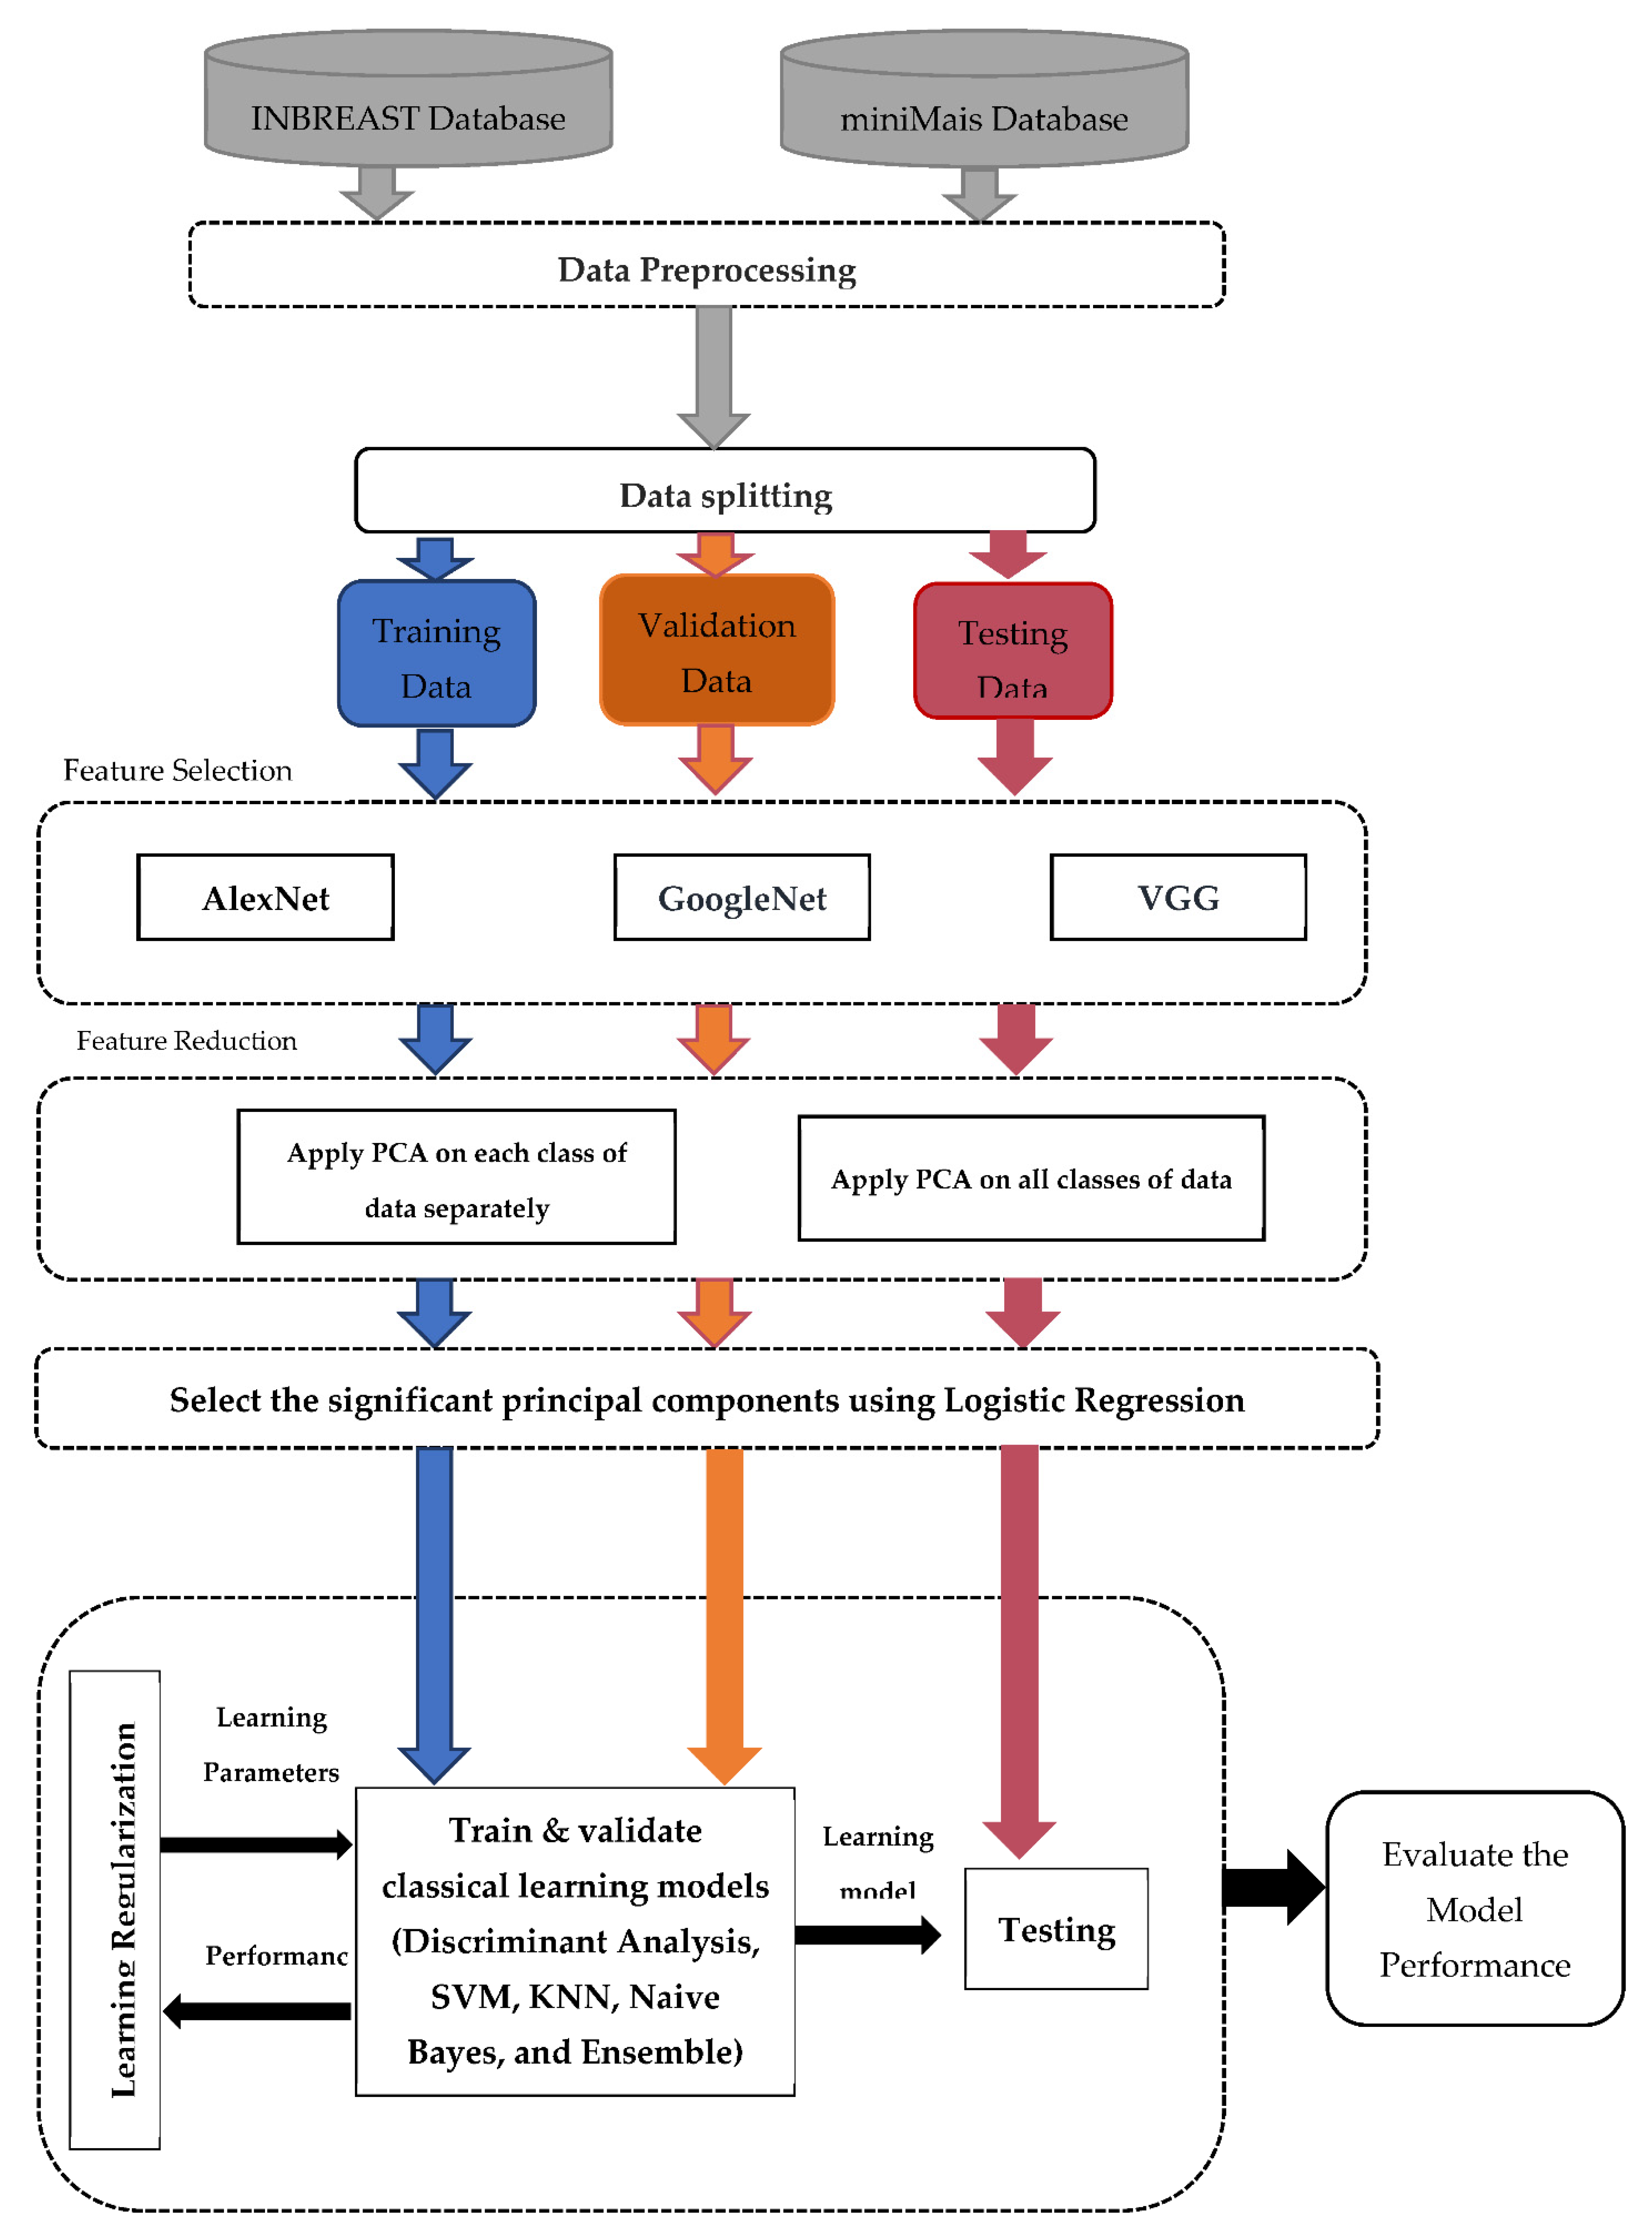
  • A hybrid deep learning model of CNN-based LR-PCA has been designed for breast lesion classification purpose using the X-ray breast cancer images (i.e., mammograms).
  • Generating more useful and powerful input information based on pseudo-colored images to enrich the input knowledge of deep learning models.
  • A comprehensive study of transfer learning based on multiple convolutional networks has been conducted in order to extract the high-level deep features directly from the pre-trained backbone models.
  • Resolving the multicollinearity problem that occurs among the derived high-level deep features from pre-trained by introducing a new method called LR-PCA. The optimized PCs are selected to perform the final classification purpose.
  • A comprehensive evaluation process of the proposed CAD system is performed using two different public benchmark datasets: INbreast and mini-MAIS.

2. Related Work

Artificial intelligence, AI, is a well-known technology that has recently been employed in developing innovative solutions in the healthcare sector. These solutions can help patients in receiving an earlier diagnosis and precise treatments while also increasing the efficiency and effectiveness of healthcare services. The governance and regulation of AI services in healthcare is a major concern. The BSI (body substance isolation) and AAMI (Association for the Advancement of Medical Instrumentation) are non-profit standardization organizations that are investigating the role for standards in the deployment of innovative AI solutions within the healthcare sector [17]. Regulations protect the society by guaranteeing that the medical technology placed on the market poses an acceptable and fair level of risk. The quality of data inputs is one of the main issues that has been reported by the Medicines and Healthcare products Regulatory Agency, MHRA, in partnership with the AAMI. MHRA is an executive agency responsible for ensuring that medicines and medical devices work and are acceptably safe. They have recommended that the AI solutions will only be effective, and safe if the data models are trained on high quality data. Data samples need to contain enough variety to fulfill regulators, patients, and professionals and avoid unintentionally any error or bias in the AI outputs. In addition, the level of complexity is another concern. Eventually, the AI developer should understand and articulate the type of AI technique that is being developed, and its deployment environment.
The AI-based solutions for the automated detection and diagnosis of breast abnormalities in mammography images have recently been proposed by numerous researchers. These solutions can be classified into classical and deep learning models. Early CAD systems have been developed using the classical machine learning models such as the research conducted in [18,19,20,21,22,23,24,25,26,27,28,29,30]. The basic framework in these studies consists of three stages including Region of Interest (ROI) extraction, feature extraction and selection, and classification stage using well-known classifiers such as K Nearest Neighbor (KNN), Support Vector Machine (SVM), Neural Network (NN), and Ensemble classifiers such as the work conducted by Kadah et al. [18,21,24,25,31]. In [18], a CAD system that can help radiologists diagnose microcalcification patterns in digitized mammograms earlier and faster than traditional screening systems has been introduced. The proposed approach involves three steps including ROI extraction (32 × 32 pixels), feature selection using the wavelet decomposition, and classification of benign/malignant microcalcifications. Traditional classification methods were used: K-NN, SVM, NN, and fuzzy. MIAS mammographic databases were used to evaluate the suggested approach. Wavelet transform and fuzzy-neural algorithms have been proposed in [19]. These strategies are based on globally/locally processing of image/ROI. Classification of the normal/abnormal, and microcalcification masses has been accomplished on the MIAS benchmarking dataset. In [21], an enhancement in the classifier performance of the normal/microcalcification of breast tissue has been performed by the utilization of voting-based KNN and SVM classification approaches. A hybrid approach of SVM and Linear Discriminant Analysis (LDA) has been utilized in designing a CAD system for breast lesion classification in [22]. The genetic algorithm approach has been utilized for the classification of breast cancer in [23,32]. Lately, the deep learning techniques were used in most recent studies in the context of CAD system of breast cancer [33,34,35,36]. This is a natural consequence of the outstanding performance retrieved using the deep learning methods in image classification [37]. The most popular paradigm of the deep learning technology in the medical imaging is transfer learning which is based on using pretrained CNN such as Inception V3 [38], AlexNet [39], VGG19/VGG16 [40], ResNet50 [41], and GoogleNet [42]. The pretrained CNNs have been already trained on natural images such as ImageNet. The transfer learning approach has been exploited extensively in the classification of mammograms [43,44,45,46,47,48] to improve the performance of CNN architectures created from scratch. Transfer learning is utilized to enhance the performance of a machine learning model from one domain by transferring knowledge from a related domain [49]. The main advantage of transfer learning is the improvement of classification precision and rapid execution of the training phase [48]. Better improvement in the performance of transfer learning in the classification of mammograms has been introduced by utilizing the fusion of features extracted using different types of pretrained CNNs [50,51]. Another enhancement has been proposed in the study [52] which proposed a deep feature fusion framework using pretrained a CNN followed by the principal component analysis (PCA) as a feature reduction step and the SVM for the classification of breast cancer. The utilization of PCA as a dimensionality reduction for the features extracted using transfer learning has been proposed in [53] and yielded better performance than the individual use of the pretrained CNN. It is well known that PCA is the original and dominant dimension reduction tool and has been employed in a numerous study for the classification of mammograms using the traditional machine learning techniques.
With the current artificial NN and optimization skills, large-scale deep NN have been successfully developed, with a greater performance with deeper depth [54]. However, there are some concerns that should be investigated to assure the effectiveness of such solutions before being deployed in the healthcare sector. Some of the drawbacks of the AI technology have been surveyed in [55,56,57,58]. Additionally, the current challenges of deep learning technologies in the context of medical image analysis have been reviewed and defined in [10]. That article reviewed the basic concepts of deep learning and the most recent advances in medical images. They have defined the current problems of deep learning in the medical field and proposed a perspective of the primary research focus. In this study, we are investigating some of these raised issues. The first issue is the overfitting which is a major problem in applying deep learning models on medical data due to the very small data size relative to the huge number of network parameters. Second, most of network parameters come from fully connected layers after the convolutional part of the network. The third issue is that the number of classes in medical data sets is usually very small, and in many cases, binary classification problems are very common. Another issue is that all medical images are in grayscale while pretrained deep networks have color image input layers, repeating grayscale images for all three color channels is done to match input requirements, which does not seem efficient. The last issue that we have observed moreover in the current literature is that most of the aforementioned studies have employed the preprocessing of the medical images before they are used as input to deep learning networks. This does not seem to be rational given that such preprocessing aims to enhance images for human viewers and that deep networks should be able to learn the best preprocessing on its own from original images. Losing information in original images as a result of such preprocessing is likely and hence performance may be limited by the choice of such preprocessing.

3. Methodology

In this study, a hybrid deep learning CNN-based LR-PCA for breast lesion classification is proposed. Such a CAD system involves three main stages. First, three-channel pseudo-colored images are prepared based on the input grayscale images allowing deep learning models to extract more powerful deep features for better diagnosis performance. Second, backbone deep convolutional networks are used to extract the high-level deep features based on the transfer learning strategy avoiding the overfitting problem [59]. For deep feature extraction and selection, multiple deep learning models are employed such as AlexNet, VGG, and GoogleNet. Third, the LR-PCA model is proposed to select the significant principal components among the extracted features to tackle the problem of multicollinearity among the derived features. The dimensionality of the high-level deep features extracted from the top convolution layers is reduced using the PCA technique to obtain a reasonable feature space of low dimensionality while representing the variance in the input data. Then, Logistic Regression (LR) is used for selecting the significant principal components (PCs) extracted from the PCA.
The proposed CAD system comprises five modules including the preprocessing of images, features extraction using the pretrained CNN, dimensionality reduction using PCA, feature classification using the traditional machine learning techniques, and classifier evaluation using the performance metrics of CAD systems. The proposed framework is depicted in Figure 1.

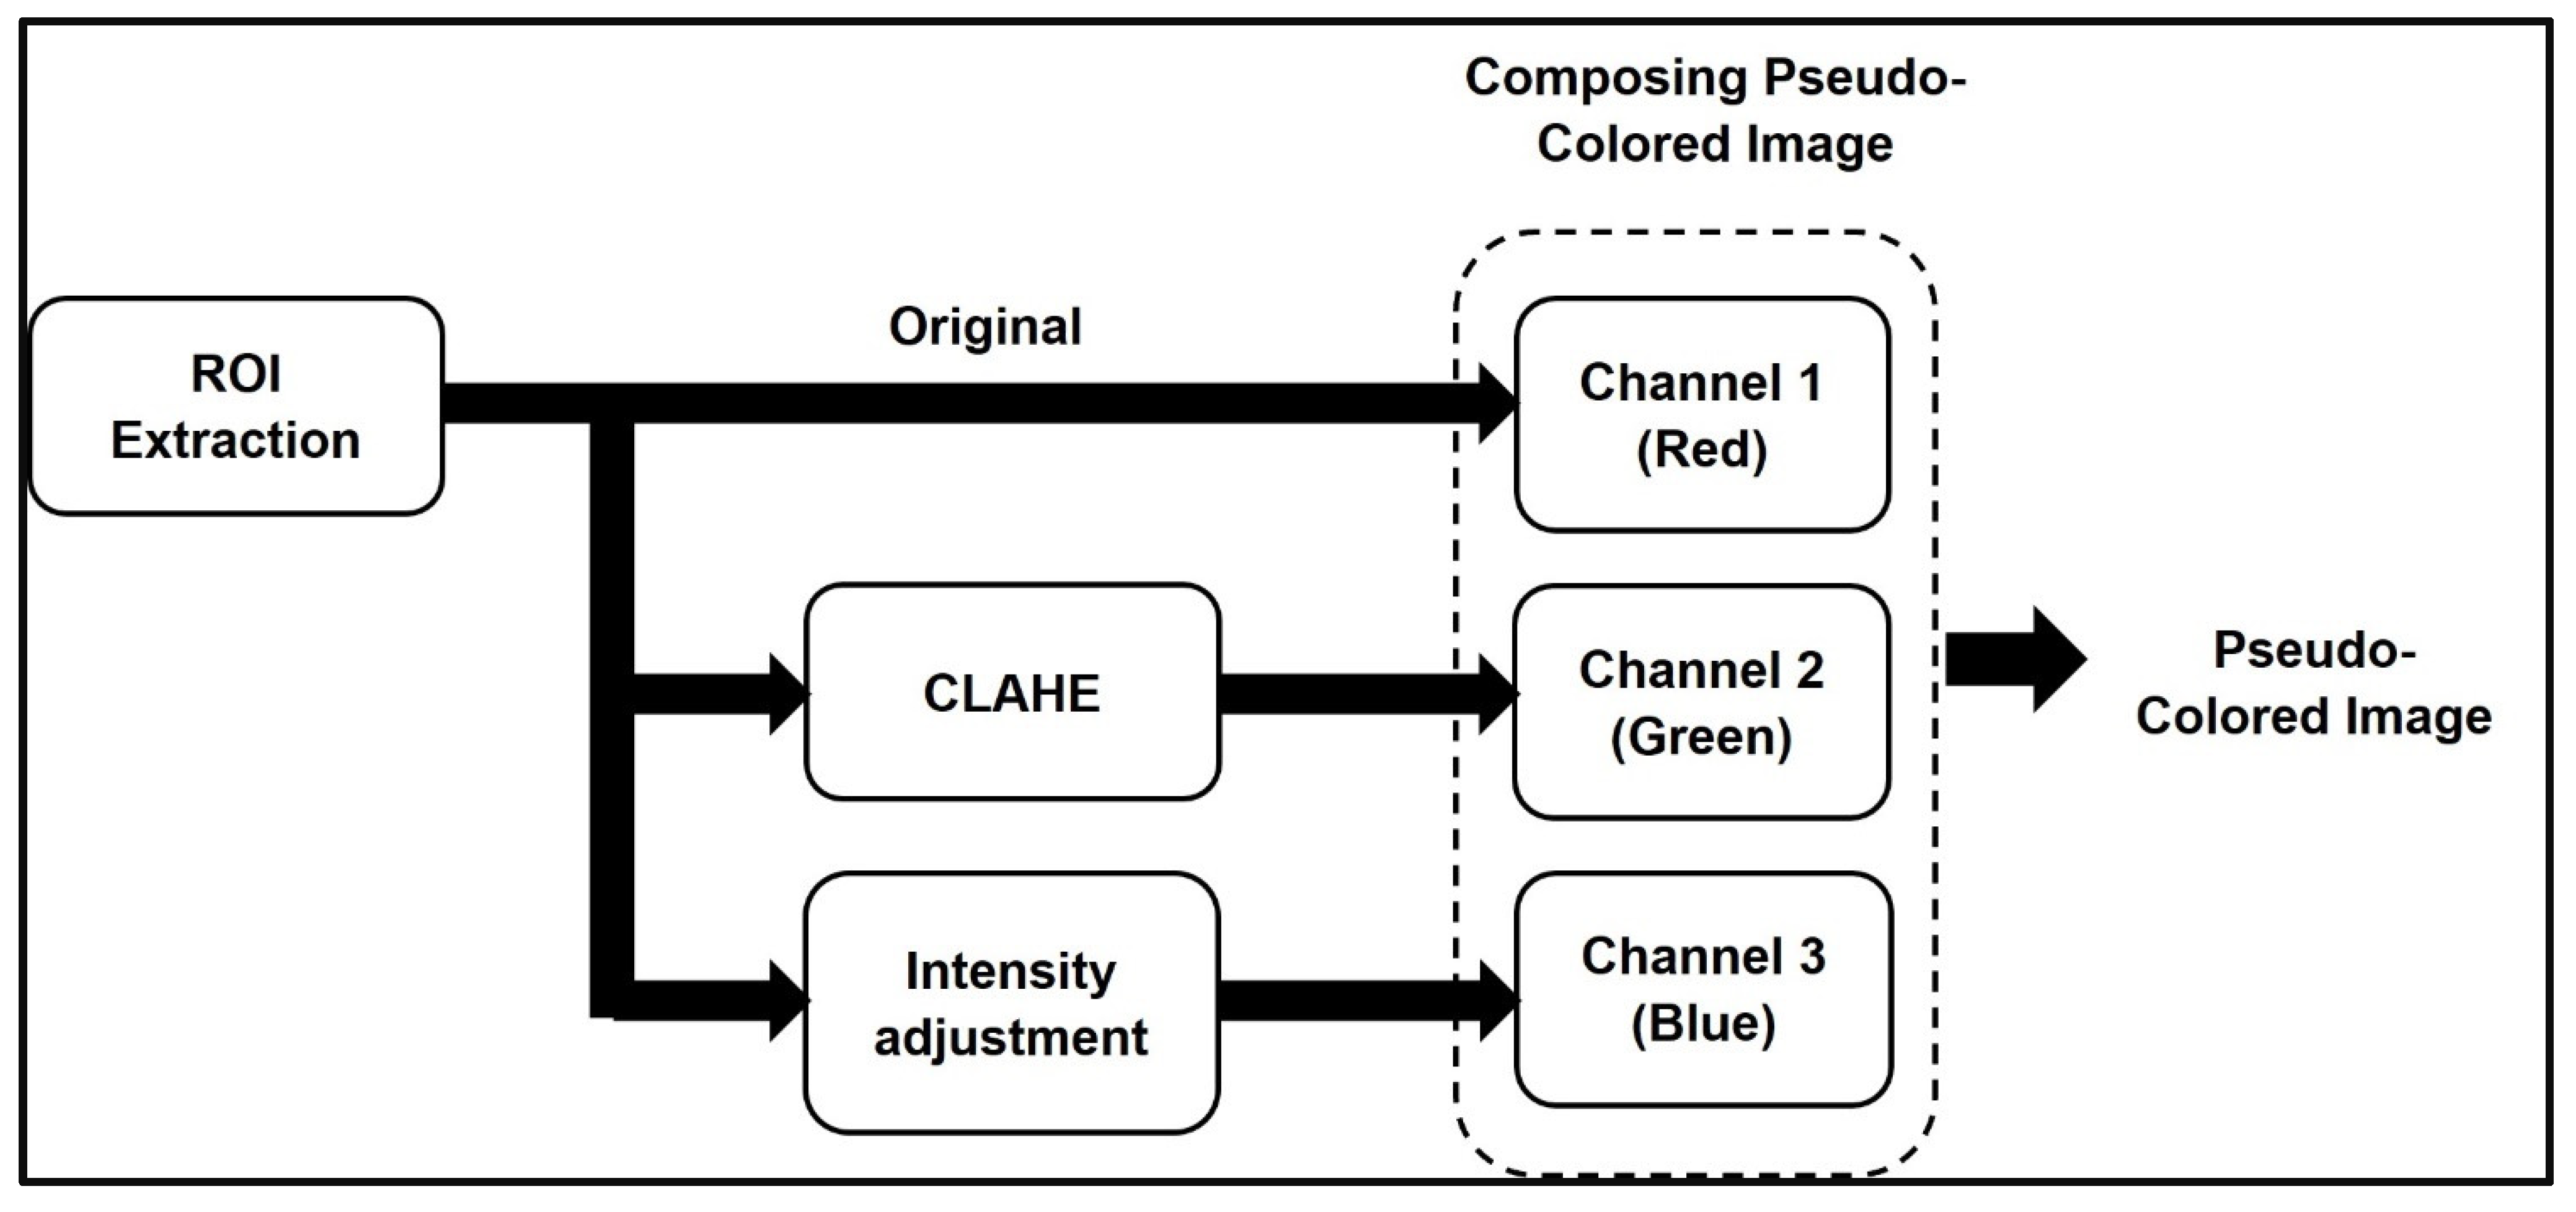
3.1. Data Preparation

The data used in this work were obtained from different public datasets including the mini-MIAS for film-based, reduced resolution data, and the INbreast for full-field high-resolution digital mammography. The mini-MIAS is a popular Mammography Image Analysis Society (MIAS) database [60]. The mini-MIAS database was created from X-ray films carefully taken from the United Kingdom National Breast Screening Program. It was digitalized with to 50 microns resolution via a device having a linear optical density mapping of 3.2 and 8-bits per pixel quantization levels. However, the images were resized to 200-micron resolution and clipped/padded to retain a size of 1024 × 1024 pixels for all images. The database comprises right, and left breast images for 161 patients so the total number of images is 322. The images correspond to samples from normal, benign and malignant tissues with 208, 63 and 51 images correspondingly. The database is supplied with a ground truth diagnosis for all images and exact locations of abnormalities that may exist inside each image represented as the center and radius of the circle around each lesion. The mammograms that are included in the INbreast dataset were all obtained at a Breast Centre that is housed within a University Hospital [61]. It has a total of 410 mammograms, representing 115 distinct patient cases. Some of the cases were obtained from women who had both of their breasts examined, meaning that there were four mammograms performed on each woman. The INbreast includes a variety of lesions that can occur in the breast, such as masses, calcifications, and distortions of asymmetries. These lesions can be found in the breast. In addition to the type of lesion and the pathology type, the bounding box annotations of any existing lesions are present in each case.
The data preparation stage includes the following steps: Region of Interest, ROI, extraction, data augmentation, and generating pseudo-color images. ROIs fed to the CNN are derived from the suspicious areas of mammograms. Data augmentation is used to enlarge the number of samples in the training dataset. A 32 × 32 square region of interest (ROI) was extracted from the lesion. Such an ROI size was selected to directly compare our proposed framework against earlier work that addressed the same classification problem using various techniques [16]. However, the ROI selection method was commonly used for various medical image CAD system pipelines [62,63]. The selected ROI size could help in ensuring an adequate statistical representation of the breast lesion. The small ROI size makes it possible to subsequently allow better lesion localization capability for the developed models [32]. For the miniMIAS database, multiple ROIs were extracted and used from a single lesion whenever it was possible to obtain non-overlapping ROIs within the given lesion. This explains why the number of ROIs is larger than the number of images. We tried to avoid overlap to obtain completely independent ROIs and this was followed in previous work [16,62,63]. Regarding the INBreast database, the previous work on this database relied on extracting an ROI of the whole mass and resizing it to the input size of the deep learning model [64].
The created datasets contain 144 ROIs with equal number, 72 abnormal and normal regions for the mini-MIAS collection, and 34 and 73 benign/malignant ROIs for the INbreast dataset. Data augmentation, which was primarily based on the flipping (up/down and left/right) and rotation technique, was utilized in order to generate greater size of the dataset that were utilized. The ROIs have been rotated by multiple different angles: 0 degrees, 90 degrees, 180 degrees, and 270 degrees. The number of samples included in each category of the labeled ROI dataset that was generated is 576 and 1095 for the mini-MIAS and the INbreast, respectively.
The pseudo-colored images were generated and used to obtain rich information allowing deep learning models to derive more accurate deep features. Instead of repeating the same image in all three-color channels, only one channel gets the original image while the other two channels receive different processed images that allow some additional global information to be incorporated within each pixel. The pseudo-color image display has been widely used in medical imaging since the digital imaging revolution and gives doctors new ways of detecting subtle variations because of the way colors are perceived by the human eye. Figure 2 illustrates the main steps that has been followed in generating the pseudo-color mapping which can be listed as follows:
  • Channel 1 (Red) includes the original grayscale image.
  • Channel 2 (Green) includes the enhanced image contrast of the grayscale image by transforming the values using contrast-limited adaptive histogram equalization (CLAHE) [65].
  • Channel 3 (Blue) includes the processed image that maps the intensity values in the grayscale image to new values by saturating the bottom 1% and the top 1% of all pixel values. This operation increases the contrast of the output image.
An example of an input image that was used during the data preparation phase can be seen in Figure 3, along with the corresponding pseudo-colored image that was generated as an output.

3.2. Feature Selection Using Transfer Learning

The conventional computer-aided diagnosing system in medical field relies heavily on the human designer’s efforts to extract handcrafted features, such as the density and shape of the cancer region [66]. This is a difficult task, as the extraction of handcrafted features is not significant in classifying the malignant areas despite the lengthy process [67]. Thus, other techniques such as transfer learning have been developed and utilized for selecting the significant features without the need for handcrafted features. The approach of transfer learning is based on utilizing pretrained CNNs in either the classification or extraction of the significant features in the training/validation dataset. There are three main types of layers in a pre-trained CNN: a convolutional layer, a pooling layer, and a fully connected (FC) layer. The convolution layers are used to extract the features, while a fully connected layer is used to classify them. This layer categorizes the selected features based on the input class. In this work, we have utilized the convolutional and pooling layers of pretrained CNNs in extracting the significant features in benign/malignant images of breast cancer; however, the FC layer has been replaced by traditional classifiers. AlexNet [39], VGG [40], and Googlenet [42] are some of the most popular pre-trained CNN models for image classification. Abdelhafiz et al. [68] have surveyed many research articles demonstrating their effectiveness in breast cancer classification. The AlexNet, VGG, and GoogleNet CNNs have been selected and utilized for this investigation due to their capability to generate high-level feature accuracy and relatively low processing complexity comparing with other models [68].
AlexNet [39] was introduced by Alex Krizhevsky and his team in 2012 in the ImageNet Large Scale Visual Recognition Challenge (ILSVRC) competition. Their CNN’s architecture is characterized by the fact that it has a much higher number of levels than previous models. There are five convolutional levels and three fully connected levels to this network’s input, which is an image with a resolution of 227 × 227 pixels. They have accomplished the top-5 error rates which is a significant improvement over what was previously possible.
VGG [40] has been introduced in the ImageNet Challenge 2014 by Karen Simonyan, and Andrew Zisserman. Using VGG, it has been shown that the depth of the network has a significant impact on CNN’s accuracy. The ReLU activation function has been inserted after the convolutional layers and followed by a pooling layer. Calibration is performed using softmaxes at the end of the model. VGG-11, VGG-16, and VGG-19 are three models of VGG-E with 11, 16, and 19 levels, respectively. The remaining 8, 13, and 16 levels in each model are convolution levels, with the final three levels of each model being fully connected.
GoogleNet [42] has also been introduced in ILSVRC challenge in 2014 by Szegedy C. et al. There are 22 layers in the GoogleNet CNN architecture. The Inception module serves as the foundation for this network structure, which is why it is known as Inception-v1. After nine inception units, each GoogleNet layer has a fully connected layer before it can be output. Inception modules are stacked on top of each other in GoogleNet, with a maximum layer of pooling. GoogleNet has twelve times fewer parameters than AlexNet, which makes it easier to train, even though it is more complex.

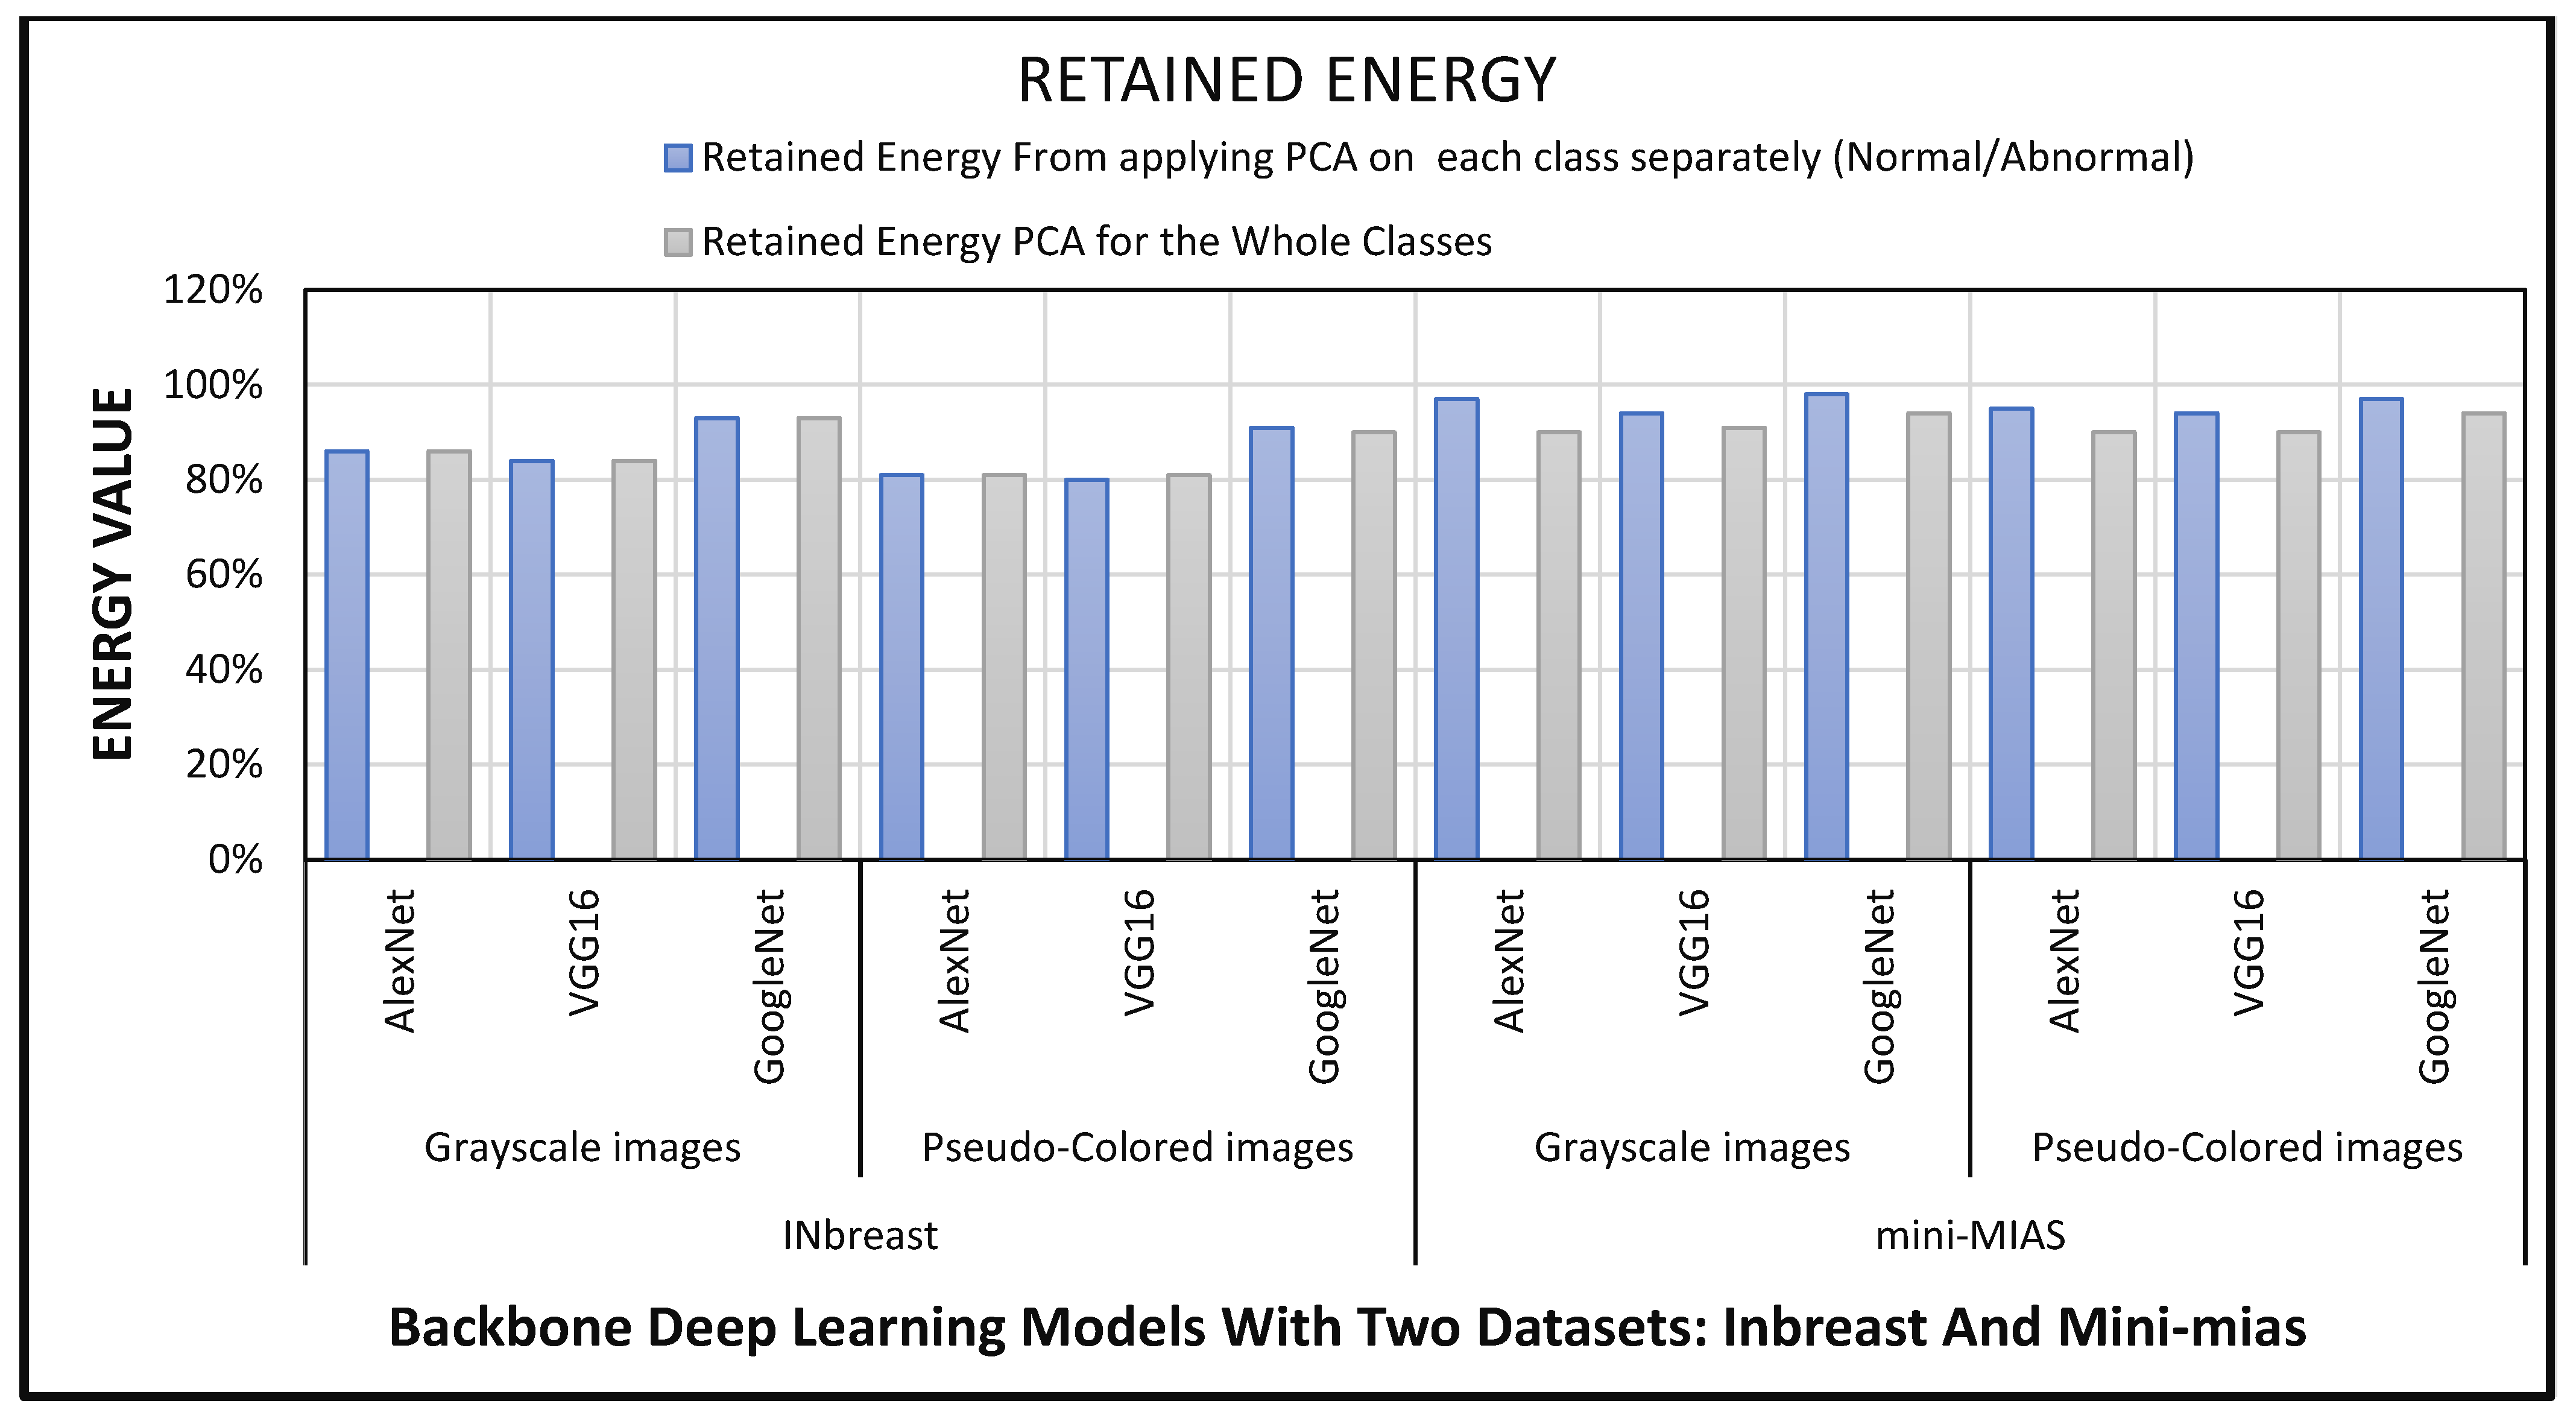
3.3. Dimensional Reduction Using LR-PCA

The number of extracted features from transfer learning when applied in the classification of medical images is huge. Although this creates opportunities to improve model performance, it also creates serious problems during the data analysis process. One of these problems is known as the multicollinearity problem [69]. Multicollinearity is a problem that arises when the input features of a dataset have a strong correlation with more than one of the other features in the dataset. The effectiveness of regression and classification models is hampered as a result of this factor. Feature reduction methods are the primary strategy that are implemented to reduce the effects of multicollinearity. PCA, or Principal Component Analysis, is a statistical technique that makes use of multicollinearity. In PCA, highly correlated variables are combined into a set of variables that are not correlated with one another. As a result, principal component analysis has the potential to successfully eliminate multicollinearity between features.
It is well known that principal component analysis is the original and preeminent dimension reduction technique, and that it has been utilized in numerous studies for the classification of mammograms utilizing conventional machine learning techniques. The process of PCA consists primarily of transforming the feature space through the relationship between attributes, mapping the initial feature space to the low-dimensional one to accomplish the goal of dimension reduction, and then analyzing the transformed feature space [70]. PCA is an unsupervised dimensional reduction approach, and it reduces the data dimension through the correlation between input features. The transformation matrix is optimized by finding the most significant differences in the original space.
The main principal in selecting the Principal Components, PCs, retrieved from the PCA is that the directions with the greatest variations contain the most information about classes. PCA is most commonly derived from a standard linear projection that maximizes the variance in the projected space. The most common method for selecting the PCs to be used is to first establish a threshold for the percentage of variance that can be explained, such as 80 percent, and then choose the number of components that generate a cumulative sum of variance that is as close as possible to that threshold. This is the standard approach to selecting the Principal Components to be used. This method suffers from the two primary weaknesses. It is necessary to make a personal decision regarding the threshold. The 80 percent or 90 percent thresholds are arbitrary and do not have a fair motive for being chosen in the majority of cases; instead, they are chosen at random. There is a chance that some portion of that variation is just noise and not an actual signal. It is not possible to know in advance whether or not the selected threshold eliminates only noise or it may remove important information from the signal itself. To overcome that problem, we are proposing a hybrid usage of Logistic Regression, LR, and PCA to select the significant components as a further reduction of features yielded from the transfer learning. LR is a common ML approach that can be utilized to explore the relationship between the input feature and outcomes. Logistic regression is a simple and effective binary classification model. It is very easy to implement LR and it works very well with classes that can be separated by a straight line. In this work, a Binomial Logistic Regression model has been constructed using a subset of the retrieved PCs from the PCA analysis. The selected PCs from the LR are the one that have a significant coefficient in the constructed LR model, p-value less than 0.05. As a result, the LR-PCA algorithm is as follows:
  • Create a covariance matrix for your dataset.
  • Determine the eigenvectors and eigenvalues of that matrix.
  • Choose the desired number of dimensions and filter the eigenvectors to match, sorting them by their associated eigenvalue.
  • Multiply the original space by the feature vector produced in the preceding step.
  • Build a Multinomial Logistic Regression model for the retrieved features.
  • Pick the principal components of the newly created LR model that have significant coefficients.

3.4. Classical ML Approaches for ROI Classification and Model Evaluation

In this work, the statistical machine learning system comprised the implementation of six distinct families of traditional classifiers. These classifiers included both parametric and nonparametric classification strategies. Methods such as decision trees, discriminant analysis, ensemble, KNN, naive Bayes, and SVM are examples of these types of techniques. By using 5-fold cross-validation to obtain a reliable estimation of the performance, the various parameters and variants that make up each classifier were optimized in order to achieve the best possible performance and reduce the issue of overfitting as much as possible. In each fold, different portions of images are assigned for each set. This process is carried out five times, which is the same as the number of folds, and the results obtained from each fold are averaged together to determine the overall performance of the system. In particular, the data for benign and malignant cases are randomly split into three sets including the training, validation, and testing sets. The percentage of division between the different splits are 70%, 15%, and 15% for training, validation, and testing sets, respectively.
To evaluate the proposed CAD framework, Accuracy (Acc.), sensitivity (SE), specificity (SP), False Negative Rate (FNR), False Positive Rate (FPR), Area Under the Curve (AUC), Matthews Correlation Coefficient (MCC), and F1-score were used [16,71]. All evaluation metrics were driven using the benefits of confusion matrix. Although accuracy is a significant performance metric due to the fact that it provides the percentage of correct classification in relation to the total number of samples, it does not distinguish between errors based on whether they are false-positive or false-negative. This presents a problem in the context of a CAD system, because in that scenario, a false-negative classification could have much more serious repercussions than a false-positive one. This issue is addressed by the sensitivity metric, which provides the percentage of malignant cases that were determined to be correctly diagnosed. However, at the other hand, the specificity reveals the proportion of typical patients whose conditions were accurately identified. When taken together, they present the full picture, which enables an observer to make direct comparisons between the various systems. In a CAD system, for instance, if two different systems have the same level of accuracy, the one that has a higher level of sensitivity is the one that is preferred.

4. Results and Discussion

In this study, we have proposed an innovative framework of a CAD system for the classification of breast cancer lesions by the use of a hybrid pretrained CNN and LR-PCA learning model. The framework comprises four stages including data preparation, feature extraction, feature reduction, and classification. In order to highlight the effect that the newly developed method in the data preparation stage has on the overall performance of the CAD system, we have generated two distinct sets of images for each database that was used in this investigation. These sets include grayscale and pseudo-colored images, respectively. In total, we have four different datasets being utilized in the testing of the adequacy of the introduced CAD system.
The pre-trained CNN has been employed as a feature extraction stage. The ROIs in each dataset have been resized to the corresponding size of each network (i.e., 227 × 227 for AlexNet and 224 × 224 for both VGG and GoogleNet) using bilinear interpolation with an anti-aliasing filter in trying to attain network requirements and preserve the image quality and maintain them free of aliasing artifacts, as the input layer must not be altered as a part of the transfer learning strategy. During the training of CNNs, the learning parameters should be estimated. In this work, a stochastic gradient descent with momentum, SGDM, optimizer was utilized. The learning rate for this optimizer was set to 0.0001, the momentum term factor was set to 0.9, the L2-Regularization setting was set to 0.0005, and the gradient threshold method used the L2-norm. The number of training epochs that could be performed was set at 100, and the mini-batch size that could be used was 16. These training options were chosen by examining the validation results obtained through the running experiments. They were applied across all networks to enable a direct comparison of the networks’ respective results as well as the training time incurred by each of them. Figure 4 outlines the required processing time for the feature extraction phase from each pre-trained deep learning model using both INbreast and mini-MIAS datasets. The development processing of this work has been executed using the academic version of Matlab 2020a coupled with the Machine Learning toolbox. The processor of the computer system is a quad-core Intel® CoreTM i7-6700HQ that operates at 2.60 GHz. It also has 16 gigabytes of random access memory (RAM), and a CUDA-supported graphics card (NVIDIA GeForce GTX 950M with 4 gigabytes of memory). Although the retrieved processing time of the conducted experiments depends on the execution environment specifications, the insights gained could be reflected by comparing the derived overall performances of the alternative methodologies. As depicted in Figure 4, the VGG16 has consumed the largest processing time compared to the other networks. This is due to the fact that VGG16 possesses a network that is more complicated and deeper than that of the AexNet, and GoogleNet. In addition, we have observed that network architecture affects the quantity of features extracted. The number of retrieved features from AlexNet, GoogleNet, and VGG16 are 4096, 1024, and 4096 respectively. This is true regardless of the type of dataset that is being utilized.
We have computed the correlation coefficients between the extracted features as well as the corresponding p-values for each feature pair in order to validate the necessity of applying principal component analysis and demonstrate that the extracted features are affected by the multicollinearity problem. The range of possible p-values is from 0 to 1, with values close to 0 indicating a significant correlation between the extracted features. For illustration, Figure 5 presents a heatmap depicting the retrieved correlation between the features extracted from one of the pretrained CNNs, as well as a histogram of the corresponding p-value. Figure 5 depicts the correlation coefficient using colors that are graded from lightest to darkest (yellow, and dark blue color represent the highest correlation coefficients). Most of the extracted features have high values for the correlation coefficient between their own and each other’s as represented by yellow color in the heatmap, as shown in the figure. Furthermore, the vast majority of the corresponding p-values for the correlation coefficient lie in the bin containing the numbers 0 to 0.1, which indicates that the coefficients are significant.
PCA is implemented by first computing the covariance matrix of the extracted features, and then calculating the PCs by employing eigenvalue decomposition. This is done so that PCA can more accurately analyze the data. After sorting the eigenvalues, the 50 values with the highest absolute value are chosen. The projection is carried out with the help of the corresponding eigenvectors. The 50 selected PCs has retained a high amount of energy within the components as illustrated in Figure 6. In order to achieve the best results from the PCA analysis, it is first performed on the training data from each class individually, and then it is combined with the principal components from all of the classes. As a result of this, the creation of class-specific features ought to be feasible at this point. It is obvious from Figure 6 that the retained energy within the PCs that is obtained by applying PCA to each category of cancer yields a higher amount of energy than the energy that is obtained by applying PCA to all of the classes combined.
Utilizing the Logistic Regression approach allowed for an additional level of filtering of the PCs to be carried out in an effective manner. Following the completion of the PCA analysis, a Binomial LR model was developed using the retrieved set of principal components (50 PCs). We have used the ANOVA F-statistics test as a method of hypothesis testing in order to evaluate the significance of the LR model in terms of choosing the significant PCs. This test was carried out so that we could assess the significance of the LR model. The significance level of the estimated coefficients that are yielded from the binomial logistic regression model has been measured. The significance has been calculated using the following metrics including the standard errors (SE), the t statistics (t), and the p-value of the coefficient estimates. The retrieved results of the test for the coefficient estimates of the fifty extracted principal components are presented in Table 1. The p-values that were retrieved show that the implanted LR model is effective in selecting the significant PCs that should be utilized in the subsequent classical classification model. The PCs that were chosen from the LR model were the ones that had a significant coefficient in the constructed LR model with a p-value that was lower than 0.05 as highlighted in gray color in Table 1. After that step, the total number of PCs that have been chosen is 23 which has been submitted to six distinct families of classical classifiers including the decision trees, discriminant analysis, SVM, KNN, naive Bayes, and Ensemble. We have performed three experiments in testing and evaluating the adequacy of the introduced CAD system. In the first experiment, the extracted features from the pretrained CNNs (AlexNet, VGG, and GoogleNet) are fed directly to the classical classifiers. In the second experiment, the extracted features are reduced using the LR-PCA before being submitted the classical classifiers and the PCA is applied for each class (normal/abnormal) separately. Additionally, in the last experiment, the PCA is utilized across all of the classes. The three experiments were carried out on a total of four image collections, which included the grayscale and pseudo-colored images derived from the mini-MIAS, and INbreast benchmarking datasets. Therefore, a total of twelve separate experiments were carried out in this work. The retrieved results yielded from experiments performed on the INbreast, and mini-MIAS datasets are presented in Table 2 and Table 3, respectively. The results that are presented in these tables are the ones that were retrieved from the best classification model out of the pool of classical classifiers that were implemented in this work. The utilization of LR-PCA on the extracted features using AlexNet for each class of the INbreast/mini-MAIS (pseudo-colored images) separately has yielded the best performance as highlighted in gray color in Table 2 and Table 3, respectively. The PCA has been applied in an optimized manner. The PCA is performed on training data from each class separately then principal components have been combined. This has allowed class-specific features to be developed and yielded those excellent results. For illustration, the ROC curve and confusion matrix for the classification results yielded from applying the LR-PCA on the extracted features from AlexNet are displayed in Figure 7.

5. Comparing the Performance and Conclusions

One of the real medical challenges of the AI applications is to build an automatic and accurate computer-aided framework for breast lesion diagnosis. In the body of published work, there have been great investigations and attempts to construct an accurate CAD system for such applications. The classification performance of the introduced system is further assessed in comparison to a number of state-of-the-art breast cancer detection systems as reported in Table 4. The early studies [72,73,74,75,76,77,78] focused mostly on identifying the textural features of breast tissues and applying traditional machine learning algorithms for classification purpose. The outcomes of those methods were not appropriated for the accurate classification of breast lesions since they lack high accuracy and sensitivity. However, the developed CAD system based on the classification of ROIs has yielded as high a performance as the work conducted using the classical ML methods [16,75] and the DL based methods [52,63,64,79,80,81,82,83]. For the MIAS dataset, the proposed LR-PCA-based system outperforms the deep learning systems developed by Ragab et al. [29], Alhussan et al. [16], and Zhang et al. [81]. Moreover, it has been noticed that the presented system achieved superior accuracy and sensitivity over the system developed by Zhang et al. [81] on the INbreast dataset. Generally, the comparison in Table 4 reveals that the proposed system could record a comparative performance with all other systems.
To conclude the current investigation, we have suggested a novel framework for a CAD system that can classify breast cancer lesions. This framework makes use of a hybrid pretrained CNN and LR-PCA learning model. The introduced system comprises four modules including data preparation, feature extraction, feature reduction, and classification. In the data preparation module, we have developed a new method for submitting the input images by applying the original ROI and the preprocessed ones in the input channels of the pretrained CNNs. The generated pseudo-colored images from the mini-MIAS and INbreast datasets, respectively, have been applied for the introduced CAD system and yielded better performance compared to the one achieved from the grayscale images. Three pretrained CNNs including the AexNet, GoogleNet, and VGG16 have been employed in the feature extraction phase and the number of extracted features from them is 4096, 1024, and 4096, respectively. These networks represent different architectures with different levels of complexity as represented by the number of parameters (weights and biases). In particular, the numbers of parameters for these networks are approximately 61 million for AlexNet, 7 million for GoogLeNet, and 138 million for VGG-16. Even with the least complex of them, the huge number of parameters suggests that it is not possible to properly train such networks with the limited data set available in this study and outline the value of using them as pretrained feature extractors rather than attempting to retrain them. Furthermore, these networks were used to classify the same data sets of this study through transfer learning. This allows direct comparison of the results. Naturally, there are additional options for pretrained CNNs that appear to be significant; nevertheless, it is challenging to address more models in a brief presentation.
A correlation analysis has been accomplished on the extracted features to examine the necessity for applying PCA on the feature matrix and demonstrating that the extracted features are affected by the multicollinearity problem. The Binomial Logistic Regression model has been developed using the retrieved set of principal components (50 PCs). The selected subset of these PCs is 23 according to their significance in the yielded results from the ANOVA F-statistics test on the developed LR model. The twenty-three PCs have been presented to six distinct families of traditional classifiers including the decision trees, discriminant analysis, SVM, KNN, naive Bayes, and Ensemble. Twelve classification experiments have been performed based on all features with or without the utilization of LR-PCA. The PCA has been examined with all classes as opposed to PCA with combined PCs that are class specific. The application of LR-PCA on the extracted features utilizing AlexNet for each class of the INbreast/mini-MAIS (pseudo-colored pictures) individually has provided the best performance. The performance of the proposed framework of our CAD system was compared to that of similar systems found in the literature, and the results of the comparison showed that the proposed one records the highest performance compared to all other systems.

Author Contributions

Conceptualization, Y.M.K. and N.A.S.; methodology, Y.M.K., N.A.S., A.A.A. and V.F.G.; software, Y.M.K., N.A.S. and V.F.G.; validation, Y.M.K. and N.A.S.; formal analysis, N.A.S., G.A., R.A., A.A.A., Y.M.K. and V.F.G.; investigation, N.A.S., G.A., R.A., A.A.A., Y.M.K. and V.F.G.; resources, Y.M.K., N.A.S., A.A.A. and V.F.G.; data curation, Y.M.K., M.A.A.-a. and V.F.G.; writing—original draft preparation, N.A.S. and Y.M.K.; writing—review and editing, N.A.S., G.A., R.A., A.A.A., M.A.A.-a. and Y.M.K.; visualization, N.A.S.; supervision, Y.M.K.; project administration, A.A.A.; funding acquisition, Y.M.K., N.A.S., A.A.A. and V.F.G. All authors have read and agreed to the published version of the manuscript.

Funding

This research was funded by the Deanship of Scientific Research at Princess Nourah bint Abdulrahman University through the Research Funding Program (Grant No# FRP-1440-30).

Institutional Review Board Statement

Not applicable.

Informed Consent Statement

Not applicable.

Data Availability Statement

Not applicable.

Acknowledgments

The authors acknowledge the Deanship of Scientific Research at Princess Nourah bint Abdulrahman University through the Research Funding Program (Grant No# FRP-1440-30) for funding this research.

Conflicts of Interest

The authors declare no conflict of interest.

References

  1. Sung, H.; Ferlay, J.; Siegel, R.L.; Laversanne, M.; Soerjomataram, I.; Jemal, A.; Bray, F. Global Cancer Statistics 2020: GLOBOCAN Estimates of Incidence and Mortality Worldwide for 36 Cancers in 185 Countries. CA A Cancer J. Clin. 2021, 71, 209–249. [Google Scholar] [CrossRef]
  2. Albeshan, S.M.; Alashban, Y.I. Incidence Trends of Breast Cancer in Saudi Arabia: A Joinpoint Regression Analysis (2004–2016). J. King Saud Univ. Sci. 2021, 33, 101578. [Google Scholar] [CrossRef]
  3. Sardanelli, F.; Fallenberg, E.M.; Clauser, P.; Trimboli, R.M.; Camps-Herrero, J.; Helbich, T.H.; Forrai, G. Mammography: An Update of the EUSOBI Recommendations on Information for Women. Insights Imaging 2017, 8, 11–18. [Google Scholar] [CrossRef] [PubMed] [Green Version]
  4. Saadatmand, S.; Bretveld, R.; Siesling, S.; Tilanus-Linthorst, M.M.A. Influence of Tumour Stage at Breast Cancer Detection on Survival in Modern Times: Population Based Study in 173,797 Patients. BMJ 2015, 351, h4901. [Google Scholar] [CrossRef] [Green Version]
  5. Feig, S.A. Screening Mammography Benefit Controversies. Sorting the Evidence. Radiol. Clin. N. Am. 2014, 52, 455–480. [Google Scholar] [CrossRef]
  6. Dheeba, J.; Albert Singh, N.; Tamil Selvi, S. Computer-Aided Detection of Breast Cancer on Mammograms: A Swarm Intelligence Optimized Wavelet Neural Network Approach. J. Biomed. Inform. 2014, 49, 45–52. [Google Scholar] [CrossRef]
  7. Kolb, T.M.; Lichy, J.; Newhouse, J.H. Comparison of the Performance of Screening Mammography, Physical Examination, and Breast US and Evaluation of Factors That Influence Them: An Analysis of 27,825 Patient Evaluations. Radiology 2002, 225, 165–175. [Google Scholar] [CrossRef] [Green Version]
  8. Bozek, J.; Mustra, M.; Delac, K.; Grgic, M. A Survey of Image Processing Algorithms in Digital Mammography. Stud. Comput. Intell. 2009, 231, 631–657. [Google Scholar] [CrossRef]
  9. Cheng, H.D.; Shi, X.J.; Min, R.; Hu, L.M.; Cai, X.P.; Du, H.N. Approaches for Automated Detection and Classification of Masses in Mammograms. Pattern Recognit. 2006, 39, 646–668. [Google Scholar] [CrossRef]
  10. Anaya-Isaza, A.; Mera-Jiménez, L.; Zequera-Diaz, M. An Overview of Deep Learning in Medical Imaging. Inform. Med. Unlocked 2021, 26, 100723. [Google Scholar] [CrossRef]
  11. Khan, U.; Khan, S.; Rizwan, A.; Atteia, G.; Jamjoom, M.M.; Samee, N.A. Aggression Detection in Social Media from Textual Data Using Deep Learning Models. Appl. Sci. 2022, 12, 5083. [Google Scholar] [CrossRef]
  12. Samee, N.A.; Atteia, G.; Alkanhel, R.; Alhussan, A.A.; AlEisa, H.N. Hybrid Feature Reduction Using PCC-Stacked Autoencoders for Gold/Oil Prices Forecasting under COVID-19 Pandemic. Electronics 2022, 11, 991. [Google Scholar] [CrossRef]
  13. Abdel Samee, N.M. Classical and Deep Learning Paradigms for Detection and Validation of Key Genes of Risky Outcomes of HCV. Algorithms 2020, 13, 73. [Google Scholar] [CrossRef] [Green Version]
  14. Alhussan, A.A.; Gaafar, M.S.; Alharbi, M.; Marzouk, S.Y.; Alharbi, S.; ElRashidy, H.; Mabrouk, M.S.; AlEisa, H.N.; Samee, N.A. Prediction of the Judd–Ofelt Parameters of Dy3+-Doped Lead Borosilicate Using Artificial Neural Network. Electronics 2022, 11, 1045. [Google Scholar] [CrossRef]
  15. Alhussan, A.A.; AlEisa, H.N.; Atteia, G.; Solouma, N.H.; Seoud, R.A.A.A.A.; Ayoub, O.S.; Ghoneim, V.F.; Samee, N.A. ForkJoinPcc Algorithm for Computing the Pcc Matrix in Gene Co-Expression Networks. Electronics 2022, 11, 1174. [Google Scholar] [CrossRef]
  16. Alhussan, A.; Abdel Samee, N.; Ghoneim, V.; Kadah, Y. Evaluating Deep and Statistical Machine Learning Models in the Classification of Breast Cancer from Digital Mammograms. (IJACSA) Int. J. Adv. Comput. Sci. Appl. 2021, 12, 304–313. [Google Scholar] [CrossRef]
  17. BSI; AAMI. The Emergence of Artificial Intelligence and Machine Learning Algorithms in Healthcare: Recommendations to Support Governance and Regulation. Position Paper. Available online: https://www.bsigroup.com/globalassets/localfiles/en-gb/about-bsi/nsb/innovation/mhra-ai-paper-2019.pdf (accessed on 20 December 2021).
  18. Alolfe, M.A.; Youssef, A.M.; Kadah, Y.M.; Mohamed, A.S. Computer-Aided Diagnostic System Based on Wavelet Analysis for Microcalcification Detection in Digital Mammograms. In Proceedings of the 2008 Cairo International Biomedical Engineering Conference, Cairo, Egypt, 18–20 December 2008. [Google Scholar]
  19. Mousa, R.; Munib, Q.; Moussa, A. Breast Cancer Diagnosis System Based on Wavelet Analysis and Fuzzy-Neural. Expert Syst. Appl. 2005, 28, 713–723. [Google Scholar] [CrossRef]
  20. Winsberg, F.; Elkin, M.; Macy, J.; Bordaz, V.; Weymouth, W. Detection of Radiographic Abnormalities in Mammograms by Means of Optical Scanning and Computer Analysis. Radiology 1967, 89, 211–215. [Google Scholar] [CrossRef]
  21. Mohamed, W.A.; Alolfe, M.A.; Kadah, Y.M. Microcalcifications Enhancement in Digital Mammograms Using Fractal Modeling. In Proceedings of the 2008 Cairo International Biomedical Engineering Conference, Cairo, Egypt, 18–20 December 2008. [Google Scholar]
  22. Alolfe, M.A.; Mohamed, W.A.; Youssef, A.B.M.; Mohamed, A.S.; Kadah, Y.M. Computer Aided Diagnosis in Digital Mammography Using Combined Support Vector Machine and Linear Discriminant Analyasis Classification. In Proceedings of the International Conference on Image Processing, Cairo, Egypt, 7–10 November 2009; IEEE Computer Society: Washington, DC, USA, 2009; pp. 2609–2612. [Google Scholar]
  23. Jiang, J.; Yao, B.; Wason, A.M. A Genetic Algorithm Design for Microcalcification Detection and Classification in Digital Mammograms. Comput. Med. Imaging Graph. 2007, 31, 49–61. [Google Scholar] [CrossRef]
  24. Mohamed, W.A.; Kadah, Y.M. Computer Aided Diagnosis of Digital Mammograms. In Proceedings of the ICCES’07—2007 International Conference on Computer Engineering and Systems, Auckland, New Zealand, 11–14 July 2007; pp. 299–303. [Google Scholar]
  25. Alolfe, M.A.; Youssef, A.B.M.; Kadah, Y.M.; Mohamed, A.S. Development of a Computer-Aided Classification System for Cancer Detection from Digital Mammograms. In Proceedings of the National Radio Science Conference, Tanta, Egypt, 18–20 March 2008. [Google Scholar]
  26. Ayer, T.; Chen, Q.; Burnside, E.S. Artificial Neural Networks in Mammography Interpretation and Diagnostic Decision Making. Comput. Math. Methods Med. 2013, 2013, 832509. [Google Scholar] [CrossRef] [Green Version]
  27. Xu, W.; Li, H.; Xu, P. A New ANN-Based Detection Algorithm of the Masses in Digital Mammograms. In Proceedings of the IEEE ICIT 2007—2007 IEEE International Conference on Integration Technology, Burlingame, CA, USA, 4–6 June 2007; pp. 26–30. [Google Scholar]
  28. al Sharkawy, M.; Sharkas, M.; Ragab, D. Breast Cancer Detection Using Support Vector Machine Technique Applied on Extracted Electromagnetic Waves. Appl. Comput. Electromagn. Soc. J. 2012, 27, 292–301. [Google Scholar]
  29. Ragab, D.A.; Sharkas, M.; Attallah, O. Breast Cancer Diagnosis Using an Efficient CAD System Based on Multiple Classifiers. Diagnostics 2019, 9, 165. [Google Scholar] [CrossRef] [Green Version]
  30. Assiri, A.S.; Nazir, S.; Velastin, S.A. Breast Tumor Classification Using an Ensemble Machine Learning Method. J. Imaging 2020, 6, 39. [Google Scholar] [CrossRef]
  31. Liu, N.; Qi, E.S.; Xu, M.; Gao, B.; Liu, G.Q. A Novel Intelligent Classification Model for Breast Cancer Diagnosis. Inf. Processing Manag. 2019, 56, 609–623. [Google Scholar] [CrossRef]
  32. Kadah, Y.M.; Farag, A.A.; Zurada, J.M.; Badawi, A.M.; Youssef, A.B.M. Classification Algorithms for Quantitative Tissue Characterization of Diffuse Liver Disease from Ultrasound Images. IEEE Trans. Med. Imaging 1996, 15, 466–478. [Google Scholar] [CrossRef]
  33. Jiang, F.; Liu, H.; Yu, S.; Xie, Y. Breast Mass Lesion Classification in Mammograms by Transfer Learning. In Proceedings of the ACM International Conference Proceeding Series; Association for Computing Machinery: New York, NY, USA, 2017; pp. 59–62. [Google Scholar]
  34. Tan, Y.J.; Sim, K.S.; Ting, F.F. Breast Cancer Detection Using Convolutional Neural Networks for Mammogram Imaging System. In Proceedings of the 2017 International Conference on Robotics, Automation and Sciences, Melaka, Malaysia, 27–29 November 2017; Institute of Electrical and Electronics Engineers Inc.: New York, NY, USA, 2018; pp. 1–5. [Google Scholar]
  35. Hepsaǧ, P.U.; Özel, S.A.; Yazici, A. Using Deep Learning for Mammography Classification. In Proceedings of the 2nd International Conference on Computer Science and Engineering, Antalya, Turkey, 5–8 October 2017; Institute of Electrical and Electronics Engineers Inc.: New York, NY, USA, 2017; pp. 418–423. [Google Scholar]
  36. Zhang, X.; Zhang, Y.; Han, E.Y.; Jacobs, N.; Han, Q.; Wang, X.; Liu, J. Whole Mammogram Image Classification with Convolutional Neural Networks. In Proceedings of the 2017 IEEE International Conference on Bioinformatics and Biomedicine, Kansas City, MO, USA, 13–16 November 2017; Institute of Electrical and Electronics Engineers Inc.: New York, NY, USA, 2017; pp. 700–704. [Google Scholar]
  37. Wu, H.; Liu, Q.; Liu, X. A Review on Deep Learning Approaches to Image Classification and Object Segmentation. Comput. Mater. Contin. 2019, 60, 575–597. [Google Scholar] [CrossRef] [Green Version]
  38. Szegedy, C.; Vanhoucke, V.; Ioffe, S.; Shlens, J.; Wojna, Z. Rethinking the Inception Architecture for Computer Vision. In Proceedings of the IEEE Computer Society Conference on Computer Vision and Pattern Recognition, Las Vegas, NV, USA, 27–30 June 2016; IEEE Computer Society: Washington, DC, USA, 2016; pp. 2818–2826. [Google Scholar]
  39. Krizhevsky, A.; Sutskever, I.; Hinton, G.E. ImageNet Classification with Deep Convolutional Neural Networks. In Advances in Neural Information Processing Systems 25, Proceedings of the 26th Annual Conference on Neural Information Processing Systems 2012, Lake Tahoe, NV, USA, 3–6 December 2012; ACM Digital Library: New York, NY, USA, 2012. [Google Scholar]
  40. Simonyan, K.; Zisserman, A. Very Deep Convolutional Networks for Large-Scale Image Recognition. In Proceedings of the 3rd International Conference on Learning Representations, ICLR 2015-Conference Track Proceedings, International Conference on Learning Representations, San Diego, CA, USA, 7–9 May 2015. [Google Scholar]
  41. He, K.; Zhang, X.; Ren, S.; Sun, J. Deep Residual Learning for Image Recognition. In Proceedings of the IEEE Computer Society Conference on Computer Vision and Pattern Recognition, Las Vegas, NV, USA, 27–30 June 2016; IEEE Computer Society: Washington, DC, USA, 2016; pp. 770–778. [Google Scholar]
  42. Szegedy, C.; Liu, W.; Jia, Y.; Sermanet, P.; Reed, S.; Anguelov, D.; Erhan, D.; Vanhoucke, V.; Rabinovich, A. Going Deeper with Convolutions. In Proceedings of the IEEE Computer Society Conference on Computer Vision and Pattern Recognition, Boston, MA, USA, 7–12 June 2015; IEEE Computer Society: Washington, DC, USA, 2015; pp. 1–9. [Google Scholar]
  43. Yemini, M.; Zigel, Y.; Lederman, D. Detecting Masses in Mammograms Using Convolutional Neural Networks and Transfer Learning. In Proceedings of the 2018 IEEE International Conference on the Science of Electrical Engineering in Israel, Sydney, Australia, 15–17 June 2018; Institute of Electrical and Electronics Engineers Inc.: New York, NY, USA, 2019. [Google Scholar]
  44. Hasan, M.K.; Aleef, T.A.; Roy, S. Automatic Mass Classification in Breast Using Transfer Learning of Deep Convolutional Neural Network and Support Vector Machine. In Proceedings of the 2020 IEEE Region 10 Symposium, Dhaka, Bangladesh, 5–7 June 2020; Institute of Electrical and Electronics Engineers Inc.: New York, NY, USA, 2020; pp. 110–113. [Google Scholar]
  45. Abd-Elsalam, N.M.; Fawzi, S.A.; Kandil, A.H. Comparing Different Pre-Trained Models Based on Transfer Learning Technique in Classifying Mammogram Masses. In Proceedings of the 30th International Conference on Computer Theory and Applications, Virtual, 12–14 December 2020; Institute of Electrical and Electronics Engineers Inc.: New York, NY, USA, 2020; pp. 54–59. [Google Scholar]
  46. Falconi, L.G.; Perez, M.; Aguilar, W.G. Transfer Learning in Breast Mammogram Abnormalities Classification with Mobilenet and Nasnet. In Proceedings of the International Conference on Systems, Signals, and Image Processing, Osijek, Croatia, 5–7 June 2019; IEEE Computer Society: Washington, DC, USA, 2019; pp. 109–114. [Google Scholar]
  47. Falconi, L.; Perez, M.; Aguilar, W.; Conci, A. Transfer Learning and Fine Tuning in Mammogram Bi-Rads Classification. In Proceedings of the IEEE Symposium on Computer-Based Medical Systems, Rochester, MN, USA, 28–30 July 2020; Institute of Electrical and Electronics Engineers Inc.: New York, NY, USA, 2020; pp. 475–480. [Google Scholar]
  48. Samala, R.K.; Chan, H.P.; Hadjiiski, L.M.; Helvie, M.A.; Cha, K.H.; Richter, C.D. Multi-Task Transfer Learning Deep Convolutional Neural Network: Application to Computer-Aided Diagnosis of Breast Cancer on Mammograms. Phys. Med. Biol. 2017, 62, 8894–8908. [Google Scholar] [CrossRef]
  49. Weiss, K.; Khoshgoftaar, T.M.; Wang, D.D. A Survey of Transfer Learning. J. Big Data 2016, 3, 9. [Google Scholar] [CrossRef] [Green Version]
  50. Wimmer, M.; Sluiter, G.; Major, D.; Lenis, D.; Berg, A.; Neubauer, T.; Buhler, K. Multi-Task Fusion for Improving Mammography Screening Data Classification. IEEE Trans. Med. Imaging 2021, 41, 937–950. [Google Scholar] [CrossRef]
  51. Wang, Z.; Li, M.; Wang, H.; Jiang, H.; Yao, Y.; Zhang, H.; Xin, J. Breast Cancer Detection Using Extreme Learning Machine Based on Feature Fusion with CNN Deep Features. IEEE Access 2019, 7, 105146–105158. [Google Scholar] [CrossRef]
  52. Ragab, D.A.; Attallah, O.; Sharkas, M.; Ren, J.; Marshall, S. A Framework for Breast Cancer Classification Using Multi-DCNNs. Comput. Biol. Med. 2021, 131, 104245. [Google Scholar] [CrossRef] [PubMed]
  53. Ma, J.; Yuan, Y. Dimension Reduction of Image Deep Feature Using PCA. J. Vis. Commun. Image Represent. 2019, 63, 102578. [Google Scholar] [CrossRef]
  54. Meyer, P.; Noblet, V.; Mazzara, C.; Lallement, A. Survey on Deep Learning for Radiotherapy. Comput. Biol. Med. 2018, 98, 126–146. [Google Scholar] [CrossRef] [PubMed]
  55. Kaplan, A.; Haenlein, M. Siri, Siri, in My Hand: Who’s the Fairest in the Land? On the Interpretations, Illustrations, and Implications of Artificial Intelligence. Bus. Horiz. 2019, 62, 15–25. [Google Scholar] [CrossRef]
  56. Topol, E.J. High-Performance Medicine: The Convergence of Human and Artificial Intelligence. Nat. Med. 2019, 25, 44–56. [Google Scholar] [CrossRef]
  57. Liu, Z.; Jin, L.; Chen, J.; Fang, Q.; Ablameyko, S.; Yin, Z.; Xu, Y. A Survey on Applications of Deep Learning in Microscopy Image Analysis. Comput. Biol. Med. 2021, 134, 104523. [Google Scholar] [CrossRef]
  58. Castiglioni, I.; Rundo, L.; Codari, M.; di Leo, G.; Salvatore, C.; Interlenghi, M.; Gallivanone, F.; Cozzi, A.; D’Amico, N.C.; Sardanelli, F. AI Applications to Medical Images: From Machine Learning to Deep Learning. Phys. Med. 2021, 83, 9–24. [Google Scholar] [CrossRef] [PubMed]
  59. Alzubaidi, L.; Al-Shamma, O.; Fadhel, M.A.; Farhan, L.; Zhang, J.; Duan, Y. Optimizing the Performance of Breast Cancer Classification by Employing the Same Domain Transfer Learning from Hybrid Deep Convolutional Neural Network Model. Electronics 2020, 9, 445. [Google Scholar] [CrossRef] [Green Version]
  60. Suckling, J.; Parker, J.; Dance, D.; Astley, S.; Hutt, I.; Boggis, C.; Ricketts, I.; Stamatakis, E.; Cerneaz, N.; Kok, S.; et al. The Mammographic Image Analysis Society Digital Mammogram Database. Excerpta Med. Int. Congr. Ser. 1994, 1069, 375–378. [Google Scholar]
  61. Moreira, I.C.; Amaral, I.; Domingues, I.; Cardoso, A.; Cardoso, M.J.; Cardoso, J.S. INbreast: Toward a Full-Field Digital Mammographic Database. Acad. Radiol. 2012, 19, 236–248. [Google Scholar] [CrossRef] [Green Version]
  62. Feature Selection in Computer Aided Diagnostic System for Microcalcification Detection in Digital Mammograms|IEEE Conference Publication|IEEE Xplore. Available online: https://ieeexplore.ieee.org/document/5233466 (accessed on 18 June 2022).
  63. Al-antari, M.A.; Al-masni, M.A.; Park, S.U.; Park, J.H.; Metwally, M.K.; Kadah, Y.M.; Han, S.M.; Kim, T.S. An Automatic Computer-Aided Diagnosis System for Breast Cancer in Digital Mammograms via Deep Belief Network. J. Med. Biol. Eng. 2018, 38, 443–456. [Google Scholar] [CrossRef]
  64. Al-antari, M.A.; Han, S.M.; Kim, T.S. Evaluation of Deep Learning Detection and Classification towards Computer-Aided Diagnosis of Breast Lesions in Digital X-Ray Mammograms. Comput. Methods Programs Biomed. 2020, 196, 105584. [Google Scholar] [CrossRef]
  65. Yadav, G.; Maheshwari, S.; Agarwal, A. Contrast Limited Adaptive Histogram Equalization Based Enhancement for Real Time Video System. In Proceedings of the 2014 International Conference on Advances in Computing, Communications and Informatics, Delhi, India, 24–27 September 2014; Institute of Electrical and Electronics Engineers Inc.: New York, NY, USA, 2014; pp. 2392–2397. [Google Scholar]
  66. Fujita, H. AI-Based Computer-Aided Diagnosis (AI-CAD): The Latest Review to Read First. Radiol. Phys. Technol. 2020, 13, 6–19. [Google Scholar] [CrossRef] [PubMed]
  67. Hssayeni, M.D.; Saxena, S.; Ptucha, R.; Savakis, A. Distracted Driver Detection: Deep Learning vs. Handcrafted Features. In Proceedings of the IS and T International Symposium on Electronic Imaging Science and Technology, Society for Imaging Science and Technology, Burlingame, CA, USA, 29 January–2 February 2017; Volume 29, pp. 20–26. [Google Scholar]
  68. Abdelhafiz, D.; Yang, C.; Ammar, R.; Nabavi, S. Deep Convolutional Neural Networks for Mammography: Advances, Challenges and Applications. BMC Bioinform. 2019, 20, 281. [Google Scholar] [CrossRef] [PubMed] [Green Version]
  69. Chan, J.Y.-L.; Leow, S.M.H.; Bea, K.T.; Cheng, W.K.; Phoong, S.W.; Hong, Z.-W.; Chen, Y.-L. Mitigating the Multicollinearity Problem and Its Machine Learning Approach: A Review. Mathematics 2022, 10, 1283. [Google Scholar] [CrossRef]
  70. Wang, X.; Paliwal, K.K. Feature Extraction and Dimensionality Reduction Algorithms and Their Applications in Vowel Recognition. Pattern Recognit. 2003, 36, 2429–2439. [Google Scholar] [CrossRef]
  71. Atteia, G.; Abdel Samee, N.; Zohair Hassan, H. DFTSA-Net: Deep Feature Transfer-Based Stacked Autoencoder Network for DME Diagnosis. Entropy 2021, 23, 1251. [Google Scholar] [CrossRef]
  72. Liu, X.; Mei, M.; Liu, J.; Hu, W. Microcalcification Detection in Full-Field Digital Mammograms with PFCM Clustering and Weighted SVM-Based Method. Eurasip J. Adv. Signal Process. 2015, 2015, 73. [Google Scholar] [CrossRef] [Green Version]
  73. Mina, L.M.; Mat Isa, N.A. Breast Abnormality Detection in Mammograms Using Artificial Neural Network. In Proceedings of the I4CT 2015—2015 2nd International Conference on Computer, Communications, and Control Technology, Art Proceeding, Kuching, Malaysia, 21–23 April 2015; Institute of Electrical and Electronics Engineers Inc.: New York, NY, USA, 2015; pp. 258–263. [Google Scholar]
  74. Xie, W.; Li, Y.; Ma, Y. Breast Mass Classification in Digital Mammography Based on Extreme Learning Machine. Neurocomputing 2016, 173, 930–941. [Google Scholar] [CrossRef]
  75. Jian, W.; Sun, X.; Luo, S. Computer-Aided Diagnosis of Breast Microcalcifications Based on Dual-Tree Complex Wavelet Transform. Biomed. Eng. Online 2012, 11, 96. [Google Scholar] [CrossRef] [Green Version]
  76. Vijayarajeswari, R.; Parthasarathy, P.; Vivekanandan, S.; Basha, A.A. Classification of Mammogram for Early Detection of Breast Cancer Using SVM Classifier and Hough Transform. Meas. J. Int. Meas. Confed. 2019, 146, 800–805. [Google Scholar] [CrossRef]
  77. Phadke, A.C.; Rege, P.P. Fusion of Local and Global Features for Classification of Abnormality in Mammograms. Sadhana-Acad. Proc. Eng. Sci. 2016, 41, 385–395. [Google Scholar] [CrossRef] [Green Version]
  78. Oliver, A.; Freixenet, J.; Zwiggelaar, R. Automatic Classification of Breast Density. In Proceedings of the International Conference on Image Processing, Genoa, Italy, 11–14 September 2005; Volume 2, pp. 1258–1261. [Google Scholar]
  79. Xu, J.; Li, C.; Zhou, Y.; Mou, L.; Zheng, H.; Wang, S. Classifying Mammographic Breast Density by Residual Learning. arXiv 2018, arXiv:1809.10241 2018. [Google Scholar]
  80. Nasir Khan, H.; Shahid, A.R.; Raza, B.; Dar, A.H.; Alquhayz, H. Multi-View Feature Fusion Based Four Views Model for Mammogram Classification Using Convolutional Neural Network. IEEE Access 2019, 7, 165724–165733. [Google Scholar] [CrossRef]
  81. Zhang, H.; Wu, R.; Yuan, T.; Jiang, Z.; Huang, S.; Wu, J.; Hua, J.; Niu, Z.; Ji, D. DE-Ada*: A Novel Model for Breast Mass Classification Using Cross-Modal Pathological Semantic Mining and Organic Integration of Multi-Feature Fusions. Inf. Sci. 2020, 539, 461–486. [Google Scholar] [CrossRef]
  82. Al-masni, M.A.; Al-antari, M.A.; Park, J.M.; Gi, G.; Kim, T.Y.; Rivera, P.; Valarezo, E.; Choi, M.T.; Han, S.M.; Kim, T.S. Simultaneous Detection and Classification of Breast Masses in Digital Mammograms via a Deep Learning YOLO-Based CAD System. Comput. Methods Programs Biomed. 2018, 157, 85–94. [Google Scholar] [CrossRef]
  83. Song, R.; Li, T.; Wang, Y. Mammographic Classification Based on XGBoost and DCNN with Multi Features. IEEE Access 2020, 8, 75011–75021. [Google Scholar] [CrossRef]
Figure 1. The Proposed CAD framework for breast lesion classification from X-ray mammograms.
Sensors 22 04938 g001
Figure 2. The concept of generating three-channel pseudo-color mapping image.
Sensors 22 04938 g002
Figure 3. Example of data preparation phase for generating the pseudo-colored image based on the original grayscale X-ray mammogram. (a) Region of interest (ROI); (b) Pseudo-Colored image; (c) Grayscale image.
Sensors 22 04938 g003
Figure 4. The retrieved processing time using Pretrained CNN for each dataset.
Sensors 22 04938 g004
Figure 5. A heatmap for the correlation coefficient between the extracted features and a histogram of the corresponding p-value. (a) The heatmap of correlation coefficient; (b) Histogram of the p-value.
Sensors 22 04938 g005
Figure 6. The energy retained within the retrieved PCs.
Sensors 22 04938 g006
Figure 7. The confusion matrices and corresponding ROC curves of the classification results based on the proposed CAD system with deep extractor AlexNet and the LR-PCA. (a) The derived confusion matrix when the PCA is separately applied for each class; (b) The ROC curve when the PCA is separately applied for each class; (c) The confusion matrix when the PCA is applied across all classes; (d) The ROC curve when the PCA is applied across all classes.
Sensors 22 04938 g007
Table 1. Statistics of the Logistic Regression (LR) model.
Model PredictorsSEt Statisticsp-Value
PC11.16387.82355.14 × 1015
PC20.000814.76410
PC30.0013−11.18614.77 × 1029
PC40.0014−13.46292.59 × 1041
PC50.0019−12.93222.96 × 1038
PC60.0015−2.15920.030837
PC70.002213.83751.51 × 1043
PC80.0019−0.00550.995623
PC90.0023−9.02871.74 × 1019
PC100.00261.20180.22944
PC110.0026−2.18620.028801
PC120.00271.61880.1055
PC130.0032−7.20775.69 × 1013
PC140.0033−8.39644.61 × 1017
PC150.0034−0.78580.431973
PC160.00351.83890.065923
PC170.00370.08540.931964
PC180.00365.94412.78 × 109
PC190.00351.80500.07108
PC200.0036−6.93004.21 × 1012
PC210.00404.90579.31 × 107
PC220.0040−4.45288.47 × 106
PC230.004311.64632.40 × 1031
PC240.0045−4.89689.74 × 107
PC250.0048−9.48812.35 × 1021
PC260.00470.71190.476501
PC270.0047−0.64450.519277
PC280.0050−2.61720.008865
PC290.00530.93960.347413
PC300.0054−6.53546.34 × 1011
PC310.0050−1.43280.151915
PC320.0054−0.52110.602287
PC330.00522.26930.023249
PC340.0057−0.66970.503072
PC350.0058−0.16420.869595
PC360.00566.03921.55 × 109
PC370.0059−1.50460.132437
PC380.0061−2.50120.012377
PC390.00600.58410.559178
PC400.00622.93990.003284
PC410.00653.07510.002104
PC420.0065−6.55215.67 × 1011
PC430.0065−3.39090.000697
PC440.0068−0.24960.802873
PC450.00633.07210.002125
PC460.0065−1.53250.125403
PC470.0064−1.51690.1293
PC480.0067−2.35650.01845
PC490.00691.79330.072918
PC500.0071−3.34540.000822
Table 2. Classification evaluation performance (%) of the proposed CAD system with three different backbone deep learning classifiers. These results were derived using INbreast dataset.
DatasetLR-PCAFeature ExtractorClassification ModelAcc.SESPPREFNRFPRAUCMCCF1-Score
Grayscale imagesAcross all classesAlexNetEnsemble (subspace KNN)97.2096.7597.6797.653.252.3310094.4397.20
VGG16Ensemble (subspace KNN)95.9094.1297.7797.685.882.2399.091.9595.87
GoogleNetEnsemble (subspace KNN)93.9092.2995.5495.397.714.4698.087.8893.81
Pseudo-Colored imagesAlexNetEnsemble (subspace KNN)98.0096.9698.8898.863.041.1295.2295.8697.90
VGG16Ensemble (subspace KNN)97.9096.6599.0999.063.350.9110095.7797.84
GoogleNetEnsemble (subspace KNN)95.1092.9097.0696.937.102.9499.090.0494.87
Grayscale imagesFor each class separatelyAlexNetEnsemble (subspace KNN)97.2096.6597.6797.643.352.3310094.3397.15
VGG16Ensemble (subspace KNN)95.9095.1396.6596.604.873.3599.091.8095.86
GoogleNetEnsemble (subspace KNN)94.6092.9097.0696.937.102.9499.090.0494.87
Pseudo-Colored imagesAlexNetEnsemble (subspace KNN)98.6098.2898.9998.981.721.0110097.2698.63
VGG16Ensemble (subspace KNN)98.1097.8798.2898.272.131.7299.096.1598.07
GoogleNetEnsemble (subspace KNN)94.5092.6096.4596.317.403.5598.089.1194.42
Grayscale imagesNot appliedAlexNetKNN96.0094.6197.6797.595.392.3396.092.3396.07
VGG16KNN95.8094.5397.1697.095.472.8499.091.7295.79
GoogleNetKNN93.4092.0195.0294.897.994.9898.087.0693.43
Pseudo-ColoredAlexNetKNN96.8095.1398.4898.434.871.5296.093.6696.75
VGG16KNN96.4095.1397.6797.614.872.3396.092.8396.35
GoogleNetKNN93.9092.4995.2395.107.514.7794.087.7693.78
Table 3. Classification evaluation performance (%) of the proposed CAD system with three different backbone deep learning classifiers. These results were derived using mini-MIAS dataset.
DatasetLR-PCAFeature ExtractorClassification ModelAcc.SESP PREFNRFPR AUCMCCF1-Score
Grayscale imagesAcross all classesAlexNetEnsemble (subspace KNN)97.5099.4296.3896.410.583.6210095.8197.89
VGG16Ensemble (subspace KNN)97.3097.4997.3097.302.512.7010094.7997.40
GoogleNetEnsemble (subspace KNN)97.5097.4795.9895.982.534.0210093.4596.72
Pseudo-Colored imagesAlexNetEnsemble (subspace KNN)98.6099.4197.4997.540.392.5110097.1398.57
VGG16Ensemble (subspace KNN)98.2098.2698.0798.071.741.9310096.3398.17
GoogleNetEnsemble (subspace KNN)97.5097.8897.1097.132.122.9010094.9897.50
Grayscale imagesFor each class separatelyAlexNetEnsemble (subspace KNN)98.1098.6597.4997.511.352.5110096.1498.08
VGG16Ensemble (subspace KNN)97.0098.0796.5396.581.933.4710094.6197.32
GoogleNetEnsemble (subspace KNN)96.3096.3596.7196.723.653.2999.093.0596.53
Pseudo-Colored imagesAlexNetEnsemble (subspace KNN)98.8099.6298.2698.280.581.7410097.6998.85
VGG16Ensemble (subspace KNN)97.7098.4696.9196.961.543.0999.095.3897.70
GoogleNetEnsemble (subspace KNN)97.3097.3097.3097.302.702.700.9994.5997.30
Grayscale imagesNot appliedAlexNetKNN97.0098.6596.9196.971.353.0996.095.5797.80
VGG16KNN97.8097.8897.6897.692.122.3210095.5697.78
GoogleNetKNN97.8097.6897.8897.872.322.1298.095.5697.78
Pseudo-ColoredAlexNetKNN97.2097.9096.9396.972.103.0795.094.8397.43
VGG16KNN97.6097.8797.8897.872.132.121000.95750.9787
GoogleNetKNN97.9097.6797.5097.492.332.5099.00.95170.9758
Table 4. Evaluation comparison results of the proposed CAD system against the state-of the-art breast cancer classification systems.
ReferenceFeature Extraction ApproachClassifierDatasetSE (%)Acc. (%)
Oliver et al. [78]Utilizing Fuzzy C Means for lesion segmentation and a number of textural and morphological features are usedSVMMIAS87.3391.51
Phadke et al. [77]Breast cancer classification based on the fusion of local and global morphological and textural featuresSVMMIAS92.7183.1
Jian et al. [75]Utilizing the wavelet transform in order to retrieve the textural features of ROIsClassification of ROIs using SVMMIAS96.397.7
Vijayarajeswari et al. [76]Breast lesions were classified using SVM after applying the Hough transform for feature extraction.SVMMIAS-94.0
Xie et al. [74]Classification of breast lesions using metaheuristic-based classifierPSO-SVMMIAS92.089.0
Mina et al. [73]Classification of breast cancer using ANN and wavelet decomposition for feature extractionANNMIAS68.0-
Liu et al. [72]Detection of microcalcification in digital mammograms SVMINbreast92.0-
Xu et al. [79]Deep CNN for feature extraction and classification of breast lesionsCNNINbreast-96.8
Al-antari et al. [63,82]End-to-end CAD system for the segmentation and classification of breast massesYOLO classifier INbreast95.6489.91
Ragab et al. [29]Deep features fusion of AlexNet, GoogleNet, ResNet-18, ResNet-50, and ResNet-10.SVMCBIS-DDSM MIAS98.0
99.0
97.90
97.40
Alhussan et al. [16]AlexNetAlexNetMIAS98.2698.26
GoogLeNetGoogLeNet98.2698.26
VGG-16VGG-1698.7098.28
Zhang et al. [81]Features were extracted by Gist, SIFT, HOG, LBP, VGG, ResNet, and DenseNet and fused together.SVM, XGBoost, Naïve Bayes, k-NN, DT, AdaBoostingCBIS-DDSM INbreast98.61
57.2
90.91
87.93
Song et al. [83]GoogleNet
Inception-v2
XGBoostDDSM99.7492.8
Khan et al. [80]Fusion of deep features extracted by VGG-16, VGG-19, GoogleNet, and ResNet-50.Transfer LearningCBIS-DDSM MIAS98.0796.6
Proposed CAD systemFeatures are selected using LR-PCA from pseudo images.Hybrid Transfer Learning of CNN-based LR-PCAMIAS INbreast99.62 98.2898.80
98.62
Publisher’s Note: MDPI stays neutral with regard to jurisdictional claims in published maps and institutional affiliations.

