Article

Synthesis of TiO2-(B) Nanobelts for Acetone Sensing

by
Gayan W. C. Kumarage
1,2,
Shasika A. Panamaldeniya
3,4,
Dileepa C. Maddumage
3,4,
Abderrahim Moumen
1,
Valentin A. Maraloiu
5,
Catalina G. Mihalcea
5,
Raluca F. Negrea
5,
Buddhika S. Dassanayake
4,
Nanda Gunawardhana
6,
Dario Zappa
1,
Vardan Galstyan
1 and
Elisabetta Comini
1,*
1
SENSOR Lab, Department of Information Engineering, University of Brescia, 25133 Brescia, Italy
2
Department of Physics and Electronics, Faculty of Science, University of Kelaniya, Kelaniya 11600, Sri Lanka
3
Postgraduate Institute of Science, University of Peradeniya, Peradeniya 20400, Sri Lanka
4
Department of Physics, Faculty of Science, University of Peradeniya, Peradeniya 20400, Sri Lanka
5
Laboratory of Atomic Structures and Defects in Advanced Materials, National Institute of Materials Physics, Atomistilor str. 405 A, 077125 Magurele, Romania
6
Research and International Affairs, Sri Lanka Technological Campus, Padukka 10500, Sri Lanka
*
Author to whom correspondence should be addressed.
Sensors 2023, 23(19), 8322; https://doi.org/10.3390/s23198322
Submission received: 1 September 2023 / Revised: 4 October 2023 / Accepted: 4 October 2023 / Published: 8 October 2023
(This article belongs to the Special Issue Chemical Sensors—Recent Advances and Future Challenges 2023–2024)

Abstract

:
Titanium dioxide nanobelts were prepared via the alkali-hydrothermal method for application in chemical gas sensing. The formation process of TiO2-(B) nanobelts and their sensing properties were investigated in detail. FE-SEM was used to study the surface of the obtained structures. The TEM and XRD analyses show that the prepared TiO2 nanobelts are in the monoclinic phase. Furthermore, TEM shows the formation of porous-like morphology due to crystal defects in the TiO2-(B) nanobelts. The gas-sensing performance of the structure toward various concentrations of hydrogen, ethanol, acetone, nitrogen dioxide, and methane gases was studied at a temperature range between 100 and 500 °C. The fabricated sensor shows a high response toward acetone at a relatively low working temperature (150 °C), which is important for the development of low-power-consumption functional devices. Moreover, the obtained results indicate that monoclinic TiO2-B is a promising material for applications in chemo-resistive gas detectors.

1. Introduction

Metal oxide-based chemical gas sensors are now regarded as excellent candidates for environmental monitoring due to their good sensitivity, fast response, and recovery times toward different analytes [1,2,3,4,5,6,7]. Moreover, research studies are progressing to employing metal oxides at their optimum gas-sensing performances and develop low-cost, portable, and stable chemo-resistive sensors. Among the existing technologies of metal oxides, thick films, thin films, nanocrystals, and one-dimensional (1D) structures are widely investigated owing to their superior surface-to-volume ratio, stability, and low production cost, together with excellent analyte-sensing performances [8,9,10,11,12]. Furthermore, 1D SnO2, ZnO2, and TiO2 materials are widely studied in the field of chemo-resistive sensors, accounting for over 78% (SnO2 > 34%, ZnO2 > 31%, and TiO2 > 12%) of all reported 1D metal oxide chemical gas sensors, to the best of the authors’ knowledge [13,14].
TiO2 is one of the interesting transition-metal oxides due to its biocompatibility, stability, abundance, and low cost of production [15,16,17,18,19,20,21]. The crystallite phases of TiO2, i.e., anatase, rutile, brookite, and monoclinic, are shown in Figure 1a–d [22]. The chains of TiO6 octahedra are the building blocks that make up the tetragonal lattice structures of TiO2. In an anatase structure, zigzag chains of TiO6 octahedra are linked to each other with four edge-shared bonding (faces sharing, Figure 1a), and, in the rutile phase, two opposite edges of each octahedron link at a corner of an oxygen atom, forming linear chains of octahedra at each corner (Figure 1b). Consequently, rutile is the most stable crystal structure in the bulk material. However, brookite structures (Figure 1c) are also commonly available based on specific growth techniques and mechanisms [23]. Thus, investigating novel approaches for the synthesis of TiO2 nanostructures including simple fabrication technologies is still demanding. Hence, several growth techniques, for instance, atomic layer deposition [24], electrochemical anodization [25], hydrothermal method [26], chemical vapor deposition (CVD) [27], and electrospinning [28], have been employed to fabricate low-dimensional TiO2 structures for gas-sensing applications [29,30].
Besides these three crystal phases, another crystal phase, TiO2-(B) (monoclinic, Figure 1d), is also available based on synthesis parameters. TiO2-(B) possesses a layer structure, resulting in low density, high specific capacity, and more open structural frameworks compared to other phases [30,31]. The various TiO2 crystal phases react with interacting gases in distinctive ways, as is well known [18]. Due to their molecular structure, bond length, and reactive groups, crystal phases are sensitive to certain gases [32]. For instance, rutile TiO2 nanorods are sensitive to isopropanol [33] and anatase TiO2 nanowires are sensitive to NO2 [34]. As a result, it is crucial to research the various TiO2 crystal phases for gas sensing. However, monoclinic TiO2 is very rarely reported in the literature because of synthesis difficulties. Pioneering work on TiO2-(B) was reported by Marchand et al. in 1980, which was prepared using the hydrothermal method, one of the simplest, low-cost, and high-yield processes [35]. Subsequently, several interesting research works have been reported on the preparation of TiO2-(B), showing high catalytic and electrochemical properties [36,37,38,39].
Moreover, the hydrothermal method is a well-known process for preparing metal oxide nanomaterials with various morphologies by simply varying the pH value of the solution and the growth temperature. However, some highly toxic chemicals are still involved in these growth methods to achieve high-quality nanostructures. Therefore, we investigated the potential of replacing highly toxic compounds with low- or moderately toxic chemicals to grow TiO2-(B) nanobelts via low-cost hydrothermal techniques. Herein, harmful hydrochloric acid (HCl), which is usually used in the protonation phase, was replaced by acetic acid (CH3COOH) for the synthesis of TiO2-(B). Furthermore, the morphological, structural, and compositional characteristics of the material were investigated. Additionally, the gas-sensing properties of TiO2-(B) were determined in order to employ the prepared material in low-power-consumption chemiresistive gas sensors.

2. Materials and Methods

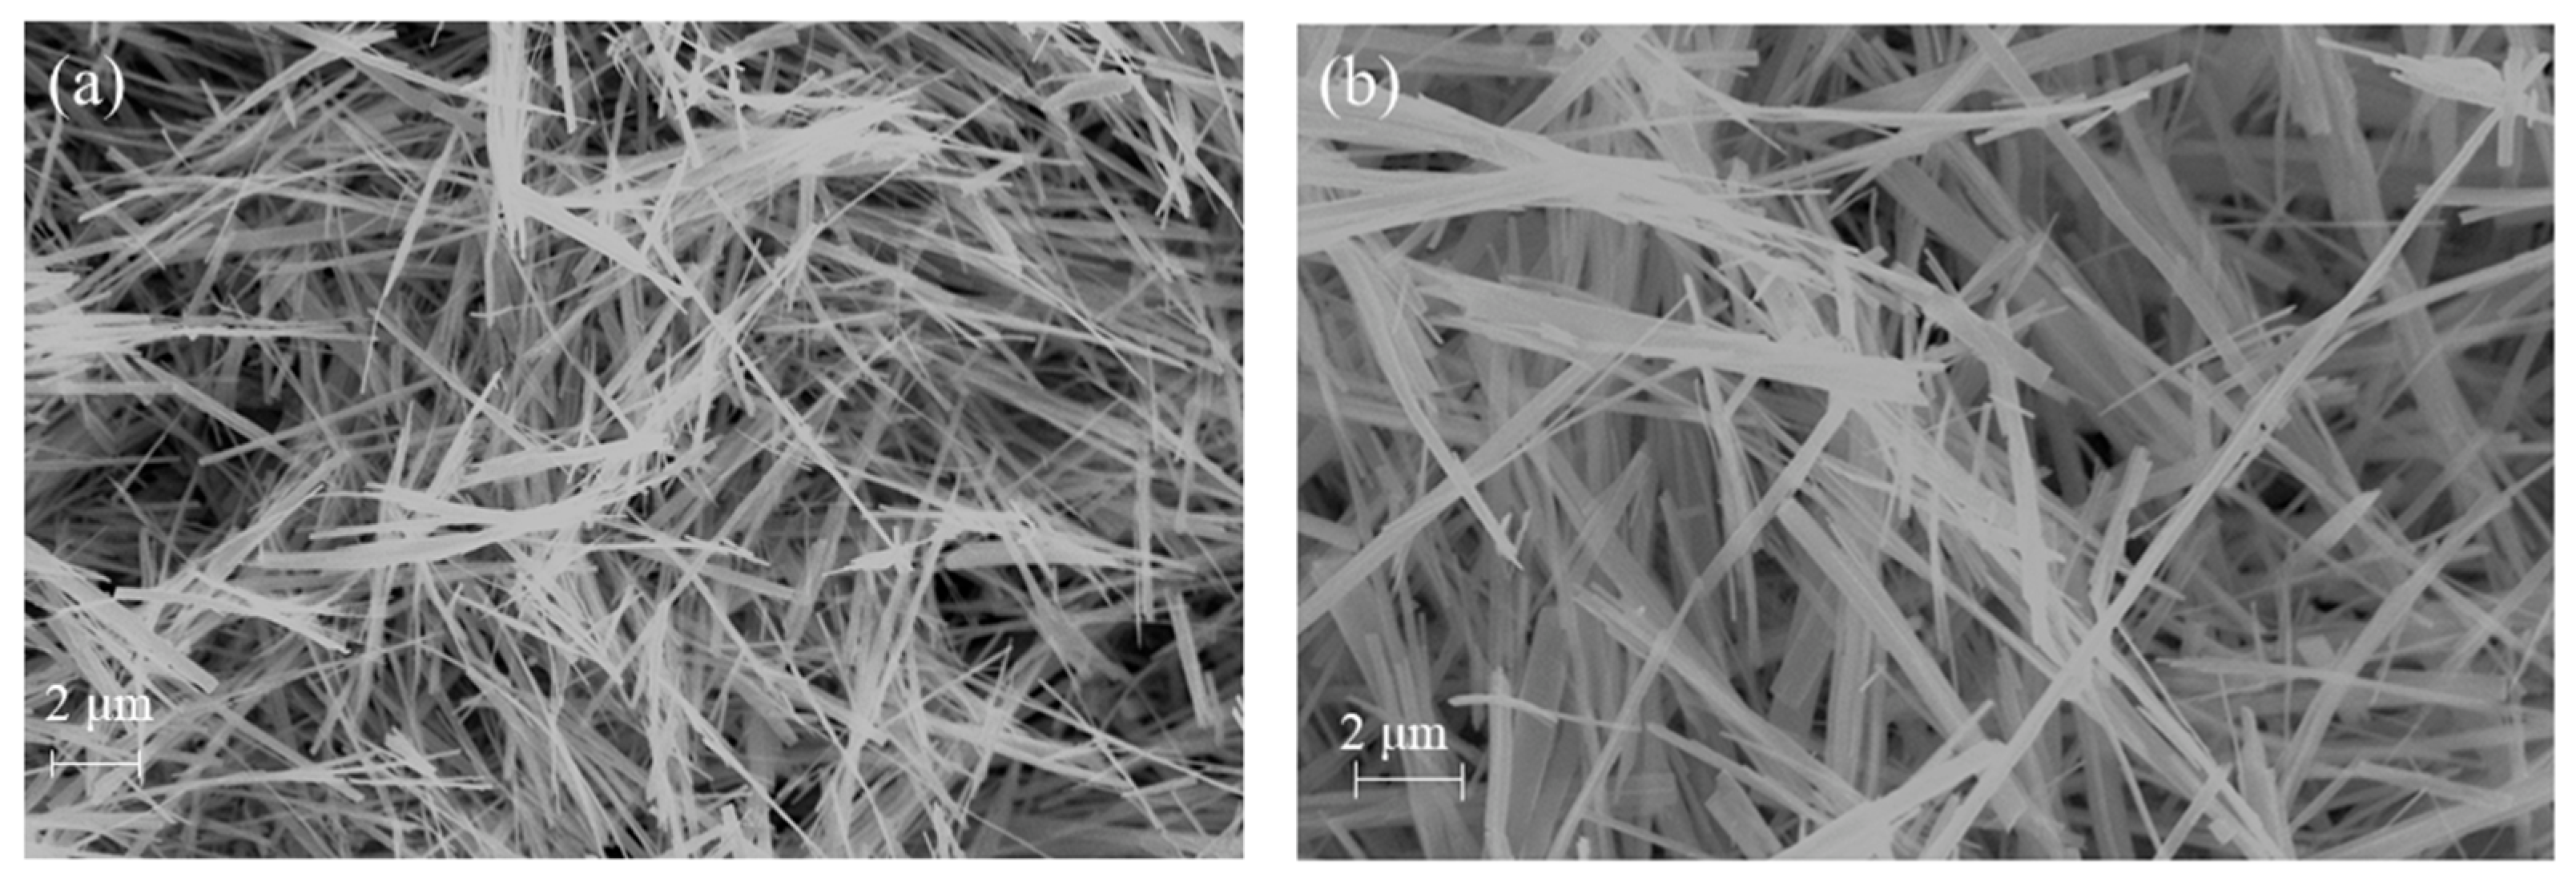
2.1. Growth of TiO2-B Nanobelts

The alkali-hydrothermal process was employed for the synthesis of TiO2 nanobelts. First, sodium titanate hydrated (Na2Ti3O7.mH2O) was synthesized using the hydrothermal method. A quantity of 1 g of titanium dioxide (TiO2, powder, 21 nm primary particle size, ≥99.5%, Aldrich) was mixed with 70 mL of 10.0 mol dm3 sodium hydroxide (NaOH, 98%, Loba Chemie, Mumbai, India) aqueous solution and mechanically stirred for 30 min, followed by 15 min of ultrasonication. The stirring and sonication processes were repeated six times following each other. Later, the obtained suspension was transferred into a 100 mL Teflon-lined stainless-steel autoclave and thermally treated for 48 h at five different temperatures: 120 °C, 135 °C, 150 °C, 175 °C, and 200 °C. After that, the material was cooled down to room temperature. The resultant white slurry (Na2Ti3O7) was washed thoroughly with deionized water, followed by a filtration process until the pH of the washing solution reached the value of 7. Subsequently, the wet slurry was immersed in 1 mol L3 acetic acid (99.5%, DAEJUNG, Sihung, Republic of Korea) aqueous solution for 24 h to prepare the protonated titanate form (H2Ti3O7). The prepared H2Ti3O7 was washed thoroughly with distilled water and underwent filtration until the washing solution became pH neutral. Later, the obtained H2Ti3O7 was dried at 80 °C for 24 h, and then calcinated at 500 °C for 3 h.
The basic chemical routing of the TiO2 nanobelt growth can be written as follows [40]:
The reaction starts with the dissolving of TiO2, in the presence of NaOH, as
3TiO2 + 2NaOH → Na2Ti3O7 + H2O
During the CH3COOH washing, the Na2Ti3O7 nanobelt is known to convert as follows due to the ion exchange:
Na2Ti3O7 + 2CH3COOH → H2Ti3O7 + 2CH3COONa+
In the calcination process, H2Ti3O7 will convert to TiO2 as follows:
H2Ti3O7 → 3TiO2 + H2O

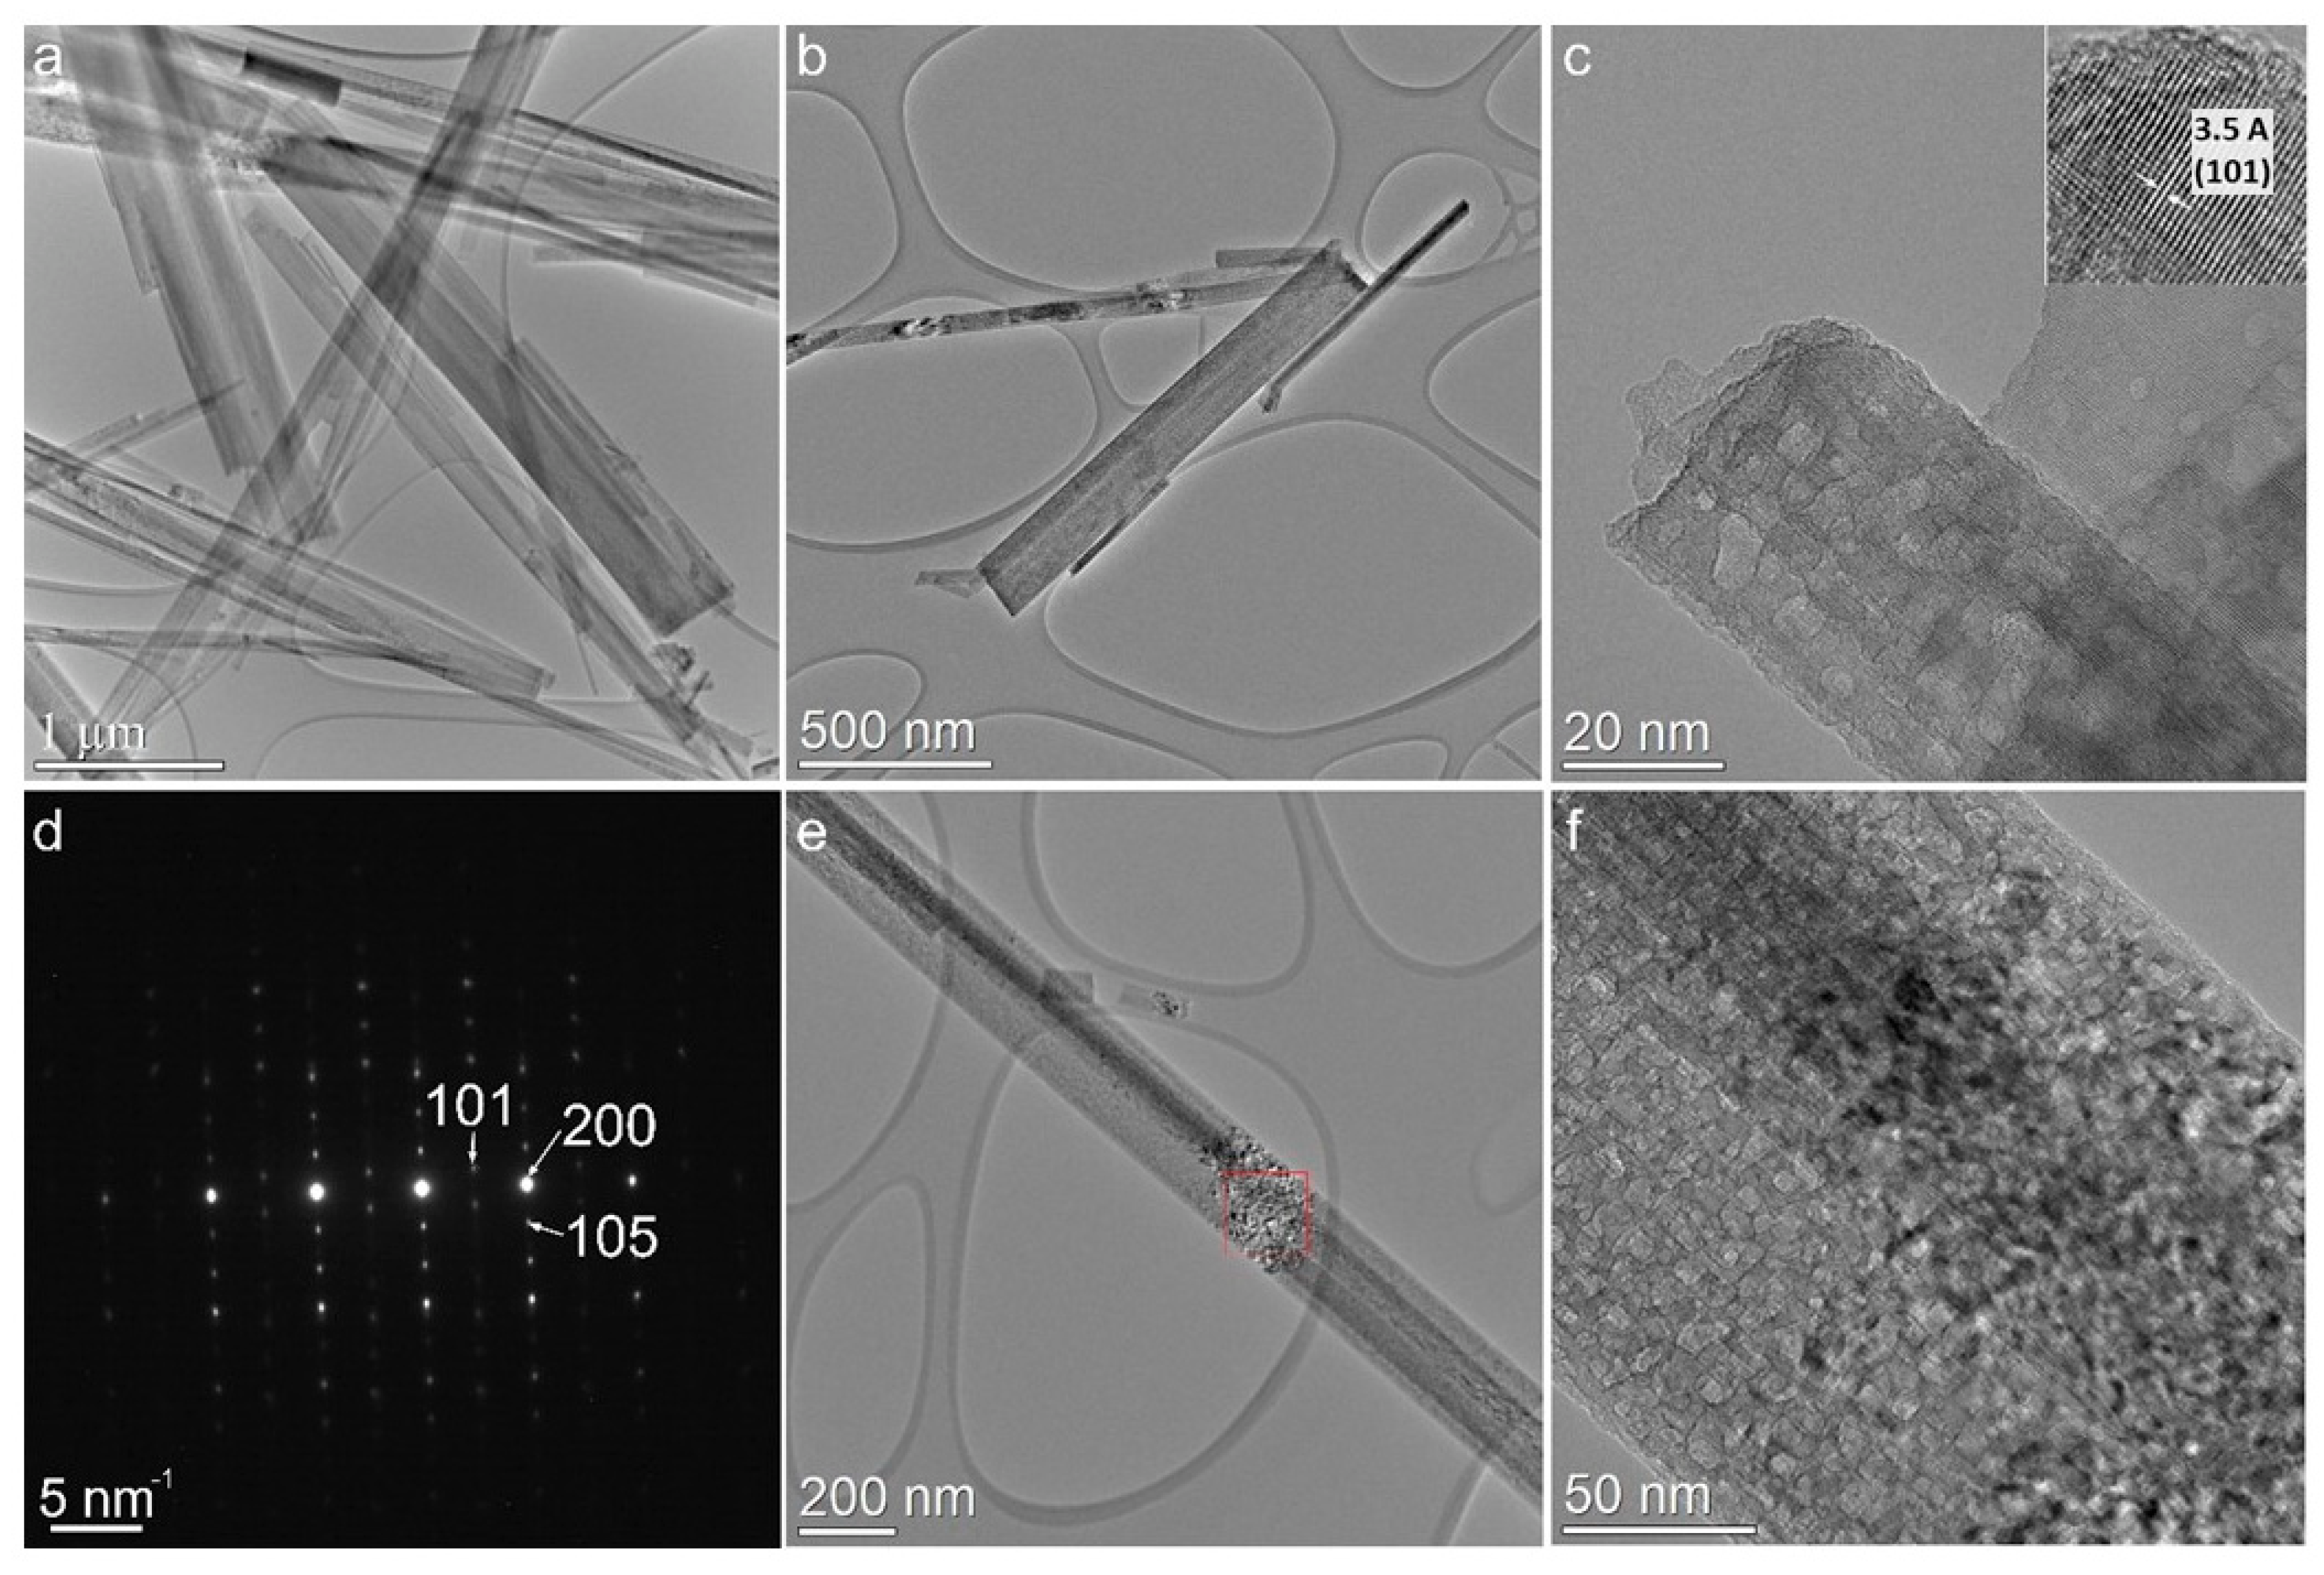
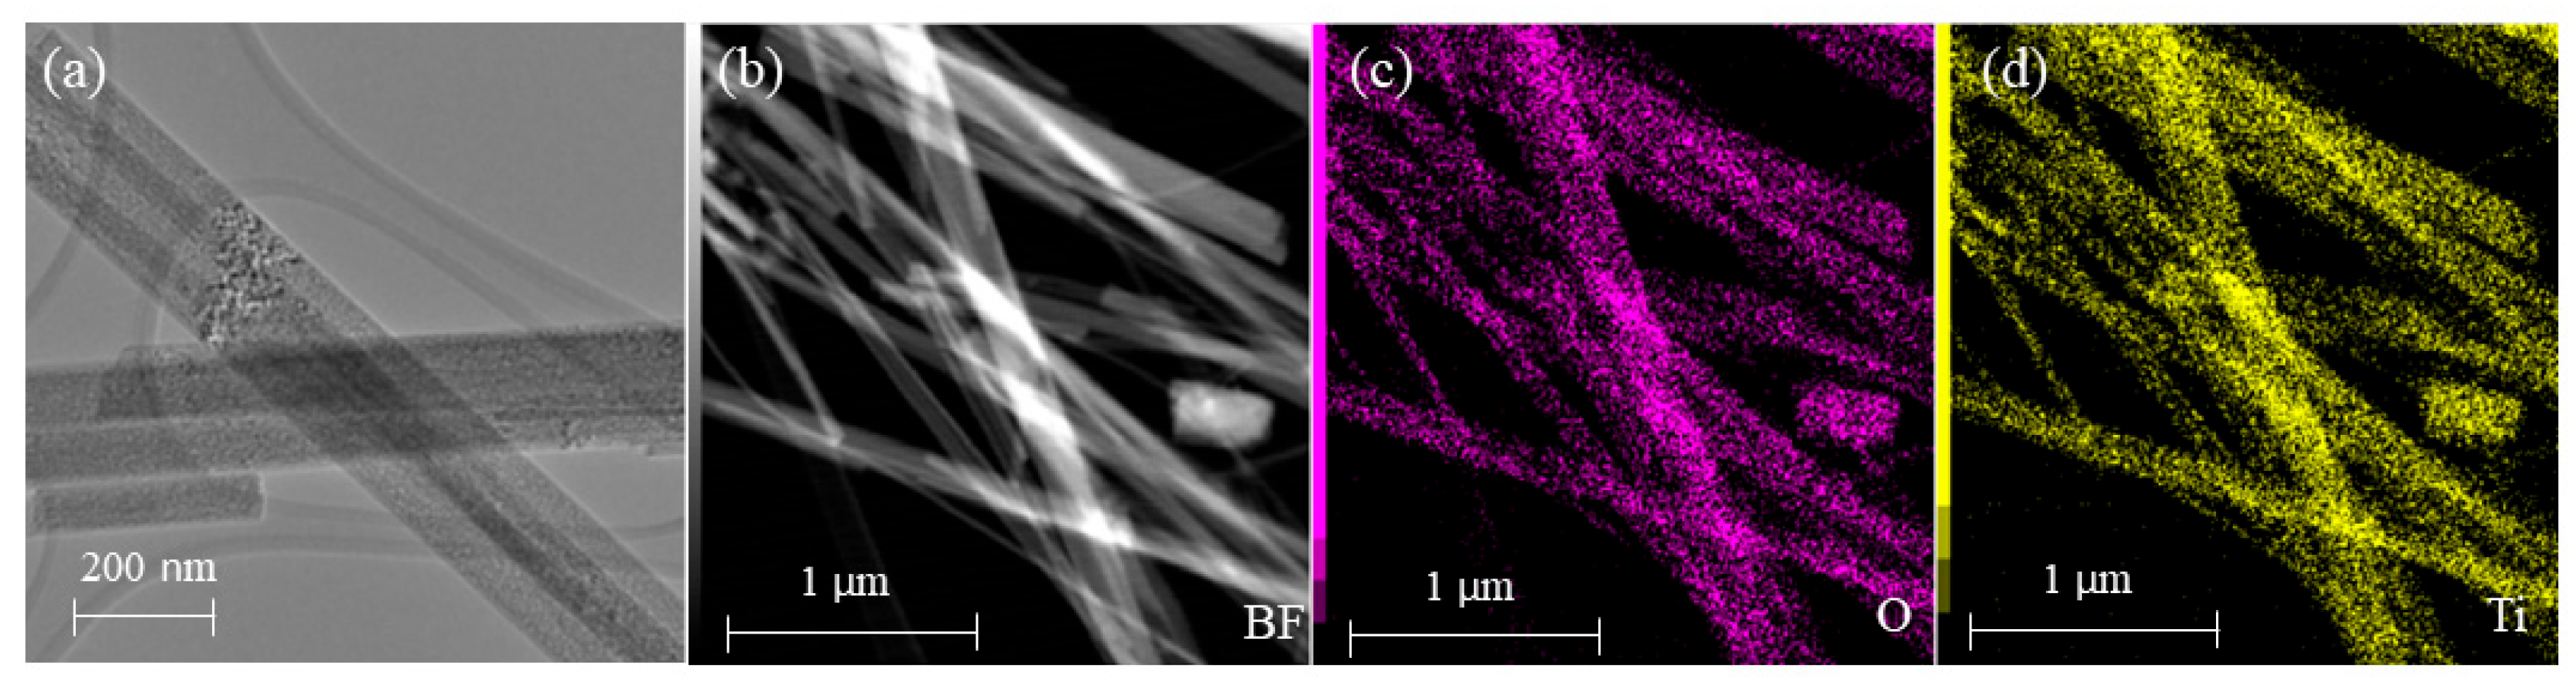
2.2. Characterization

The morphological investigations were carried out using a field-emission scanning electron microscope (FE-SEM) TESCAN (Brno, Czech Republic) (MIRA-3) at a voltage of 5 kV. Further, the obtained nanostructures were investigated by means of a JEOL JEM ARM 200F analytical transmission electron microscope (TEM) operated at 200 kV, equipped with an EDS detector to acquire Energy-Dispersive X-ray (EDS) spectra or maps for elemental investigation. X-ray diffraction spectroscopy (XRD) was performed in the range of 20–80 degrees using an Empyrean diffractometer (PANalytical, Almelo, The Netherlands) equipped with a Cu-kα1 (λ = 1.5406 Å) tube operating at 40 kV to 40 mA. Raman spectra were measured using a fiber-coupled confocal optical microscope (HORIBA, XploRA Nano) at 100× magnification. The spectra were recorded in the wavelength range of 200–1200 cm−1 using a red laser source (638 nm).

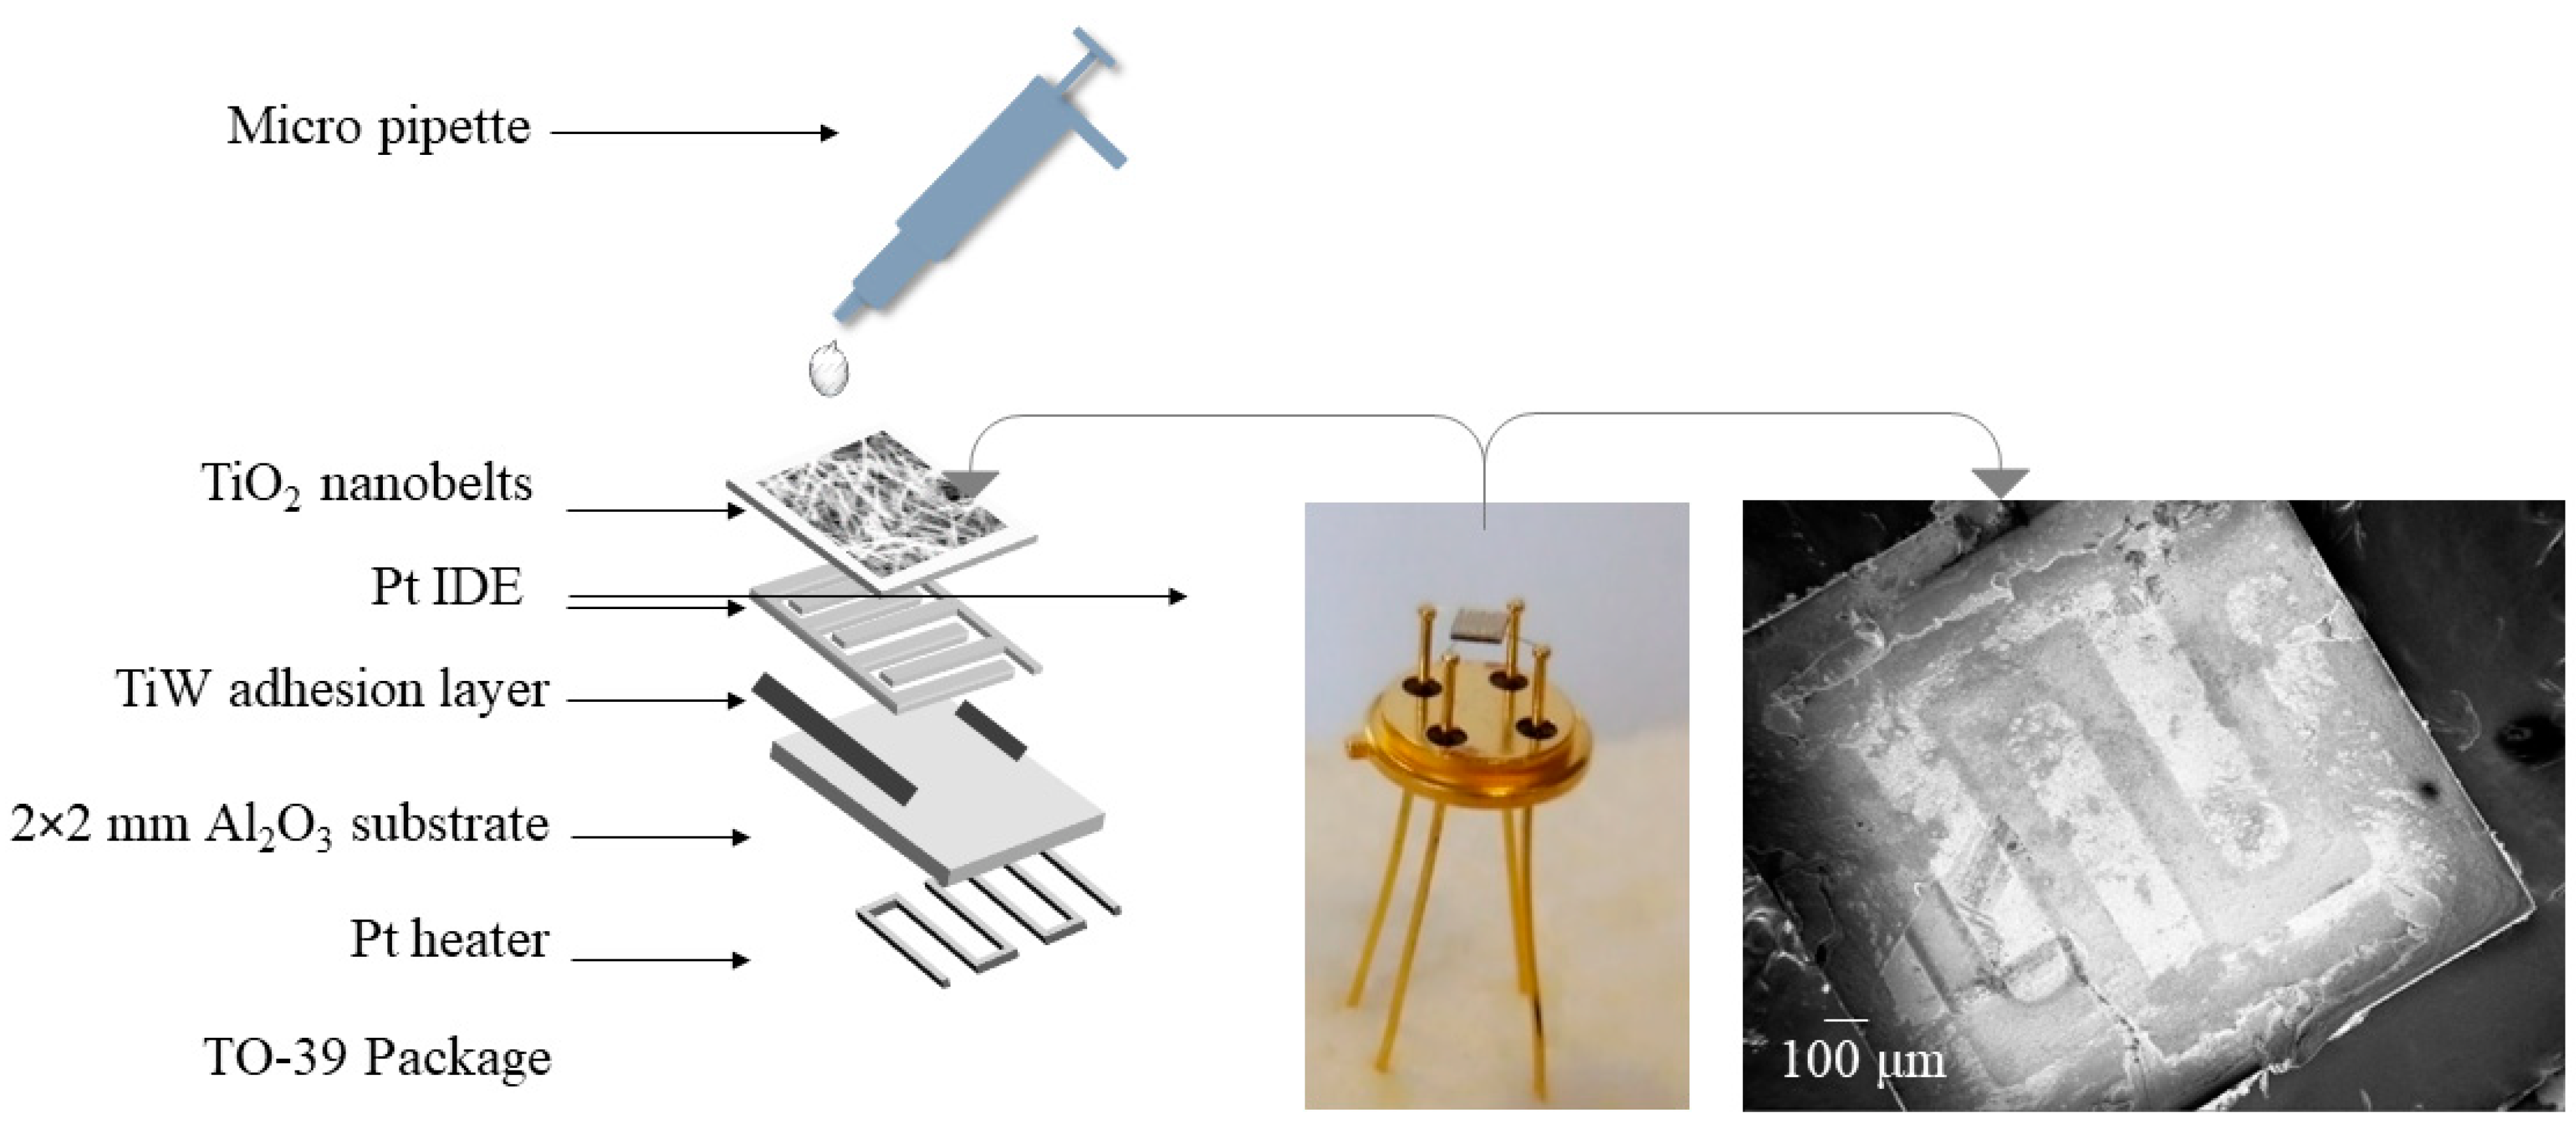
2.3. Fabrication of Sensors

The drop-casting method was used to fabricate the conductometric sensing devices and several sensors were fabricated by varying the number of droplets, as shown in Table 1. The process can be explained in brief as follows: Alumina substrates (2 mm × 2 mm, Kyocera, Kanazawa, Japan, 99.9%) were ultrasonically cleaned for 20 min in an acetone bath, followed by drying with synthetic air. Next, TiW (10/90 wt.%) adhesion layer (~90 nm) was sputtered on top of the alumina substrates via DC magnetron sputtering at 75 W argon plasma, 7 (standard cubic centimeters per minute) argon flow, 5.0 mTorr pressure, and 300 °C. Then, Pt interdigitated electrodes (IDE, 1 μm) were deposited on the adhesion layer using the same DC magnetron sputtering conditions [41]. Additionally, a platinum heater was fabricated on the opponent side of the alumina substrates to investigate the performance of the sensor at different operating temperatures (100–500 °C). Meanwhile, the Al2O3 substrates with IDE and heater were soldered to the TO-39 package with gold wires.
Later, the dispersed TiO2 nanobelts (5 mg) in absolute ethanol (5 mL) were drop-casted on the top of the soldered device at room temperature. Figure 2 shows the schematic of the prepared sensors.

2.4. Gas Testing Measurements

All the fabricated sensors were thermally stabilized at 400 °C for 48 h before mounting into a gas-testing chamber. The conductometric response of the fabricated sensors was tested in a stainless-steel gas chamber having a volume of 1 L, which was mounted inside a climatic chamber (Angelantoni, Perugia, Italy, model MTC 120). The temperature was set to 20 °C inside the climatic chamber, and 40% of relative humidity (RH) was maintained inside the gas chamber. To create humid air, dry air flowed through a Drechsel bottle operating at a water bath of 25 °C. Subsequently, the sensors were mounted in the gas chamber to investigate their response toward H2, C2H5OH, C3H6O, NO2, and CH4 with a fixed voltage of 1 V. The gas-sensing dynamic was recorded for the period of 140 min for each concentration (30 min injection followed by 45 min recovery). The response of sensors is defined as ∆G/G (S) = (Gg − Ga)/Ga or (Ga − Gg)/Gg for reducing and oxidizing gases, respectively, where Ga is the conductance of the sensor in synthetic air while Gg is the conductance of the sensor in the presence of analyte gas. The gas-sensing measurements were carried out at a gas flow rate of 200 sccm.

3. Results

To study the formation and crystal structure of the prepared TiO2, X-ray diffraction (XRD) analysis was employed. Figure 3a clearly shows the formation of intermediate H2Ti3O7 and residual sodium titanate (JCPDS 41-0192, JCPDS 98-008-2059). However, these H2Ti3O7 and residual sodium titanate have been completely demolished upon washing and annealing (Figure 3b). Further, H2Ti3O7 is the most important intermediate state, which results in the formation of nanobelt-like morphology in the final product ascribed to the dissolution–recrystallization process [42]. After OH ions in the NaOH solution have gradually diffused into the initial 3D anatase TiO2, the Ti–O–Ti bonds are dissolved, leading to the exfoliation of single-layered sheets (nanosheets) composed of TiO6 octahedra. This dissolution is the main root for the presence of characteristic stretching vibrational peaks in the Raman spectrum at 280 cm1 (Ti–O–Na), 372 cm1 (Ti–O–Ti), and 670.8 cm1 (TiO6) [38,39], as shown in Figure 3c.
Meanwhile, Na+ ions intercalate in the interlayer space between TiO6 sheets to neutralize the negative charge of the formed TiO6 sheets, as shown in Figure 4a. This step controls the Na/Ti ratio of the final titanate product and forms intermediate sodium titanate (Na2Ti3O7), as described in Equation (1) [28]. However, such dissolution and exfoliation processes are relatively easier for small anatase precursors yielding titanate sheet units. These sodium titanate sheets copy the epitaxial crystal growth along the c-axis, resulting in titanate sheet units growing into a sheet-like structure (Figure 5a) [43]. Next, Na2Ti3O7 nanosheets are transformed into H2Ti3O7 nanobelts when the ion-exchange process is employed (Equation (2) and Figure 4b). Accordingly, the formation of nanobelt-like structure is ascribed to the splitting of nanosheets to release the excess strong stress upon the replacement of Na+ by larger H3O+ cations when forming H2Ti3O7 [44]. Finally, TiO2-B nanobelts are obtained by annealing the H2Ti3O7 at 500 °C, as presented in Equation (3) and Figure 4c.
The diffraction peaks in Figure 3b at the two-theta values of 24.98°, 28.59°, 29.79°, 33.41°, 39.47°, 43.48°, 44.61°, 48.66°, 52.89°, 58.47°, 62.38°, 67.27°, and 76.69° are, respectively, assigned to the reflections of the (110), (002), (40-1), (31-1), (31-2), (003), (60-2), (020), (113), (71-1), (31--), (02-3), and (712) planes of the monoclinic phase (JCPDs: 98-004-7691, space group C12/m1) TiO2-B.
Figure S1a–f show FE-SEM images of the intermediate H2Ti3O7 structures, which were synthesized by dissolving anatase TiO2 powder (particle diameter 20–25 nm, P21, Figure S1a) with NaOH solution under hydrothermal conditions and using the ion-exchange process with acetic acid. Figure S1b shows that the hydrothermal treatment at 120 °C results in the transformation of anatase particles into a compact and thick flake-like morphology. Further, at 135 °C, anatase particles were transferred into large aggregated particles (Figure S1c). At 150 °C, these P21 particles aggregated and formed a compact film-like morphology (Figure S1d). However, P21 particles were completely transformed into belt-like shapes (Figure S1e–f) when the hydrothermal treatment was employed at 175 °C and 200 °C. Furthermore, the obtained nanobelts at 200 °C showed a compact and low aspect ratio. Accordingly, further investigation was carried out on the sample that was thermally treated at 200 °C.
The conventional TEM (CTEM) image in Figure 6a shows a one-dimensional nanobelt structure in the obtained intermediate H2Ti3O7 to a very long extent in the range of ten micrometers. Figure 6b shows a CTEM image of TiO2 nanobelts, which were annealed at 500 °C. The HRTEM image (Figure 6c), with its insert clearly showing (101) planes that are characteristic of anatase structure, demonstrates that the nanobelts are well crystallized. Figure 6d shows the selected-area electron diffraction (SAED) of such a nanobelt, which confirms the presence of (101), (200), and (105) crystallographic planes of TiO2-(B) (CIF number 9009086) corresponding to the lattice parameters a = b = 3.785 Å, c = 9.514 Å, and α = β = γ = 90°. Also, Figure 6d clearly shows the formation of nanobelts in the direction of the c-axis. Furthermore, Figure 6e,f show the presence of a “porous-like” morphology in some regions of the prepared TiO2-(B) due to the large density of structural defects in specific areas along the nanobelts.
Energy-Dispersive X-ray (EDS) spectra on the TEM grid were carried out to study the elemental distributions on the surface of TiO2-(B) nanobelts. The EDS maps (Figure 7a–c) indicate the presence of constituent elements (Ti and O) on the surface of TiO2-(B) nanobelts. Remarkably, Figure 7a–d also show some overlapping nanobelts, which can significantly enhance the response of the sensor when employed in gas sensing [45].

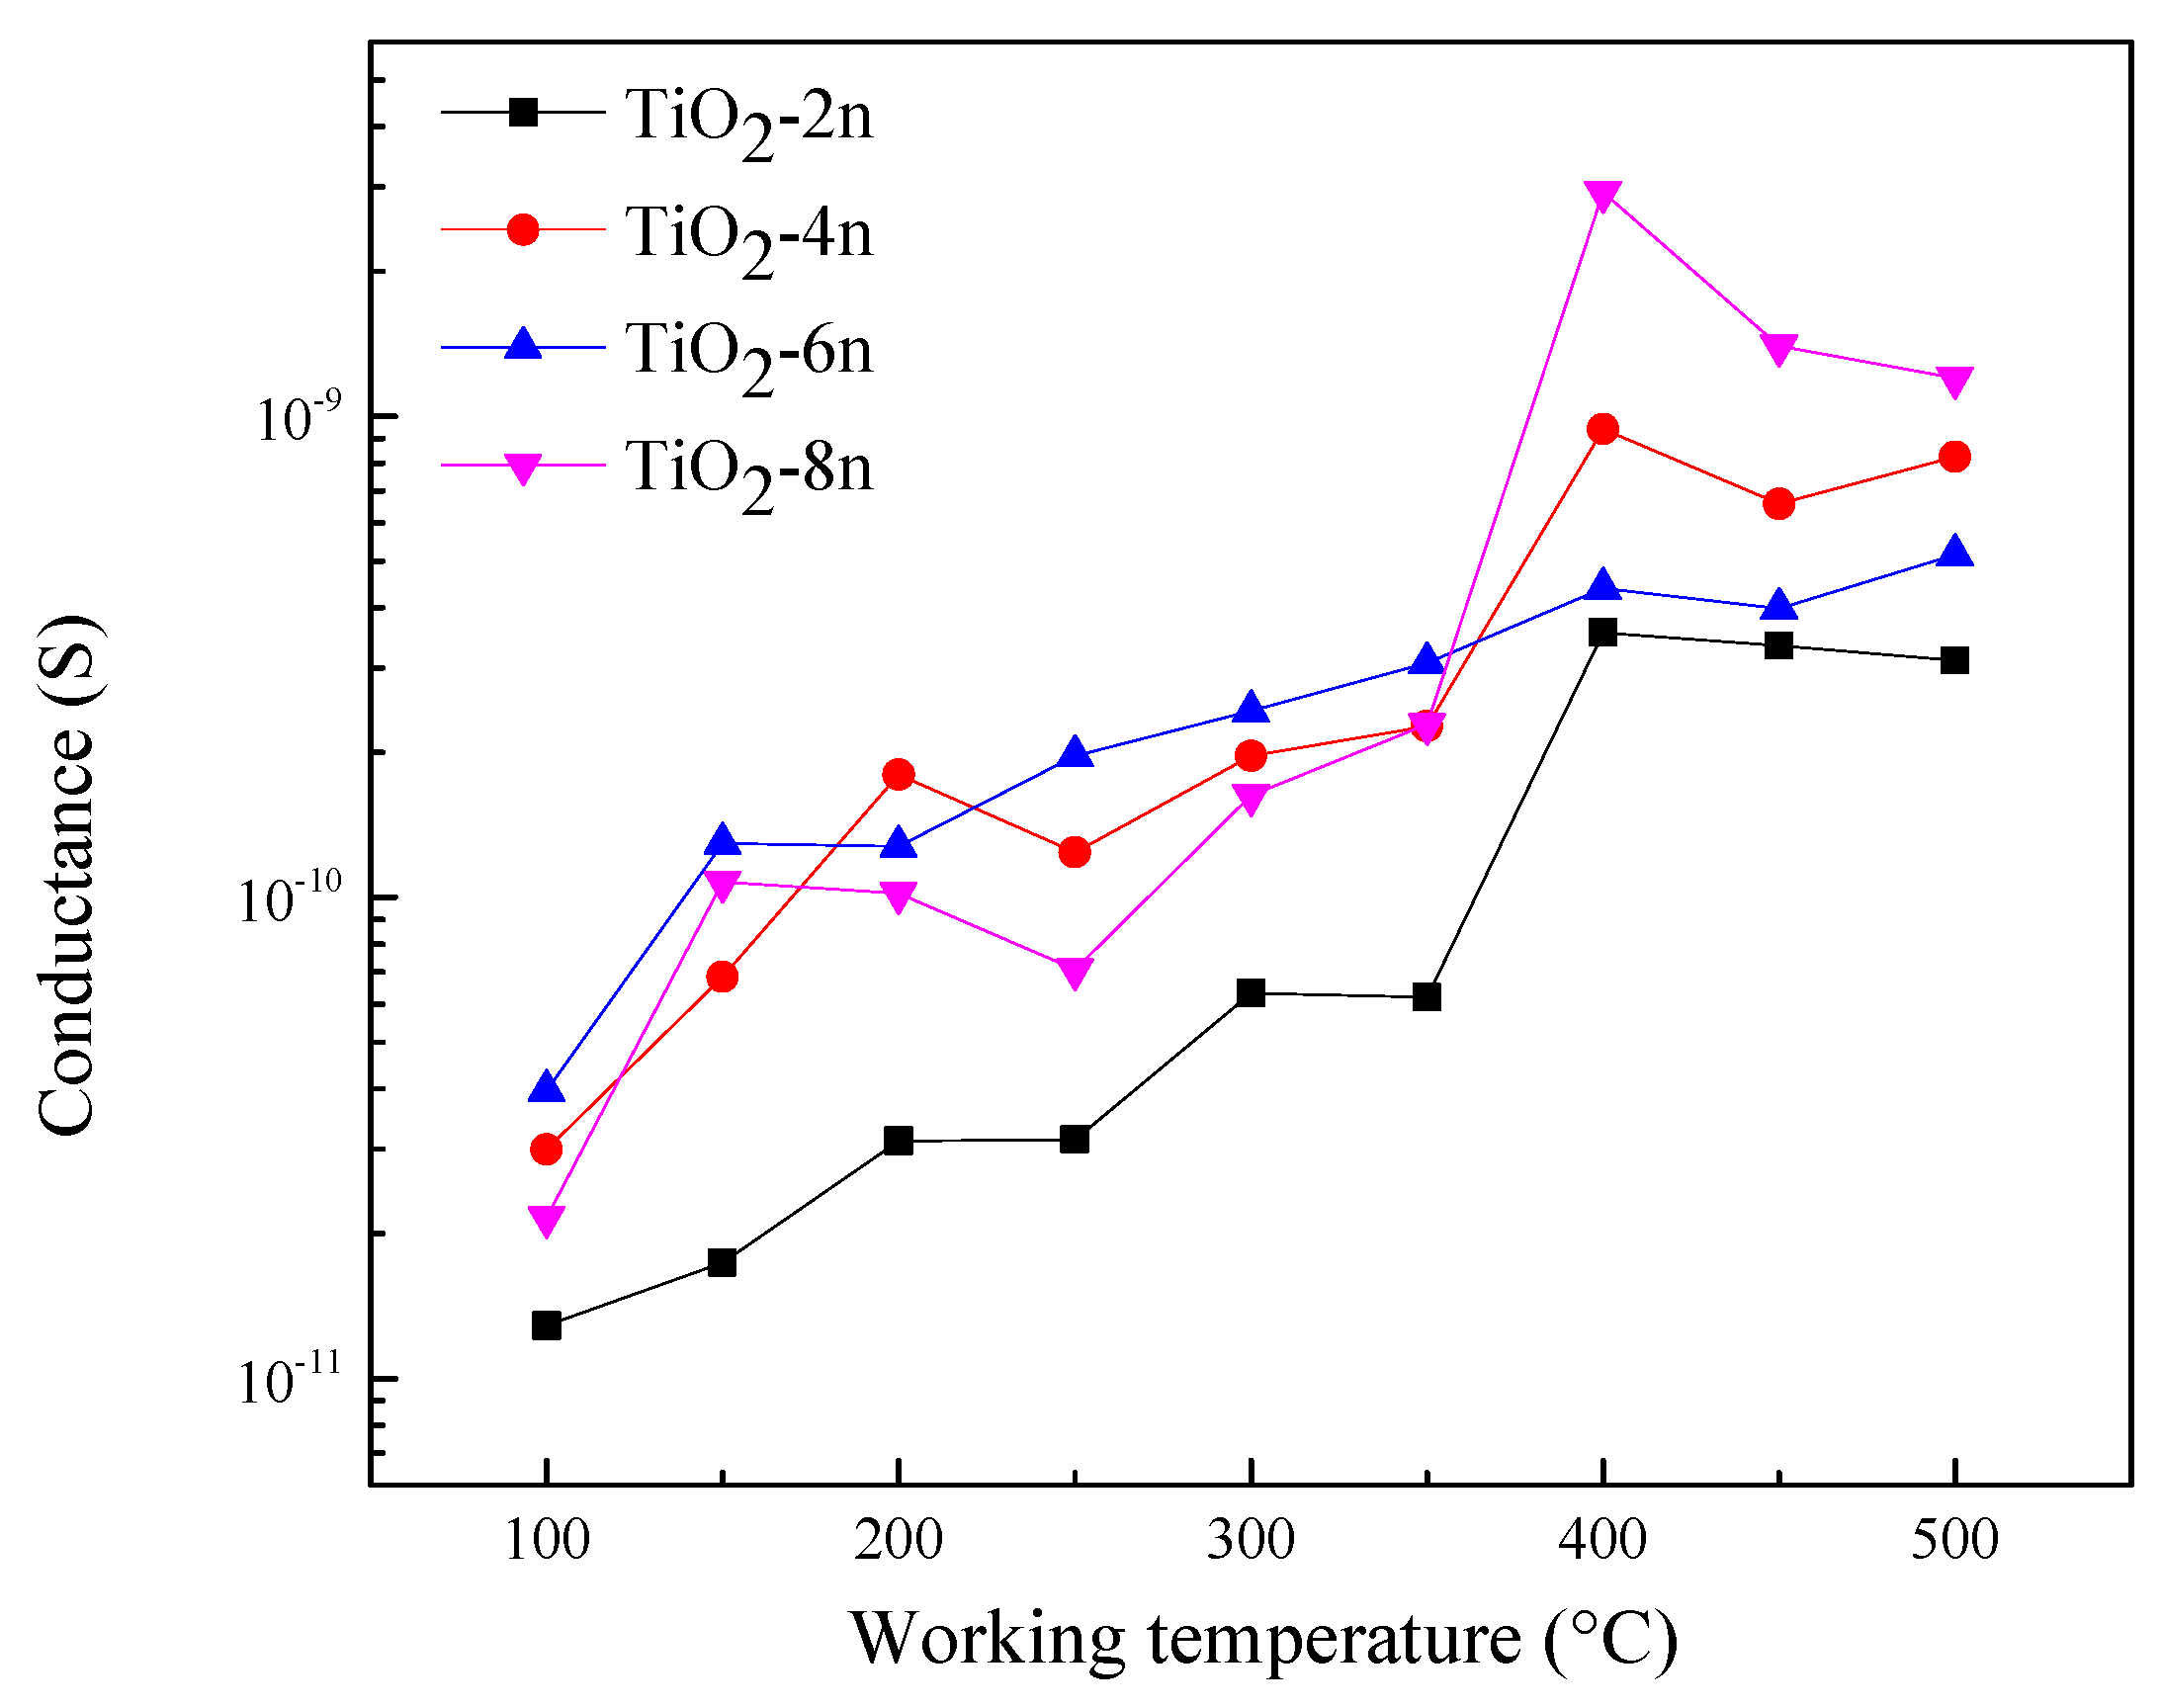
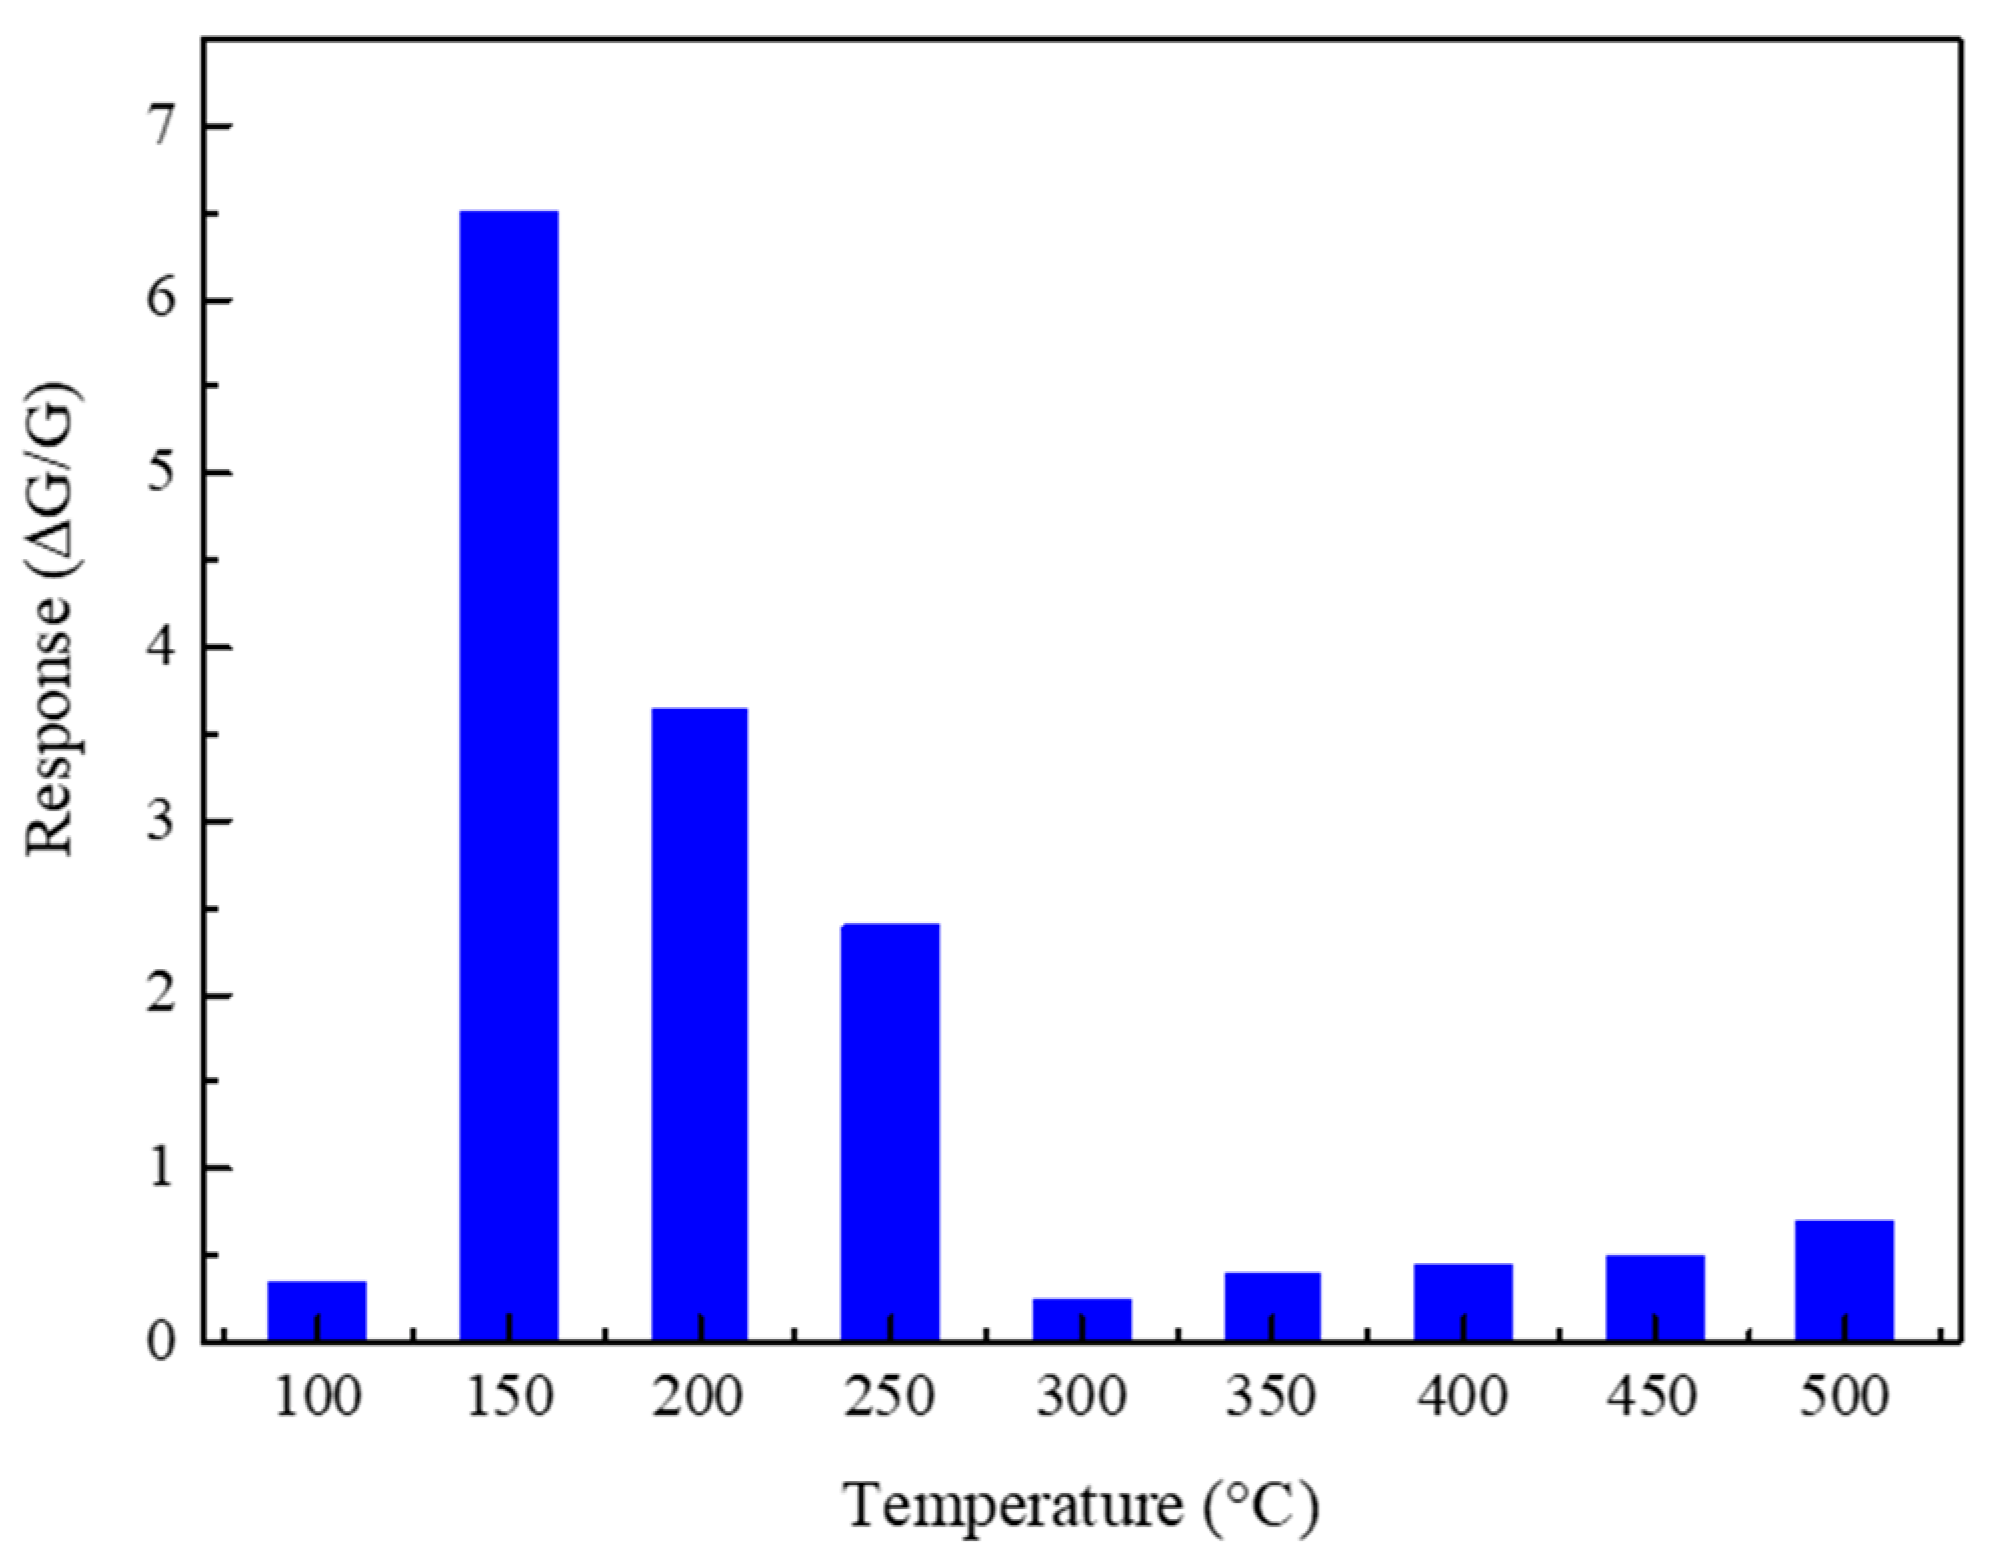
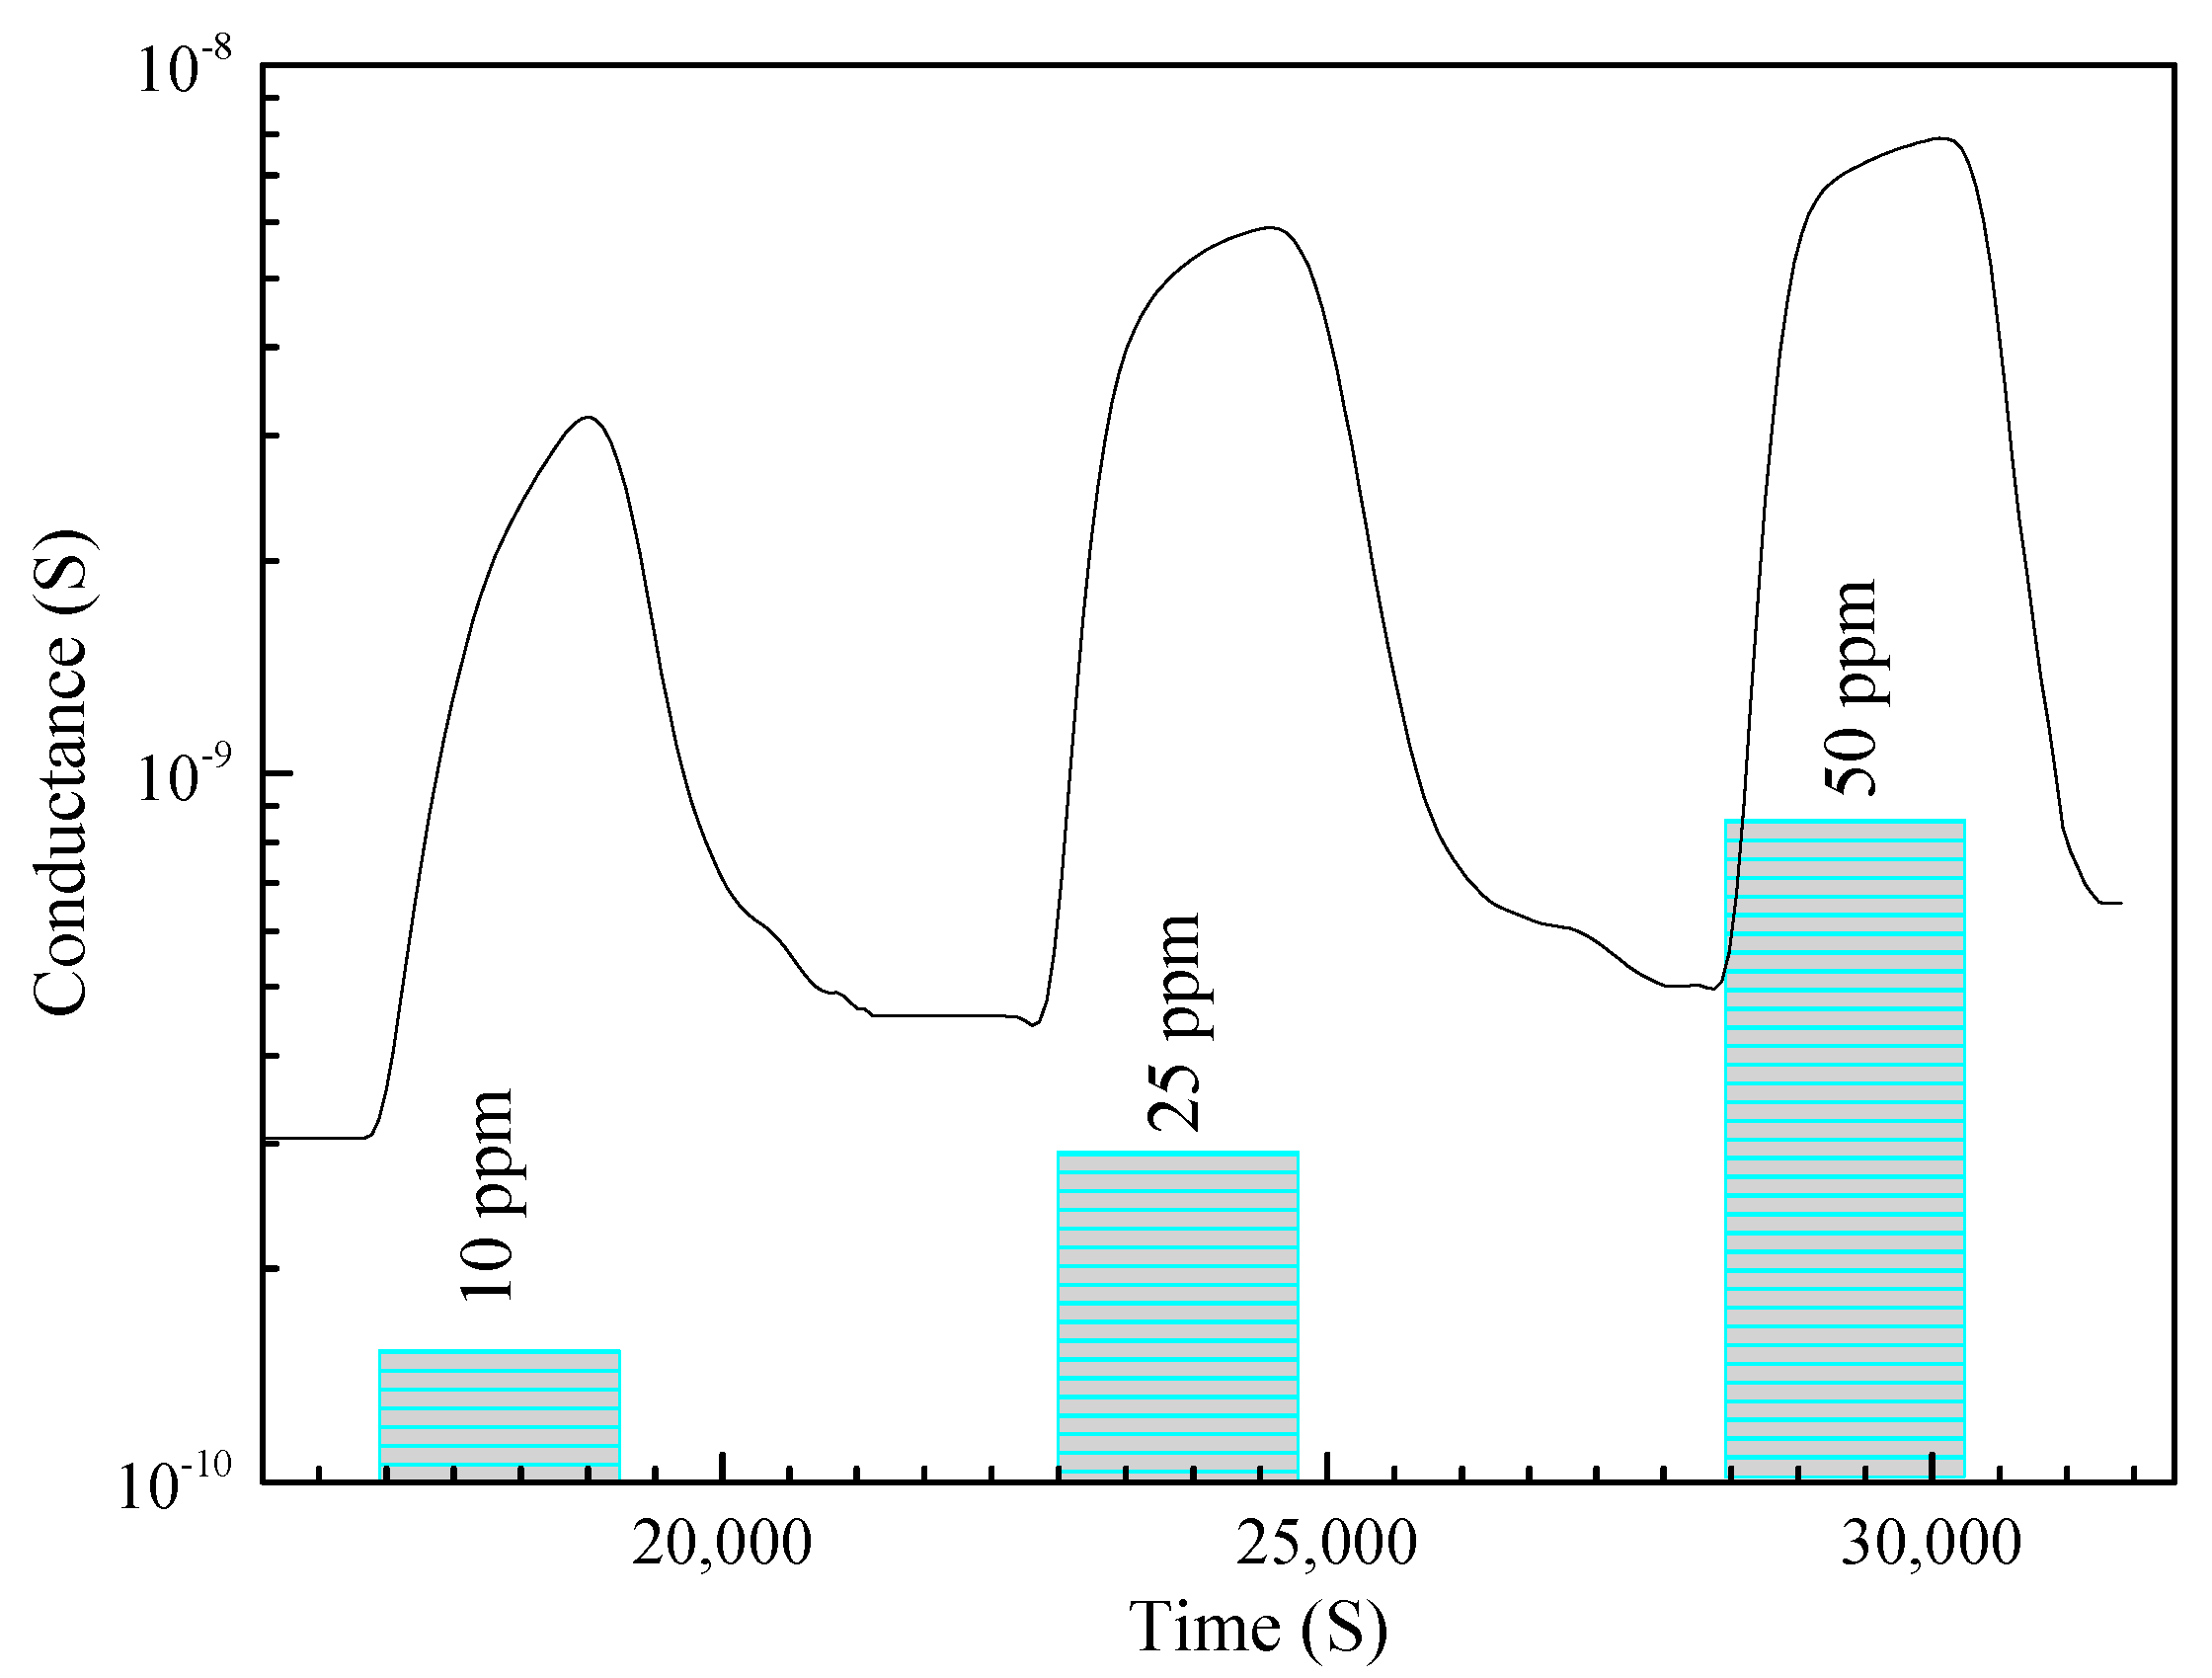
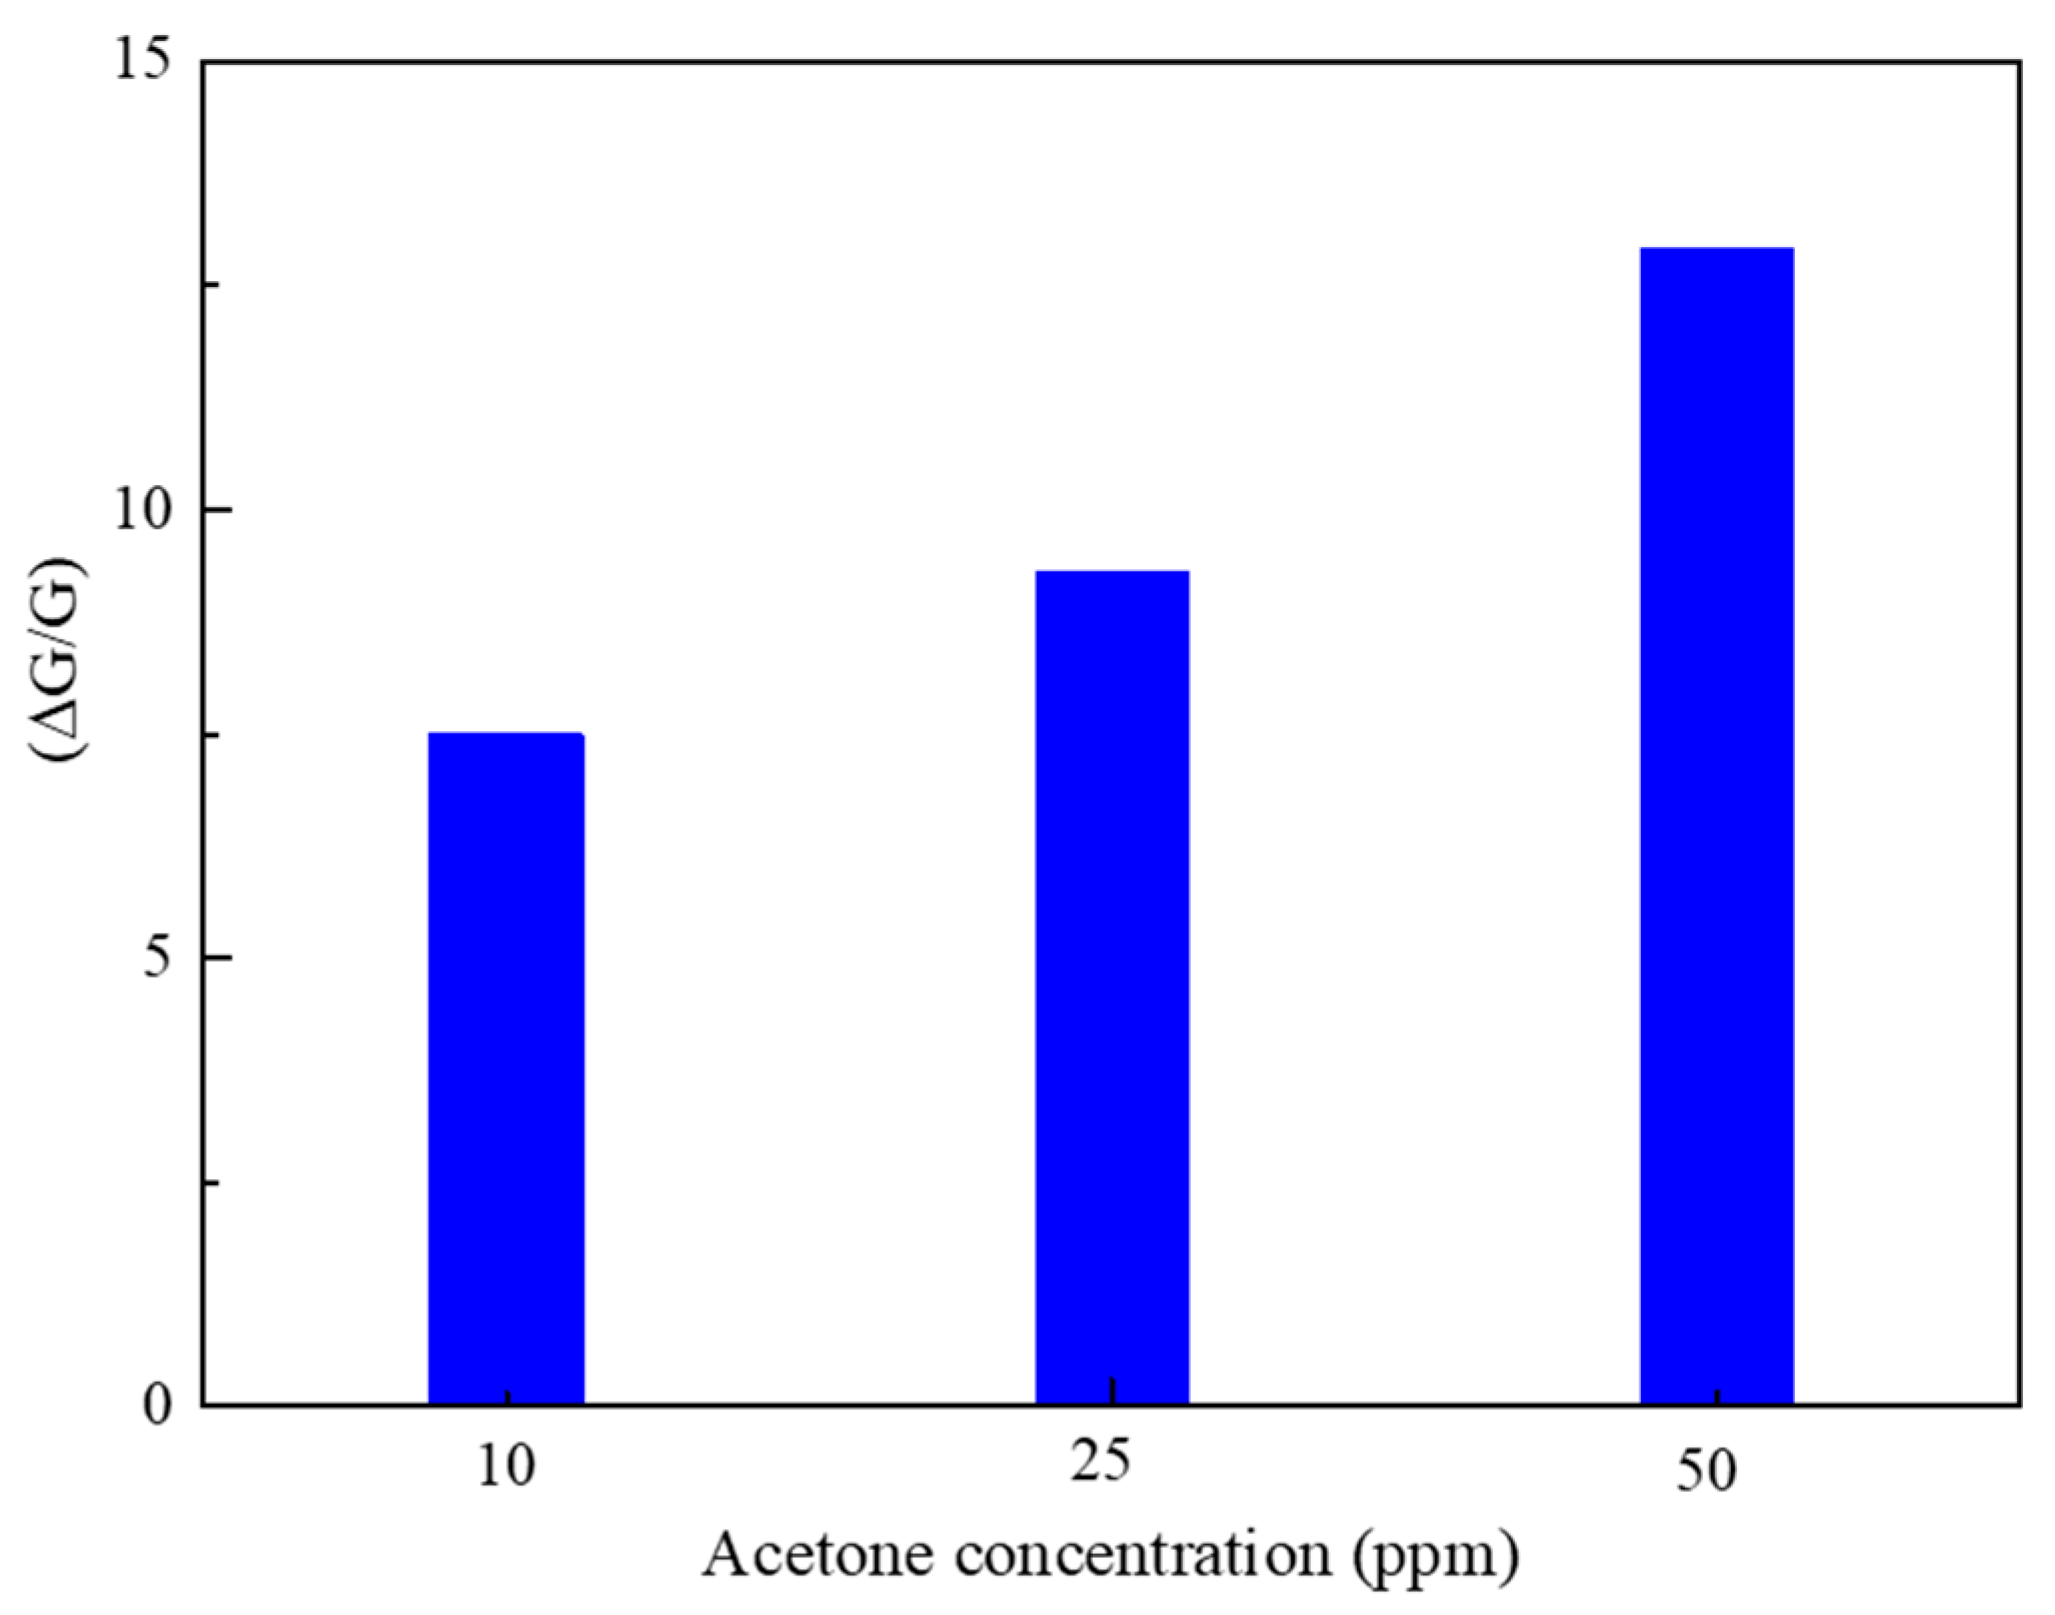
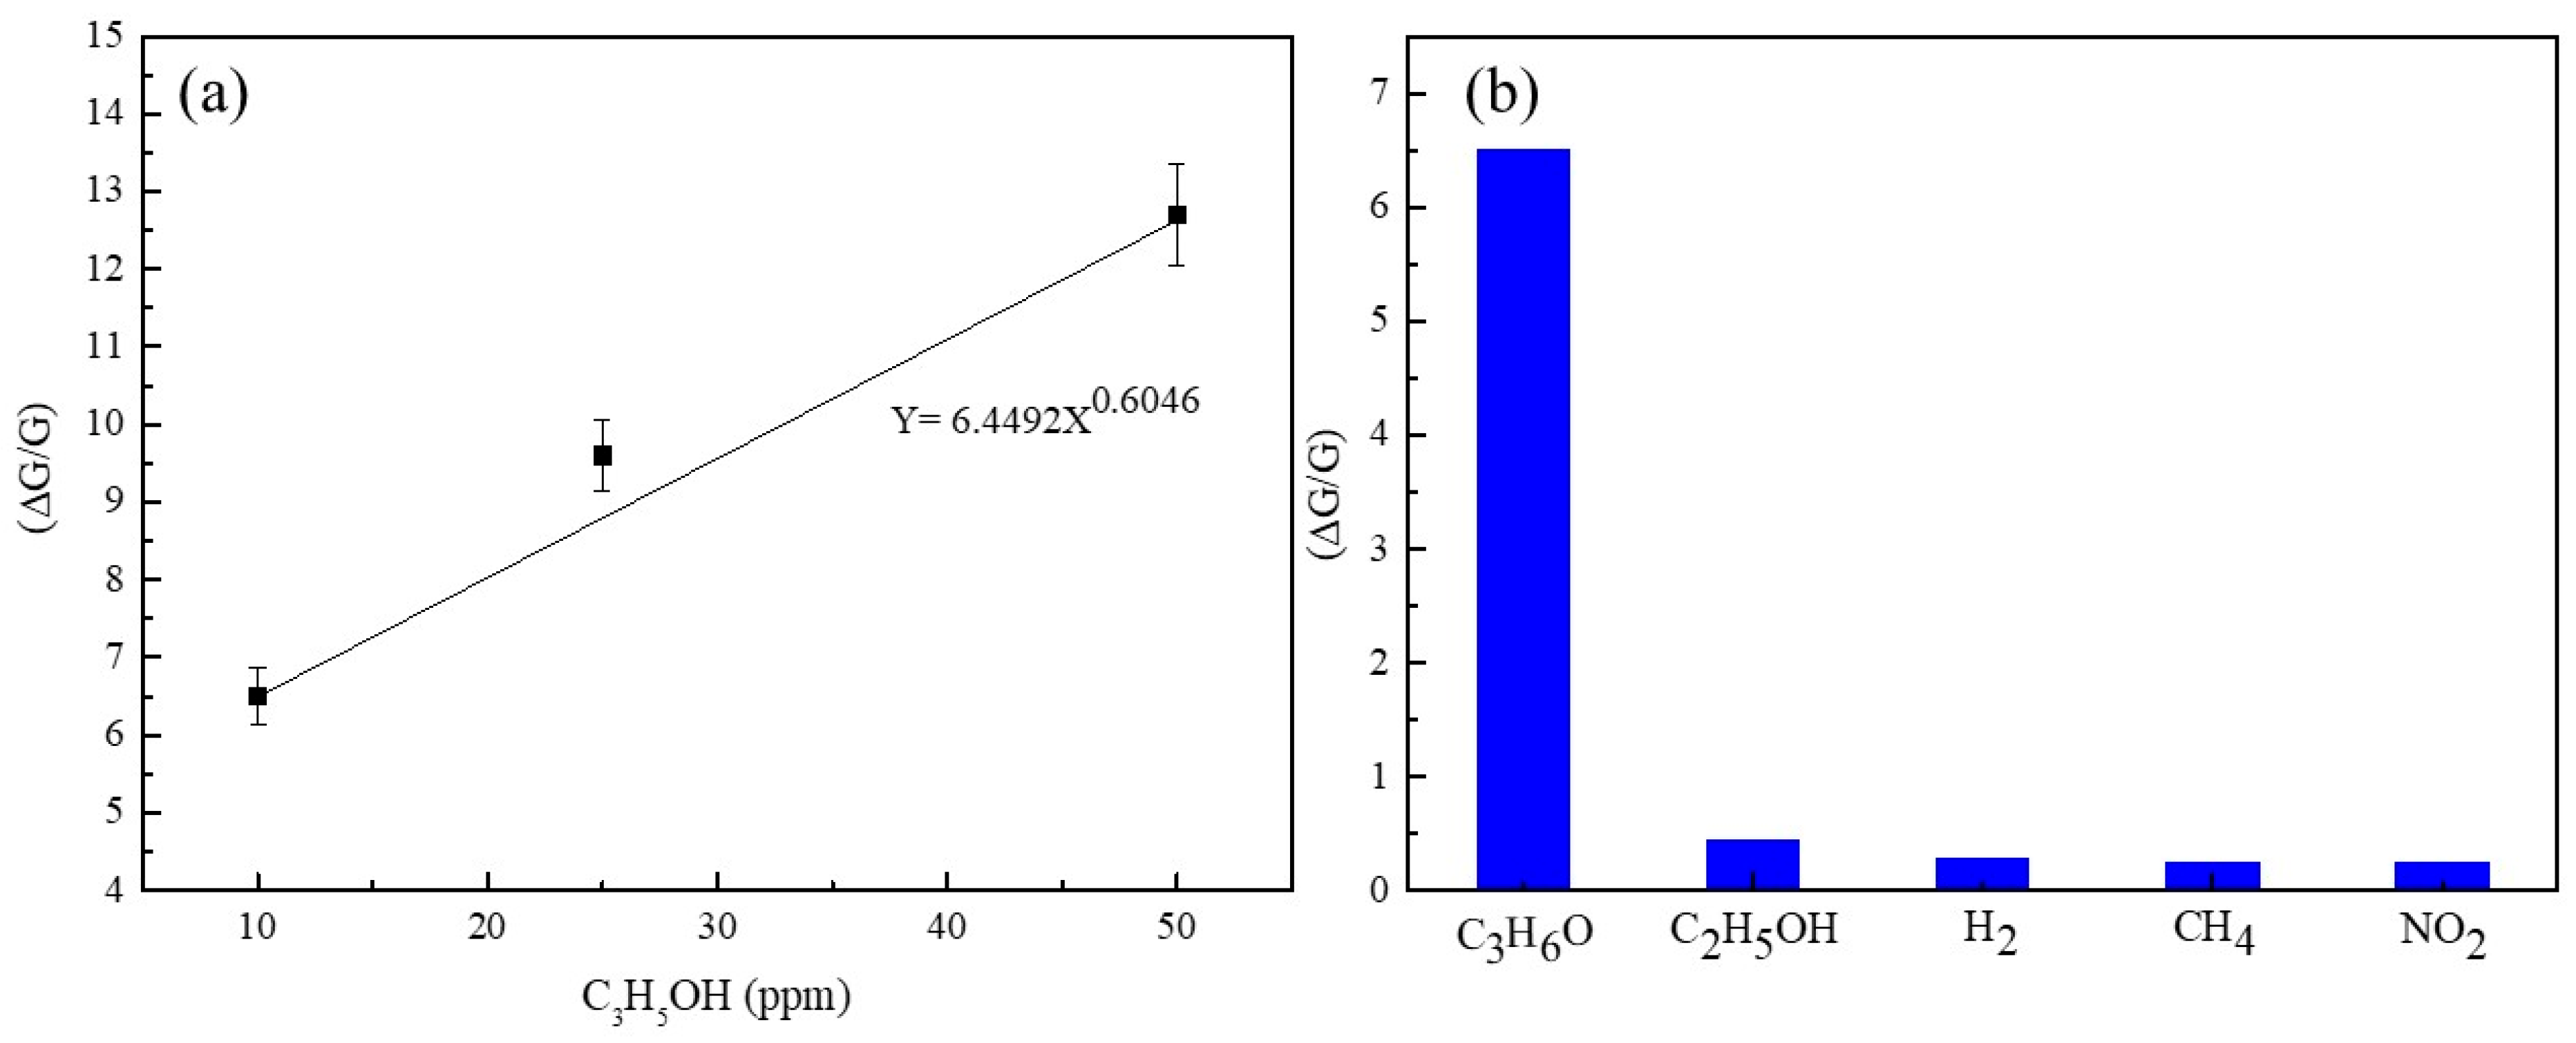
Gas-Sensing Performance

Figure 8 shows the conductance-temperature behavior of the fabricated TiO2-(B) sensors. The conductance was found to increase with increasing operating temperature of the sensors, which is ascribed to the semiconducting characteristics of the prepared TiO2-(B) material. However, the sensors fabricated with eight drops (TiO2-8n) show the highest conductivity at the operating temperature of 400 °C.
Preliminary gas-sensing studies were carried out at different working temperatures. The highest conductivity was observed at 400 °C. Interestingly, the sensors (TiO2-8n) demonstrated the highest response toward acetone compared to other TiO2 sensors. Therefore, we further analyzed the sensing properties of the TiO2-8n sensor.
We investigated the gas-sensing properties of TiO2-8n devices toward hydrogen (H2), methane (CH4), nitrogen dioxide (NO2), ethanol (C2H5OH), and acetone (C3H6O) at the temperature range of 100–500 °C (step, 50 °C). The electrical conductance of the sensors increases to a maximum value once reducing gases are injected and returns to their initial value when the gas flow is not present in the chamber. This is a typical n-type semiconducting behavior, which is in agreement with the results reported in the literature [46,47]. Usually, working temperature affects the gas interaction with the sensor up to a certain catalytic temperature and then hinders the interaction, thereby modulating the response value. Therefore, metal oxide gas sensors have different response values depending on their working temperature. Thus, investigating the optimum working temperature is significantly important with respect to the performance of the sensors.
The response values of the TiO2-8n sensor toward 10 ppm of C3H6O at different working temperatures are shown in Figure 9. The sensor exhibited the highest response at the working temperature of 150 °C. Figure 10 shows the dynamic response plot of the TiO2-8n sensor to different concentrations of C3H6O at the operating temperature of 150 °C. TiO2-based gas sensors mostly operate at elevated working temperatures (>200 °C). So, the relatively low working temperature of the fabricated sensors can be due to the high catalytic property of TiO2-(B), which is also evidenced in the conductance variation of the sensors [48]. Also, porous regions in the nanobelts encourage the oxygen adsorption/desorption mechanism [44]. Accordingly, the porous-like region of the prepared nanobelts can potentially be one of the reasons for the high response at low working temperatures [49].
In general, the gas-sensing mechanism of TiO2-(B) nanobelts is acerbated by surface reactions and induced carrier charge transfer due to the adsorption of analyte gas molecules. Furthermore, the sensing mechanism is based on two main interactions known as oxygen adsorption and C3H6O interaction on the surface of TiO2 nanobelts. The sensing mechanism is related to the adsorption of oxygen onto the surface of TiO2-(B) nanobelts. Usually, the adsorption of oxygen molecules occurs on the exposed surface of the MOX surface [50]. Consequently, electron transfers from the conduction band of TiO2 to oxygen molecules result in the formation of oxygen species at the surface. Typically, three types of oxygen species ( O 2 , O, O2−) are formed depending on the temperature. The formation of oxygen species is shown in Equations (4)–(7). Furthermore, the extraction of electrons by oxygen molecules leads to an increase in the depletion layer width. Accordingly, resistance increases, as shown in Figure 11a [35].
O2(gas) ↔ O2(ads)
O2(ads)+ e ↔ O2(ads)
O 2 ( ads ) + e 2 O ( ads )
O(ads) + e ↔ O2−(ads)
Once the sensor is exposed to acetone, it interacts with the adsorbed oxygen molecular species. The interaction with O2 is interesting to discuss here because the optimum working temperature is 150 °C. This interaction leads to the decomposition of C3H6O into carbon dioxide (CO2) and water (H2O), as shown in Equations (8) and (9) [50]. Thus, the released electrons (e) reduce the depletion layer, hence lowering the resistance of the sensor, as shown in Figure 8b.
CH3COCH3(gas) ↔ CH3COCH3(ads)
CH3COCH3(ads) + 8O(ads) → 3CO2(gas) + 3H2O(gas) + 8e
The sensing characteristics of the structures indicate that their response is enhanced by increasing the concentration of C3H6O (Figure 12). Conversely, a higher gas concentration results in a higher number of surface interactions, thus resulting in a higher response [51]. The porosity of the nanostructures is one of the possible reasons for the not-too-slow gas adsorption and diffusion within the sensor, resulting in the estimated response and recovery times of 348 s and 600 s at 40 RH% toward 10 ppm C3H6O. The estimated response and recovery times are shown in Table 2.
A gas-sensing material with a lower detection limit may have a good response to a smaller quantity of targeted gas, which ultimately helps to prevent serious accidents in a polluted environment. Hence, the power fitting (y = 6.4492x0.6046) between response and concentration is a significantly important characteristic (Figure 13a), in which the gradient describes the sensitivity and the intercepts show the detection limit. As shown in Figure 13b, the fabricated sensors have a relatively better response with a detection limit of ~0.05 ppm (∆G/G = 1 on power fitting). Concerning the practical application of the sensors, reproducibility and stability in response are also considered essential parameters.
Hence, the reproducibility and stability of TiO2-(B) nanobelts toward C2H6O were studied and reported herein. Figure S2 shows the reproducibility of the sensor toward three consecutive cycles of 50 ppm C3H6O at 150 °C and 40 RH%. Almost the same response value is achieved upon successive injections of C3H6O. Figure S3 shows the stability plot for two weeks toward 50 ppm C3H6O at 150 °C in 40 RH%. Figure S3 clearly shows the excellent performances of the sensors’ response during the tested period. Figure S4 displays the response values of the TiO2-8 sensor toward different gases at different working temperatures. Furthermore, Figure 13b depicts the selectivity of the TiO2-8 sensor toward the 10 ppm C3H6O, 10 ppm C2H5OH, 100 ppm H2, 100 ppm CH4, and 1 ppm NO2 at the operating temperature of 150 °C.
Thus, the observed C3H6O-sensing performances, for instance, response, selectivity, response/recovery times, reproducibility, and stability, of the TiO2-B nanobelts make them a potential candidate for selective sensing of C3H6O in a variety of applications when comparing the literature survey shown in Table 3.

4. Conclusions

Monoclinic TiO2 nanobelts were successfully prepared using the hydrothermal method. These studies indicated that the employment of acetic acid was successful in the protonation phase of TiO2-(B). The fabricated TiO2 gas sensors showed good gas-sensing performance. The highest response (∆G/G) was 6.5 toward 10 ppm of acetone at the working temperature of 150 °C. Moreover, the sensors demonstrated good selectivity toward acetone compared to ethanol, hydrogen, methane, and nitrogen dioxide. Thus, the fabricated monoclinic TiO2-B nanobelts are promising candidates for developing functional gas-sensing devices that work at relatively low power consumption. Additionally, the potential of lower detection limit and high selectivity toward acetone could make it interesting to employ the synthesized monoclinic TiO2 nanobelts in chemiresistive gas sensor applications.

Supplementary Materials

The following supporting information can be downloaded at https://www.mdpi.com/article/10.3390/s23198322/s1. Figure S1: FE-SEM images of the obtained morphology at (a) starting anatase TiO2 powder, (b) hydrothermal treatment at 120 °C, (c) hydrothermal treatment at 135 °C, (d) hydrothermal treatment at 125 °C, (e) hydrothermal treatment at 175 °C, and (f) hydrothermal treatment at 200 °C. Figure S2: Reproducibility study of TiO2-B nanobelt sensor toward 50 ppm C3H6O at 150 °C under 40 RH% condition. Figure S3: Stability study of TiO2-B nanobelt sensor toward 50 ppm C3H6O at 150 °C under both dry and 40 RH% conditions. Figure S4: Response values of the sensor toward 500, 100, 10, 10, and 10 ppm of CH4, H2, NO2, C2H5OH, and C3H5OH.

Author Contributions

Conceptualization, G.W.C.K., S.A.P., B.S.D., N.G. and E.C.; methodology, G.W.C.K. and S.A.P.; validation, D.Z., V.G., V.A.M., B.S.D., N.G. and E.C.; formal analysis, G.W.C.K., S.A.P., D.Z., V.G., V.A.M., B.S.D., N.G. and E.C.; investigation, G.W.C.K., S.A.P., D.C.M., A.M., C.G.M. and R.F.N.; resources, V.A.M., B.S.D., N.G. and E.C.; data curation, G.W.C.K., S.A.P. and V.A.M.; writing—original draft preparation, G.W.C.K. and S.A.P.; writing—review and editing, D.Z., V.G., V.A.M., B.S.D., N.G. and E.C.; visualization, G.W.C.K.; supervision, D.Z., V.G., V.A.M., B.S.D., N.G. and E.C.; project administration, B.S.D., N.G. and E.C.; funding acquisition, B.S.D., N.G. and E.C. All authors have read and agreed to the published version of the manuscript.

Funding

This research was funded by NATO Science for Peace and Security Programmer (S.P.S.) under grant G5634 “AMOXES”, the MIUR “Smart Cities and Communities and social innovation” project entitled “SWaRM Net/Smart Water Resource Management—Networks”, and the National Science Foundation, Sri Lanka, under Grant No NSF-PSF/ICRP/2017/EA & ICT/3.

Institutional Review Board Statement

Not applicable.

Informed Consent Statement

Not applicable.

Data Availability Statement

The data presented in this study are available on request from the corresponding author.

Acknowledgments

The TEM measurements were performed at INFIM Institute in Bucharest and supported by the CERIC-ERIC Consortium Project (proposal no.: 20212052).

Conflicts of Interest

The authors declare no conflict of interest.

References

  1. Staerz, A.; Weimar, U.; Barsan, N. Current state of knowledge on the metal oxide based gas sensing mechanism. Sens. Actuators B Chem. 2022, 358, 131531. [Google Scholar]
  2. Li, Q.; Zeng, W.; Li, Y. Metal oxide gas sensors for detecting NO2 in industrial exhaust gas: Recent developments. Sens. Actuators B Chem. 2022, 359, 131579. [Google Scholar]
  3. Tyagi, S.; Chaudhary, M.; Ambedkar, A.K.; Sharma, K.; Gautam, Y.K.; Singh, B.P. Metal oxide nanomaterial-based sensors for monitoring environmental NO2 and its impact on the plant ecosystem: A Review. Sens. Diagn. 2022, 1, 106–129. [Google Scholar]
  4. Kumarage, G.W.C.; Comini, E. Conductometric Gas Sensors. Encycl. Mater. Electron. 2023, 1, 564–580. [Google Scholar]
  5. Krishna, K.G.; Parne, S.; Pothukanuri, N.; Kathirvelu, V.; Gandi, S.; Joshi, D. Nanostructured metal oxide semiconductor-based gas sensors: A comprehensive review. Sens. Actuators A Phys. 2022, 341, 113578. [Google Scholar]
  6. Li, T.; Yin, W.; Gao, S.; Sun, Y.; Xu, P.; Wu, S.; Kong, H.; Yang, G.; Wei, G. The combination of two-dimensional nanomaterials with metal oxide nanoparticles for Gas Sensors: A Review. Nanomaterials 2022, 12, 982. [Google Scholar]
  7. Goel, N.; Kunal, K.; Kushwaha, A.; Kumar, M. Metal Oxide Semiconductors for Gas Sensing. Eng. Rep. 2022, 5, e12604. [Google Scholar] [CrossRef]
  8. Galstyan, V.; Moumen, A.; Kumarage, G.W.C.; Comini, E. Progress towards chemical gas sensors: Nanowires and 2D semiconductors. Sens. Actuators B Chem. 2022, 357, 131466. [Google Scholar]
  9. Moumen, A.; Kumarage, G.C.; Comini, E. P-type metal oxide semiconductor thin films: Synthesis and chemical sensor applications. Sensors 2022, 22, 1359. [Google Scholar] [CrossRef] [PubMed]
  10. Yang, B.; Myung, N.V.; Tran, T. 1D metal oxide semiconductor materials for Chemiresistive Gas Sensors: A Review. Adv. Electron. Mater. 2021, 7, 2100271. [Google Scholar]
  11. Mirzaei, A.; Lee, M.H.; Pawar, K.K.; Bharath, S.P.; Kim, T.-U.; Kim, J.-Y.; Kim, S.S.; Kim, H.W. Metal oxide nanowires grown by a vapor–liquid–solid growth mechanism for resistive gas-sensing applications: An overview. Materials 2023, 16, 6233. [Google Scholar] [PubMed]
  12. Lin, J.; Kilani, M.; Mao, G. Recent advances in integrating 1D nanomaterials into chemiresistive gas sensor devices. Adv. Mater. Technol. 2023, 8, 2202038. [Google Scholar]
  13. Kumarage, G.W.; Zappa, D.; Mihalcea, C.G.; Maraloiu, V.-A.; Stefan, M.; Comini, E. Revolutionizing N-Type Co3O4 nanowire for Hydrogen Gas Sensing. Adv. Energy Sustain. Res. 2023, 2300067. [Google Scholar] [CrossRef]
  14. Kumarage, G.W.; Comini, E. Low-dimensional nanostructures based on cobalt oxide (Co3O4) in chemical-gas sensing. Chemosensors 2021, 9, 197. [Google Scholar] [CrossRef]
  15. Korotcenkov, G. Current trends in nanomaterials for metal oxide-based conductometric gas sensors: Advantages and limitations. part 1: 1D and 2D nanostructures. Nanomaterials 2020, 10, 1392. [Google Scholar] [PubMed]
  16. Huang, J.; Wan, Q. Gas sensors based on semiconducting metal oxide one-dimensional nanostructures. Sensors 2009, 9, 9903–9924. [Google Scholar]
  17. Kaur, N.; Singh, M.; Moumen, A.; Duina, G.; Comini, E. 1D titanium dioxide: Achievements in chemical sensing. Materials 2020, 13, 2974. [Google Scholar] [CrossRef]
  18. Tian, X.; Cui, X.; Lai, T.; Ren, J.; Yang, Z.; Xiao, M.; Wang, B.; Xiao, X.; Wang, Y. Gas sensors based on TiO2 nanostructured materials for the detection of hazardous gases: A Review. Nano Mater. Sci. 2021, 3, 390–403. [Google Scholar]
  19. Reghunath, S.; Pinheiro, D.; KR, S.D. A review of hierarchical nanostructures of TiO2: Advances and applications. Appl. Surf. Sci. Adv. 2021, 3, 100063. [Google Scholar]
  20. Kumarage, G.W.; Hakkoum, H.; Comini, E. Recent advancements in TiO2 nanostructures: Sustainable synthesis and Gas Sensing. Nanomaterials 2023, 13, 1424. [Google Scholar]
  21. Zhang, D.; Yu, S.; Wang, X.; Huang, J.; Pan, W.; Zhang, J.; Meteku, B.E.; Zeng, J. UV illumination-enhanced ultrasensitive ammonia gas sensor based on (001)TiO2/MXene heterostructure for food spoilage detection. J. Hazard. Mater. 2022, 423, 127160. [Google Scholar] [PubMed]
  22. Rzaij, M.; Abass, A.M. Review on: TiO2 thin film as a metal oxide gas sensor. J. Chem. Rev. 2020, 2, 114–121. [Google Scholar]
  23. Lin, H.; Li, L.; Zhao, M.; Huang, X.; Chen, X.; Li, G.; Yu, R. Synthesis of high-quality Brookite TiO2 single-crystalline nanosheets with specific facets exposed: Tuning catalysts from inert to highly reactive. J. Am. Chem. Soc. 2012, 134, 8328–8331. [Google Scholar] [CrossRef] [PubMed]
  24. Dvorak, F.; Zazpe, R.; Krbal, M.; Sopha, H.; Prikryl, J.; Ng, S.; Hromadko, L.; Bures, F.; Macak, J.M. One-dimensional anodic TiO2 nanotubes coated by atomic layer deposition: Towards advanced applications. Appl. Mater. Today 2019, 14, 1–20. [Google Scholar]
  25. Puga, M.L.; Venturini, J.; Ten Caten, C.S.; Bergmann, C.P. Influencing parameters in the electrochemical anodization of TiO2 nanotubes: Systematic review and meta-analysis. Ceram. Int. 2022, 48, 19513–19526. [Google Scholar]
  26. Bindra, P.; Mittal, H.; Sarkar, B.R.; Hazra, A. Synthesis of highly ordered TiO2 nanorods on a titanium substrate using an optimized hydrothermal method. J. Electron. Mater. 2022, 51, 1707–1716. [Google Scholar]
  27. Alotaibi, A.M.; Sathasivam, S.; Williamson, B.A.; Kafizas, A.; Sotelo-Vazquez, C.; Taylor, A.; Scanlon, D.O.; Parkin, I.P. Chemical vapor deposition of photocatalytically active pure Brookite TiO2 Thin Films. Chem. Mater. 2018, 30, 1353–1361. [Google Scholar] [CrossRef]
  28. Otieno, O.V.; Csáki, E.; Kéri, O.; Simon, L.; Lukács, I.E.; Szécsényi, K.M.; Szilágyi, I.M. Synthesis of tio2 nanofibers by electrospinning using water-soluble TI-precursor. J. Therm. Anal. Calorim. 2019, 139, 57–66. [Google Scholar]
  29. Yang, D.; Liu, H.; Zheng, Z.; Yuan, Y.; Zhao, J.; Waclawik, E.R.; Ke, X.; Zhu, H. An efficient photocatalyst structure: TiO2(b) nanofibers with a shell of anatase nanocrystals. J. Am. Chem. Soc. 2009, 131, 17885–17893. [Google Scholar]
  30. Dai, J.; Yang, J.; Wang, X.; Zhang, L.; Li, Y. Enhanced visible-light photocatalytic activity for selective oxidation of amines into imines over TiO2(b)/anatase mixed-phase nanowires. Appl. Surf. Sci. 2015, 349, 343–352. [Google Scholar]
  31. Wang, Y.; Wu, T.; Zhou, Y.; Meng, C.; Zhu, W.; Liu, L. TiO2-based Nanoheterostructures for promoting gas sensitivity performance: Designs, developments, and prospects. Sensors 2017, 17, 1971. [Google Scholar]
  32. Ramanavicius, S.; Jagminas, A.; Ramanavicius, A. Gas sensors based on Titanium Oxides (review). Coatings 2022, 12, 699. [Google Scholar]
  33. Alev, O.; Şennik, E.; Kılınç, N.; Öztürk, Z.Z. Gas sensor application of hydrothermally growth TiO2 nanorods. Procedia Eng. 2015, 120, 1162–1165. [Google Scholar] [CrossRef]
  34. Enachi, M.; Lupan, O.; Braniste, T.; Sarua, A.; Chow, L.; Mishra, Y.K.; Gedamu, D.; Adelung, R.; Tiginyanu, I. Integration of individual TiO2 nanotube on the chip: Nanodevice for Hydrogen Sensing. Phys. Status Solidi Rapid Res. Lett. 2015, 9, 171–174. [Google Scholar] [CrossRef]
  35. Marchand, R.; Brohan, L.; Tournoux, M. TiO2(B) a new form of titanium dioxide and the potassium octatitanate K2TI8O17. Mater. Res. Bull. 1980, 15, 1129–1133. [Google Scholar] [CrossRef]
  36. Andreev, Y.G.; Panchmatia, P.M.; Liu, Z.; Parker, S.C.; Islam, M.S.; Bruce, P.G. The shape of TIO2-b nanoparticles. J. Am. Chem. Soc. 2014, 136, 6306–6312. [Google Scholar] [PubMed]
  37. Zhou, N.; Wu, Y.; Zhou, Q.; Li, Y.; Liu, S.; Zhang, H.; Zhou, Z.; Xia, M. Enhanced cycling performance and rate capacity of SIO anode material by compositing with monoclinic TiO2 (B). Appl. Surf. Sci. 2019, 486, 292–302. [Google Scholar]
  38. Sugimoto, W.; Terabayashi, O.; Murakami, Y.; Takasu, Y. Electrophoretic deposition of negatively charged tetratitanate nanosheets and transformation into preferentially oriented TiO2 (B) film. J. Mater. Chem. 2002, 12, 3814–3818. [Google Scholar]
  39. Patil, J.V.; Mali, S.S.; Shaikh, J.S.; Bhat, T.S.; Hong, C.K.; Kim, J.H.; Patil, P.S. Hydrothermally grown 3D hierarchical TiO2 based on electrochemically anodized 1D TiO2 nanostructure for Supercapacitor. Appl. Phys. A 2018, 124, 592. [Google Scholar]
  40. Zhao, Z.; Tian, J.; Sang, Y.; Cabot, A.; Liu, H. Structure, synthesis, and applications of TiO2 nanobelts. Adv. Mater. 2015, 27, 2557–2582. [Google Scholar]
  41. Sisman, O.; Poli, N.; Zappa, D.; Comini, E. Synthesis of nanoporous TiO2 with the use of diluted hydrogen peroxide solution and its application in gas sensing. Coatings 2019, 9, 681. [Google Scholar] [CrossRef]
  42. Li, P.; Cao, Q.; Zheng, D.; Alshehri, A.A.; Alghamidi, Y.G.; Alzahrani, K.A.; Kim, M.; Hou, J.; Lai, L.; Malgras, V.; et al. Synthesis of mesoporous TiO2-B nanobelts with highly crystalized walls toward efficient H2 evolution. Nanomaterials 2019, 9, 919. [Google Scholar] [CrossRef] [PubMed]
  43. Liu, H.; Yang, D.; Waclawik, E.R.; Ke, X.; Zheng, Z.; Zhu, H.; Frost, R.L. A Raman spectroscopic study on the active site of sodium cations in the structure of Na2Ti3O7 during the adsorption of Sr2+ and ba2+ cations. J. Raman Spectrosc. 2010, 41, 1792–1796. [Google Scholar] [CrossRef]
  44. Kolen’ko, Y.V.; Kovnir, K.A.; Gavrilov, A.I.; Garshev, A.V.; Frantti, J.; Lebedev, O.I.; Churagulov, B.R.; Van Tendeloo, G.; Yoshimura, M. Hydrothermal synthesis and characterization of nanorods of various titanates and titanium dioxide. J. Phys. Chem. B 2006, 110, 4030–4038. [Google Scholar] [CrossRef] [PubMed]
  45. Li, M.-J.; Chi, Z.-Y.; Wu, Y.-C. Morphology, chemical composition and phase transformation of hydrothermal derived sodium titanate. J. Am. Ceram. Soc. 2012, 95, 3297–3304. [Google Scholar]
  46. Prathan, A.; Sanglao, J.; Wang, T.; Bhoomanee, C.; Ruankham, P.; Gardchareon, A.; Wongratanaphisan, D. Controlled structure and growth mechanism behind hydrothermal growth of TiO2 nanorods. Sci. Rep. 2020, 10, 8065. [Google Scholar]
  47. Choi, K.J.; Jang, H.W. One-dimensional oxide nanostructures as gas-sensing materials: Review and issues. Sensors 2010, 10, 4083–4099. [Google Scholar]
  48. Walker, J.; Karnati, P.; Akbar, S.A.; Morris, P.A. Selectivity mechanisms in resistive-type metal oxide heterostructural gas sensors. Sens. Actuators B Chem. 2022, 355, 131242. [Google Scholar]
  49. Rajendran, S.; Inwati, G.K.; Yadav, V.K.; Choudhary, N.; Solanki, M.B.; Abdellattif, M.H.; Yadav, K.K.; Gupta, N.; Islam, S.; Jeon, B.-H. Enriched catalytic activity of TiO2 nanoparticles supported by activated carbon for noxious pollutant elimination. Nanomaterials 2021, 11, 2808. [Google Scholar] [CrossRef]
  50. Zhou, X.; Wang, A.; Wang, Y.; Bian, L.; Yang, Z.; Bian, Y.; Gong, Y.; Wu, X.; Han, N.; Chen, Y. Crystal-defect-dependent gas-sensing mechanism of the single zno Nanowire Sensors. ACS Sens. 2018, 3, 2385–2393. [Google Scholar]
  51. Lee, J.; Jung, Y.; Sung, S.-H.; Lee, G.; Kim, J.; Seong, J.; Shim, Y.-S.; Jun, S.C.; Jeon, S. High-performance gas sensor array for indoor air quality monitoring: The role of au nanoparticles on WO3, SnO2, and NiO-based gas sensors. J. Mater. Chem. A 2021, 9, 1159–1167. [Google Scholar]
  52. Amiri, V.; Roshan, H.; Mirzaei, A.; Neri, G.; Ayesh, A.I. Nanostructured metal oxide-based acetone gas sensors: A Review. Sensors 2020, 20, 3096. [Google Scholar] [CrossRef]
  53. Navale, S.T.; Yang, Z.B.; Liu, C.; Cao, P.J.; Patil, V.B.; Ramgir, N.S.; Mane, R.S.; Stadler, F.J. Enhanced acetone sensing properties of titanium dioxide nanoparticles with a sub-ppm detection limit. Sens. Actuators B Chem. 2018, 255, 1701–1710. [Google Scholar]
  54. Wang, Z.; Ali Haidry, A.; Xie, L.; Zavabeti, A.; Li, Z.; Yin, W.; Lontio Fomekong, R.; Saruhan, B. Acetone sensing applications of AG modified TiO2 porous nanoparticles synthesized via facile hydrothermal method. Appl. Surf. Sci. 2020, 533, 147383. [Google Scholar] [CrossRef]
  55. Rella, R.; Spadavecchia, J.; Manera, M.G.; Capone, S.; Taurino, A.; Martino, M.; Caricato, A.P.; Tunno, T. Acetone and ethanol solid-state gas sensors based on TiO2 nanoparticles thin film deposited by Matrix assisted pulsed laser evaporation. Sens. Actuators B Chem. 2007, 127, 426–431. [Google Scholar] [CrossRef]
  56. Chen, N.; Li, Y.; Deng, D.; Liu, X.; Xing, X.; Xiao, X.; Wang, Y. Acetone sensing performances based on nanoporous TiO2 synthesized by a facile hydrothermal method. Sens. Actuators B Chem. 2017, 238, 491–500. [Google Scholar] [CrossRef]
  57. Zhu, H.; Haidry, A.A.; Wang, Z.; Ji, Y. Improved acetone sensing characteristics of TiO2 nanobelts with ag modification. J. Alloys Compd. 2021, 887, 161312. [Google Scholar] [CrossRef]
Figure 1. The crystal structures of TiO2: (a) anatase, (b) rutile, (c) brookite, and (d) monoclinic. Reprinted with permission from [22].
Sensors 23 08322 g001
Figure 2. Schematic of the fabricated conductometric chemical gas sensor and the electrodes.
Sensors 23 08322 g002
Figure 3. XRD patterns of samples: (a) intermediate H2Ti3O7, (b) TiO2-(B), and (c) Raman spectra of the prepared H2Ti3O7 at 200 °C before calcination. B—TiO2-(B); ✓—H2Ti3O7; ●—Na2Ti3O7; ■—Na2Ti4O9; Sensors 23 08322 i001
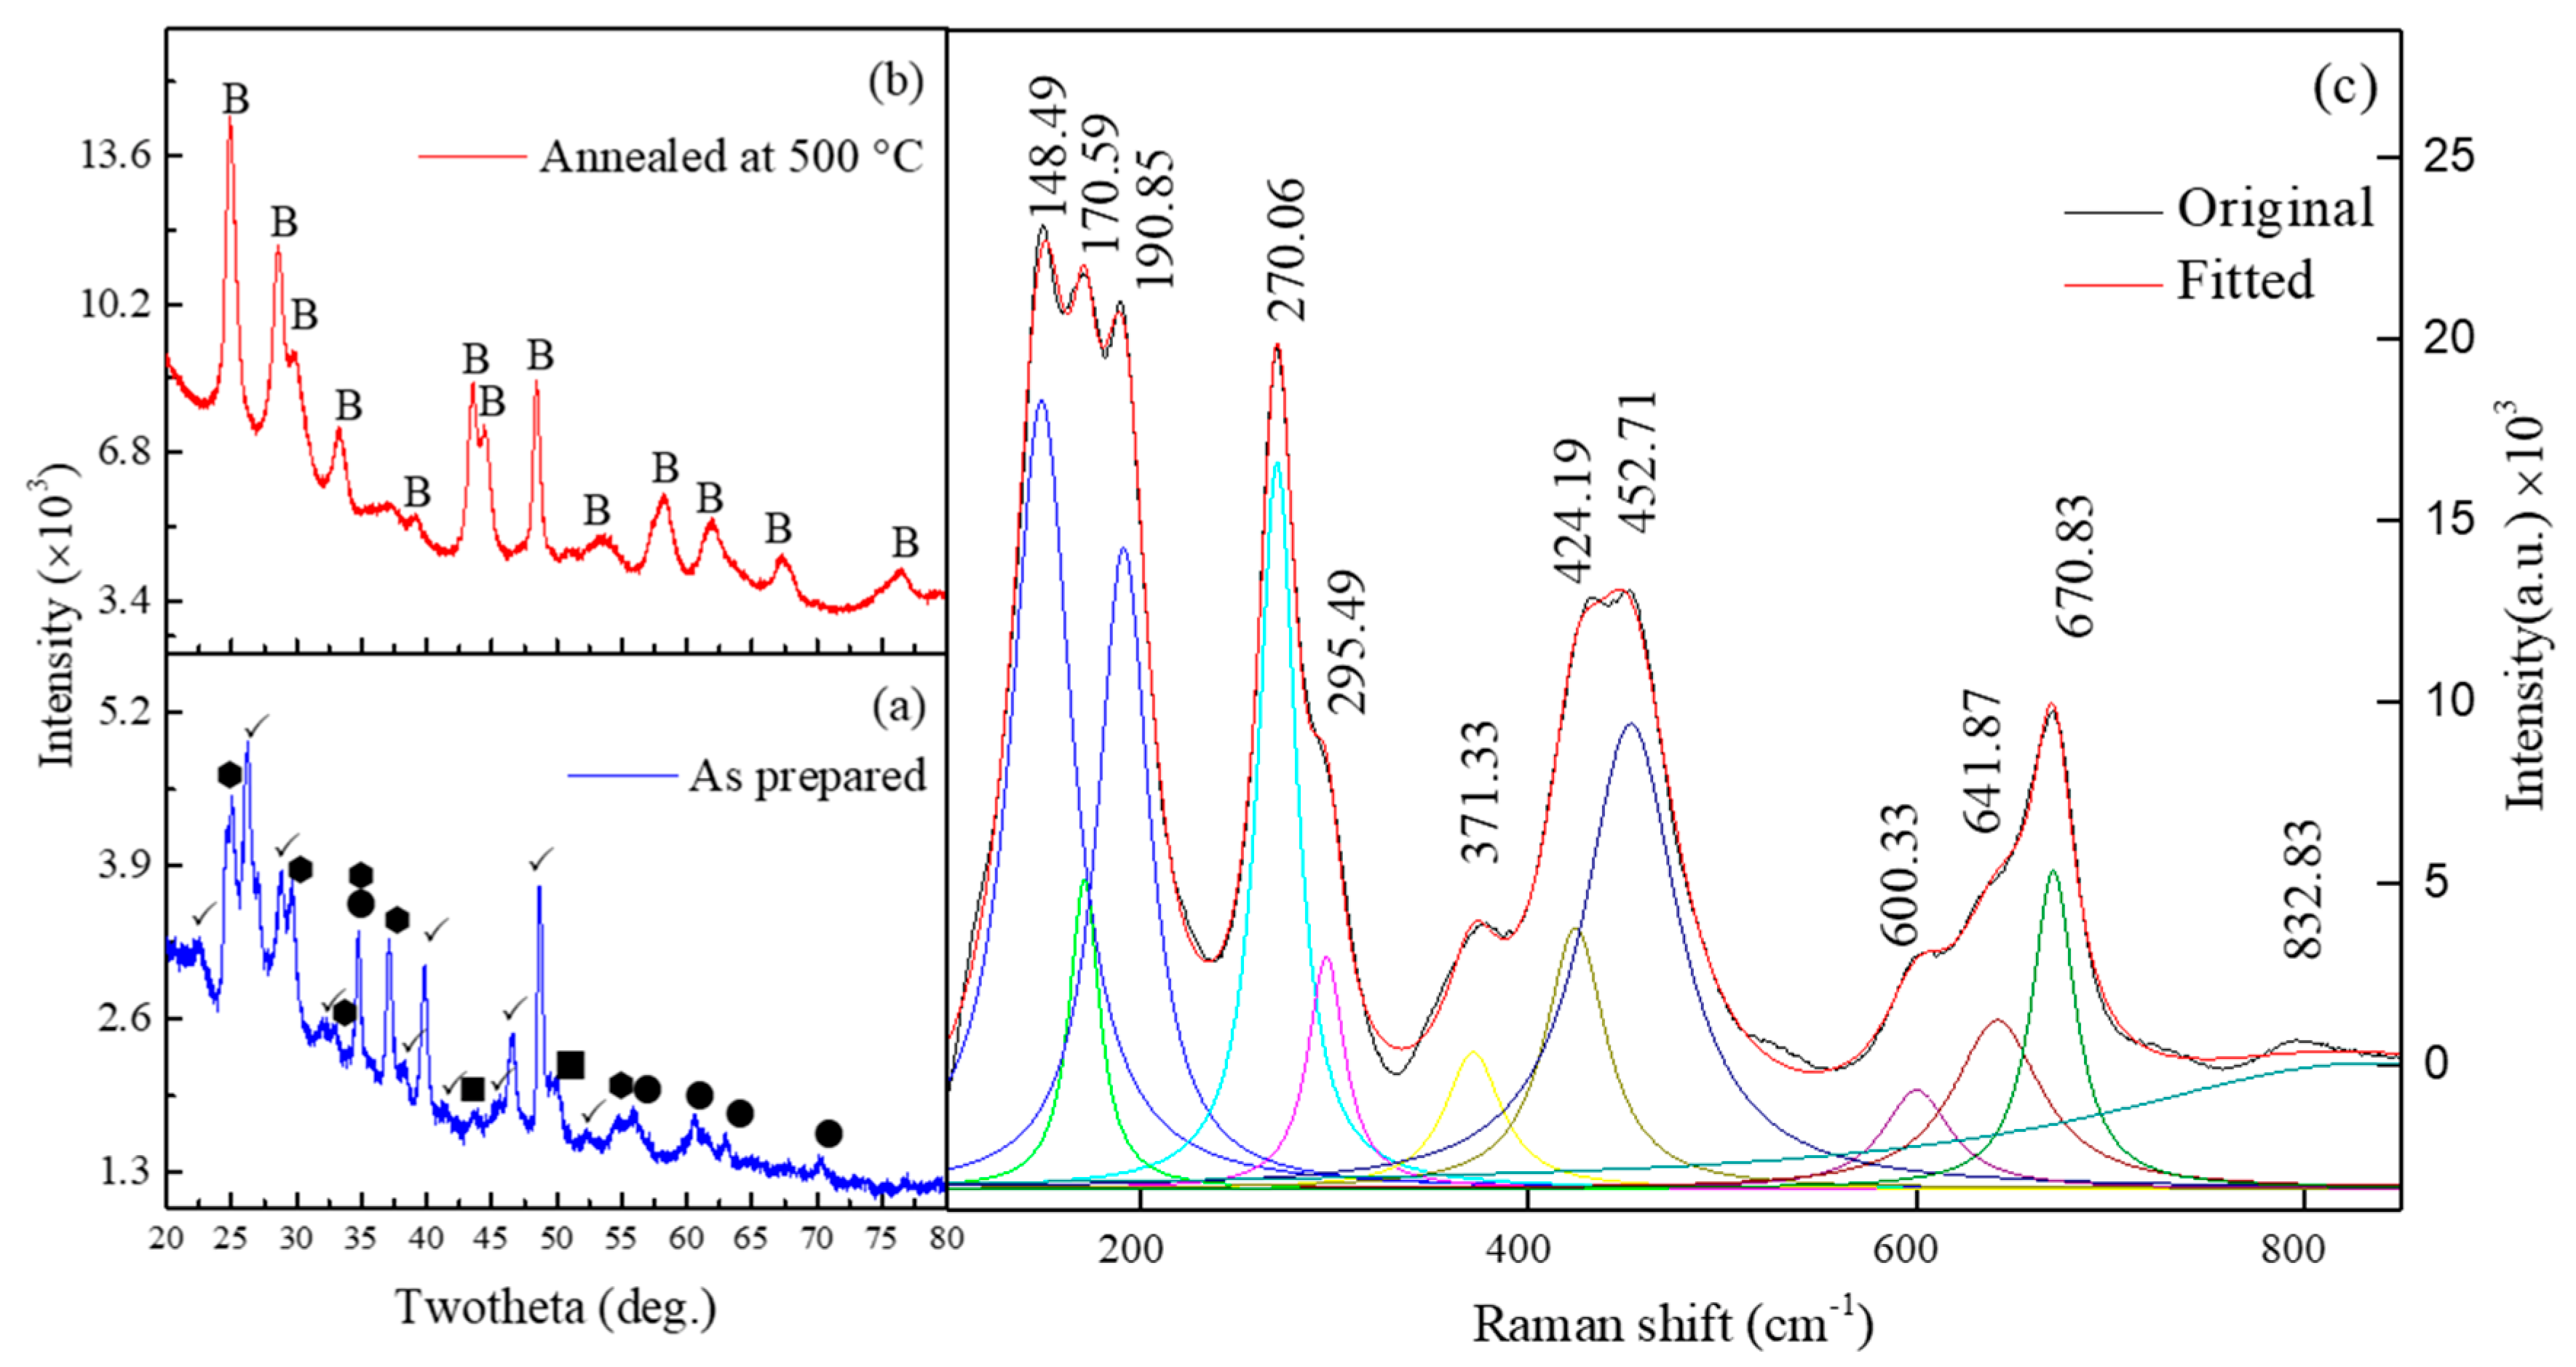
—Na2Ti9O19. The oridinal Ramana spectra is shown in black and the fitted Ramana spectra is shown in Red. Whle other are the peak fitting corresponding to fitted spectra (Red).
Sensors 23 08322 g003
Figure 4. Schematic formation of (a) sodium titanate (Na2Ti3O7) nanosheets, (b) hydrogen titanate (H2Ti3O7) nanobelts, and (c) TiO2 nanobelts.
Sensors 23 08322 g004
Figure 5. FE-SEM of (a) H2Ti3O7 prepared in the autoclave at 200 °C, and (b) TiO2-(B) annealed at 500 °C.
Sensors 23 08322 g005
Figure 6. CTEM images: (a) H2Ti3O7, (b) TiO2-(B), and (e) formation of pore-like structure in TiO2-(B); (c) HRTEM image of TiO2-(B) with insert showing (101) planes; and (d) SAED of TiO2-(B); (f) magnified image of (c).
Sensors 23 08322 g006
Figure 7. (a) CTEM of several overlapping TiO2-(B) nanobelts; EDS analysis of TiO2-(B) nanobelts. The maps show the (c) O and (d) Ti distribution on the nanobelts corresponding to the HAADF image of (b).
Sensors 23 08322 g007
Figure 8. Electrical conductance variation of the fabricated sensors at different working temperatures under 40 RH% conditions.
Sensors 23 08322 g008
Figure 9. Response of the TiO2 nanobelts (TiO2-8n) to 10 ppm C3H6O at different working temperatures in 40% RH conditions.
Sensors 23 08322 g009
Figure 10. Dynamic response–recovery plot of the TiO2-8 sensor toward 10, 25, and 50 ppm of C3H6O at the working temperature of 150 °C.
Sensors 23 08322 g010
Figure 11. (a) Electrical band bending due to the adsorption of oxygen species to the TiO2 nanobelt surface (O2ads, Oads, O2−ads), and (b) reduction in the space charge region resulting in a decrement in electrical resistance due to the interaction between acetone molecules and TiO2 surface. Ec is the conduction band, Ev is the valence band, and Ef is the Fermi level.
Sensors 23 08322 g011
Figure 12. Variation in the sensor’s response toward different concentrations of C3H6O at the working temperature of 150 °C.
Sensors 23 08322 g012
Figure 13. (a) The plot of response vs. concentration value of the sensor (TiO2-8n) toward C3H6O at 150 °C. (b) Selectivity of the TiO2-8n sensor toward the tested gases (10 ppm C3H6O, 10 ppm C2H5OH, 100 ppm H2, 100 ppm CH4, and 1 ppm NO2) in 40 RH% humidity air at the operating temperature of 150 °C.
Sensors 23 08322 g013
Table 1. Nomenclature of the fabricated conductometric chemical sensors.
Number of DropsNomenclature
2TiO2-2n
4TiO2-4n
6TiO2-6n
8TiO2-8n
Table 2. Sensors’ performance to different concentrations of C3H6O.
C3H6O (ppm)40 RH%
ResponseResponseResponse Time (S)Recovery Time (S)
101.36.5378600
252.19.6348960
504.412.73241320
Table 3. Comparison of gas-sensing parameters of TiO2-B nanobelt sensor with other reported TiO2-based C3H6O sensors.
MaterialSynthesis RouteWorking Tempt. (°C)Response (Ra/Rg)C3H6O (ppm)Res. Time
(Tres) (s)
Rec. Time
(Trec) (s)
The Lowest Detection Limit (ppm)Ref.
TiO2 porous NPsHydrothermal27513.91001114-[52]
TiO2 NPsMatrix-assisted pulsed laser deposition4006100240-20[53]
Nanoporous TiO2Hydrothermal37025.9750013820[54]
Ag-TiO2 nanobeltsHydrothermal26028.25500680.8[55]
TiO2 nanorodsElectrospun50013300126-[56]
TiO2-B nanorodsHydrothermal3202.31003180-[57]
TiO2-B nanobeltsHydrothermal15012.75032413200.7This work
Disclaimer/Publisher’s Note: The statements, opinions and data contained in all publications are solely those of the individual author(s) and contributor(s) and not of MDPI and/or the editor(s). MDPI and/or the editor(s) disclaim responsibility for any injury to people or property resulting from any ideas, methods, instructions or products referred to in the content.

