
Impact of the Use of Electric Scooters from Shared Mobility Systems on the Users


Department of Road Transport, Faculty of Transport and Aviation Engineering, Silesian University of Technology, 8 Krasińskiego Street, 40-019 Katowice, Poland
Smart Cities 2022, 5(3), 1079-1091; https://doi.org/10.3390/smartcities5030054
Submission received: 8 August 2022
/
Revised: 19 August 2022
/
Accepted: 22 August 2022
/
Published: 26 August 2022
(This article belongs to the Special Issue Mobility as a Service Systems in Smart Cities)
Abstract
:In recent years, mobility as a service (MaaS) (i.e., a system combining public transport, shared rides, short-term vehicle rentals, and taxis sourced via mobile applications) has become a solution that is increasingly available in smart cities. Along with the development of transport options, the range of vehicles offered as part of this type of service has expanded widely, from buses, taxis, bicycles, and cars to the innovation of electric scooters. The universality of MaaS services has led to a change in communication behavior and, at the same time, to a rapid increase in the number of people using the proposed solutions. Due to this increase, several researchers devoted their dissertations to issues of the management or optimization of websites; however, they ignored the many technical and health aspects. Recognizing a scientific niche area, the research conducted has been devoted to assessing the impact of the vibrations generated by electric scooters upon the user. Research on the vehicles used in MaaS systems has been conducted to learn and analyze the selected design solutions and their impact on the user who utilizes them. The scope of the research included vibroacoustic research and the mathematical modeling of the studied phenomena.
1. Introduction
Sustainable mobility and transport are directly linked to several of the United Nations’ Sustainable Development Goals, especially those related to health, energy, economic growth, and the infrastructure and well-being of cities and people [1]. Due to their key importance to the economic development of the world, the search for various types of new solutions in the field of social movement has become one of the main considerations of leading international organizations, such as the European Union or the United Nations [2]. As such, sustainable mobility has been identified as a critical route to achieving the 2030 Sustainable Development Goals and all activities leading to their achievement are considered a priority, these being promoted and subsidized in the form of various types of grants or projects by H2020 Electrific or ERA-NET Cofund Electric Mobility Europe [3,4,5].
One of the possible ways by which we might achieve a higher level of transport environmental performance while offering a positive impact on the economic aspects and the quality of life of residents, is the elimination of fossil-fuel vehicles and the implementation of electric vehicles in their place. Actions taken in this area that lead to changes in the culture of movement, in terms of an orientation toward electric vehicles, are referred to as electromobility [6].
As part of government policies on the development of electromobility, various initiatives have been proposed to encourage the public to change their current transport habits [7,8]. These include [9,10]:
- The implementation of all shared mobility services, such as electric cars, bicycles, mopeds, or scooter-sharing services;
- The conducting of campaigns promoting the purchase of electric vehicles;
- The introduction of tax exemptions or the offering of additional privileges to the owners of electric vehicles;
- The spread of new mobility patterns with electric vehicles, including electric scooters, segways, unicycles, and electric skateboards.
As shown by the indicated solutions, in recent years, electromobility has been garnering more and more interest from users, both in the world in general and in Europe in particular. In the case of the Polish market, to which this article is devoted, electromobility has become increasingly popular in recent years. Currently, 22,291 electric passenger cars are registered on the Polish market; this trend has increased by 117% compared to 2019 [11]. Although the trend of selling electric vehicles is not as intense as in the case of Germany, Great Britain, or France, complementary forms of electromobility, such as electric micromobility services, are being intensively developed [11]. In July 2021, the number of available e-scooters in Poland reached 37,700 vehicles, which is 3.5 times higher than at the beginning of the season in 2019 [12]. The market also offers 1000 e-mopeds, as part of shared mobility services, operating in 19 Polish cities [12]. In addition, the number of electric and private scooters is also growing. In 2020, this reached a value of over 120,000 units [13].
Among the various forms of electromobility, electric scooters, which are often utilized in scooter-sharing services, have become the most easily accessible vehicle for the average user [14]. Obviously, the use of electric scooters has a positive impact on urban transport and the environment, thereby reducing the number of internal combustion vehicles in cities. Electric scooters offered in urban mobility systems have a number of advantages, such as small dimensions or the low weight of the vehicle, which can be transported or taken with you, e.g., for shopping or when on the train [15]. From year to year, scooters have gained an increasing number of users who are more willing to use a scooter than a motor vehicle [16].
The increasing availability of electric scooters and scooter operators in cities has enabled micromobility operators to access travel and vehicle availability data, which has led researchers to take an interest in this type of vehicle and service [16]. From a broad literature review, it is clear that scooter-sharing services are also of interest to scientists around the world. For example, Gebhardt et al. considered the environmental impact of scooters and the consequent reduction of CO2 emissions [17]. In turn, Sanders et al. analyzed the impact of the use of scooters on improving the level of physical activity in society [18]. In comparison, Wang et al. discussed the impact of scooters on changes to the transport behavior of society [19], while Öztaş Karlı et al. considered the level of acceptance of scooters by city dwellers [20]. Research was also carried out regarding the appropriate location and relocation of vehicles, the development of technical equipment in the form of batteries, the management of scooter systems, and optimization [21,22,23]. Among the literature, however, a research gap has been identified regarding research on the impact of traveling on an electric scooter on the user. The safe movement of scooters is an important element of the proper development of mobility as a service (MaaS) systems [24,25]. Micromobility plays a key role; it provides essential solutions for the first and last kilometers of a journey to make MaaS more accessible, to power public transport services, and, in addition, to increase the overall adoption of sustainable mobility [26]. What is more, this aspect of the impact of scooters on the user is particularly important because it directly affects the health of scooter users; it also refers to the main assumptions of sustainable mobility, which emphasize that this form of travel is safe for users, improves their quality of life, and does not threaten the loss of health. One of the key factors regarding the impact of vehicles on users during travel is the vibrations generated by vehicles [27]. The level of vibration generated must not exceed the daily permissible value for exposure to mechanical vibration, which is set at 0.8 m/s2 [27].
In response to the indicated research gap, the aim of this article is to identify those factors that have the greatest impact on the generation of vibrations during the use of scooters and, above all, to determine the level of generated vibrations per user. In addition, the article contributes to the development of research on electromobility, along with the impact of vehicle use on humans. Analyzing the presented results will allow a broader look at micromobility vehicles, which are increasingly becoming the commonest means of transport in modern cities.
This paper is divided into five sections. In the first section, we offer a general outline of the context of the current work. The second section presents the methodology of the conducted research. The third section presents the obtained results. The fourth section presents a discussion of the results, while the fifth section provides a summary and offers our conclusions, with recommendations for the safe use of scooters in urban transport systems.
2. Materials and Methods
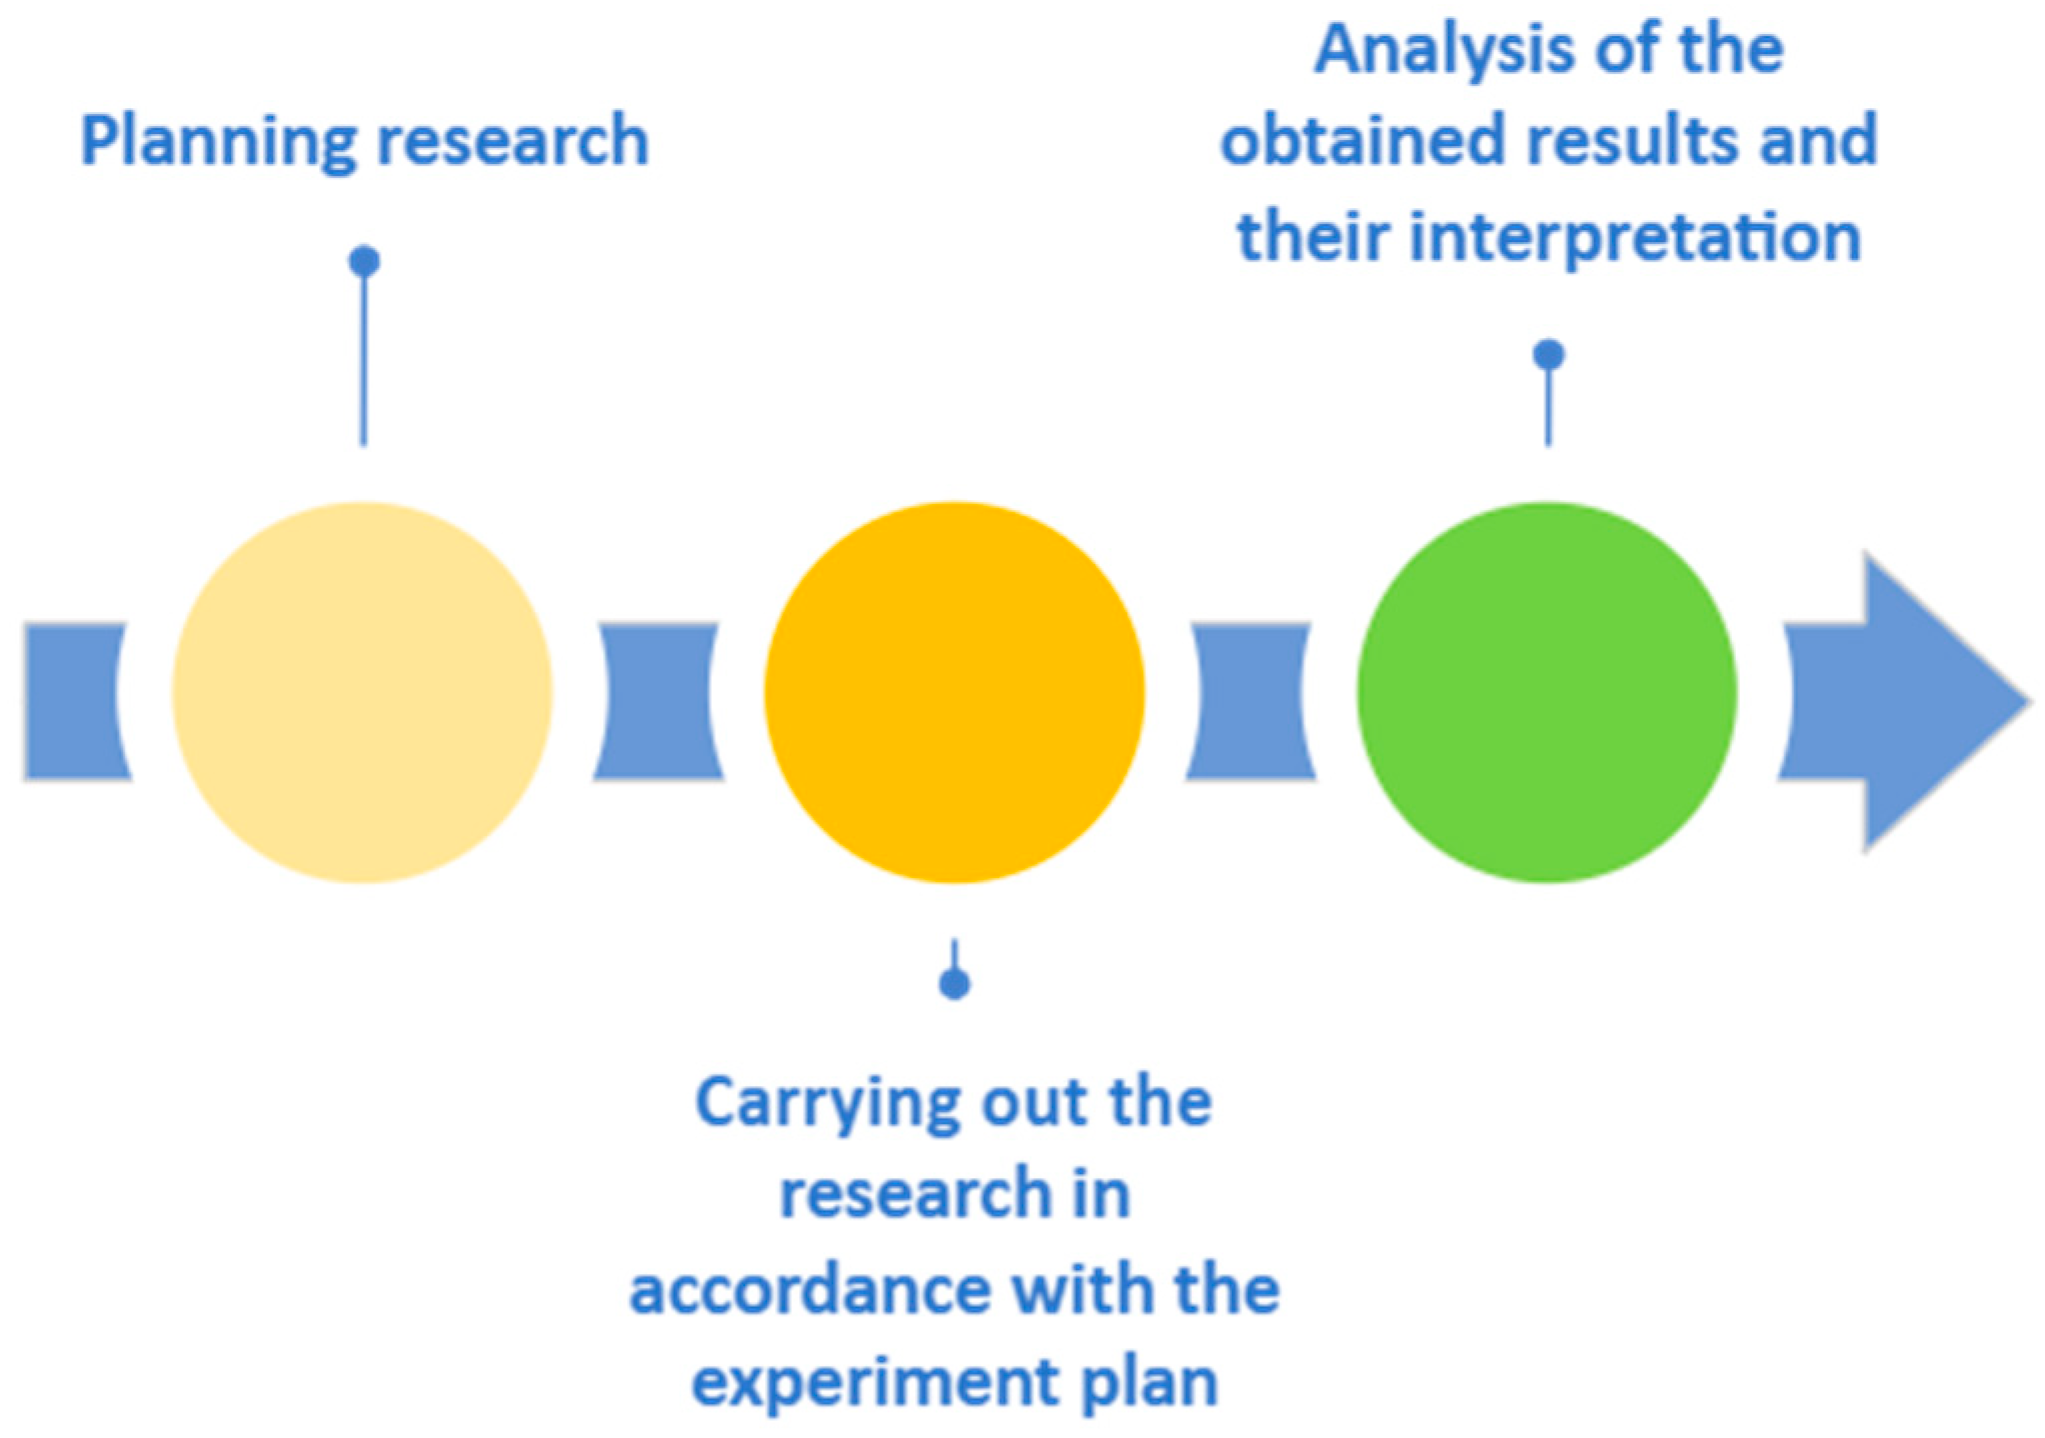
The subject of the current study is an electric scooter. The electric scooter has been tested to reflect the standard rides performed by scooter users in shared mobility systems. The research schedule is shown in Figure 1.
In order to carry out the research, an experimental plan was created using an electric scooter. However, it was necessary to properly select the parameters of the tests. On the basis of the literature, it has been established that electric scooters most often move on an asphalt surface (x1), paving stones, and mixed surfaces (50% asphalt and 50% paving stones) [28,29]. Another task was to identify the speed (x2) at which users move and the distance (x3) that is covered by them. It has been specified that electric scooters move within the speed range of 10–20 km/h over a distance of 1–5 km [30].
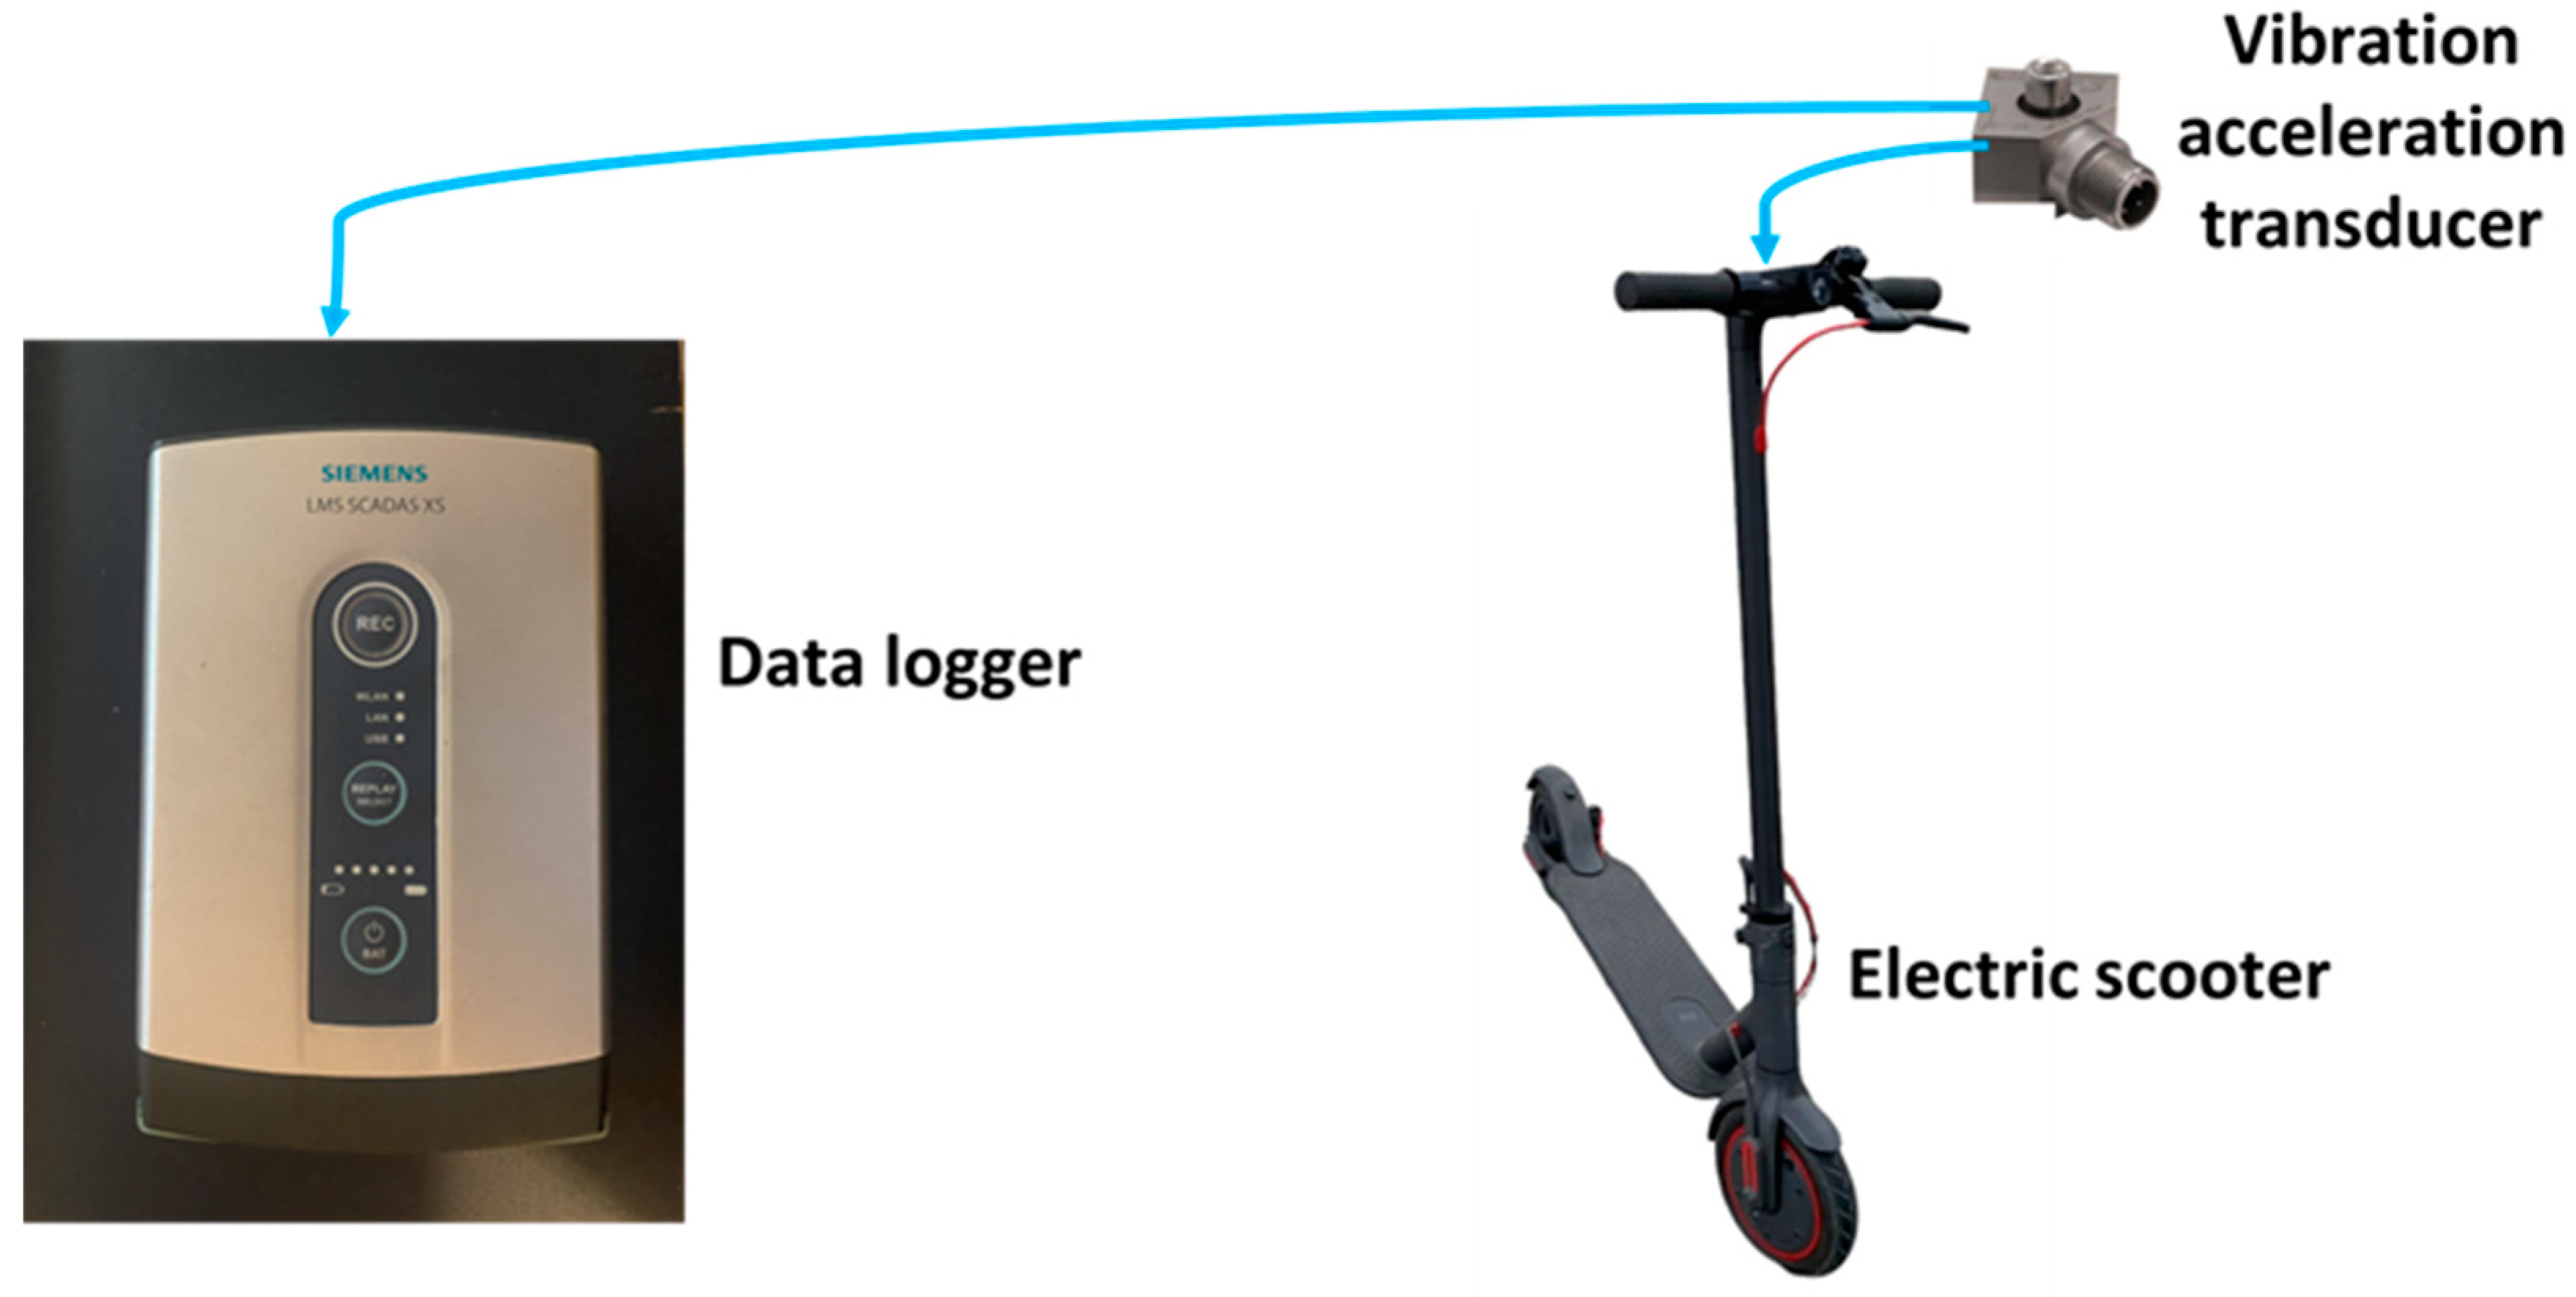
The plan of the experiment was developed with a d-optimal ternary plan. This determines the impact of individual factors on the final result. Figure 2 shows a diagram of the installation of the measuring sensor and the recording system (which was equipped with a GPS).
The value measured during the tests represents the effective value of the vibration signal generated during the journey. The variability of the received vibration signal per unit of time is randomly printed from the vibration generator of the tested object. The definition of characteristics is possible thanks to the dimensions of the estimation, e.g., self-correlation function, mean value, and effective value. The RMS value (ARMS) is the root of the mean square value and is written using Formula (1) [31,32,33]:
To record the signal, a manual LMS SCADAS XS data acquisition module was used that allowed the recording of 6 channels with a sampling rate of 51.2 kHz and 3 vibration acceleration sensors, which were mounted on the handlebars of the scooter. Signal transformations and analyses were carried out using the computing environment via the signal processing tools. To measure the rotational speed of the wheel, a SELS PCID-8ZP inductive sensor with a working range of 8 mm was used. The study plan is presented in Table 1.
The values of the individual input factors have been determined according to the following Formulas (2)–(4):
In Table 1, the values expressed as −1, 0, and 1 determine the maximum variability of a given factor (x1, x2, and x3). The mathematical model can be presented by a second-degree polynomial (5):
where:
- -
- —results;
- -
- —the input factor in the normalized scale;
- -
- —regression coefficients.
3. Results
Following the experiment plan (Table 2), e-scooter rides were performed, and the values of the vibration acceleration signal per unit of time were recorded. Based on the recorded vibration acceleration signals, the value of ARMS was determined. The ARMS signal value allows the researcher to define the limit value of the vibration energy for individual waveforms. The results of the conducted research are presented in Table 2.
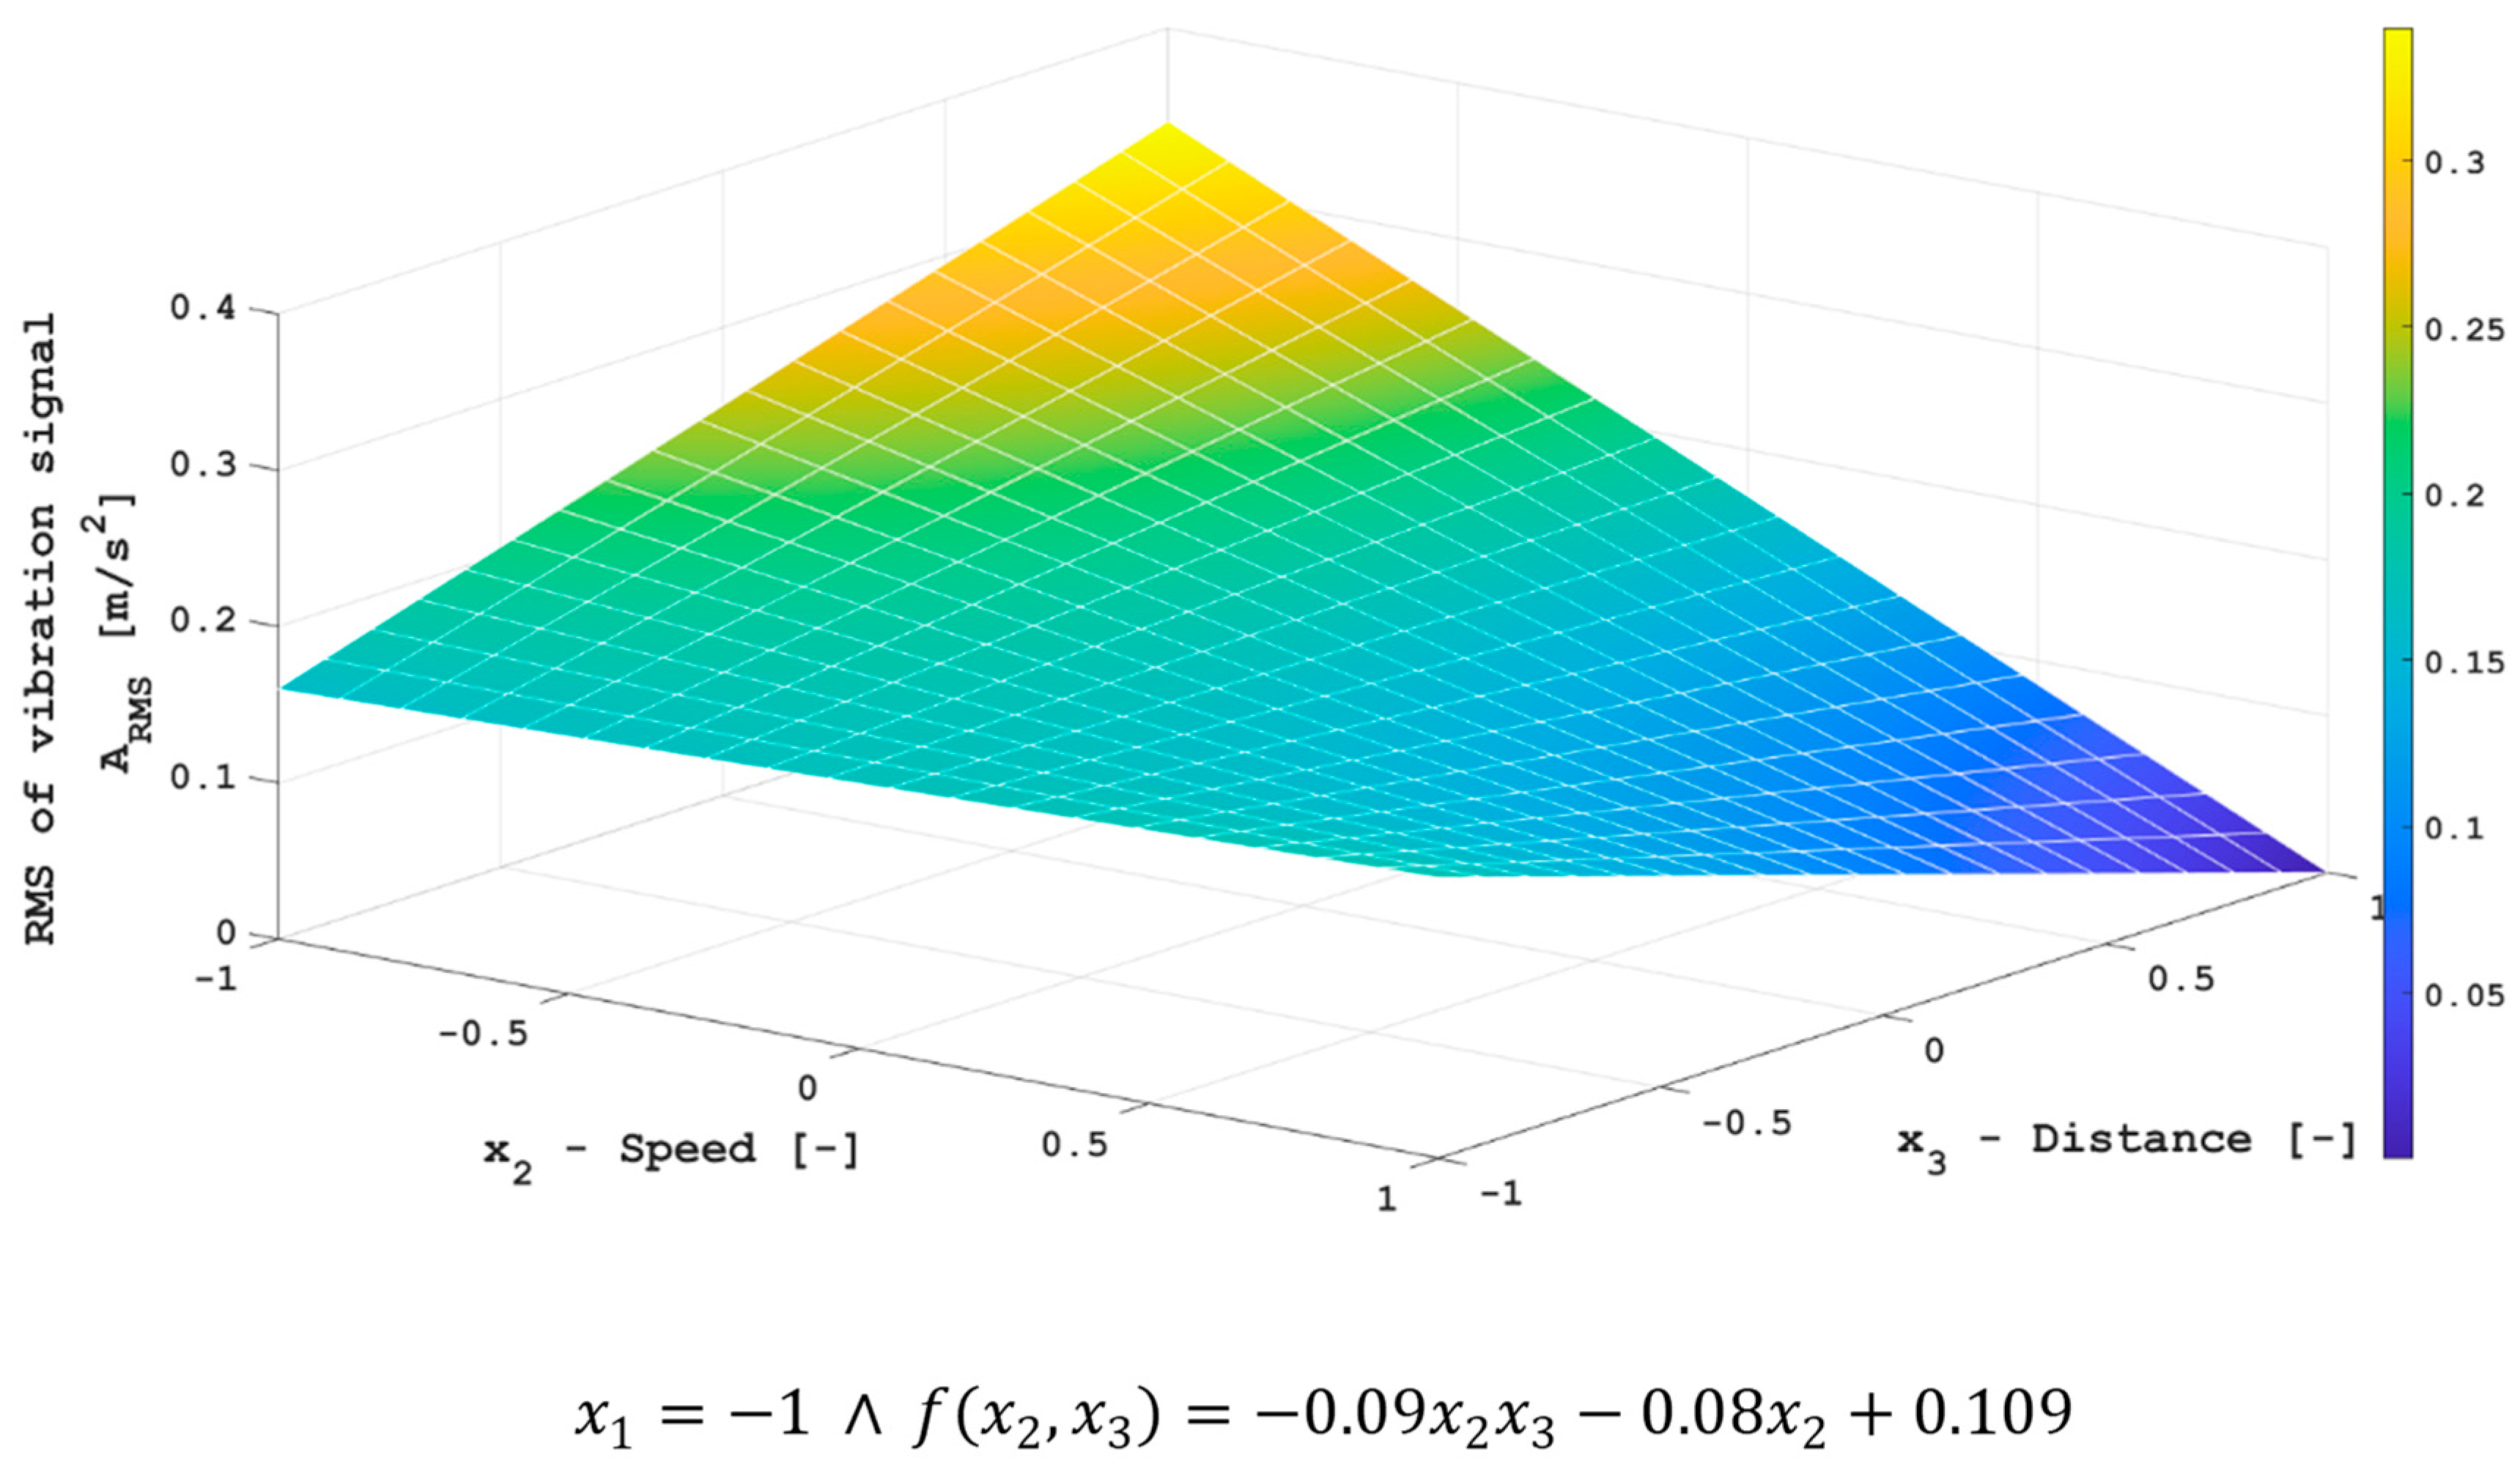
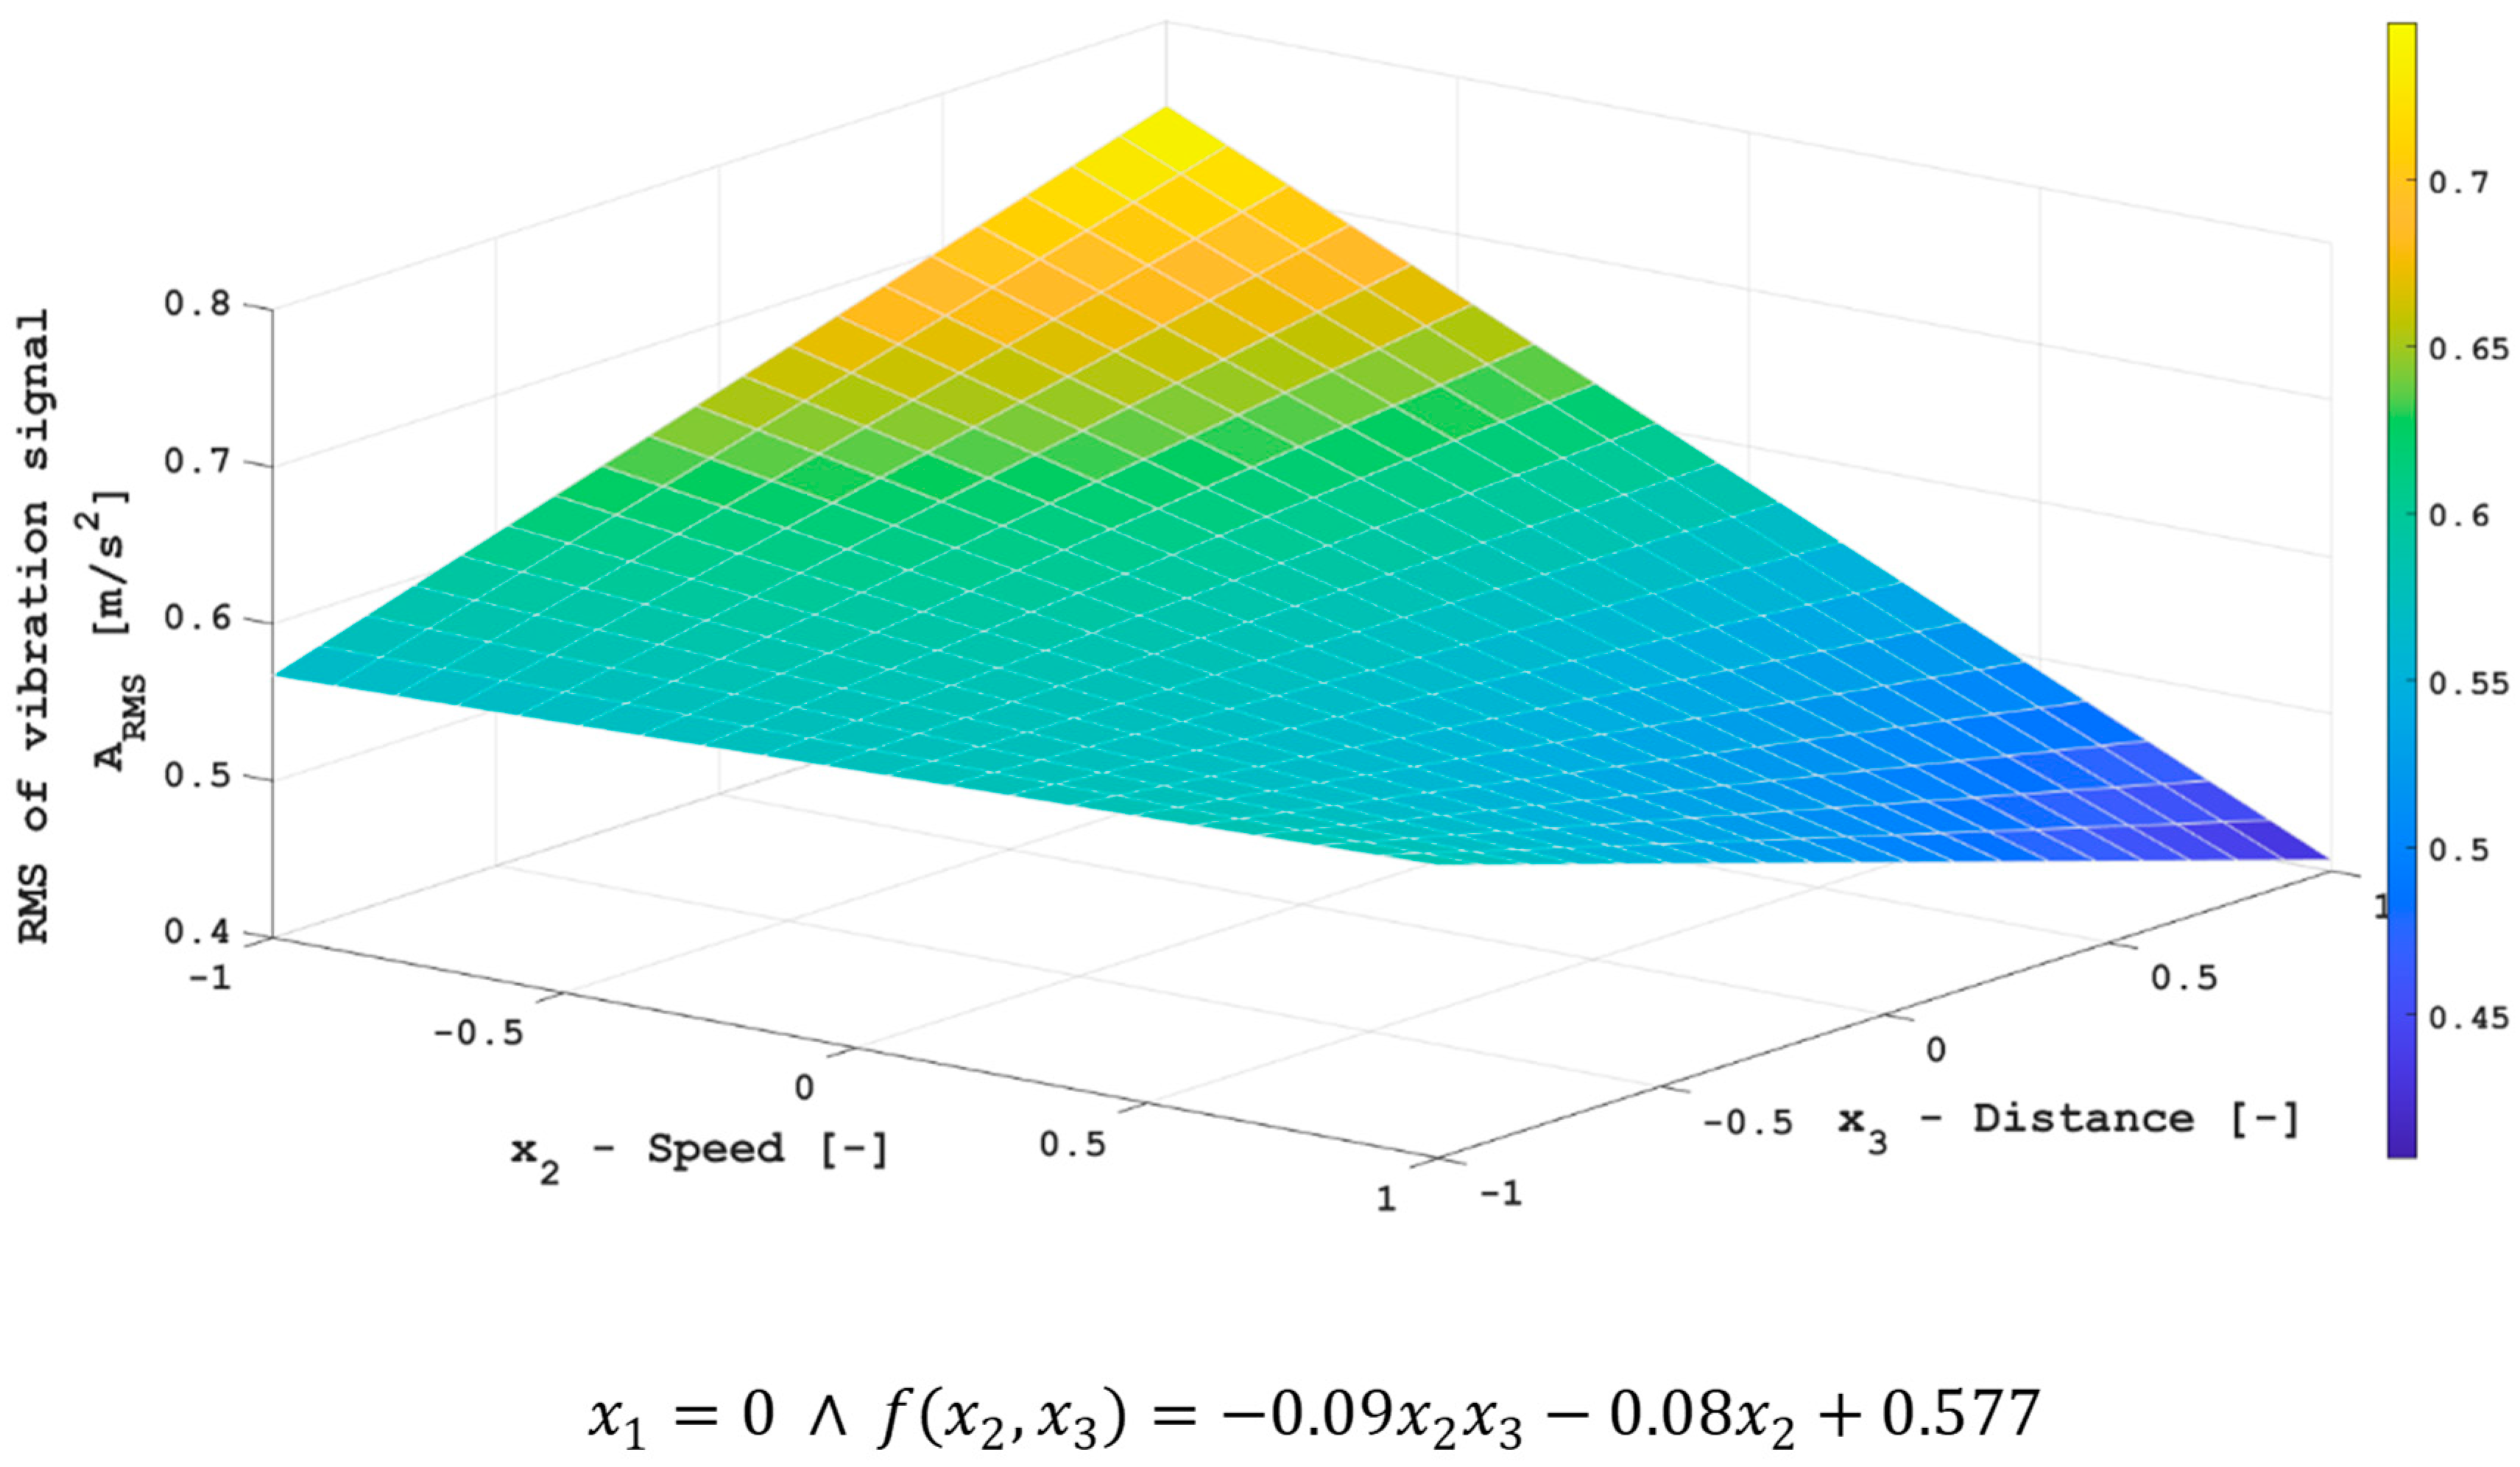
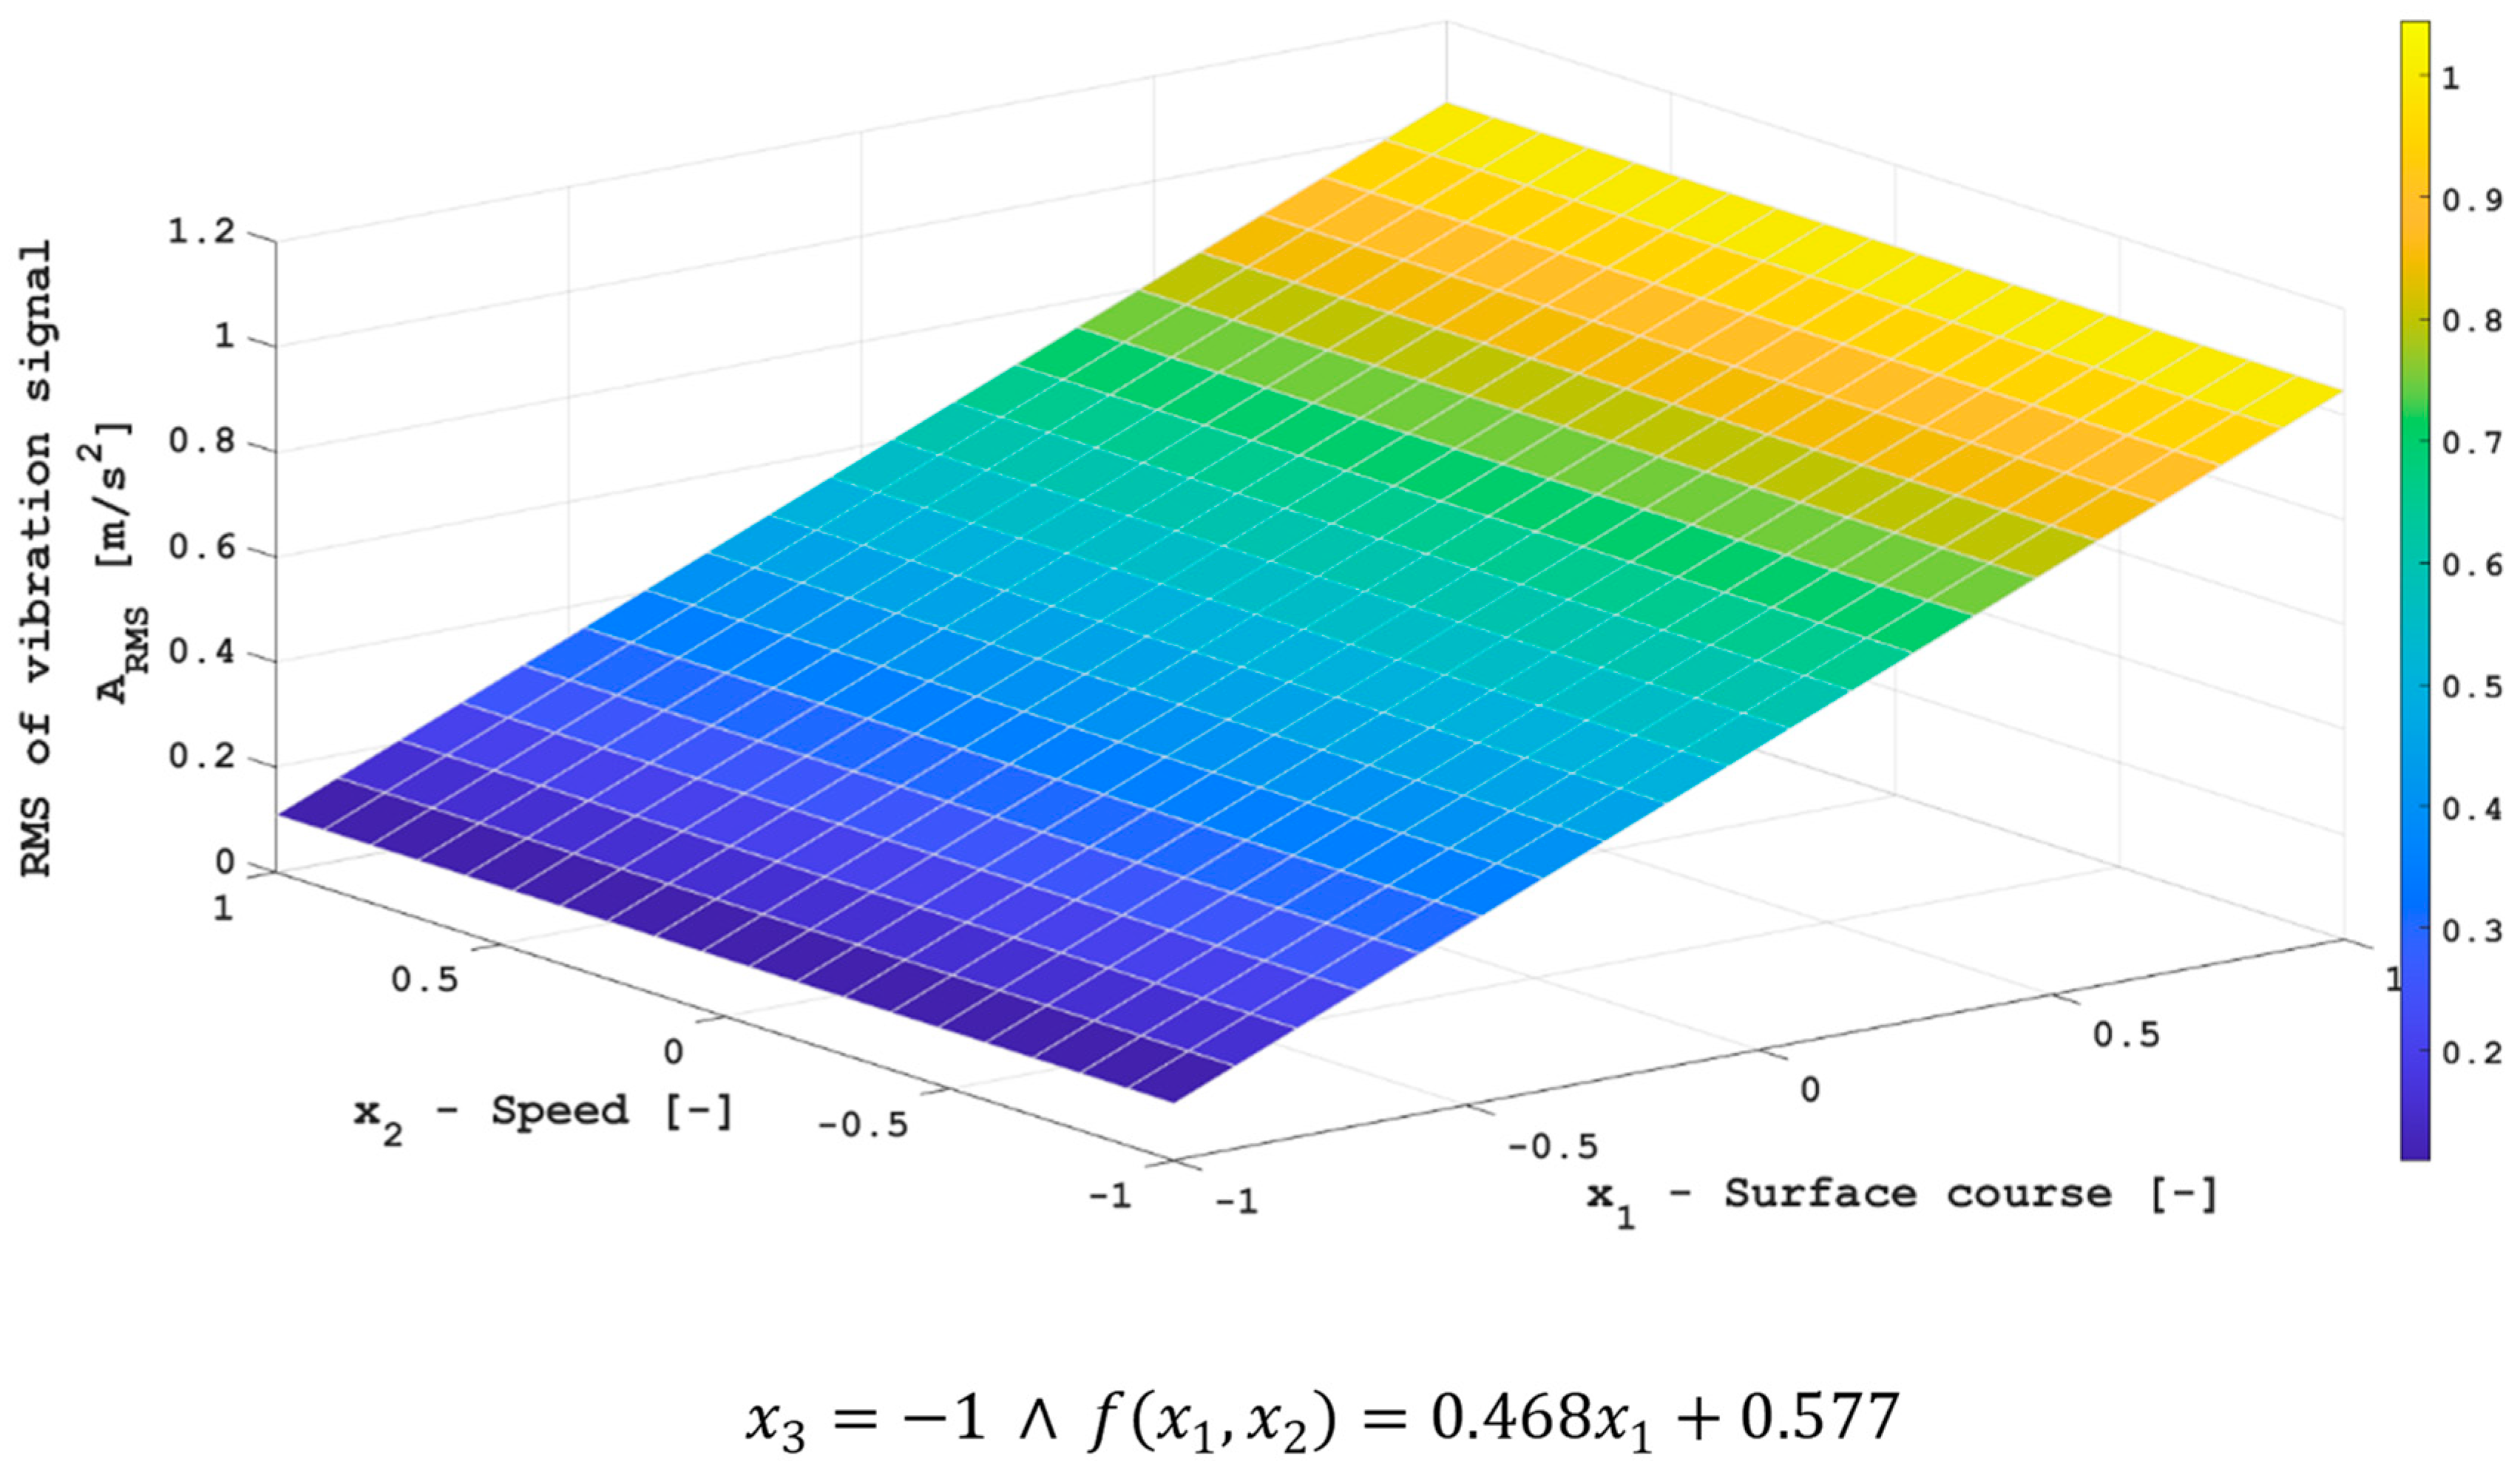
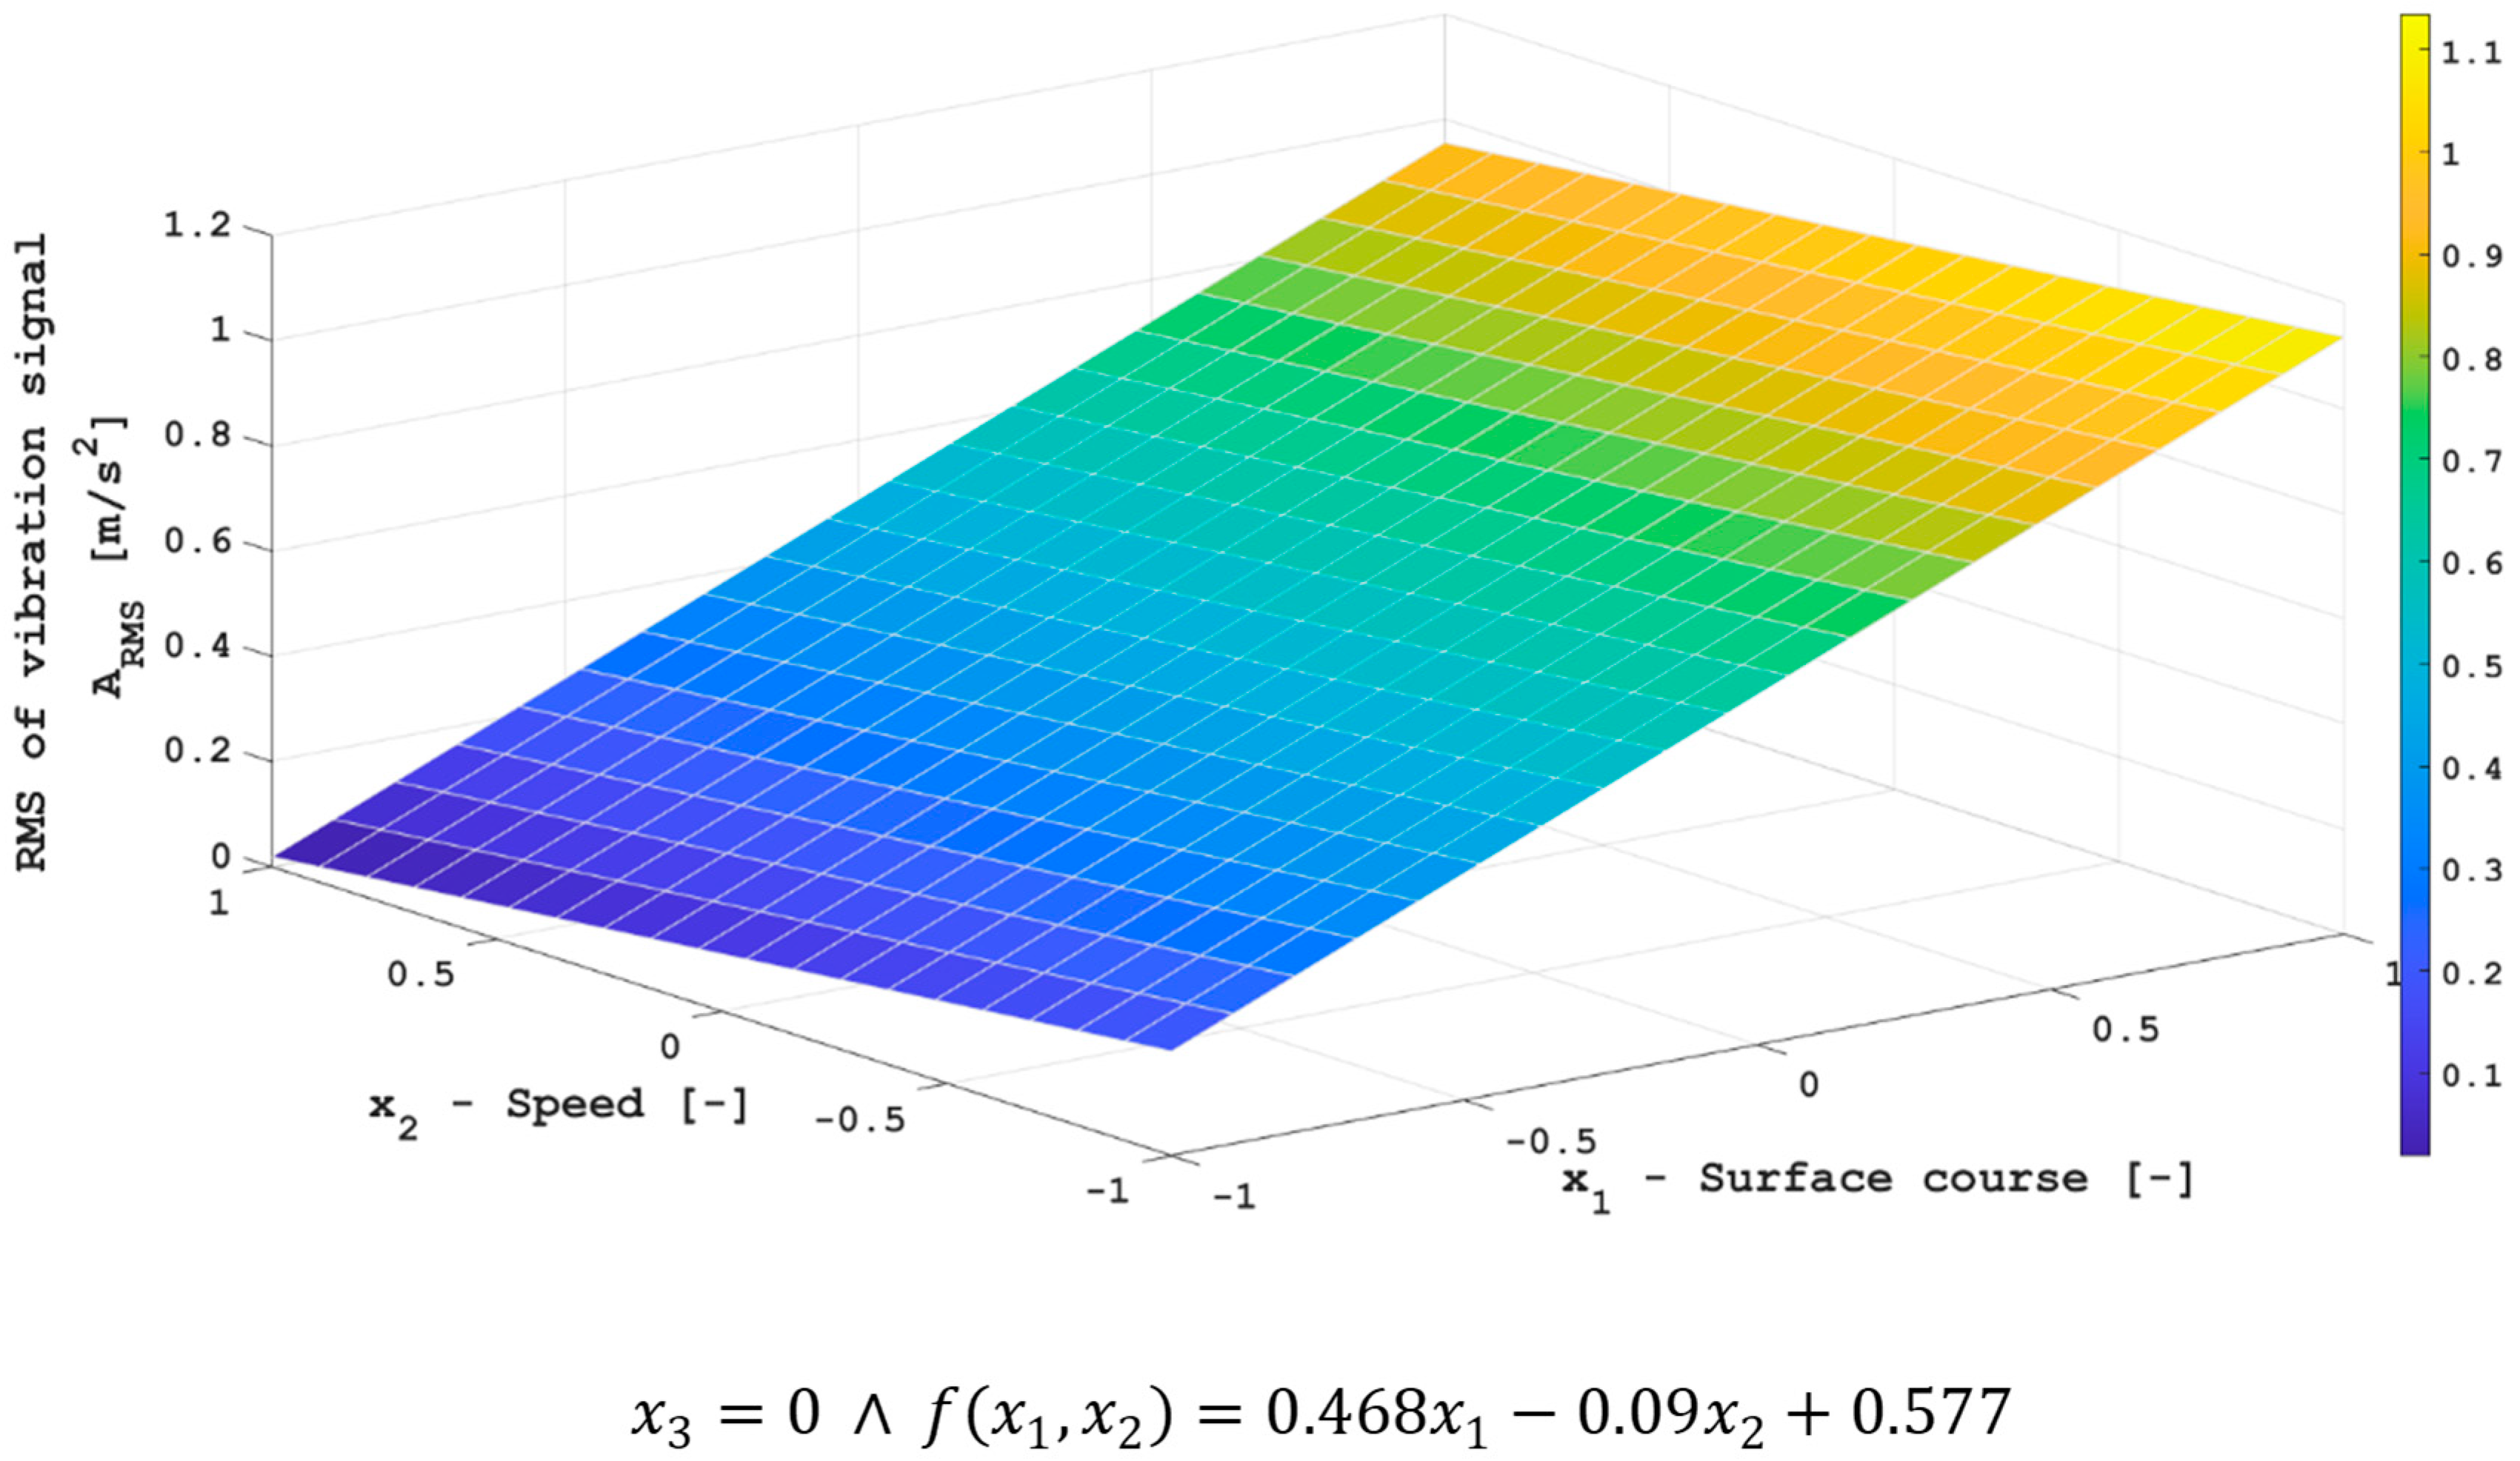
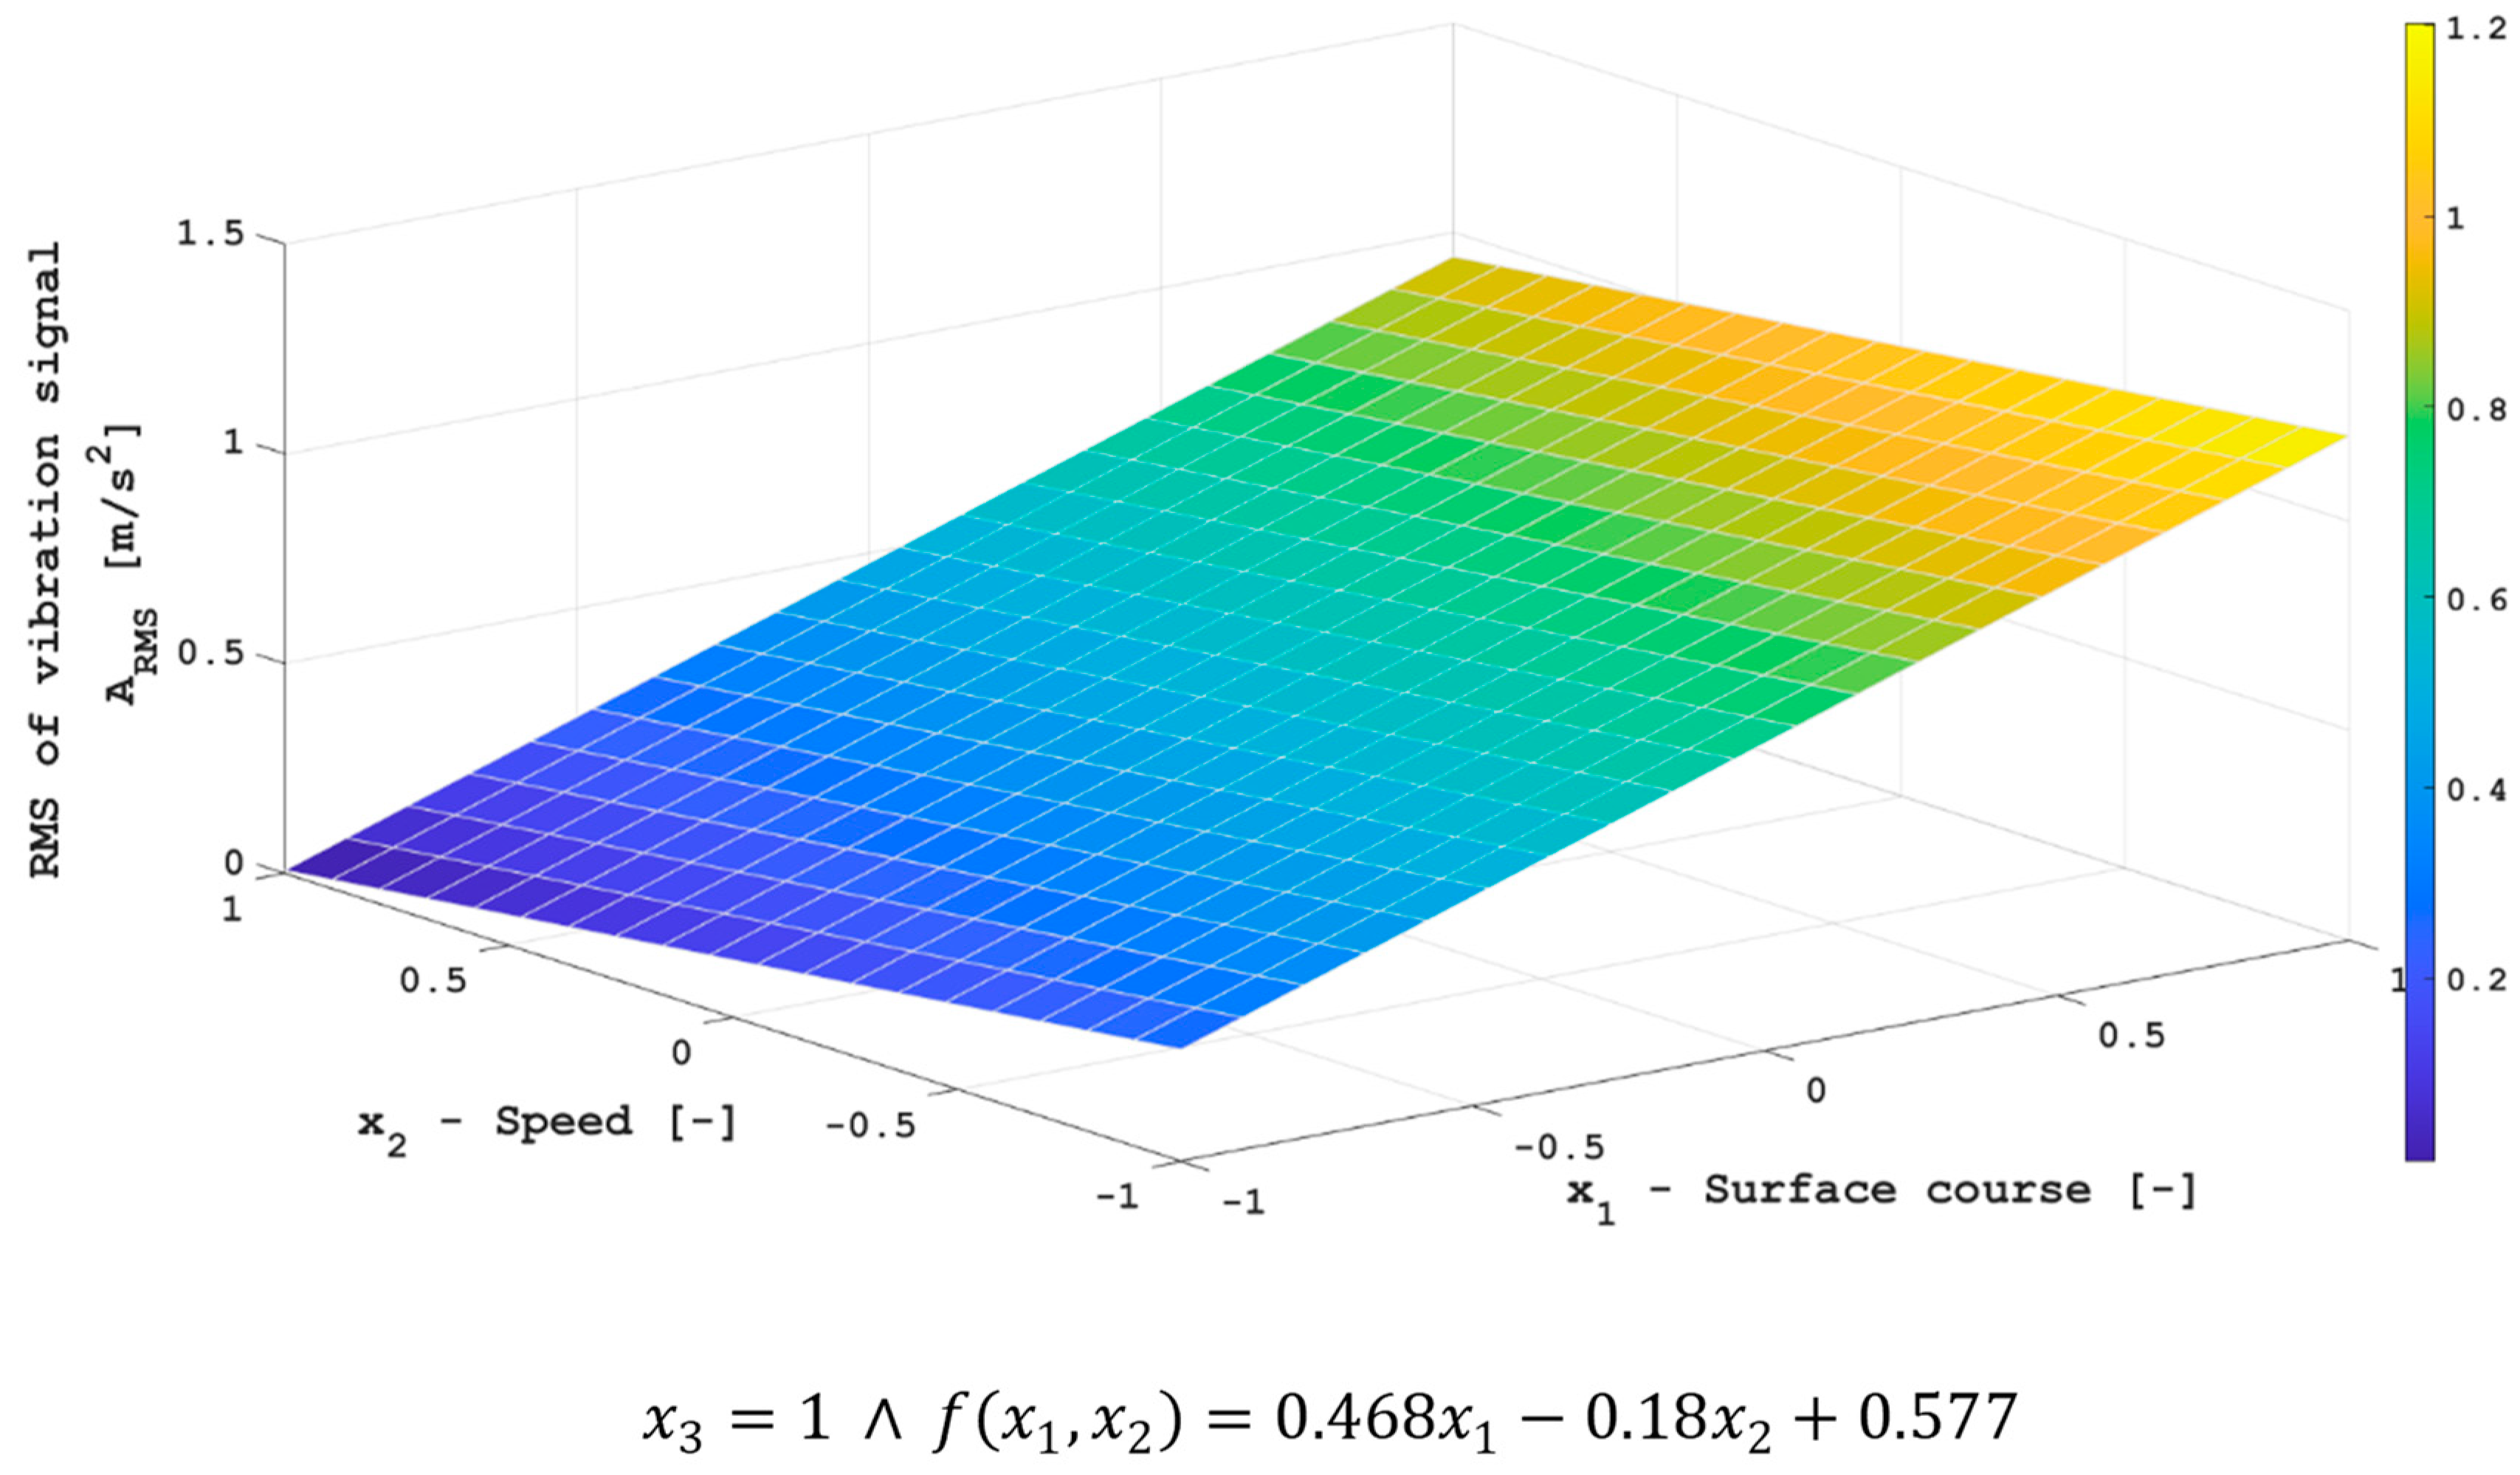
Thanks to the use of the d-optimal plan of the experiment, it was possible to derive mathematical formulas determining the influence of the studied factors (i.e., the type of surface, the speed, and the distance) on the effective value of the generated vibrations. Figure 3, Figure 4, Figure 5, Figure 6, Figure 7, Figure 8, Figure 9, Figure 10 and Figure 11 show the relationship between individual input factors and the value of the RMS A signal. On the basis of Formula (5), mathematical descriptions of the conducted research were created, as can be seen in Figure 3, Figure 4 and Figure 5. The highest values for the acceleration of interacting vibrations were obtained when moving an electric scooter on a paving stone at a speed of 20 km/h. The extreme was reached for ARMS = 1.22 m/s2. Furthermore, the values obtained for the surface–paving stones exceeded the limit of vibrations to which a person can be exposed, which was equal to ARMS = 0.8 m/s2. For other surfaces, the values were not exceeded.
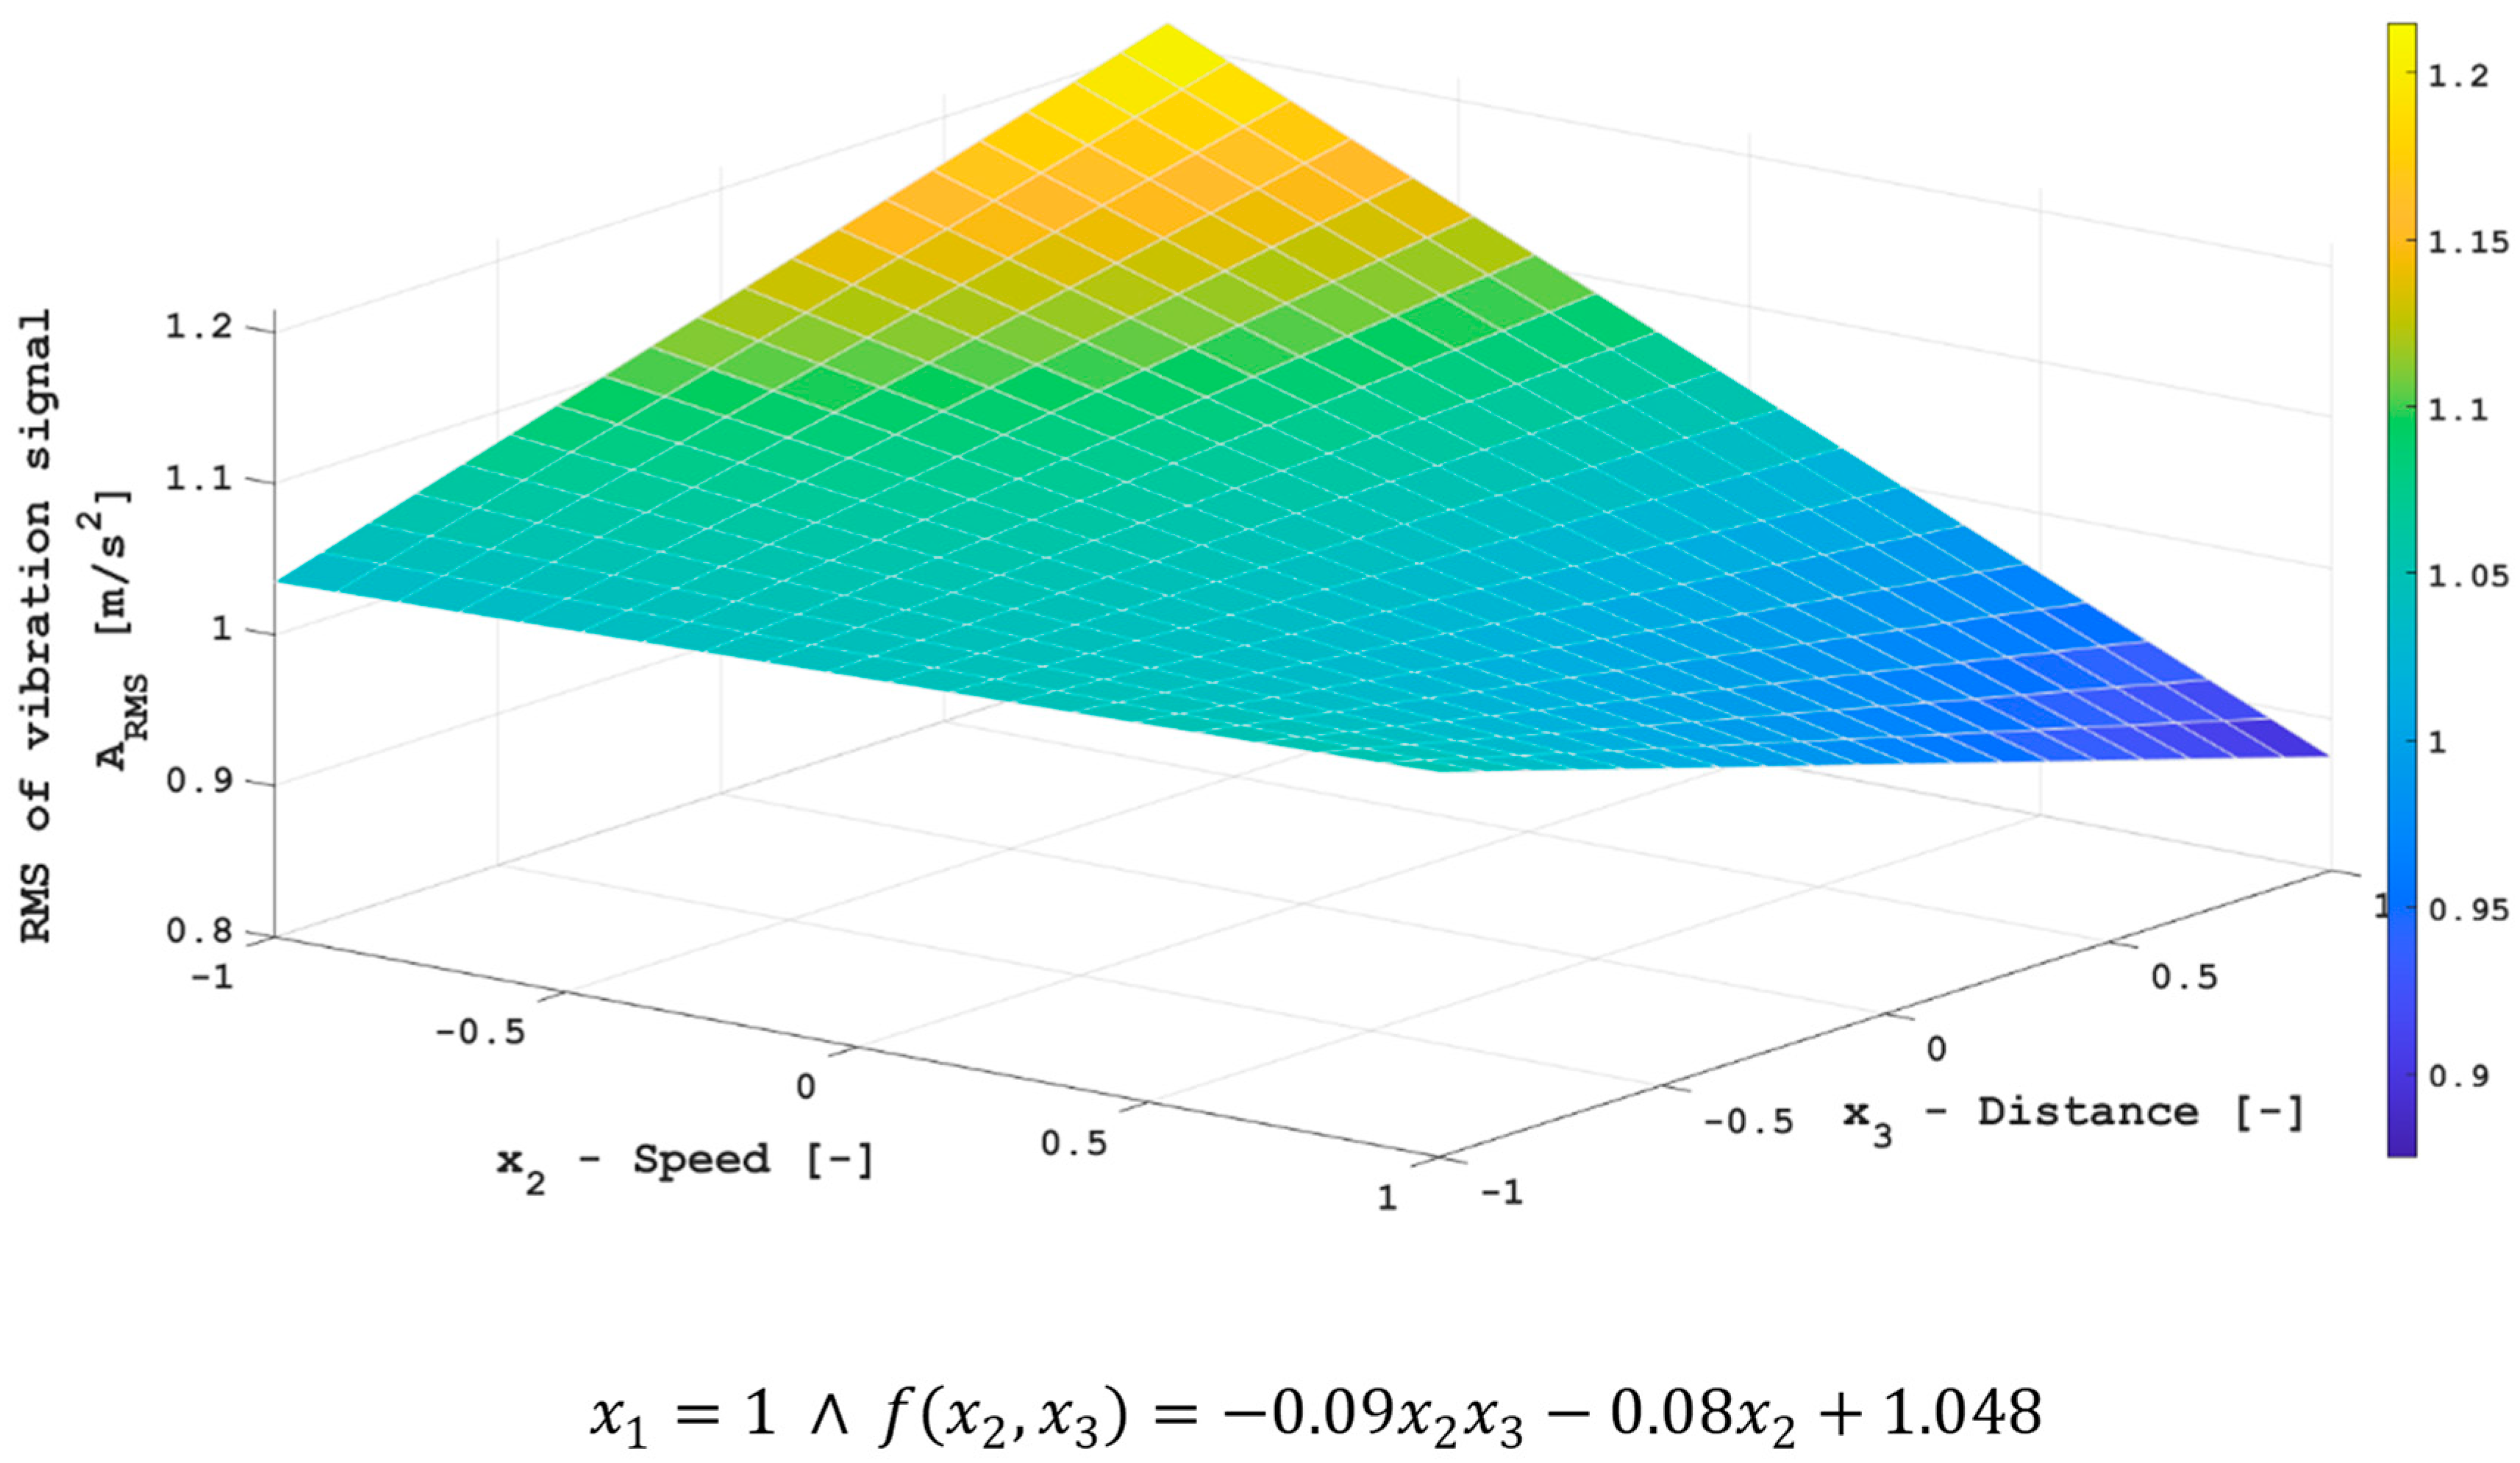
Figure 6, Figure 7 and Figure 8 show the detailed speed relationships of an electric scooter. The vibration acceleration values increase as the speed of the scooter increases. In addition, when moving at a speed of 15 km/h, the distance covered did not affect the value of the change in the generated vibration accelerations.
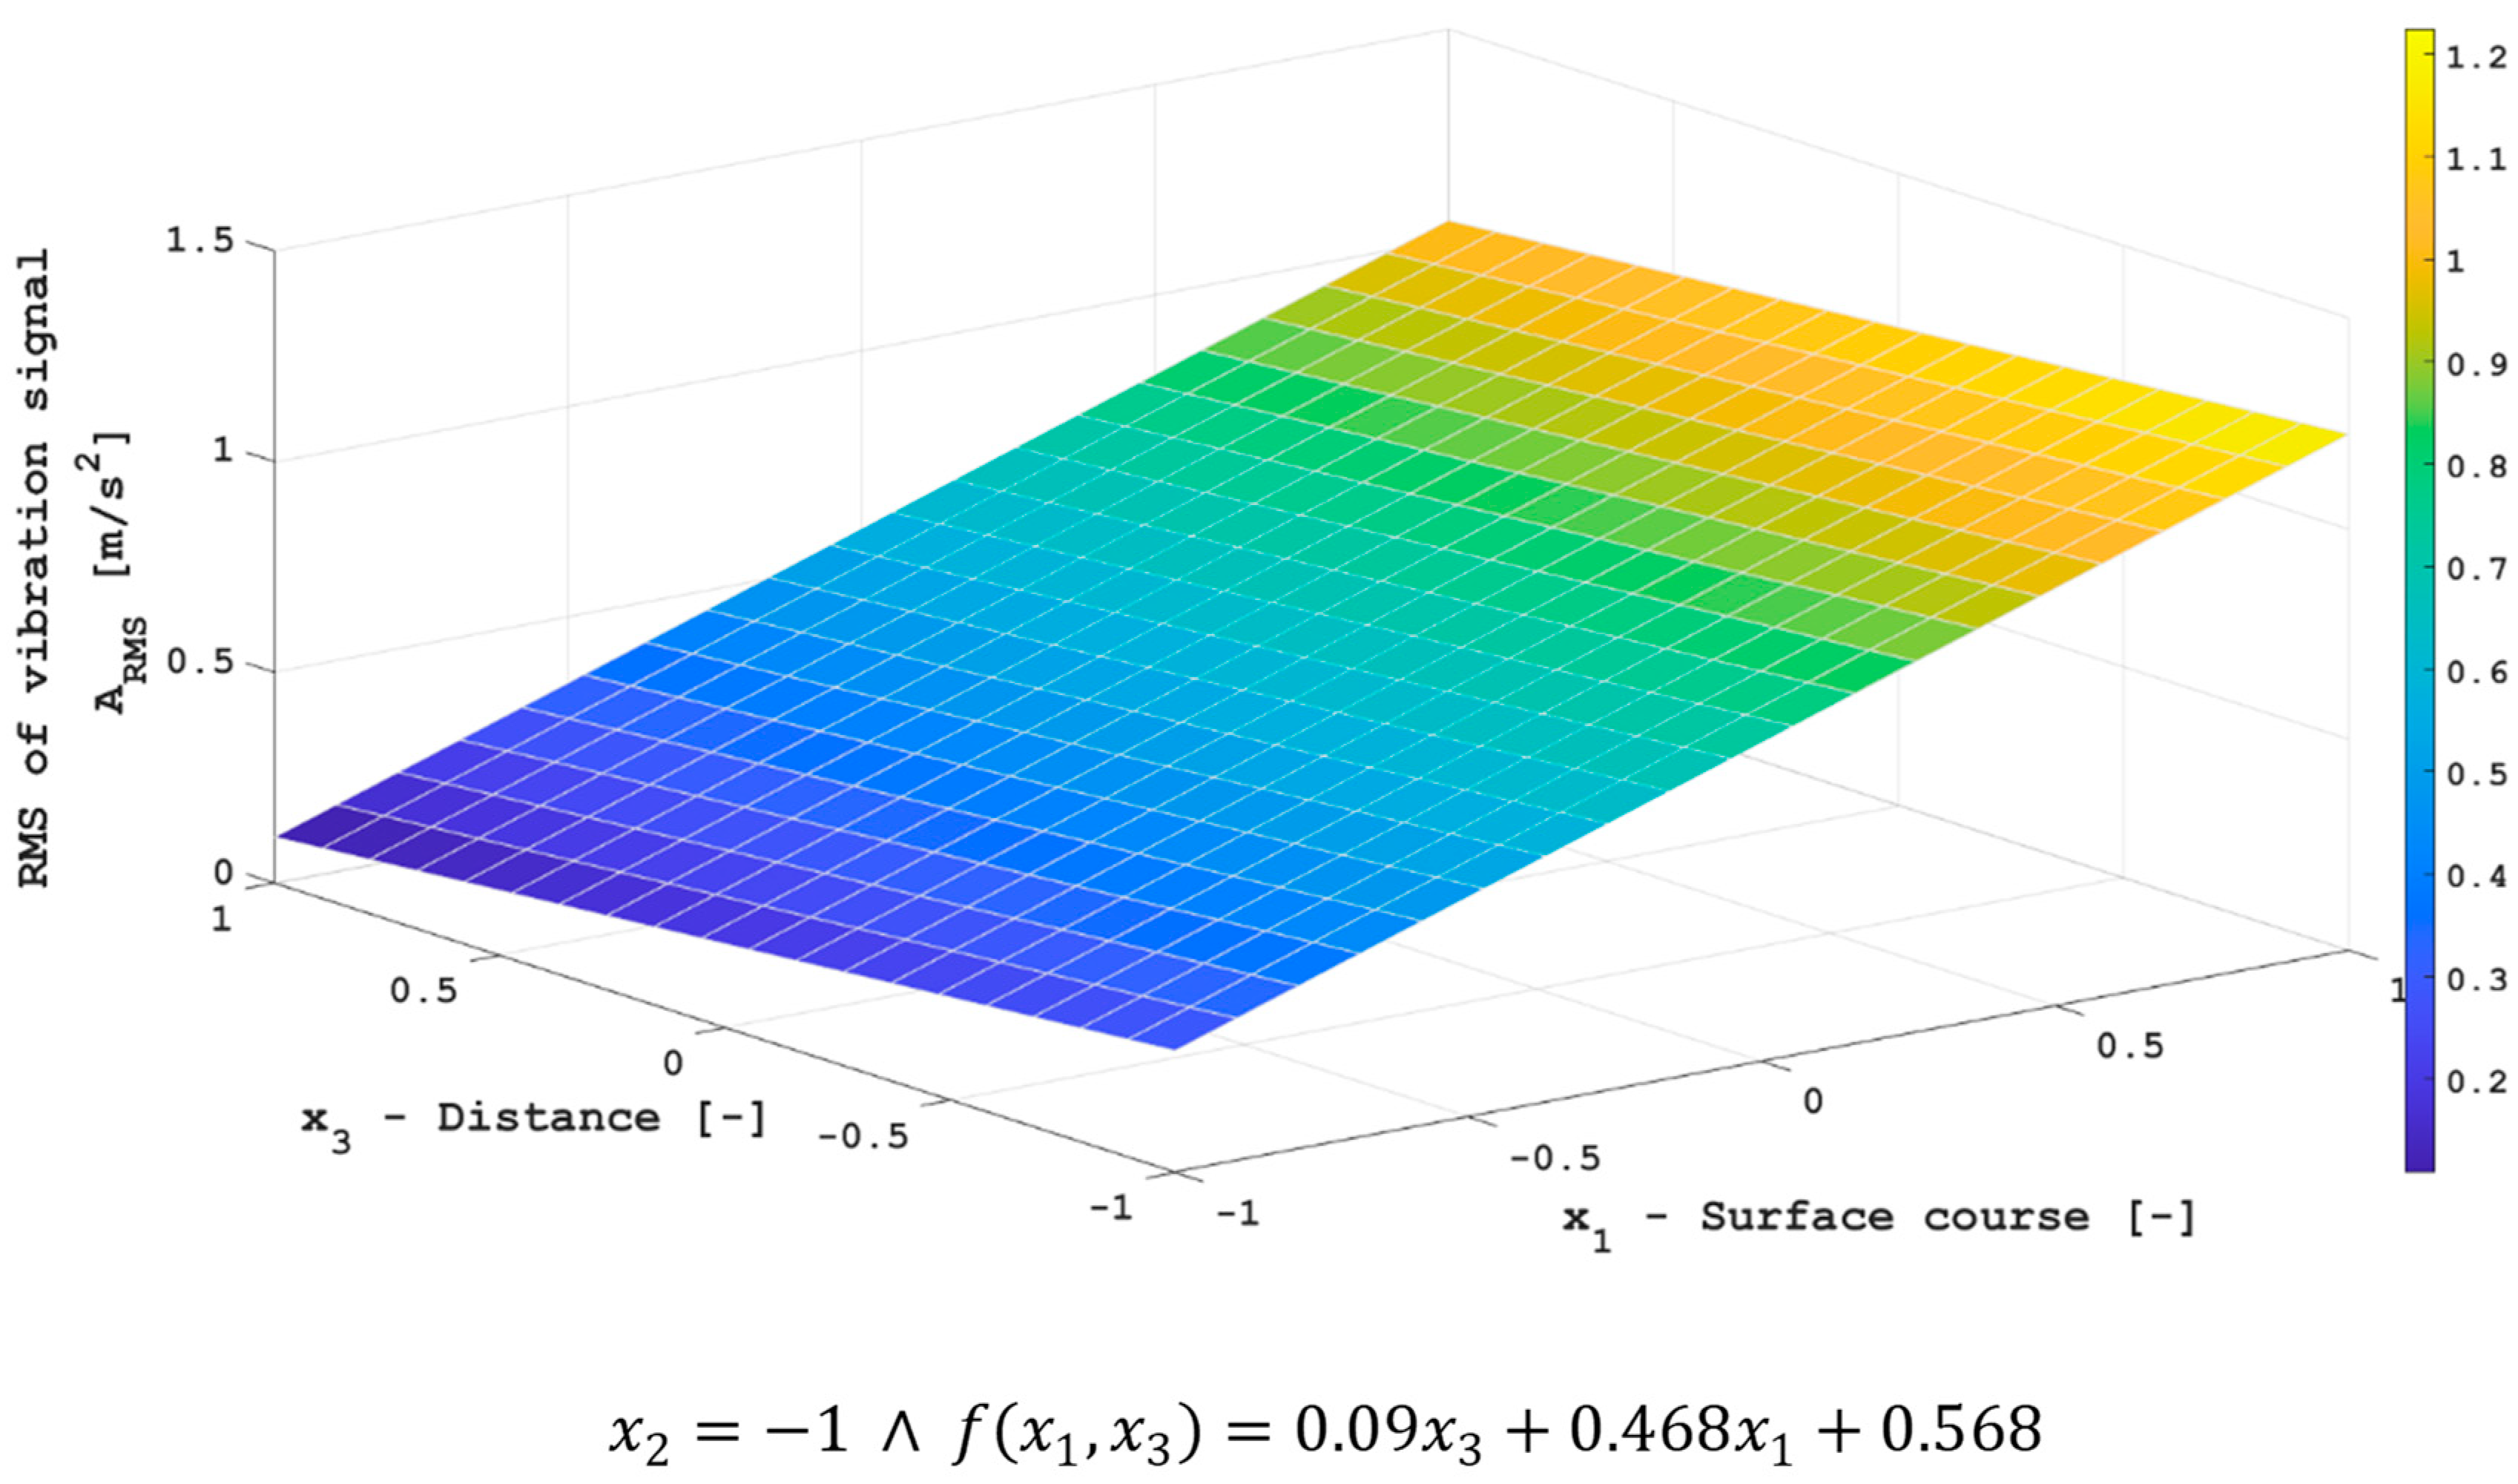
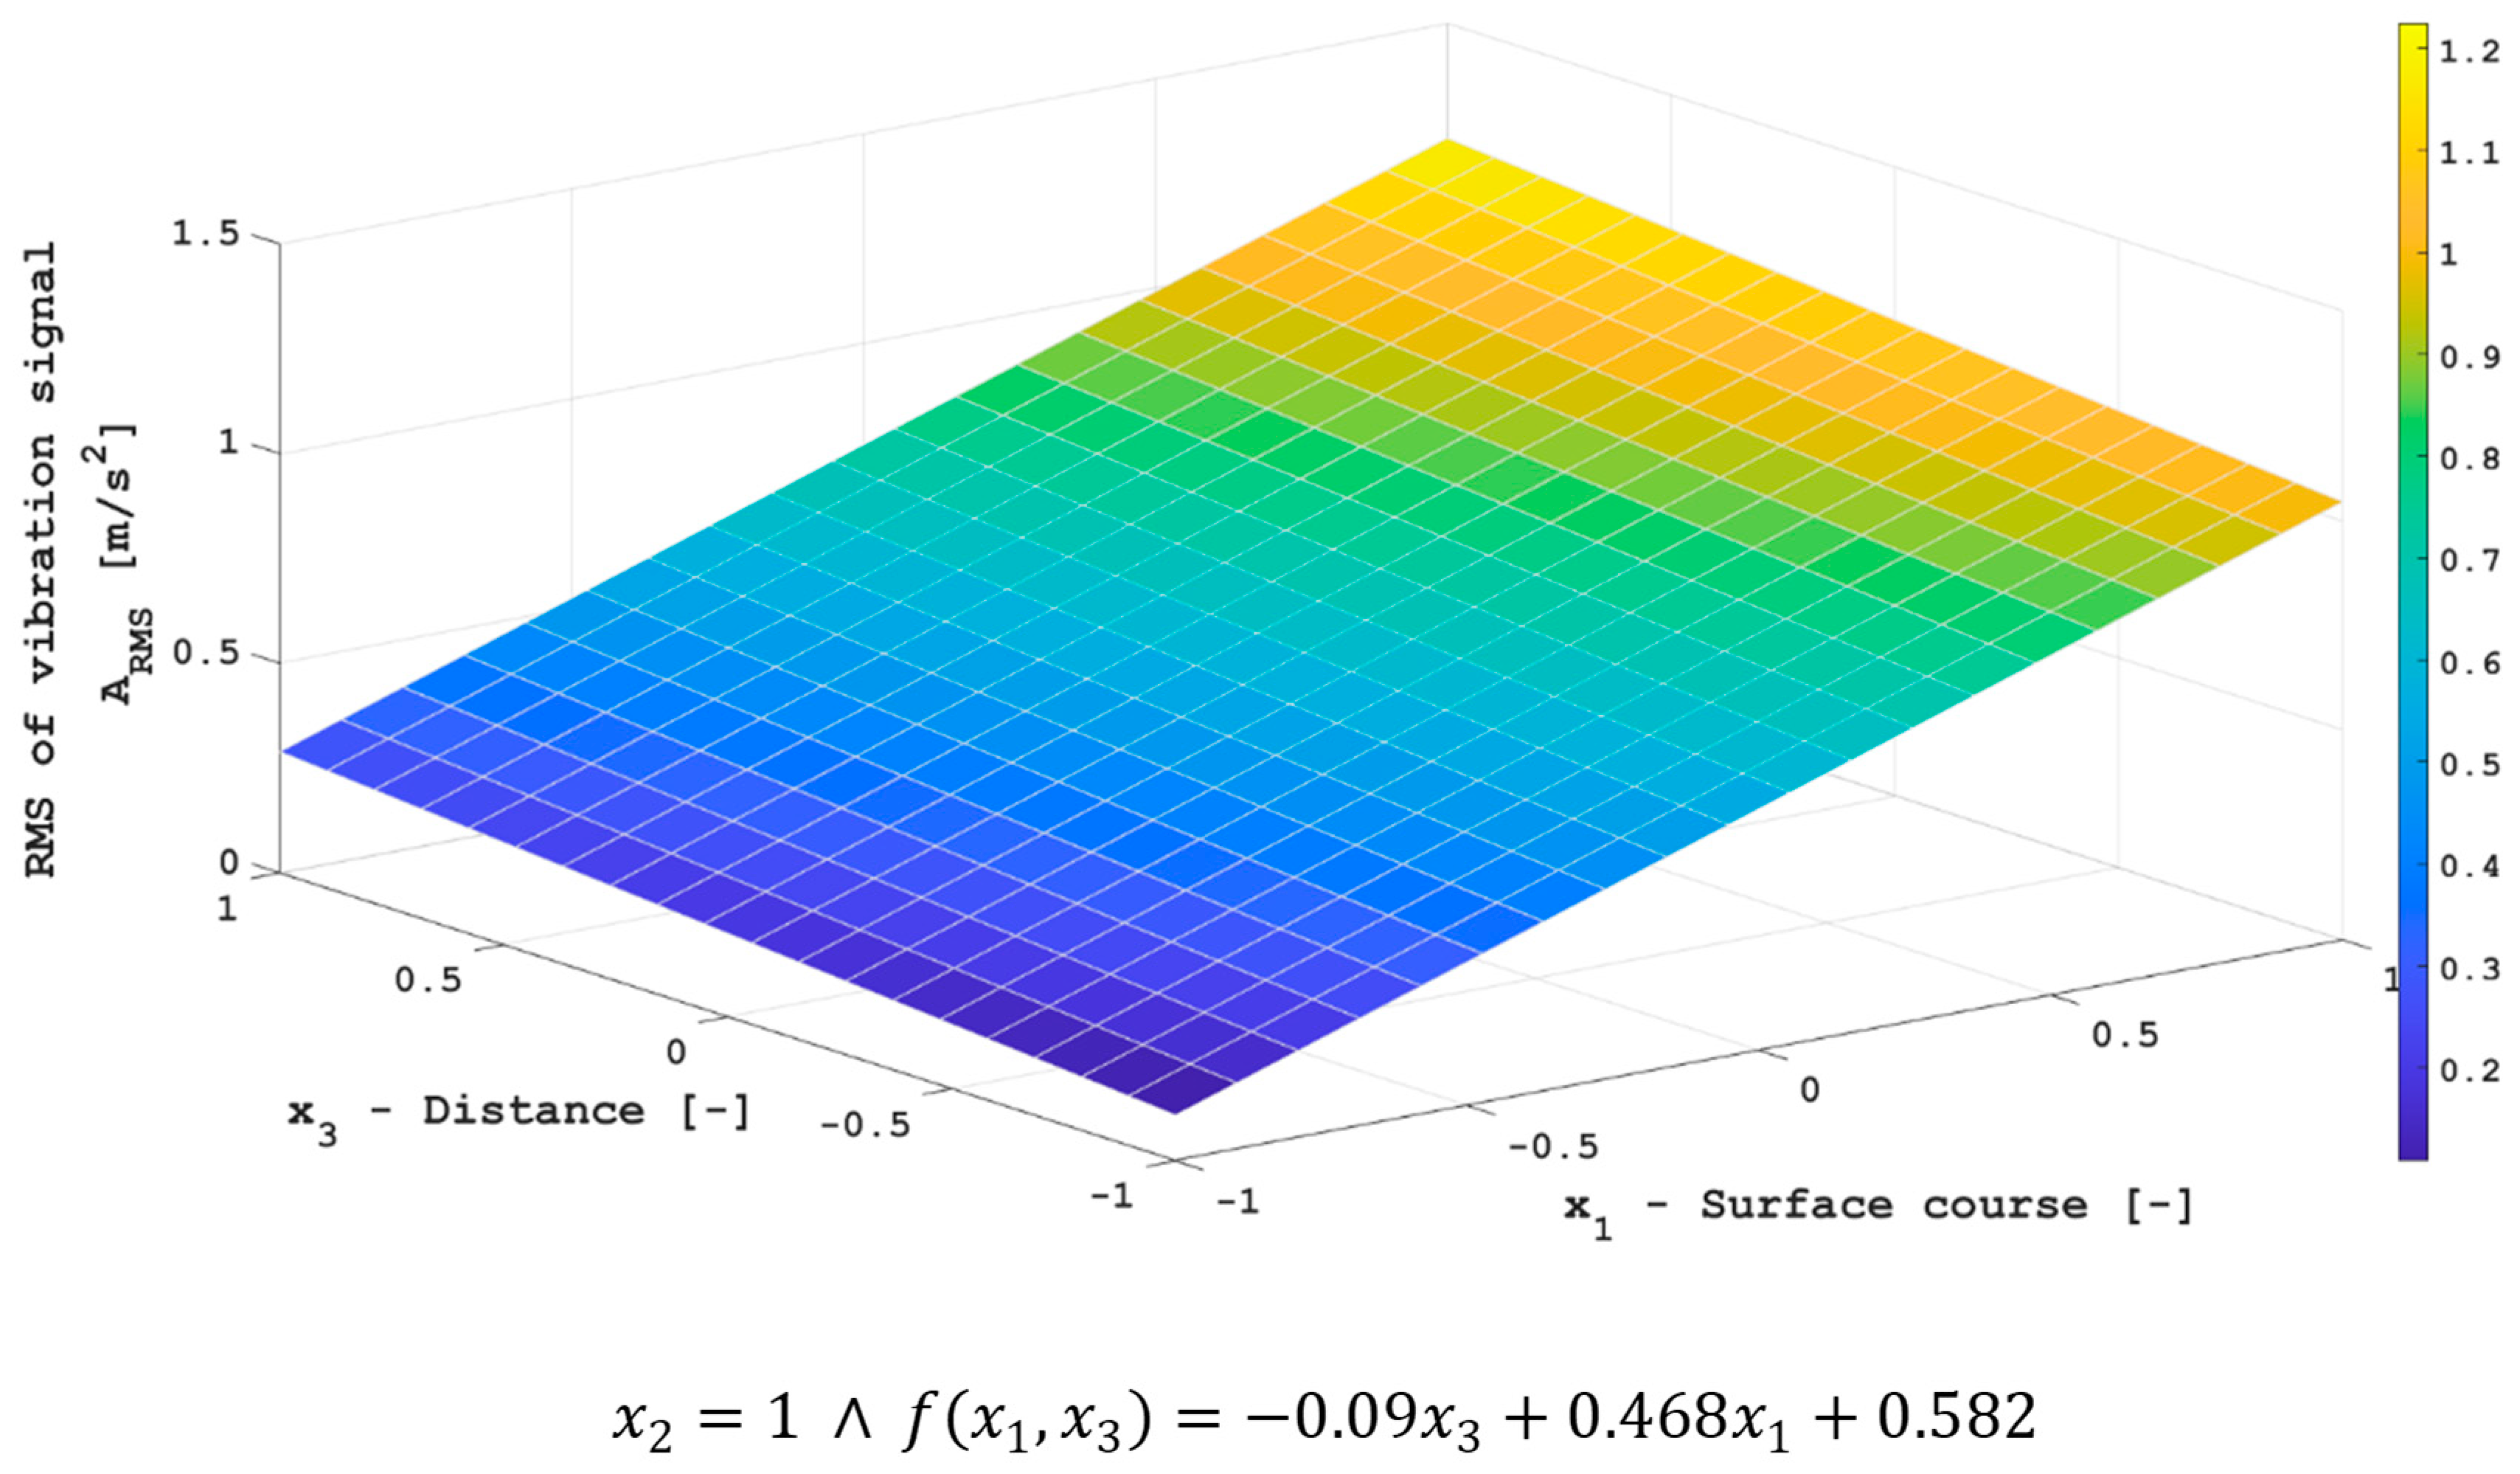
Figure 9, Figure 10 and Figure 11 show the detailed relationships with the distance traveled by an electric scooter. For short distances (1 km), the value of the generated vibrations depends solely on the surface over which the electric scooter moves. The longer the distance traveled, the more the speed of the electric scooter begins to increase the value of the generated vibrations. The biggest influence is the type of surface.
4. Discussion
The results obtained during the conducted research indicate that the measurement and analysis of the value of vibration accelerations affecting a person riding on an electric scooter are very important. The measurements of simple vibration acceleration values that have been taken under selected conditions may exceed the limits of the values to which a person should be subjected. The tests that were carried out should be continued in order to identify the individual characteristic frequencies that occur when moving on an electric scooter. Limiting human exposure to vibrations of a certain frequency is of great importance in terms of the occurrence of individual disorders in human organs, i.e., for the spine, 8 Hz, for the upper limbs, 3 Hz, for the lower limbs, 5 Hz, and for the head, 4–25 Hz [34]. The literature [34,35] indicates that the frequencies that are characteristic of internal organ disorders range from a few Hz to 130 Hz. The longer-term impact of such frequencies on the human body should be avoided. Due to the growing popularity of electric scooters, it is necessary to expand the scope of this research, the results of which are presented in this article.
Referring to research carried out by other scientists, it should be emphasized that there are no clear guidelines regarding the vibrations generated by scooters. In terms of other modes of transport analyzed in the literature, several studies can be found on the impact of the road surface on the user of a motorcycle [27]. The authors found that the vibrations affecting the lower and upper limbs are much higher than those through the motorcycle seat. In addition, by analyzing the vibration and noise values, it can also be concluded that the vibrations through the steering and the noise level in the helmet may exceed the limits of values set in the applicable standards [27].
Munera et al. [36] emphasized in their article that the influence of vibration is little studied in sports, despite the problem’s ubiquity. Vibration can cause discomfort, impair performance, and cause musculoskeletal disorders. The authors also developed a model for predicting the effects of vibrations on the human body.
Kasin et al. [37], who were studying the impact of vibration on the bodies of helicopter pilots, determined that despite the relatively low vibrational impact, at a level of 0.32–0.55 m/s2, pilots complained of back pain in the sacral region.
5. Conclusions
Mechanical vibrations transmitted from a vibrating system to the human body can negatively affect individual tissues and blood vessels directly or can cause vibrations in the whole body or its parts, or even in cellular structures. Long-term exposure to vibrations can cause disturbances in the human body, leading to permanent, irreversible lesions, the types of these changes being dependent on the types of vibrations to which the person is exposed (either general or local). Based on the waveforms of the vibration acceleration spectra of the measurements, the vibration frequencies occurring in this study were determined according to the speed of movement of the scooter and the surface. Based on the studies carried out, the following conclusions can be determined:
- Based on the waveforms of the vibration acceleration spectra of the measurements, the occurring vibration frequencies were determined, depending on the speed of movement of the scooter and the type of surface.
- The occurrence of low frequencies (f < 5 Hz) allowed us to describe a moving human as a rigid body.
- The tests that were carried out should be developed to include additional factors, i.e., tire pressure, driving position, or other road surfaces.
- Based on the waveforms of the vibration acceleration spectra of the measurements, the nuisance vibration frequencies occurring with different speeds of movement of the scooter and two types of surfaces were determined.
- Riding the scooter on paving stones, regardless of the speed of the scooter, is more burdensome for the human body, above all for the upper limbs, than traveling over an asphalt surface.
- It should be noted that in the case of low vehicle speeds, the phenomenon of close natural frequencies from various elements may occur, which will result in an increase in vibration acceleration.
Research into the impact of an electric vehicle on the human body offers a very interesting and modern field of study. The results of the preliminary research presented in this article indicate that it will be useful to expand the research that has already been undertaken. In future studies (which are already being conducted), the impact of an electric vehicle under different test conditions will be analyzed. These studies will be developed using experimental research models that will allow us to determine the impact of selected factors on the values of the generated vibration signals. There is an immediate relevance to addressing the topic of vibrations generated by electric scooters. The research that was planned and carried out for this work confirmed and proved the goals that were set for this study. The research that was performed is limited and should be extended in subsequent tests by including other factors that may affect the generation of vibrations when moving on a vehicle, such as an electric scooter.
Funding
This research received no external funding.
Institutional Review Board Statement
Not applicable.
Informed Consent Statement
Not applicable.
Data Availability Statement
Not applicable.
Conflicts of Interest
The author declares no conflict of interest.
References
- Qian, L.; Pang, Z.; Soopramanien, D. Influences of Car Sharing and Car License Plate Lottery Policy on Consumer Preference and Accessibility in Urban Mobility System: A Stated Choice Experiment in Beijing. J. Clean. Prod. 2022, 362, 132505. [Google Scholar] [CrossRef]
- Regulation (EU) 2019/631 of the European Parliament and of the Council. Available online: https://eur-lex.europa.eu/eli/reg/2019/631/2021-03-01 (accessed on 3 May 2022).
- European Climate Foundation (ECF). Annual Report 2012; European Climate Foundation: The Hague, The Netherlands, 2013. Available online: https://europeanclimate.org/resources/ecf-annual-report-2012/ (accessed on 3 May 2022).
- European Commission. Clean Power for Transport: A European Alternative Fuels Strategy Communication from the Commission to the European Parliament, the Council, the European Economic and Social Committee and the Committee of the Regions; European Commission: Brussels, Belgium, 2013. Available online: https://eurlex.europa.eu/LexUriServ/LexUriServ.do?uri=COM:2013:0017:FIN:EN:PDF (accessed on 3 May 2022).
- European Commission. A European Economic Recovery Plan. Communication from the Commission; European Commission: Brussels, Belgium, 2008. Available online: https://ec.europa.eu/economy_finance/publications/pages/publication13504_en.pdf (accessed on 3 May 2022).
- Wangsness, P.B.; Proost, S.; Rødseth, K.L. Optimal Policies for Electromobility: Joint Assessment of Transport and Electricity Distribution Costs in Norway. Util. Policy 2021, 72, 101247. [Google Scholar] [CrossRef]
- Echaniz, E.; Rodríguez, A.; Cordera, R.; Benavente, J.; Alonso, B.; Sañudo, R. Behavioural Changes in Transport and Future Repercussions of the COVID-19 Outbreak in Spain. Transp. Policy 2021, 111, 38–52. [Google Scholar] [CrossRef]
- Doody, B.J.; Schwanen, T.; Loorbach, D.A.; Oxenaar, S.; Arnfalk, P.; Svennevik, E.M.C.; Julsrud, T.E.; Farstad, E. Entering, Enduring and Exiting: The Durability of Shared Mobility Arrangements and Habits. Mobilities 2021, 17, 484–500. [Google Scholar] [CrossRef]
- Geronikolos, I.; Potoglou, D. An Exploration of Electric-Car Mobility in Greece: A Stakeholders’ Perspective. Case Stud. Transp. Policy 2021, 9, 906–912. [Google Scholar] [CrossRef]
- Wattana, B.; Wattana, S. Implications of Electric Vehicle Promotion Policy on the Road Transport and Electricity Sectors for Thailand. Energy Strategy Rev. 2022, 42, 100901. [Google Scholar] [CrossRef]
- The European Automobile Manufacturers’ Association. New Passenger Car Registrations, European Union. Available online: https://www.acea.auto/files/20210716_PRPC_2106_FINAL-1.pdf (accessed on 23 May 2022).
- Smart Ride Portal. E-Scooters in Poland. Available online: https://smartride.pl/Strefa_Danych/e-hulajnogi-sharing-polska-drugi-kwartal-2021-roku/ (accessed on 23 May 2022).
- UTO Polska Portal. The Market of e-Scooters. Available online: https://utopolska.pl/rynekdetaliczny-hulajnog-elektrycznych/ (accessed on 23 May 2022).
- Foissaud, N.; Gioldasis, C.; Tamura, S.; Christoforou, Z.; Farhi, N. Free-Floating e-Scooter Usage in Urban Areas: A Spatiotemporal Analysis. J. Transp. Geogr. 2022, 100, 103335. [Google Scholar] [CrossRef]
- Matyja, T.; Kubik, A.; Stanik, Z. Possibility to Use Professional Bicycle Computers for the Scientific Evaluation of Electric Bikes: Trajectory, Distance, and Slope Data. Energies 2022, 15, 758. [Google Scholar] [CrossRef]
- O’Hern, S.; Estgfaeller, N. A scientometric review of powered micromobility. Sustainability 2020, 12, 9505. [Google Scholar] [CrossRef]
- Gebhardt, L.; Ehrenberger, S.; Wolf, C.; Cyganski, R. Can Shared E-Scooters Reduce CO2 Emissions by Substituting Car Trips in Germany? Transp. Res. Part D Transp. Environ. 2022, 109, 103328. [Google Scholar] [CrossRef]
- Sanders, R.L.; da Silva Brum-Bastos, V.; Nelson, T.A. Insights from a Pilot Investigating the Impacts of Shared E-Scooter Use on Physical Activity Using a Single-Case Design Methodology. J. Transp. Health 2022, 25, 101379. [Google Scholar] [CrossRef]
- Wang, K.; Qian, X.; Fitch, D.T.; Lee, Y.; Malik, J.; Circella, G. What Travel Modes Do Shared E-Scooters Displace? A Review of Recent Research Findings. Transp. Rev. 2022, 1, 1–27. [Google Scholar] [CrossRef]
- Öztaş Karlı, R.G.; Karlı, H.; Çelikyay, H.S. Investigating the Acceptance of Shared E-Scooters: Empirical Evidence from Turkey. Case Stud. Transp. Policy 2022, 10, 1058–1068. [Google Scholar] [CrossRef]
- Leurent, F. What Is the Value of Swappable Batteries for a Shared E-Scooter Service? Res. Transp. Bus. Manag. 2022, 43, 100843. [Google Scholar] [CrossRef]
- Lin, M.-D.; Liu, P.-Y.; Yang, M.-D.; Lin, Y.-H. Optimized Allocation of Scooter Battery Swapping Station under Demand Uncertainty. Sustain. Cities Soc. 2021, 71, 102963. [Google Scholar] [CrossRef]
- Kazemzadeh, K.; Sprei, F. Towards an Electric Scooter Level of Service: A Review and Framework. Travel Behav. Soc. 2022, 29, 149–164. [Google Scholar] [CrossRef]
- Brezovec, P.; Hampl, N. Electric Vehicles Ready for Breakthrough in MaaS? Consumer Adoption of E-Car Sharing and E-Scooter Sharing as a Part of Mobility-as-a-Service (MaaS). Energies 2021, 14, 1088. [Google Scholar] [CrossRef]
- Liazos, A.; Iliopoulou, C.; Kepaptsoglou, K.; Bakogiannis, E. Geofence Planning for Electric Scooters. Transp. Res. Part D Transp. Environ. 2022, 102, 103149. [Google Scholar] [CrossRef]
- The Role of Micro-Mobility in MaaS: First-Hand Insights from TIER Mobility. Available online: https://www.intelligenttransport.com/transport-articles/128716/micro-mobility-maas-tier-mobility/ (accessed on 23 May 2022).
- Figlus, T.; Szafraniec, P.; Skrúcaný, T. Methods of Measuring and Processing Signals during Tests of the Exposure of a Motorcycle Driver to Vibration and Noise. Int. J. Environ. Res. Public Health 2019, 16, 3145. [Google Scholar] [CrossRef]
- Bozzi, A.D.; Aguilera, A. Shared E-Scooters: A Review of Uses, Health and Environmental Impacts, and Policy Implications of a New Micro-Mobility Service. Sustainability 2021, 13, 8676. [Google Scholar] [CrossRef]
- Dias, G.; Arsenio, E.; Ribeiro, P. The Role of Shared E-Scooter Systems in Urban Sustainability and Resilience during the Covid-19 Mobility Restrictions. Sustainability 2021, 13, 7084. [Google Scholar] [CrossRef]
- Li, A.; Zhao, P.; Liu, X.; Mansourian, A.; Axhausen, K.W.; Qu, X. Comprehensive Comparison of E-Scooter Sharing Mobility: Evidence from 30 European Cities. Transp. Res. Part D Transp. Environ. 2022, 105, 103229. [Google Scholar] [CrossRef]
- Dąbrowski, Z.; Dziurdź, J. New concept of using coherence function in digital signal analysis. Mach. Dyn. Probl. 2007, 31, 25–31. [Google Scholar]
- Cioch, W.; Knapik, O.; Leśkow, J. Finding a frequency signature for a cyclostationary signal with applications to wheel bearing diagnostics. Mech. Syst. Signal Process. 2013, 38, 55–64. [Google Scholar] [CrossRef]
- Engel, Z. Vibration in Technology; Zakład Narodowy im. Ossolińskich: Wrocław, Poland, 1981. [Google Scholar]
- Nader, M. Vibration and Noise in Transport; Oficyna Wydawnicza Politechniki Warszawskiej: Warsow, Poland, 2016. [Google Scholar]
- Griffin, M.J. Handbook of Human Vibration; Academic Press Ltd.: London, UK, 1990. [Google Scholar]
- Munera, M.; Chiementin, X.; Crequy, S.; Bertucci, W. Physical Risk Associated with Vibration at Cycling. Mech. Ind. 2014, 15, 535–540. [Google Scholar] [CrossRef]
- Kåsin, J.I.; Kjellevand, T.O.; Kjekshus, J.; Nesheim, G.B.; Wagstaff, A. CT Examination of the Pericardium and Lungs in Helicopter Pilots Exposed to Vibration and Noise. Aviat. Space Environ. Med. 2012, 83, 858–864. [Google Scholar] [CrossRef]
Figure 1.
The research schedule for performing the research.

Figure 2.
Diagram of the installation of the measuring sensor and the recording system.

Figure 3.
ARMS signal values, depending on the speed of the electric scooter and the distance traveled when moving on an asphalt road.
Figure 3.
ARMS signal values, depending on the speed of the electric scooter and the distance traveled when moving on an asphalt road.

Figure 4.
ARMS signal values, depending on the speed of the electric scooter and the distance traveled when moving on a mixed-surface road.
Figure 4.
ARMS signal values, depending on the speed of the electric scooter and the distance traveled when moving on a mixed-surface road.

Figure 5.
ARMS signal values, depending on the speed of the electric scooter and the distance traveled when moving on paving stones.
Figure 5.
ARMS signal values, depending on the speed of the electric scooter and the distance traveled when moving on paving stones.

Figure 6.
ARMS signal values, depending on the surface course and the distance traveled when moving an electric scooter at a speed of 10 km/h.
Figure 6.
ARMS signal values, depending on the surface course and the distance traveled when moving an electric scooter at a speed of 10 km/h.

Figure 7.
ARMS signal values, depending on the surface course and the distance traveled, when moving an electric scooter at a speed of 15 km/h.
Figure 7.
ARMS signal values, depending on the surface course and the distance traveled, when moving an electric scooter at a speed of 15 km/h.

Figure 8.
ARMS signal values depending on the surface course and the distance traveled, when moving an electric scooter at a speed of 20 km/h.
Figure 8.
ARMS signal values depending on the surface course and the distance traveled, when moving an electric scooter at a speed of 20 km/h.

Figure 9.
ARMS signal values, depending on the surface course and the speed of the electric scooter when covering a distance of 1 km.
Figure 9.
ARMS signal values, depending on the surface course and the speed of the electric scooter when covering a distance of 1 km.

Figure 10.
ARMS signal values, depending on the surface course and the speed of the electric scooter when covering a distance of 3 km.
Figure 10.
ARMS signal values, depending on the surface course and the speed of the electric scooter when covering a distance of 3 km.

Figure 11.
ARMS signal values, depending on the surface course and the speed of the electric scooter when covering a distance of 5 km.
Figure 11.
ARMS signal values, depending on the surface course and the speed of the electric scooter when covering a distance of 5 km.


Table 1.
The research plan.
| Sample No. | x1 | x2 | x3 |
|---|---|---|---|
| 1 | −1 | −1 | 1 |
| 2 | 1 | −1 | −1 |
| 3 | −1 | 1 | −1 |
| 4 | 1 | 1 | 1 |
| 5 | −1 | 0 | 0 |
| 6 | 1 | 0 | 0 |
| 7 | 0 | −1 | 0 |
| 8 | 0 | 1 | 0 |
| 9 | 0 | 0 | −1 |
| 10 | 0 | 0 | 1 |
| 11 | 0 | 0 | 0 |
Table 2.
The research plan results.
| Sample No. | Surface Course (x1) | Speed [km/h] (x2) | Distance [km] (x3) | ARMS [m/s2] |
|---|---|---|---|---|
| 1 | asphalt | 10 | 5 | 0.192 |
| 2 | paving | 10 | 1 | 1.136 |
| 3 | asphalt | 20 | 1 | 0.147 |
| 4 | paving | 20 | 5 | 0.705 |
| 5 | asphalt | 15 | 3 | 0.167 |
| 6 | paving | 15 | 3 | 1.104 |
| 7 | mixed surface (paving and asphalt) | 10 | 3 | 0.578 |
| 8 | mixed surface (paving and asphalt) | 20 | 3 | 0.397 |
| 9 | mixed surface (paving and asphalt) | 15 | 1 | 0.610 |
| 10 | mixed surface (paving and asphalt) | 15 | 5 | 0.547 |
| 11 | mixed surface (paving and asphalt) | 15 | 3 | 0.555 |
Publisher’s Note: MDPI stays neutral with regard to jurisdictional claims in published maps and institutional affiliations. |
© 2022 by the author. Licensee MDPI, Basel, Switzerland. This article is an open access article distributed under the terms and conditions of the Creative Commons Attribution (CC BY) license (https://creativecommons.org/licenses/by/4.0/).
Share and Cite
MDPI and ACS Style
Kubik, A. Impact of the Use of Electric Scooters from Shared Mobility Systems on the Users. Smart Cities 2022, 5, 1079-1091. https://doi.org/10.3390/smartcities5030054
AMA Style
Kubik A. Impact of the Use of Electric Scooters from Shared Mobility Systems on the Users. Smart Cities. 2022; 5(3):1079-1091. https://doi.org/10.3390/smartcities5030054
Chicago/Turabian StyleKubik, Andrzej. 2022. "Impact of the Use of Electric Scooters from Shared Mobility Systems on the Users" Smart Cities 5, no. 3: 1079-1091. https://doi.org/10.3390/smartcities5030054