Article

A Look into the Past: Tracing Ancient Sustainable Manuring Practices by Thorough P Speciation of Northern European Anthrosols

1
Faculty of Agricultural and Environmental Sciences, Division Soil Science; University of Rostock; Justus-von-Liebig-Weg 6; 18051 Rostock, Germany
2
Canadian Light Source Inc., University of Saskatchewan, 44 Innovation Boulevard, Saskatoon, SK S7N 2V3, Canada
*
Author to whom correspondence should be addressed.
Soil Syst. 2019, 3(4), 72; https://doi.org/10.3390/soilsystems3040072
Submission received: 1 August 2019 / Revised: 18 October 2019 / Accepted: 23 October 2019 / Published: 29 October 2019

Abstract

:
Regionally restricted, hums-rich topsoils in Southwest Norway and the Baltic Sea region of Germany and Denmark were formed by inputs of various amendments (combustion residues and marine biomass) and, therefore, were classified as Anthrosols. For a deeper insight into the ancient management practices, we investigated the elemental and P-composition in the upper and underlying horizons from 12 soil profiles in the Jæren region, at the islands of Karmøy and Feøy (Norway), at the island of Fehmarn and the peninsula of Wagrien (Germany), and at the islands of Poel (Germany) and Sjaelland (Denmark). We used aqua regia digestion and the complementary methods of sequential P fractionation, phosphorus K-edge X-ray absorption near edge structure (P-XANES) spectroscopy, and 31P nuclear magnetic resonance (31P-NMR) spectroscopy. Results were compared with the composition of differently amended and/or un-amended soils from other studies. In addition, archaeological literature was used to confirm possible inputs of specific P-containing amendments in ancient agriculture. The P composition from SF of the Anthrosols in Norway (44% NaOH-Pi > 18% NaOH-Po > 14% NaHCO3-Pi, 12% H2SO4-P > 7% NaHCO3-Po > 3% residual-P = 3% resin-P) and complementary archaeological literature provided strong indication for the use of peat, sheep manure, compost, and human excreta. The Anthrosols in the Jæren region have been formed from peat, which had been used as alternative bedding material and had been mixed with sheep and/or cattle manure. The P-composition in the Anthrosols at the island of Fehmarn and at the peninsula of Wagrien (42% H2SO4-P > 25% residual-P > 10% NaOH-Po, 8% NaOH-Pi: > 6% NaHCO3-Pi and NaHCO3-Po, 4% resin-P) resulted from the application of domestic cattle manure. This was strongly supported by archaeological findings of cattle bones in this region, as well as high proportions of Ca-P, as confirmed by P-XANES. The predominance of Po in the Anthrosols at the island of Poel and Sjaelland (31% NaOH-Po > 23% NaHCO3-Po, 21% H2SO4-P > 11% NaOH-Pi > 8% NaHCO3-Pi > 4% residual-P, 3% resin-P, in agreement with results from 31P-NMR) indicated low ancient inputs of various excrement or manure. This was supported by low livestock history at the island of Poel. In conclusion, these agricultural techniques can be considered as sustainable P recycling and soil amendment since they improved soil fertility for many generations.

1. Introduction

Regionally restricted, unusually hums-rich topsoils were found in Northern Europe (the Baltic Sea regions of Germany and Denmark, Southwestern Norway) and were classified as Anthrosols because their formation was explained by strong inputs of organic matter from anthropogenic activities [1,2,3]. Most of these Anthrosols had been amended with marine biomass from the nearby shores, as was confirmed by δ34S values/patterns [2,3]. The above cited studies provided evidence for burning management and/or the input of combustion residues within the past 2000 years from benzene polycarboxylic acid (BPCA) determinations, synchrotron-based X-ray absorption near edge structure (XANES) spectroscopy at the carbon (C) and nitrogen (N) K-edges, and pyrolysis-field ionisation-mass spectrometry (Py-FIMS) and assigned these signatures to ancient agriculture by 14C dating. However, the formation of these Anthrosols has not yet been clarified unequivocally because some of these soils have high concentrations of phosphorus (P) of up to 3500 mg kg−1 [3], which cannot be solely explained by the addition of marine biomass and black carbon (BC). Furthermore, some Anthrosols under study did not contain markers for marine biomass and BC, and the question arises as to which other inputs may have supported their formation. Some soil characteristics (Corg- and BC-contents) revealed strong parallels to various other Anthrosols in Europe, e.g., in Germany [4,5,6,7,8,9,10], the Netherlands [11,12,13,14,15,16], Belgium [17,18], Denmark [11,12,19,20,21,22], England [23], Ireland [24], Scotland [11,12,23,25,26,27,28,29,30,31,32,33], and Russia [34,35,36], and to Terra Preta in South America [37,38,39], all formed by various manuring practices. For example, Wiedner et al. [10] explained the formation of an Anthrosol-spot near the Elbe riverbed in “Brünkendorf 13” in Germany (A horizon: up to 80 cm depth) by the input of waste material (human and animal excrements) and combustion residues. Davidson and Simpson [28] concluded that the input of a mixture of peat (after its usage as bedding for cattle) and seaweed, as well as calcareous sand, were used in the formation of the Anthrosols (A horizons: up to 75 cm) at Orkney (Scotland). In summary of these reports, the question arises as to which type of organic material, other than marine biomass and combustion residues, had been used for the amendment and amelioration of anthropogenic soils at the island of Poel and Fehmarn/Wagrien in Germany, Sjaelland in Denmark, and Karmøy, Feøy, and the Jæren region in Norway.
One possibility for tracing the sources of soil amendments is the analytical detection of P in soils and organic material because P enrichment is an important indicator of human activity and prehistoric manuring [40]. Archaeological investigations demonstrated that human and animal waste/excrements; organic waste derived from plants, fish, meat, and bones; burials; and combustion residues from fire are general sources of P at prehistoric sites [41,42,43,44]. Furthermore, for identifying the sources of soil amendments, it can be helpful to consider elements others than P [21]. For instance, Entwistle and Abrahams [29] provided evidence for the application of shell sand to Scottish historical sites by determining the Ca and Sr concentrations. Nielsen and Kristiansen [21] detected higher concentrations of Na, Ca, K, Mn, and Sr and rare earth elements in addition to P in prehistoric sites from the late Bronze Age and the Pre-Roman Iron Age in comparison to a control soil in Denmark. They attributed this to the incorporation of animal manures, bones, and domestic waste, as well as unweathered subsoil. Furthermore, the occurrence of specific elements (e.g., Fe, Al, or Ca) in various soil extracts and their correlation to P may provide clues for the presence of specific inorganic P species (e.g., Fe-P, Al-P, or Ca-P) [45]. The detection of specific P species in soils and amendments could play a crucial role in decoding ancient manuring activities, because the P composition and P mobility differ in soils depending on the kind of land-use and type of organic amendments [40,46].
One analytical approach for characterizing P in soils and amendments is the sequential P fractionation (SF) according to Hedley et al. [47] and Tiessen and Moir [48], which often has been used to trace the biochemical P cycling in soil [49] and investigate fertilization and management effects on the P composition in agricultural soils [46]. For example, Leinweber et al. [50] analyzed P compounds in animal manures and plaggen soils in Northwest Germany by SF and detected large proportions of NaOH-P and residual-P in most soils, explaining this by reactions of manure-derived P compounds with pedogenic Al- and Fe-oxides and humic substances. Lauer et al. [9] used the SF to describe the organic and inorganic P (Po, Pi) status of Chernozems in Germany in order to reconstruct ancient soil P contents in prehistoric agriculture. Investigations of long-term field experiments with continuous application of soil amendments have shown that various manures changed the P-composition in soils. For example, Scherer and Sharma [51] disclosed higher proportions of moderately labile Pi in a Luvisol after continuous addition (over 38 years) of mineral fertilizer, farmyard manure (FYM), compost from organic household waste, and sewage sludge, as well as higher proportions of labile Pi of FYM and compost from organic household waste. Similar results were observed in a long-term field experiment in New Zealand with the application of sewage sludge every three years in a sandy soil (0–25 cm) [52]. Qian et al. [53] detected significantly higher concentrations of labile P after the addition of cattle manure in comparison to liquid swine manure in a long-term field plot. However, the SF is limited due to possible methodological issues such as a carryover between the extraction steps, humic acid precipitation, acid hydrolysis of Po compounds, complexation and/or occlusion of inorganic P, and incomplete extraction [45]. Therefore, molecular-scale spectroscopic techniques such as P K-edge XANES spectroscopy and 31P nuclear magnetic resonance (31P-NMR) spectroscopy have been applied for the characterization of specific P species in soils (e.g., Kruse et al. [54]).
P K-edge XANES analysis has widely been used in speciation of Pi in soils and amendments (e.g., Abdala et al. [55]; Ajiboye et al. [56,57]; Beauchemin et al. [58]; Kar et al. [59]; Khatiwada et al. [60]; Koch et al. [61]; Liu et al. [62,63,64]; Lombi et al. [65]; Luo et al. [66]; Peak et al. [67]; Prietzel et al. [68]; Sato et al. [69]; Toor et al. [70]). For example, using P K-edge XANES and SF, Kar et al. [59] determined much larger amounts of total P (Pt) dominated by dicalcium phosphate with some aluminum (Al-) and iron phosphate (Fe-P) in a biosolid amended soil compared to an inorganic fertilized soil that was dominated by Po and some apatite-type calcium phosphate. Ajiboye et al. [57] detected β-tricalcium phosphate in biosolids, as well as hog and dairy cattle manured soils, while hydroxyapatite was present in significant amounts only in the unamended soil determined by P K-edge XANES. A long-term field experiment with a continuous application of swine and dairy manure over 40, 20, and 10 years in Brazil showed transformation of crystalline into amorphous Fe- and Al-containing minerals determined by ammonium oxalate extraction and P K-edge XANES [55].
The most common method for Po characterization, 31P-NMR, reveals specific Po species (e.g., phytic acid, DNA) or classes (orthophosphate monoesters, and diesters) in soils and amendments depending on soil use and management (e.g., Annaheim et al. [71]; Doolette et al. [72]; Dou et al. [73]; Hansen et al. [74]; Hawkes et al. [75]; Koopmans et al. [76,77]; Leinweber et al. [50]; Li et al. [78]; McDowell et al. [79,80]; Shafqat et al. [81]). For example, Hawkes et al. [75] analyzed an increase of inorganic orthophosphate (79%) and decreases of orthophosphate monoesters (15%), diesters (3%), phosphonates (0.6%) and pyrophosphate (0.6%) in an old grassland soil after 125 years of continuous inorganic phosphate application in comparison to the unfertilized grassland soil in a long-term field experiments at Rothamsted. Guggenberger et al. [82] revealed an increase of Pi in grassland and arable soils, a simultaneous accumulation of Po under grass and a reduction under arable soils using 31P-NMR. Solomon and Lehmann [83] used 31P-NMR and the SF to determine the effects of land-use changes on the P-composition in tropical soils. They detected a 53% depletion of orthophosphate diesters and 30 and 39% reduction of orthophosphate monoesters in soils after three and 15 years of cultivation after woodland degradation, respectively. Large increases in Pi were detected in acid sandy grassland soils amended with N-P-K fertilizer, poultry manure, and calf and pig slurry for a period of 11 years, while Po increased only in the soil treated with pig slurry [76]. Additionally, a strong accumulation of orthophosphate monoesters was found in upper layers of soils after the application of pig slurry and poultry manures [77]. Apart from manures, Turrion et al. [84] determined an increase in Pi and a decrease in monoester-P and DNA-P in a fire-affected forest Cambisol using SF and 31P-NMR.
As shown above, the SF was very often combined with 31P-NMR and sometimes with P K-edge XANES for the determination of fertilizer effects, but the combination of all three methods for determination of manure effects in soils is rare and so far has only been used by Liu et al. [62] and Koch et al. [61]. Using all three methods compared to only one single method was more successful in disclosing the P-composition in two differently treated agricultural soils from Saskatchewan (Canada), which received a continuous P fertilization for about 28 years followed by either P fertilization or P cessation for about 15 years [63]. Liu et al. [63] reported a decrease in Al-P and Ca-P in unfertilized and an increase in Fe-P in fertilized as well as unfertilized soils by P K-edge XANES and SF. Additionally, they estimated an increase in phytic acid-P determined by P K-edge XANES and total Po and orthophosphate diesters determined by 31P-NMR in unfertilized soils. Koch et al. [61] reported higher P stocks, slightly altered P species composition, and a predominance of Pi in compost, triple super phosphate (TSP), and compost + TSP amended soils in comparison to the controls. Therefore, the combination of the described three P analytical methods appears suitable to gain deeper insights into the effects of manures on the P-composition in soils by overcoming the limitations of each of the single methods.
In conclusion from the above-cited studies, it can be assumed that the source of the soil organic matter (SOM) and soil amendments can be derived from the presence and amount of elements (especially P) and of specific P species in these soils. Therefore, the aim of the present study was to compare the elemental composition and P species of the Anthrosols in Northern Europe with differently amended and/or unamended soils from other studies in order to deduce possible inputs of amendments in ancient agriculture.

2. Materials and Methods

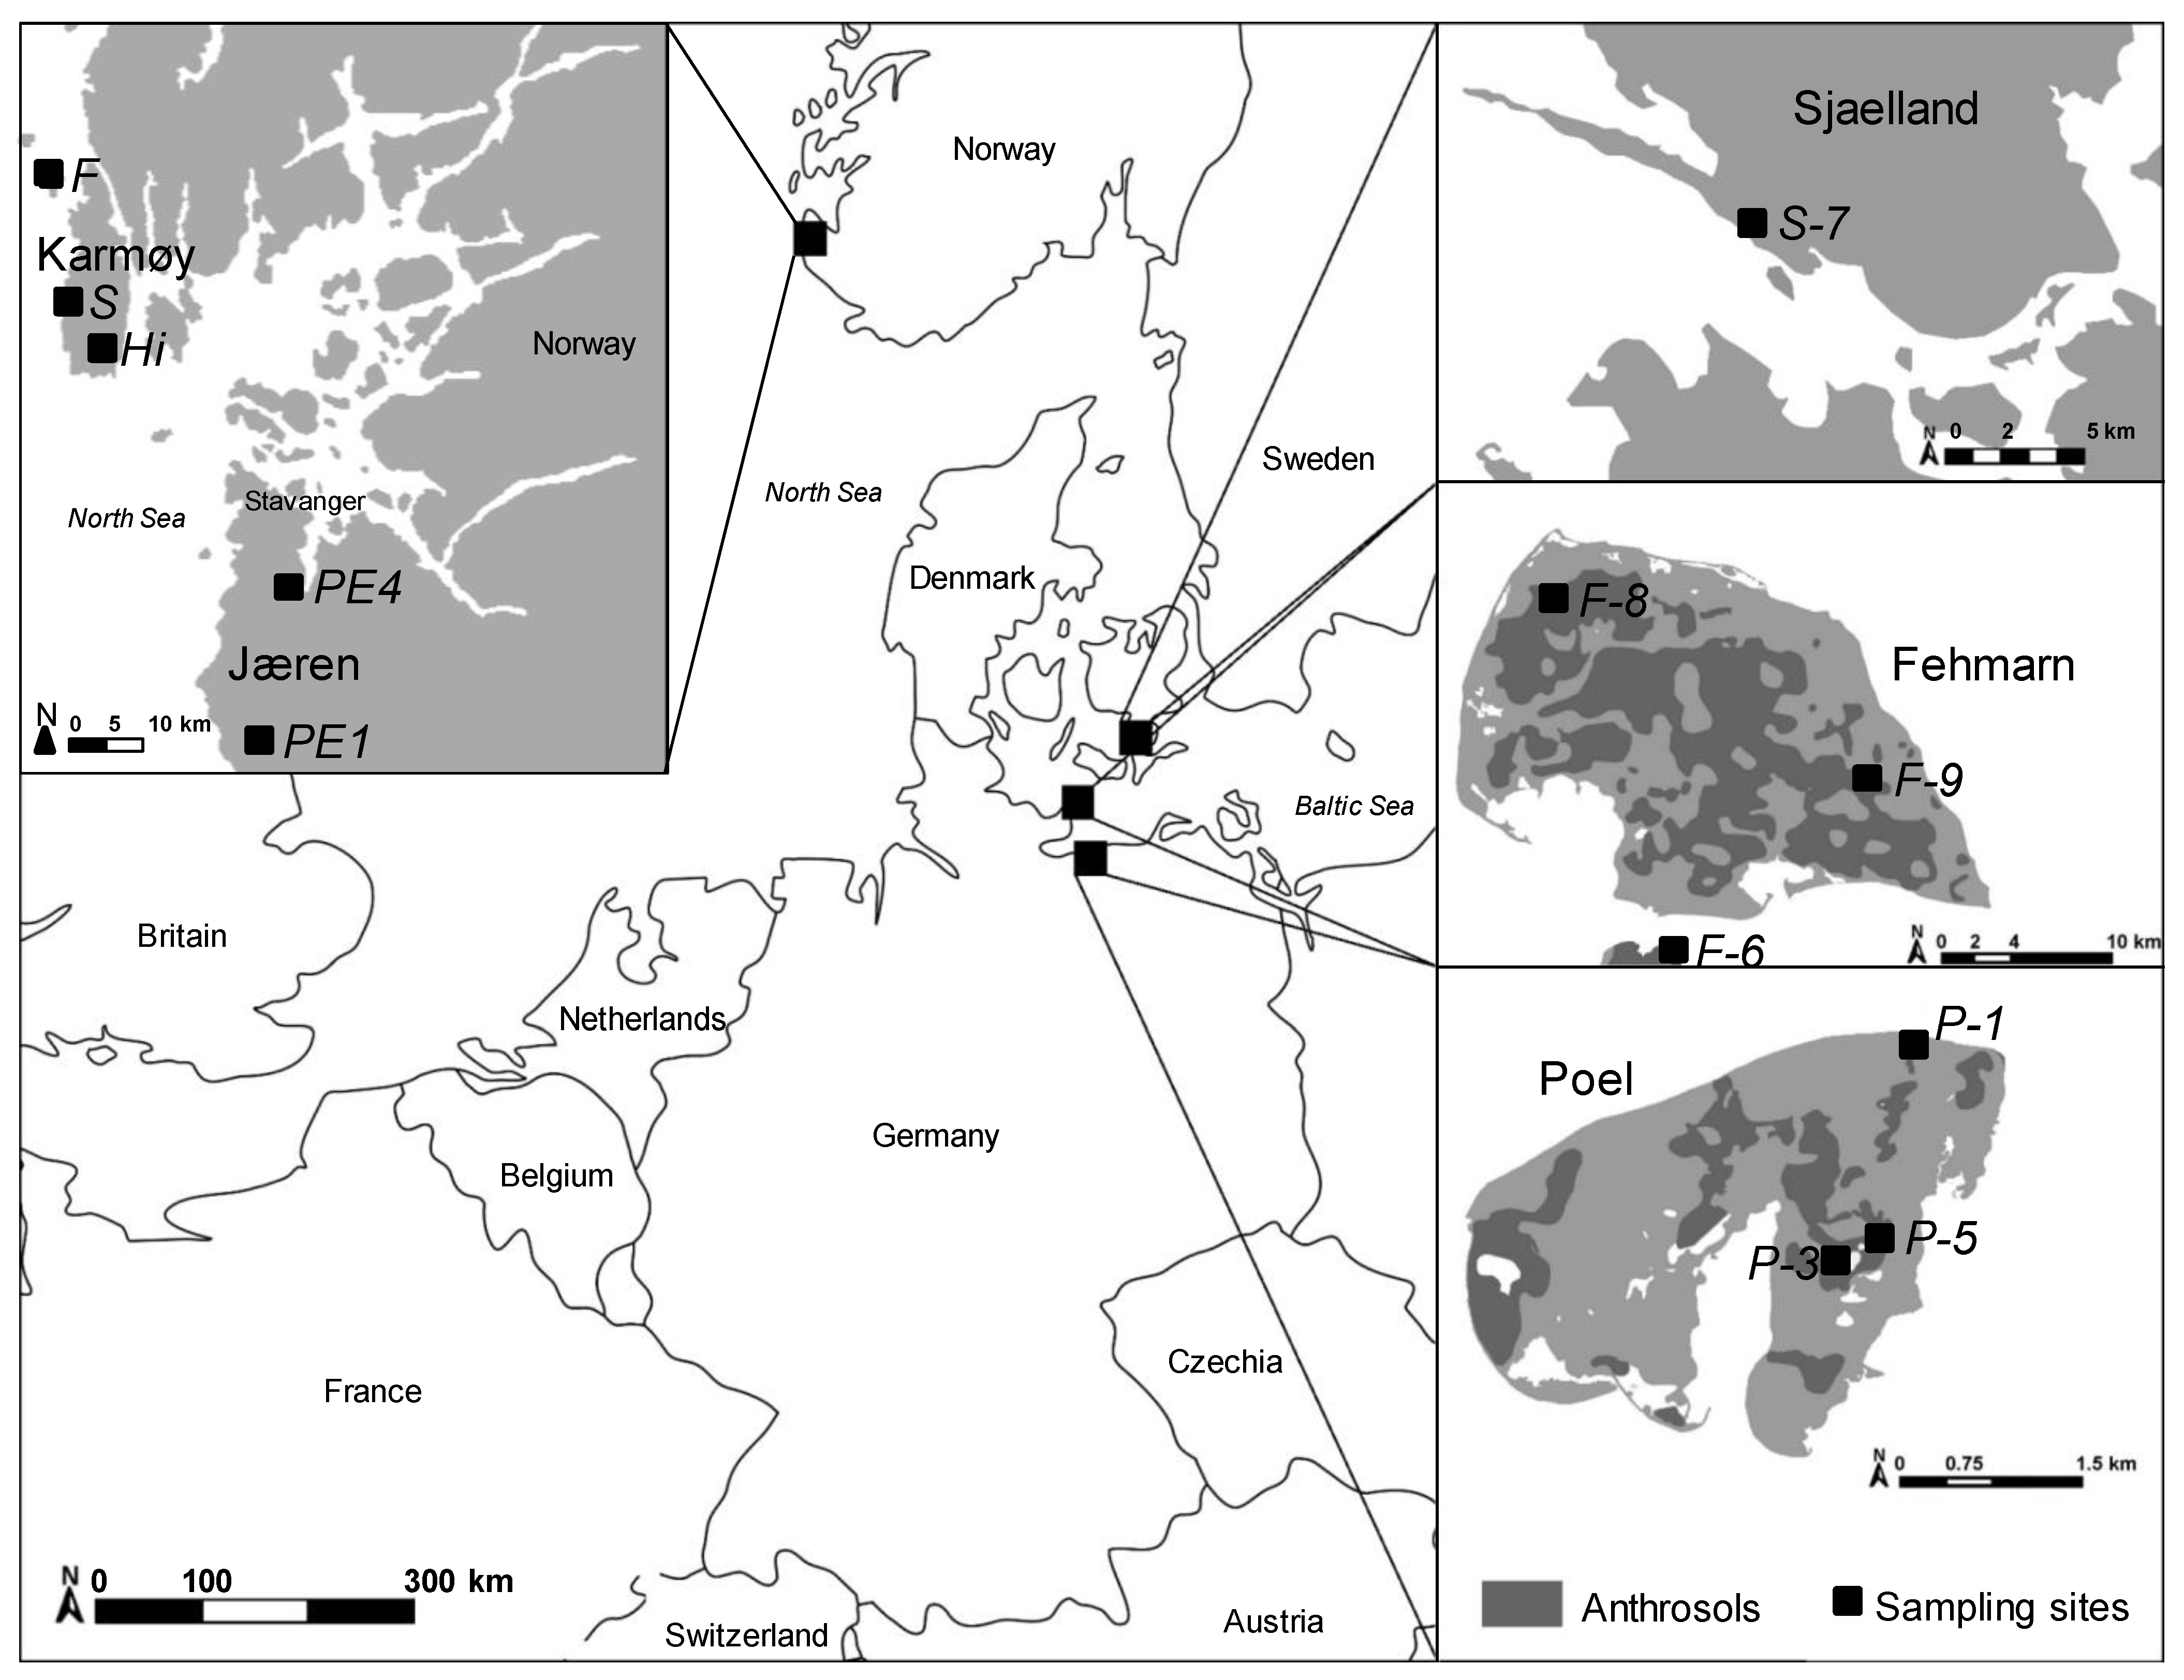
2.1. Study Areas and Soil Sampling

The sampled soil profiles are located at the island of Poel in the Wismar bay (54°0′ N, 11°26′ E) (P-1: Gollwitz; P-3 and P-5: Niendorf); at the islands of Fehmarn (F-8: Westermarkelsdorf; F-9: Gahlendorf) and Wagrien (F-6: Großenbrode) in the Lübeck bay (54°22′ N, 11°5′ E) in Germany, at the island of Sjaelland (55°30′ N, 11°49′ E) (S-7: Vordingborg) in Denmark; and at the islands of Karmøy (59°15′ N, 5°15′ E, 178 m²) (Hi: Hillesland; S: Sandhåland) and Feøy (F) (59°23′ N, 5°9′ E, 1.3 km²) in Rogaland County and in the Jæren region (PE1: Njærheim; PE4: Årsvol) in South West Norway (Figure 1). Descriptions of soil characteristics, vegetation covers, geography, climate, and landscape history of all study regions have been published previously [1,2,3]. The soils were classified as plaggic, hortic, umbric and mollic Anthrosols according to the World Reference Base for Soil resources 2014 as explained in Acksel et al. [2,3]. Examples of profile photographs are shown in the Supplementary Figure S1. The AMS 14C ages of these soils were measured in the humin fraction of the deeper-lying humus-rich horizons [2,3]. The AMS 14C-dating and the complementary archaeological literature of the respective region implied that these soils have been formed between the Nordic Bronze Age (3800 to 2800 BP) and the Roman Iron Age (2700 to 2000 BP) for the soils in the Baltic Sea region and between the Roman Iron Age (2500 to 1500 BP) and the Viking Age (about 1200 to 1000 BP) for the Norwegian soils [2,3]. Out of all profiles described in Acksel et al. [1,2,3], we chose profiles that best represented the respective region for detailed P investigations because the full analytical program could not be run for all profiles/samples assigned to Anthrosols. Selection criterial were markers for anthropogenic influence (Corg- and black carbon-content, sulphur isotope composition), thickness, and 14C age of the humus-rich horizons, all described in previous publications [1,2,3]. For each profile, one soil sample from the upper (0–35 cm) and one from the underlying horizons (26–75 cm) were investigated. Three to six replicates were taken from each horizon and combined for analyses.

2.2. Sample Pretreatment and Chemical Analyses

For chemical analyses, the samples were air-dried (60 °C), sieved < 2 mm and finely ground in a ball mill for 10 min. For determination of total P and concentrations of elements that can be phosphate binding partners such as Al, Ca, Fe, K, Mg, and Mn, 500 mg of milled soil was digested in a microwave with aqua regia (AR) solution. Total elemental concentrations in the solution were measured using an inductively coupled plasma optical emission spectrometer (ICP-OES; PerkinElmer Optima 8300, Waltham, MA, USA) at 214.91 nm (P), 396.15 nm (Al), 317.93 nm (Ca), 238.20 nm (Fe), 766.49 nm (K), 285.21 nm (Mg), and 257.61 nm (Mn). The amount of substance (mol) of all elements within one sample was set to 100% to calculate the relative proportion of each element for quantitative comparisons among the profiles. The concentrations of various P species were determined by the modified sequential extraction method after Hedley et al. [47] and Tiessen and Moir [48]. P-fractions were assigned to labile P (resin-P + NaHCO3-P), moderately labile P (NaOH-P), and relatively stable Ca-P (H2SO4-P). Weighed 500 mg milled soil were sequentially extracted with 30 ml of distilled water in the presence of anion exchange resin, 0.5 M NaHCO3, 0.1 M NaOH, and 1 M H2SO4. The Pt concentration in the solution of the respective fraction was measured by ICP OES at 214.91 nm wavelength. Residual P was calculated by subtraction of the sum of resin-P, NaHCO3-P, NaOH-P, and H2SO4-P from total P of the aqua regia solution. The Molybdate reactive P (Pi) was measured colorimetrically at λ = 882 nm in the NaHCO3- and NaOH-fractions by the method of Murphy and Riley [85]. Organic P (Po) was calculated by Po = Pt − Pi.

2.3. 31P Nuclear Magnetic Resonance Spectroscopy

For identification of Po species by 31P NMR we selected soil profiles according to their P concentrations (Norway: S, F and PE1; Denmark: S-7; Germany: F-6 and P-3). The 31P-NMR spectra were recorded using an inverse gated decoupled (IG) pulse sequence on a Bruker 600 Advance NMR-Spectrometer (Billerica, MA, USA) operating at 242.945 MHz. The sodium hydroxide ethylenediaminetetraacetic acid (NaOH-EDTA) extraction and extract treatment for the recording of 31P-NMR spectra, spiking experiments, calibration procedure and peak assignments are described in detail in Acksel et al. [86].

2.4. P K-Edge X-Ray Absorption Near Edge Structure Spectroscopy

P K-edge XANES spectra were recorded at the Soft X-ray Micro-characterization Beamline (SXRMB) at the Canadian Light Source synchrotron, Saskatoon, SK, Canada. As described by Baumann et al. [87], fluorescence yield of two spots of each dry, powered sample was recorded at photon energies between 2122.5 and 2200.5 eV and a constant dwell time of 4 s. All P K-edge XANES spectra were analysed and fitted (linear combination fitting) using the software ATHENA, Demeter 0.9.25 (Ravel and Newville, 2005; Washington, DC 20375, USA) as described in Baumann et al. [87]. P reference compounds included: KH2PO4, K3PO4, Ca(H2PO4)2 H2O, Ca10(PO4)6(OH)2 (= hydroxylapatite), MgHPO4·3H2O, Mg2O7P2, Mg3(PO4)2 8H2O, NaH2PO4, (NH4)H2PO4, FePO4·4H2O, P-FeOOH (= P adsorbed on goethite), P-Fe2O3 (= P adsorbed on ferrihydrite), AlPO4 × xH2O, Al(PO3)3, P(Al(OH)3) (= P adsorbed on gibbsite), C6H18O24P6 xNa+ yH2O (= phytic acid sodium salt hydrate), ATP (= adenosine-5′-triphosphate 2Na salt hydrate), and C2H8NO4P (= o-phosphorylethanolamine). Only fits in which the share of each compound was ≥ 5% were used. The Hamilton test was employed to test for significant differences between fits of a sample [87]. Results were given as relative proportion of total P.

2.5. Data Calculations and Statistical Treatment

All data were statistically evaluated and tested by the “R” software (v3.0.2, R core Team [88]). Since not all parameters were normally distributed (Shapiro-Wilk Normality Test) differences in the concentrations of elements, total P and P from various fractions between the horizons and the profiles were tested for significance by Kruskal-Wallis test (p < 0.05) (R package: agricolae, command: kruskal, which includes Fisher’s LSD post hoc test). Principal component analysis (PCA) for the separation of the horizons and profiles were computed for the proportions of elements, P fractions from the SF, P species from 31P-NMR and P K-edge XANES. The PCA of the relative proportion of the elemental composition was created without Ca, since the high CaCO3 content in one profile (S) resulted in a distortion of the PCA. The PCA and the boxplot of the relative proportions of P-fractions in the Anthrosols under study and numerous reference values of literature were computed from the Pi and Po concentrations of NaHCO3 + resin, NaOH, and H2SO4 fractions without residual fraction due to missing of residual-P and/or other extraction methods for total P extraction in the literature. The complementarity of the various P-methods and differences in the detected P-concentrations in various extracts were described and discussed in detail by Acksel et al. [86].

3. Results

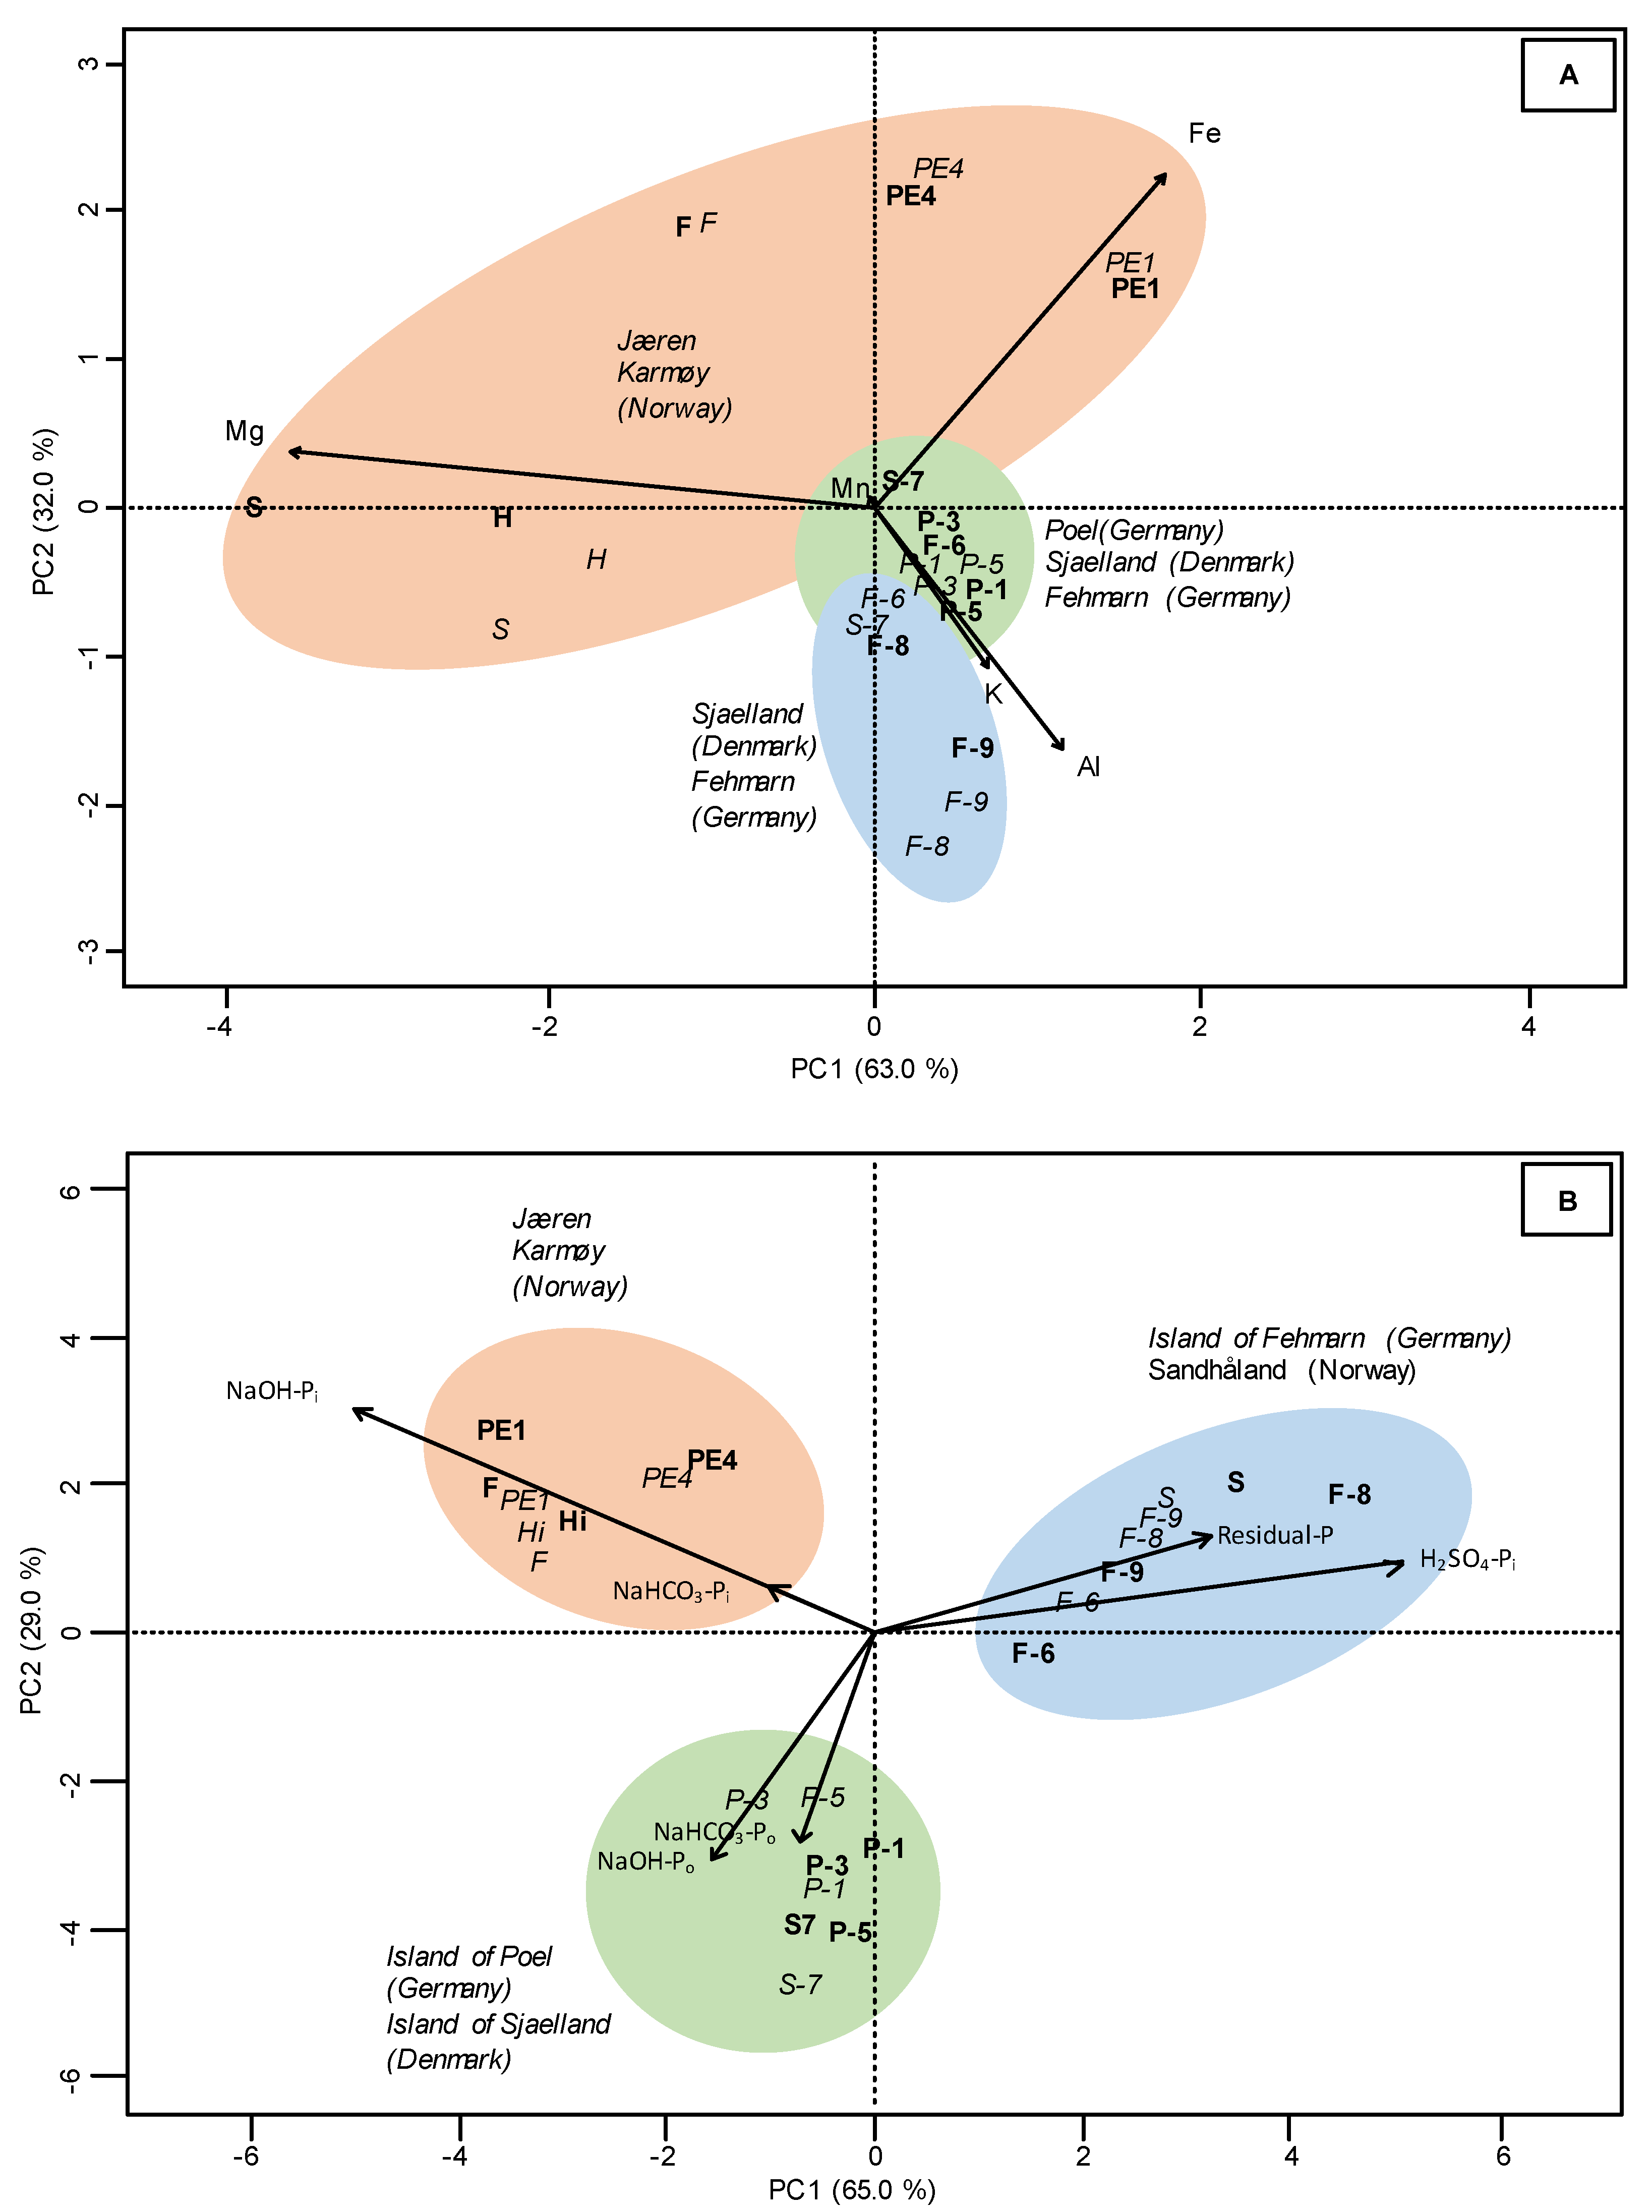
3.1. Total Element Concentrations

Within each profile, the Pt concentrations of horizons differed significantly except the horizons of profile PE1 (Norway) and S-7 (Denmark) (Table 1). In average, the Norwegian soils revealed 6.2 times larger Pt concentrations than the Danish and Germany soils. The highest Pt concentrations were detected in the profiles from F (up to 3682 mg kg−1), Hi (up to 3196 mg kg−1), PE1 (up to 2690 mg kg−1), PE4 (up to 2584 mg kg−1), and S (up to 1118 mg kg−1) from the Norwegian soils that were significantly higher than in the Danish soil (318 to 323 mg kg−1) and from the German soils at Fehmarn/Wagrien (264 to 621 mg kg−1) and Poel (244 to 477 mg kg−1). The elemental proportions of all profiles decreased in the order Al > Fe > Mg > Ca > K > Mn and were strongly dominated by Al (up to 50%) and Fe (up to 36%). The Norwegian profile S was not included into these and the following considerations because of its high Ca content (114,252 mg kg−1, equivalent to 83 %). If we excluded the Ca content of profile S, its elemental composition would also have been dominated by Al (47%) and Fe (24%). The Danish and German soil profiles had higher proportions of Al (41 to 50%) and K (6 to 8%) than the Norwegian profiles (Al: 38 to 45%; K: 1 to 4%). Conversely, the Norwegian soils revealed higher proportions of Fe (24 to 36%) and Mg (7 to 21%) than the other soils (Fe: 24 to 29%; Mg: 9 to 12%). The proportions of the elements Ca (7 to 12%) and Mn (<1 to 2%) were similar among all soils. The differences of the proportions of elements among the soils were clearly explained by PC1 and PC2 of the PCA plot (95%). The PCA strongly separated the Norwegian soils by Fe and Mg from the Danish and German soils by Al and K (Figure 2A).

3.2. Sequential P Fractionation

The Pt concentrations (up to 3916 mg kg−1) of the Norwegian soils were significantly higher than in all other soils (up to 478 mg kg−1) (Table 2). In general, in these soils the P concentrations of the NaOH-Pi fraction (up to 1919 mg kg−1) were significantly higher than in the other soils (up to 83 mg kg−1). The P concentrations of the H2SO4 fraction in the soils decreased in the following order Norway (up to 567 mg kg−1) > Germany (up to 230 mg kg−1) > Denmark (up to 61 mg kg−1). The Po concentrations (NaHCO3-Po and NaOH-Po) in the soils decreased in the following order: Norway (up to 1115 mg kg−1) > Poel and Sjaelland (Germany, Denmark) (up to 223 mg kg−1) > Fehmarn/Wagrien (Germany) (up to 104 mg kg−1). The average P proportions of fractions decreased for most Norwegian soils in the order NaOH-Pi (44%) > NaOH-Po (18%) > NaHCO3-Pi (14%) > H2SO4-P (12%) > NaHCO3-Po (7%) > resin-P (3%) and residual-P (3%). For soils at Fehmarn/Wagrien (Germany) and the Norwegian profile S, the order was H2SO4-P (44%) > residual-P (23%) > NaOH-Po (9%) > NaOH-Pi (8%) > NaHCO3-Pi (7%) > NaHCO3-Po (5%) > resin-P (4%) and for soils at Poel (Germany) and the Danish profile S-7 NaOH-Po (31%) > NaHCO3-Po (23%) > H2SO4-P (21%) > NaOH-Pi (11%) > NaHCO3-Pi (8%) > residual-P (4%) > resin-P (3%). The Norwegian soils showed highest proportions of NaOH fraction (62%). The soils at Fehmarn/Wagrien (Germany) and Norwegian profile S were dominated by H2SO4-P and residual-P fractions (67%) and the soils at Poel (Germany) and the Danish profile S-7 by resin-P + NaHCO3-P (34%) and NaOH-P (42%). The PCA of the proportions of P fractions explained 94% of differences among the soils (Figure 2B). The PC1, which explained 65% of the variance, separated the Fehmarn/Wagrien soils (Germany) and Norwegian profile S from the other soils. The PC2 (29%) separated the soils at Poel (Germany) and Danish profile S-7 from all other soils.

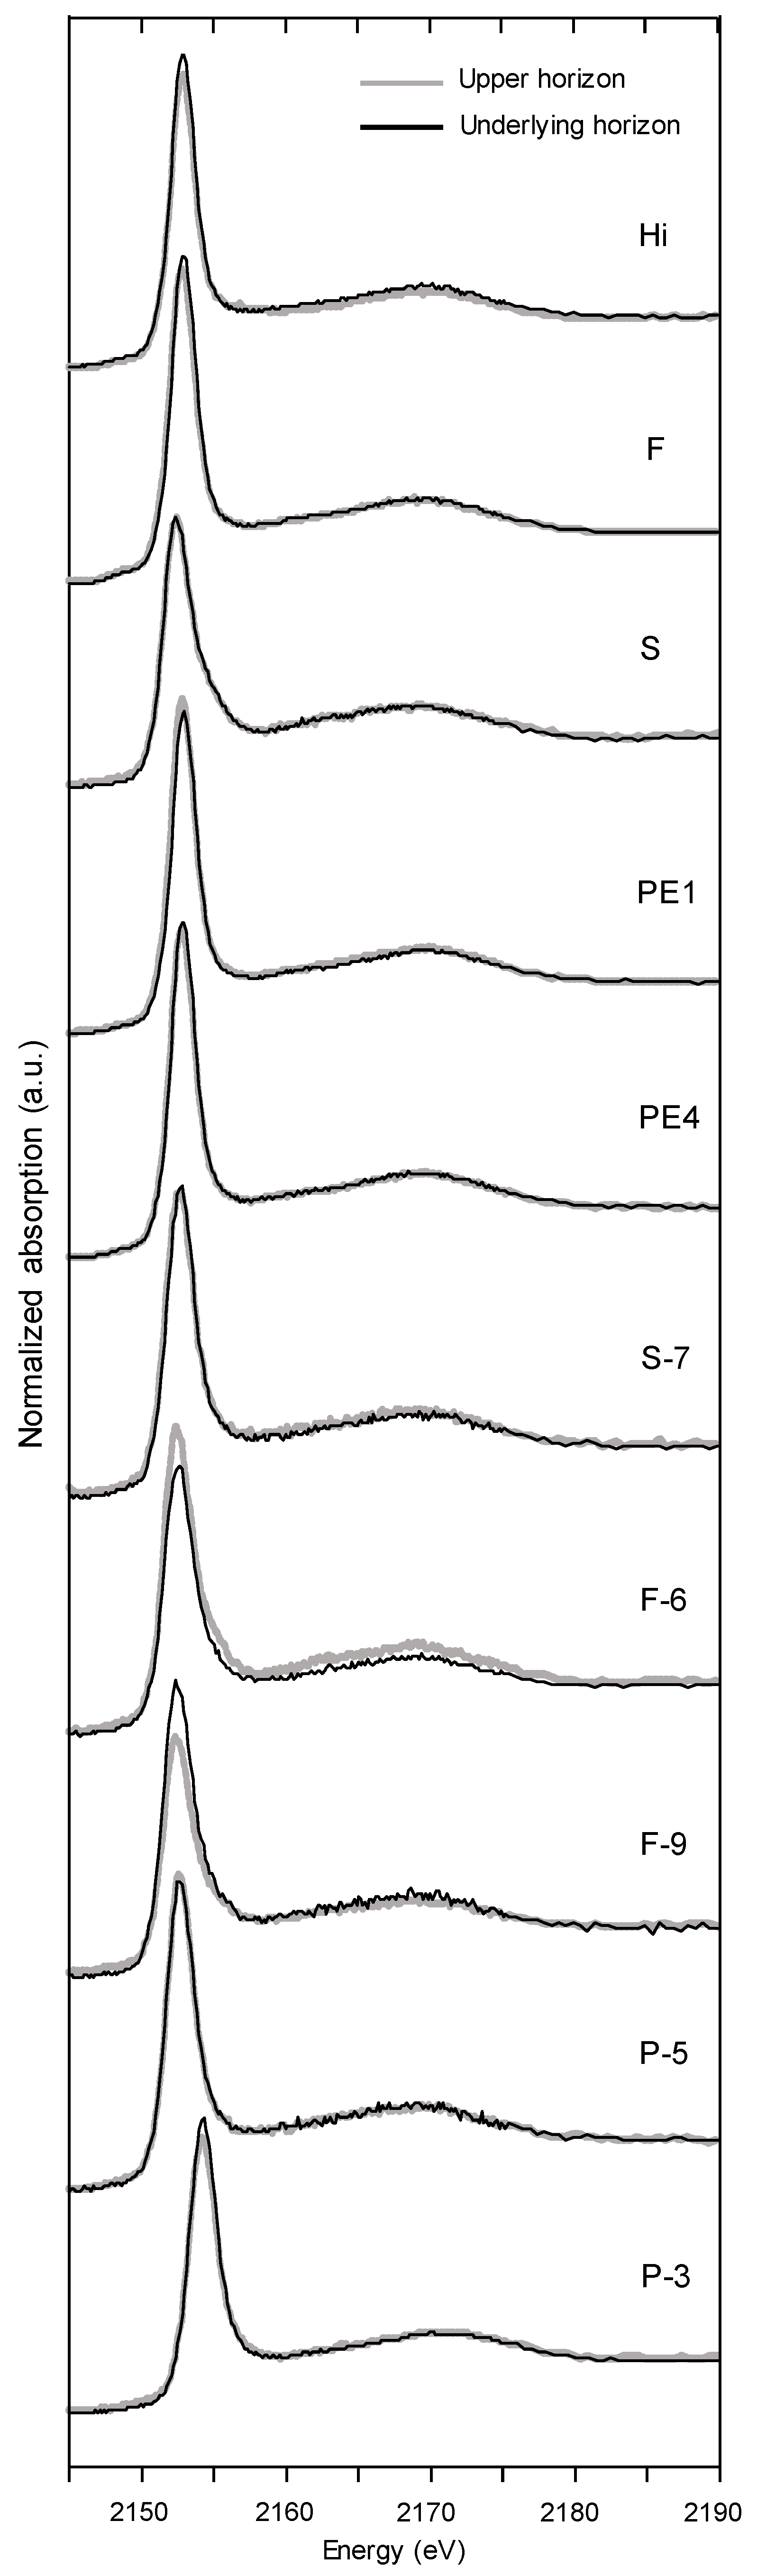
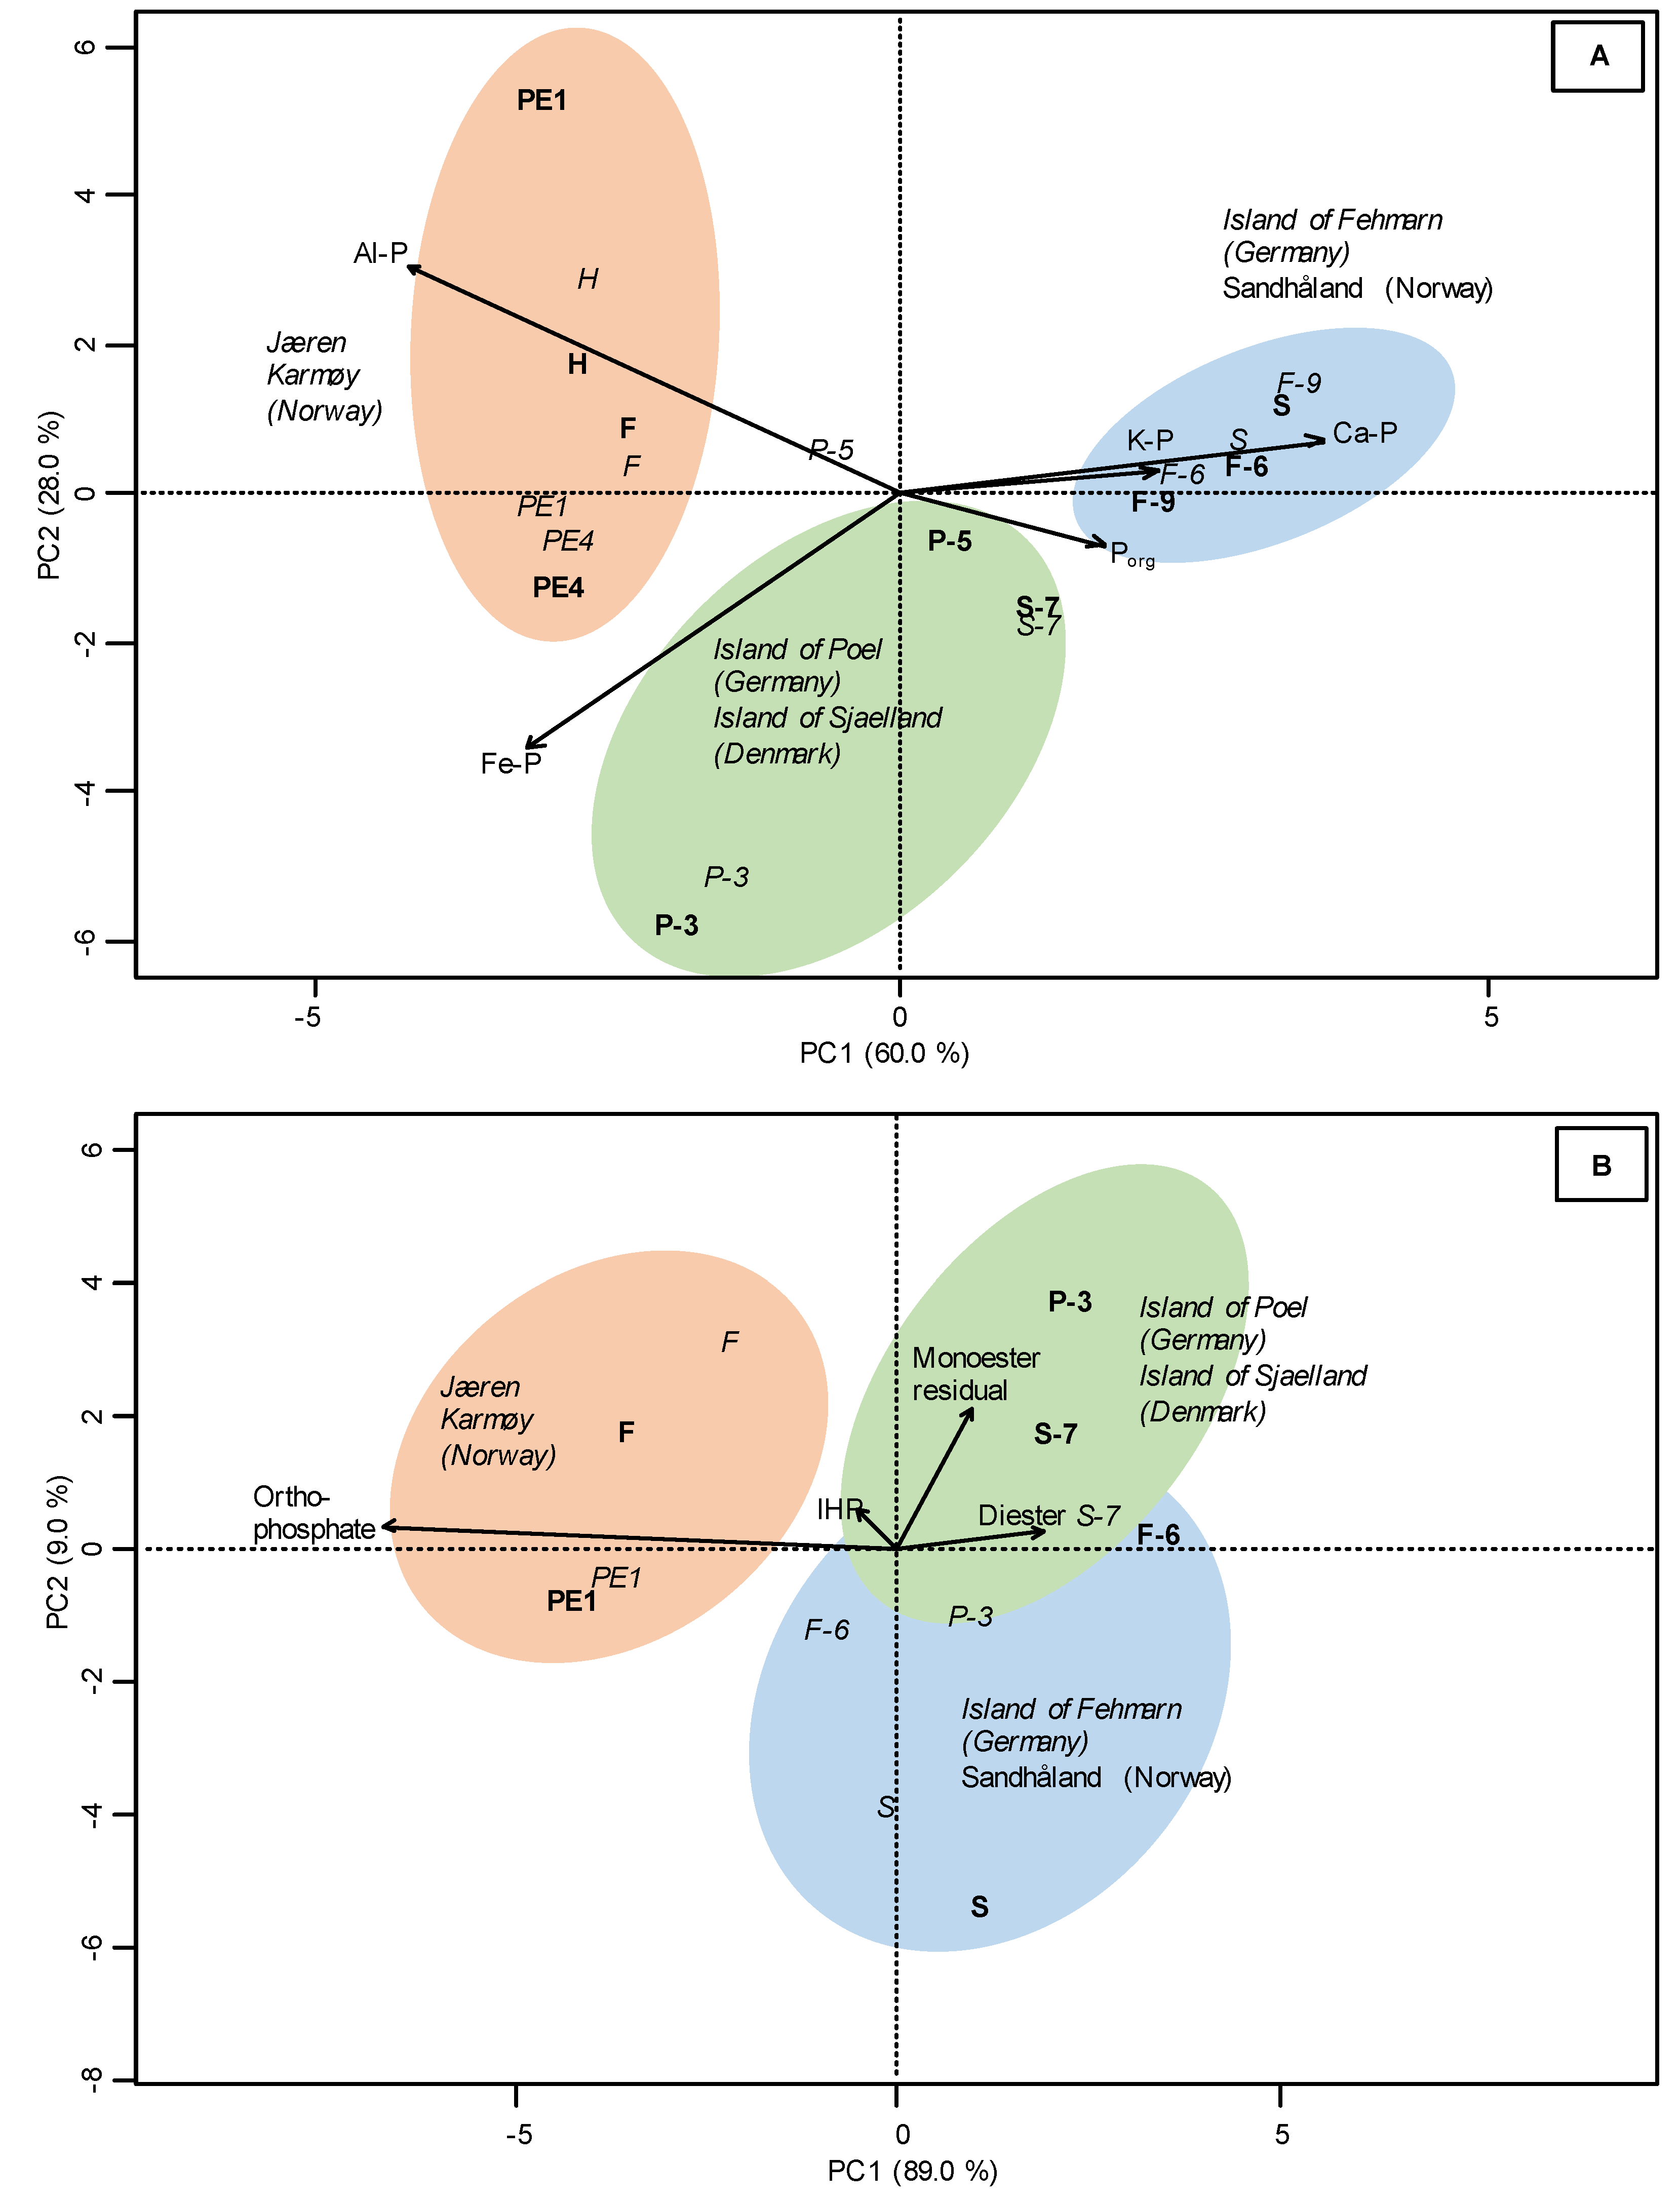
3.3. P K-Edge XANES Spectroscopy

The stacked normalized P K-edge XANES spectra of the soils (Norway: Hi, F, S, PE1, PE4; Denmark: S7; Germany: F-6, P-5, P-3) are displayed in Figure 3. The proportions of P species were estimated by linear combination fitting of the XANES spectra that generally revealed good qualities reflected by r factors of 0.001 to 0.009 (Table 3). The Supplementary Figure S2 show two example spectra including their LCF fits that/how reference compounds such as P adsorbed to Fe minerals contribute to the LCF fits. All soils were primarily characterized by high proportions of Fe-P (average 70%), which exceeded the proportions of the other compounds. The main P species in the Norwegian soils (Hi, F, PE1, PE4) were Fe-P (62%) and Al-P (29%), while the German soils at the island of Poel (P-3, P-5) were dominated by 70% Fe-P and 19% Porg and at the island of Fehmarn/Wagrien (F-6, F-8 and F-9) by Fe-P (45%), Ca-P (19%), and Porg (19%). The latter were similar to the Norwegian profile S (Fe-P: 45%, Ca-P: 33%), while the Danish soil (S-7) was similar to German soils at Poel (Fe-P: 55%, Porg: 30%). The PCA of P K-edge XANES results explained 88% of the differences among the soils (Figure 5A). The PC1 of the PCA, which explained 60% of the total variance, separated the German soils at Fehmarn/Wagrien (F-6, F-8, F-9) and Norwegian profile S by high proportions of Ca-P and K-P from the Norwegian profiles F, H, PE1, and PE4 (Al-P and Fe-P) but only weakly from the German soils at Poel by Fe-P and Porg. The PC2 (28%) separated the Norwegian soils from the other soils by Al-P.

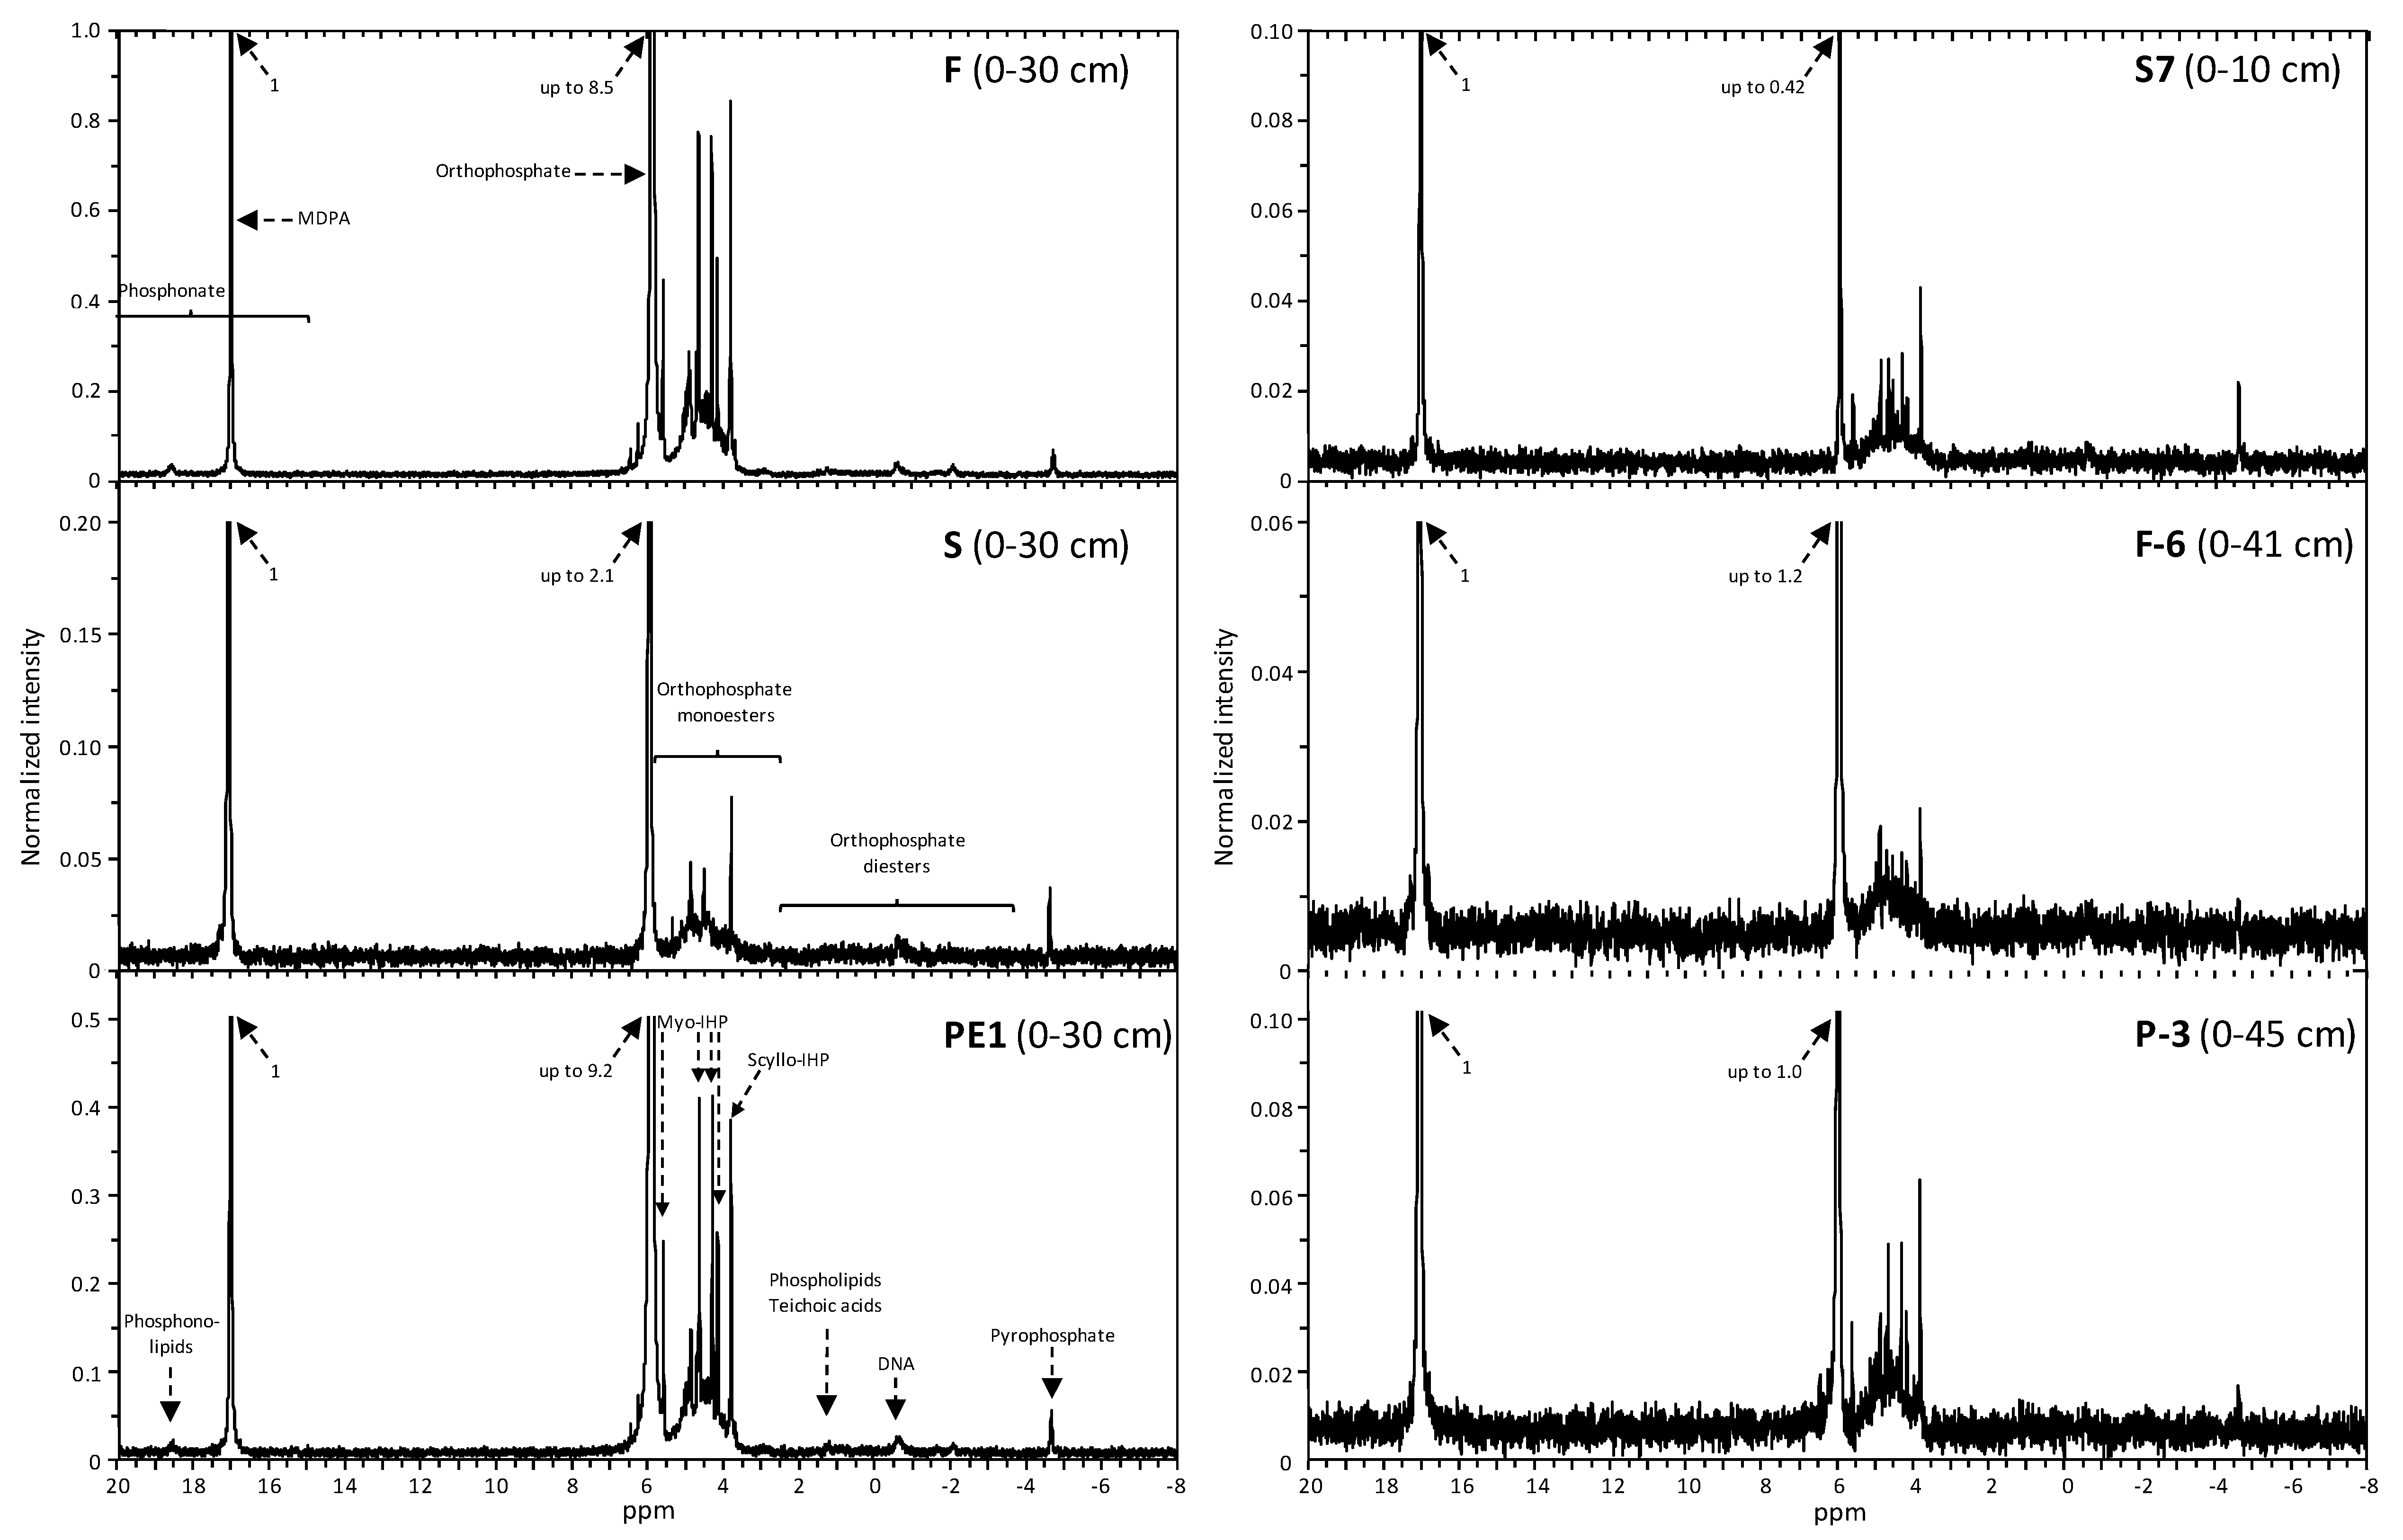
3.4. P Species in the NaOH-EDTA Extract Identified by 31P-NMR Spectroscopy

Figure 4 shows the 31P-NMR spectra of NaOH-EDTA extracts from the upper horizon of one soil profile per region (Norway: F, S, PE1; Denmark: S-7; Germany: F-6, P-3). The vertical scale was set to 1 based on the MDPA (methylene diphosphonic acid) peak to compare the intensities of the spectra. The following peaks and resonance regions were detected in all spectra: orthophosphate at 5.867 to 6.002 ppm, region of orthophosphate monoesters between around 6.5 to 6.2 ppm and 5.7 to 2.5 ppm, region of orthophosphate diesters between around 2.5 to −4.0 ppm and pyrophosphate at −4.554 to −4.706. The dominant peak in all spectra originated from orthophosphate. The Norwegian profiles F and PE1 revealed higher intensities and a greater variety of P compounds than the spectra of the other soils. In these profiles, the intensity of orthophosphate peak was up to 44× higher, orthophosphate monoester region up to 12×, orthophosphate diester region up to 2.6× and pyrophosphate peak up to 7.5× higher than in the other soils. Additionally, in these spectra phosphonolipids/phosphonate (18.637 to 18.572 ppm) were detected.
The spectra of the Norwegian profiles F and PE1 revealed the highest concentrations and proportions of orthophosphate (1834 to 2653 mg kg−1; 56 to 73%) compared with the Norwegian profile S and the Danish and German soils (32 to 416 mg kg−1; 12 to 46%) (Table 4). The Norwegian profiles F and PE1 revealed greater monoester concentrations (638 to 1353 mg kg−1) than all other soils (80 to 174 mg kg−1). However, the proportions of monoesters in the Norwegian soils (in average 30%) were similar to the Danish and German soils (in average 31%), except for Norwegian profile S (in average 15%). The concentrations of orthophosphate diesters in the Norwegian soils (in average 93 mg kg−1) were similar to the Danish and German soils (in average 59 mg kg−1), whereas the proportions showed the opposite.
In general, the concentrations and proportions of P compounds in the Norwegian soils followed the order orthophosphate > orthophosphate monoesters > orthophosphate diesters > pyrophosphate > phosphonolipids/phosphonate, and in the Danish and German soils, the order was orthophosphate monoester > orthophosphate > orthophosphate diester > pyrophosphate. The Norwegian soils did not show any differences in the P compound proportions between horizons. In contrast, on average, the Danish and German soils showed larger concentrations and proportions of orthophosphate at the expense of orthophosphate monoesters in the upper horizons compared with the underlying horizons. The concentrations and proportions of specific P monoester and/or diester species, phosphonate, and pyrophosphate are shown in Supplementary Table S1. Spectra of the Norwegian profiles F and PE1 had the most specific P-species. The proportions of the dominant P species in the monoesters and diesters regions decreased in the Norwegian soils in the order myo-inositolhexakisphosphate (IHP) (5%) > scyllo-IHP (1.7%) > unknown (1.1%) > neo/chiro-IHP (0.5%) > DNA (0.4%) > pyrophosphate (0.4%) > phosphonolipids/phosphonate (0.2%) > 3-sn-phosphatidic acid (0.2) > D-glucose 6-phosphate (0.2). The German soils at Poel and the Danish profile S-7 revealed the order myo-IHP (2.4%) > scyllo-IHP (1.2%) > unknown (0.8%) > pyrophosphate (0.4%) > neo/chiro-IHP (0.4%) > 3-sn-phosphatidic acid (0.4%) > D-glucose 6-phosphate (0.2%) > β-glycerophosphate (0.2%). The German soils at Fehmarn/Wagrien and Norwegian profile S revealed the order pyrophosphate (0.6%) > scyllo-IHP (0.5%) > DNA (0.4%) > myo-IHP (0.3%) > 3-sn-phosphatidic acid (0.2%) > β-glycerophosphate (0.2%) > unknown (0.1%). Differences in the P species between the horizons of the same soil profile were relatively small. Visible differences were only detected for proportions of the DNA and pyrophosphate that were slightly more abundant in the upper than in the underlying horizons of all soils (Table 2).
The PCA of the specific P-species explained 89% of the variance on PC1 and sharply separated the soils of the German soils at Poel and Fehmarn/Wagrien from those in Norway that were rich in orthophosphate and IHP (Figure 5B). The PC2, which explained 9% of the variance, separated the German soils at Poel and the Danish profile S-7 by higher proportions of monoesters and diesters from the German soils at Fehmarn/Wagrien and Norwegian profile S.

4. Discussion

4.1. Total P and Other Element Concentrations

In accordance with Acksel et al. [3] and Schnepel et al. [89], we explain the high P concentrations in the Norwegian soils of up to 4012 mg kg−1 by ancient and possibly ongoing large inputs of organic matter from human activities. These P concentrations exceeded those of 377 samples of various soils of the world, except for mineral-P + FYM amended soils (Figure 6). In contrast to various Anthrosols (1000 mg P kg−1), the P concentrations of the German soils at Poel and the Danish profile S-7 (360 mg kg−1) were rather similar to natural or household compost amended soils, thus providing no indication for any substantial inputs of P-rich organic matter. The total P of German soils at Fehmarn/Wagrien and Norwegian profile S were similar to natural soils; soils fertilized with mineral-P, household compost, and sewage sludge; and various Anthrosols. Classical indicators of human activities in archeological excavations are high concentrations of P and other elements, e.g., Ca, originating from strong manuring in the past [40]. Therefore, the higher P concentrations in Norwegian soils compared to most Anthrosols of the world suggest long-term inputs of P-rich amendments. Thus, the question arises as to which other kinds of organic matter may have been applied to the soils, thereby causing such high nutrient contents. Possible amendments are animal manure, human excrement and/or composts. Due to these amendments a P enrichment in soil was found by Scherer and Sharma [51]. They showed an increase in P concentration in a Luvisol after 38 years of continuous addition of mineral fertilizer (+359 mg kg−1), FYM (+409 mg kg−1), compost from organic household waste (+442 mg kg−1), and sewage sludge (+495 mg kg−1) in comparison to the control (222 mg kg−1). Furthermore, Koch et al. [61] reported increased P concentrations in the topsoil of a Cambisol (0–30 cm) after a 16 years application of TSP (+349 mg kg−1), compost + TSP (+666 mg kg−1), and compost (+814 mg kg−1) in comparison to the control (1890 mg kg-1). Both experiments show in good agreement that the continuous application of FYM, compost, and/or human excrement lead to higher soil P concentrations than mineral fertilizer. This implies that the exceptionally high P concentrations of the Norwegian Anthrosols could originate from stronger manuring with, e.g., animal manure, human excrement, and compost.
To find out from which of these amendments P concentrations originate, it may also be helpful to consider other elements, especially possible binding partners of P. Table 5 shows elemental concentrations in human excrements, sewage sludge, swine, cattle, and poultry manure, as well as elemental concentrations in various composts. Human excrements have especially high Fe concentrations in comparison to all other amendments, which are more enriched in Ca. High concentrations of Ca, Fe, and Al in the excrements can lead to the accumulation of P due to the adsorption reactions of elements with soluble phosphate ions [124]. This, in turn, leads to P enrichment in soils amended with large amounts and/or continuous additions of excrements. Comparing elemental concentrations of our investigated Anthrosols with those of surrounding soils in the respective region indicated inputs of various amendments (Table 5). For example, the Norwegian soil profiles F and H were enriched in Ca by factor 2.5, in Al by factor 2. and in Fe by factor 1.7; profile S in Ca by factor 28.6 and in Mg by factor 2.6. Similar elemental enrichments were found in the German soils at Fehmarn/Wagrien, showing, for example, higher concentrations of Ca by factor 1.3 and Al by factor 2.1 in comparison to their surrounding soils in NGermany (Table 5). Since animal and/or human excreta increase the content of nutrient and organic matter in soils [125] the simultaneous high concentrations of P, Ca, and Fe, as well as Mg and Mn, along with high Corg contents in the Norwegian Anthrosols and those at Fehmarn/Wagrien indicate the application of excrements or manure. Wiedner et al. [10] also concluded earlier inputs of animal and/or human faeces to an Anthrosol from high concentrations of Ca, Mn, Mg, and Fe in addition to enriched faecal lipid biomarkers in the soil profile. Correlating Pt concentrations and elemental concentrations from Wiedner et al. [10] showed significantly positive relationships of Ca (r² = 0.91 ***), Mn (r² = 0.82 **), Mg (r² = 0.76 **), and Fe (r² = 0.63 *). These correlations were also found for our investigated Anthrosols. Here, significant positive correlations between Pt and Fe (r² = 0.65 ***), Mn (r² = 0.62 ***), Ca (r² = 0.59 ***), and Mg (r² = 0.44 ***) were observed. A further aspect for the element enrichment is the application of peat as a common method of soil amelioration in ancient times [126]. Data compiled in Table 5 show that peat is highly enriched in P, Ca, Fe, and Al in comparison to many other amendments. Therefore, it can be assumed that the Anthrosols with such high element concentrations may have been manured with a mixture of animal manure and peat-like plaggen materials. This has also been reported by Schnepel et al. [89] for the plaggic Anthrosols in the Jæren region (Norway). The low element concentrations of the German soils at Poel and the Danish profile S-7 in comparison to all studied Anthrosols and their surrounding soils revealed no indications of specific amendments and probably reflect the soil parent materials.

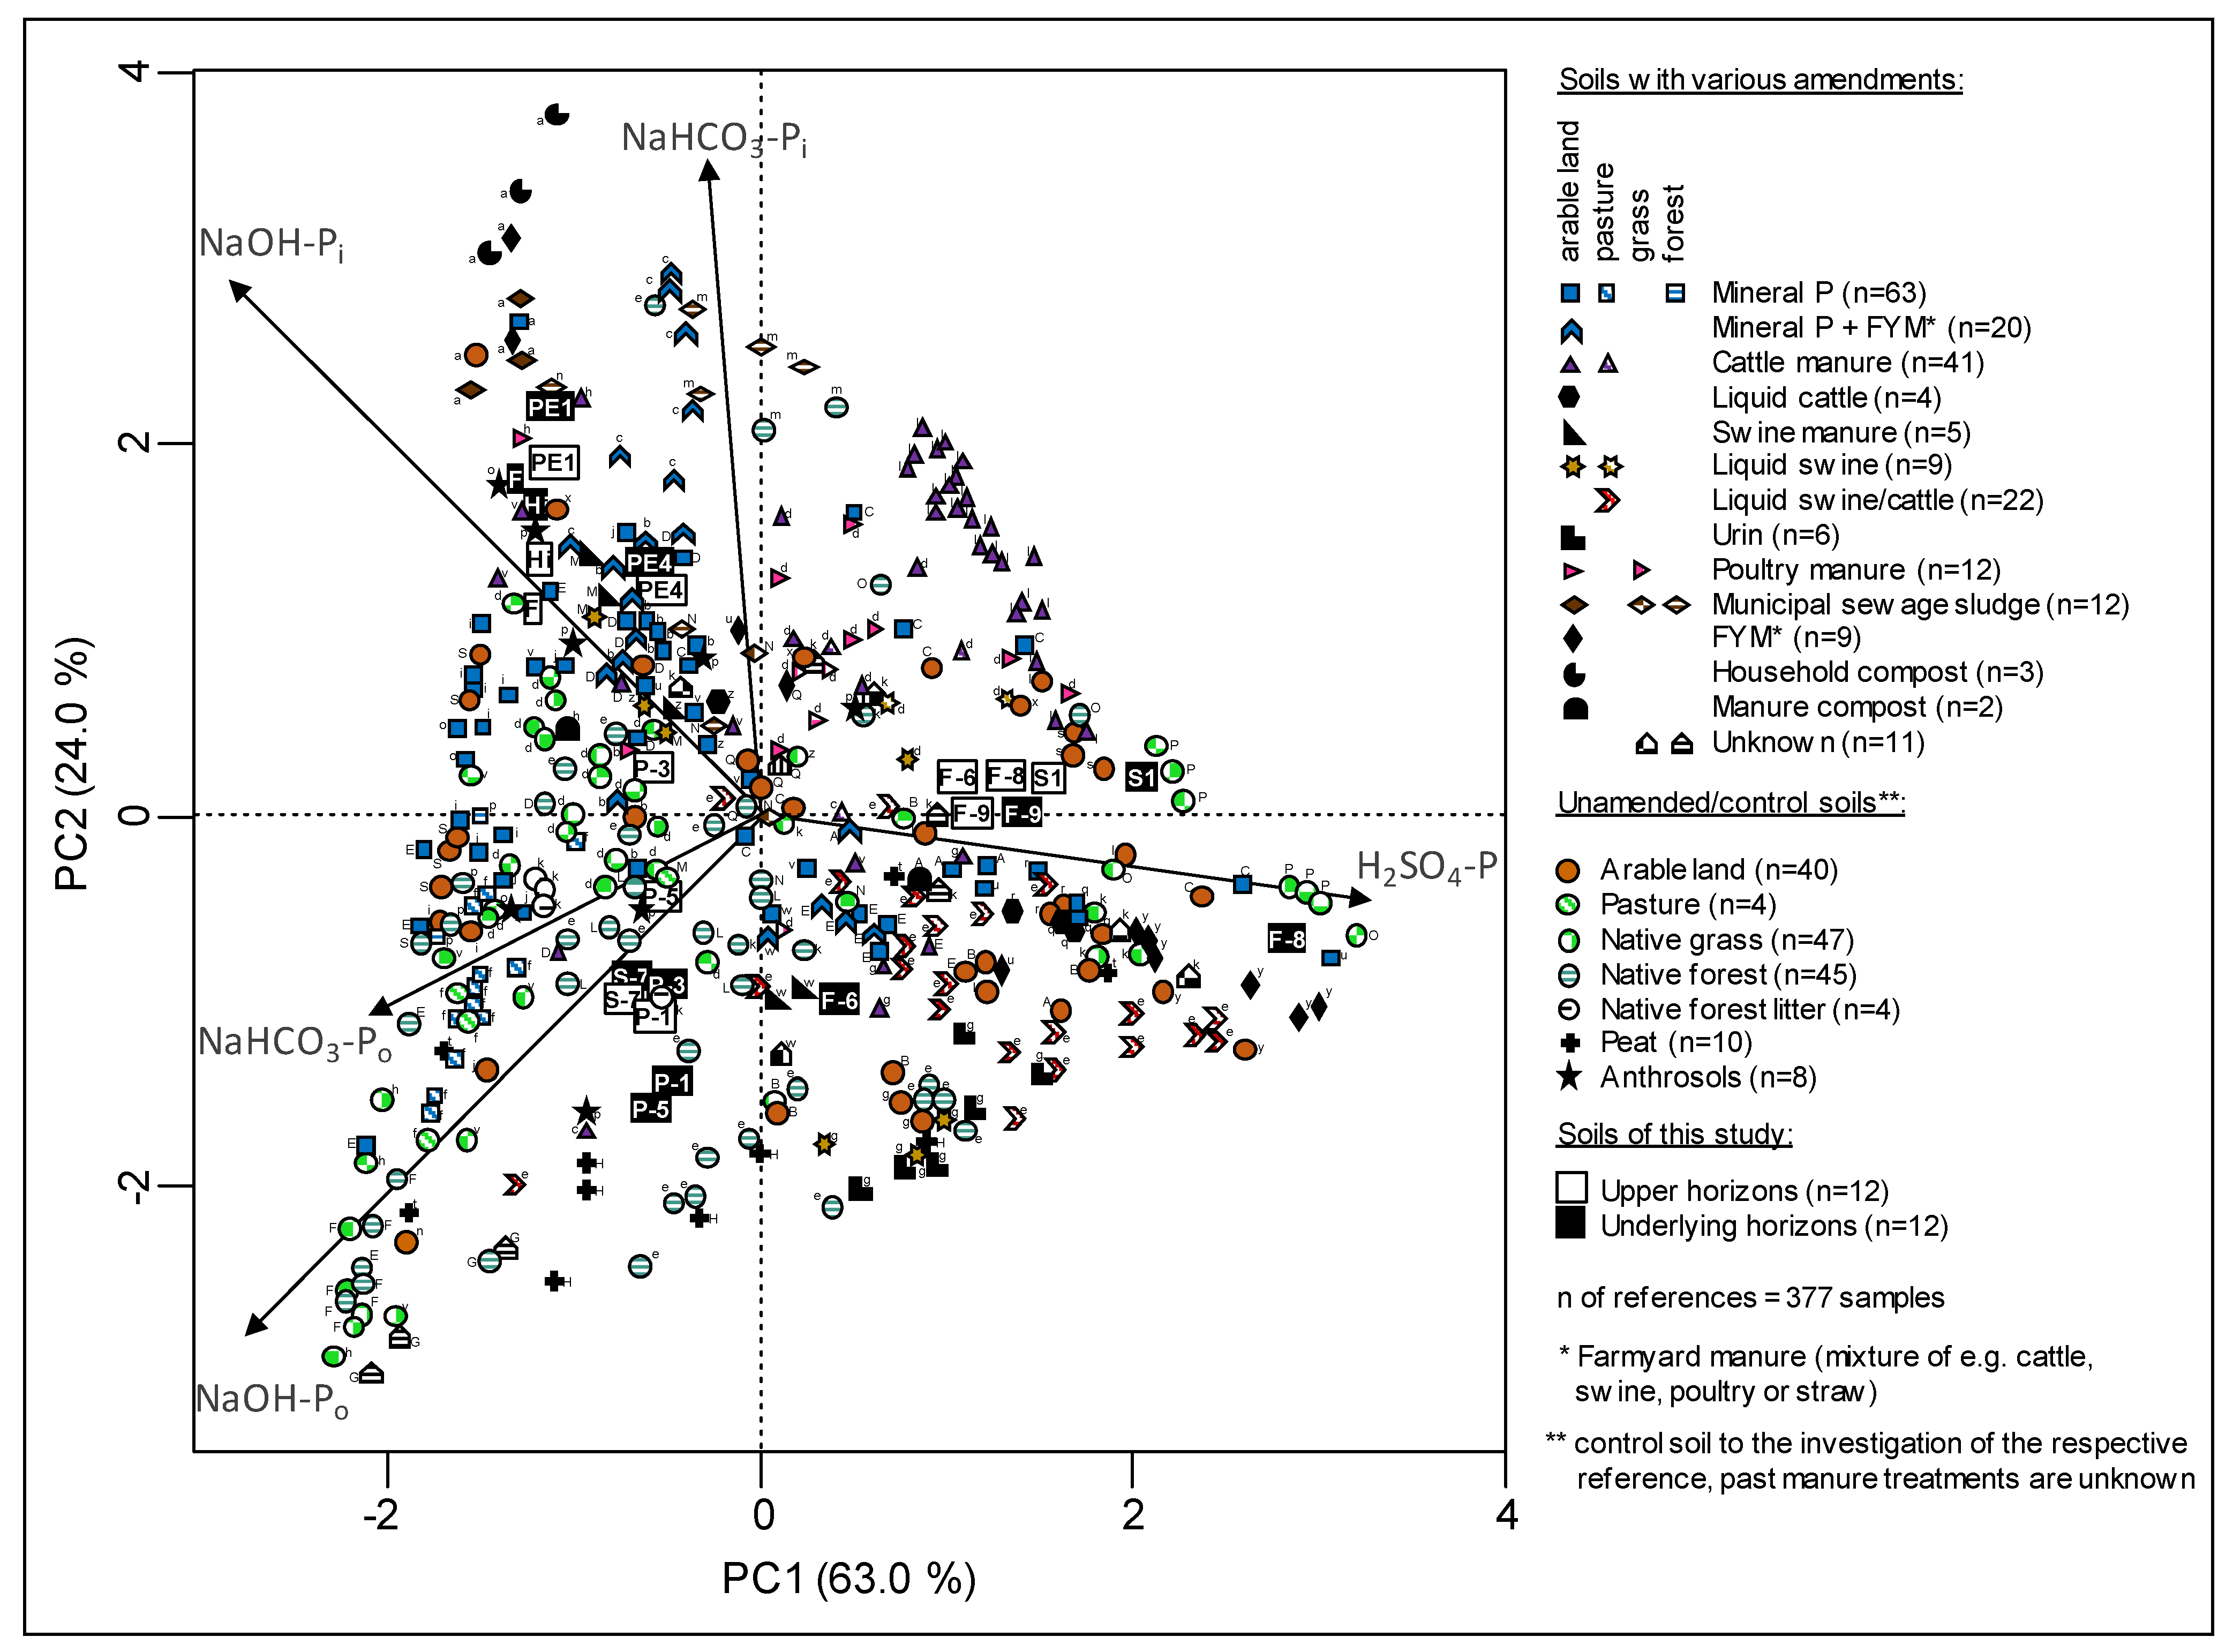
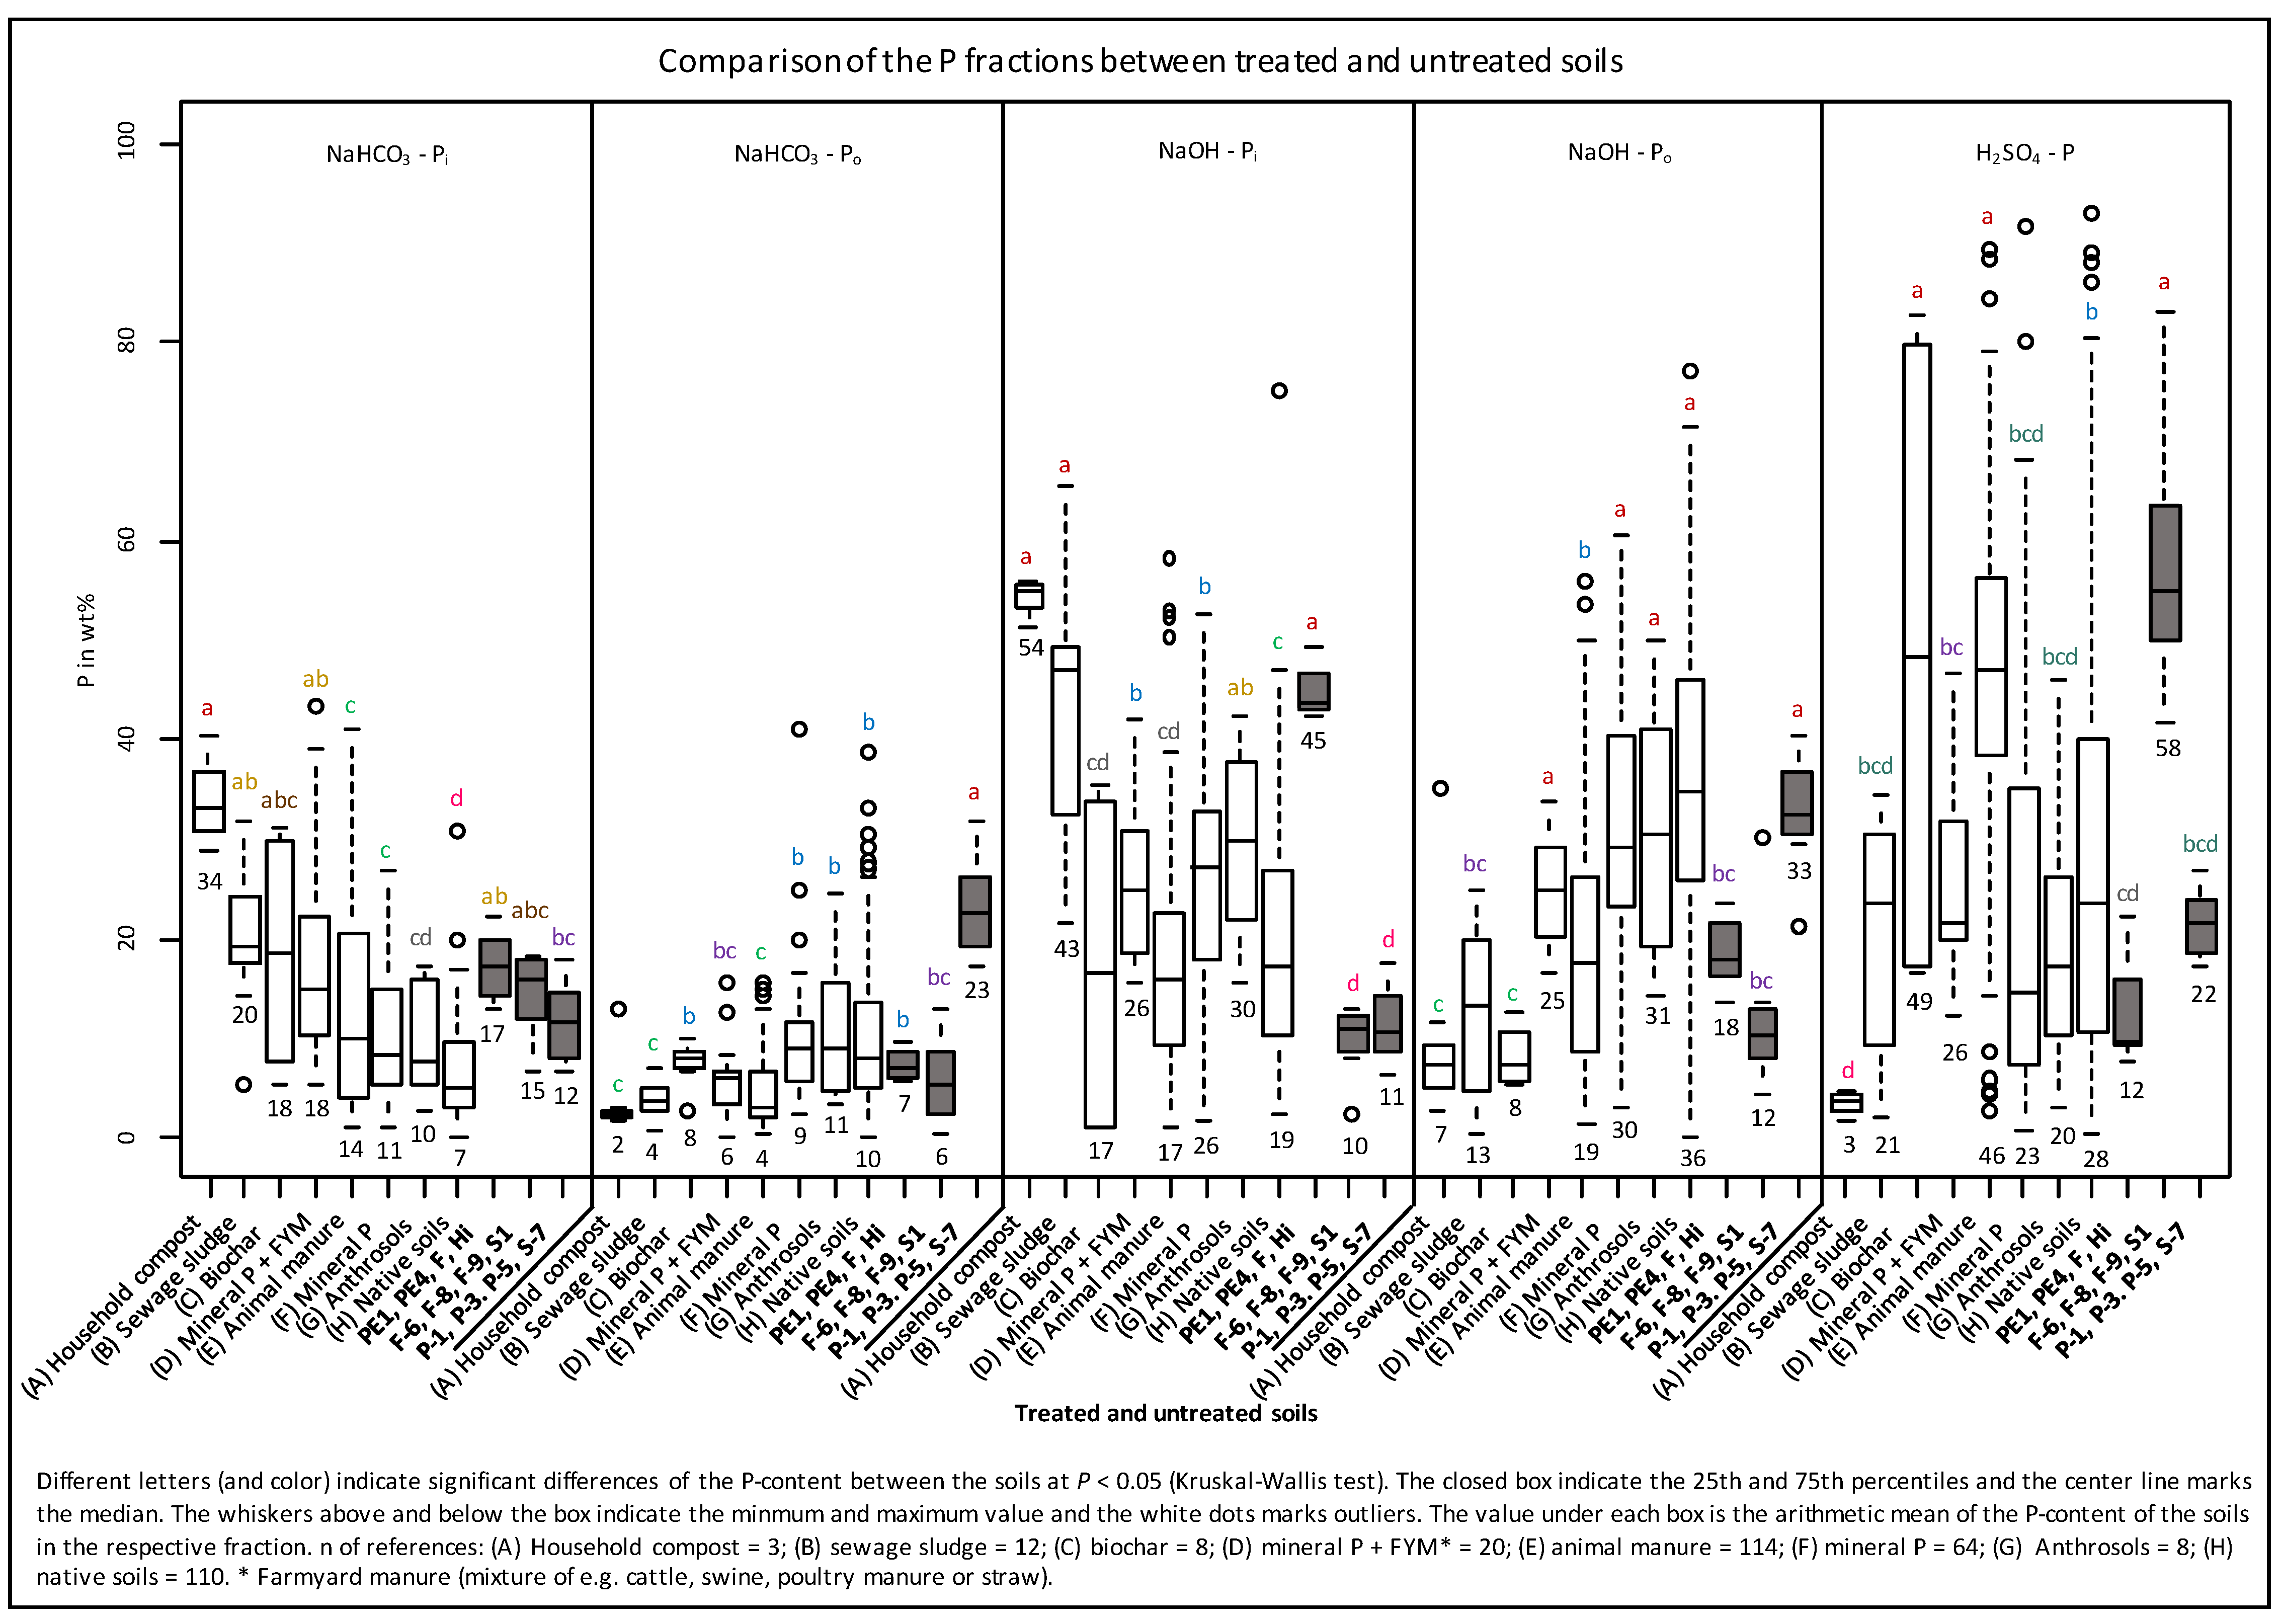
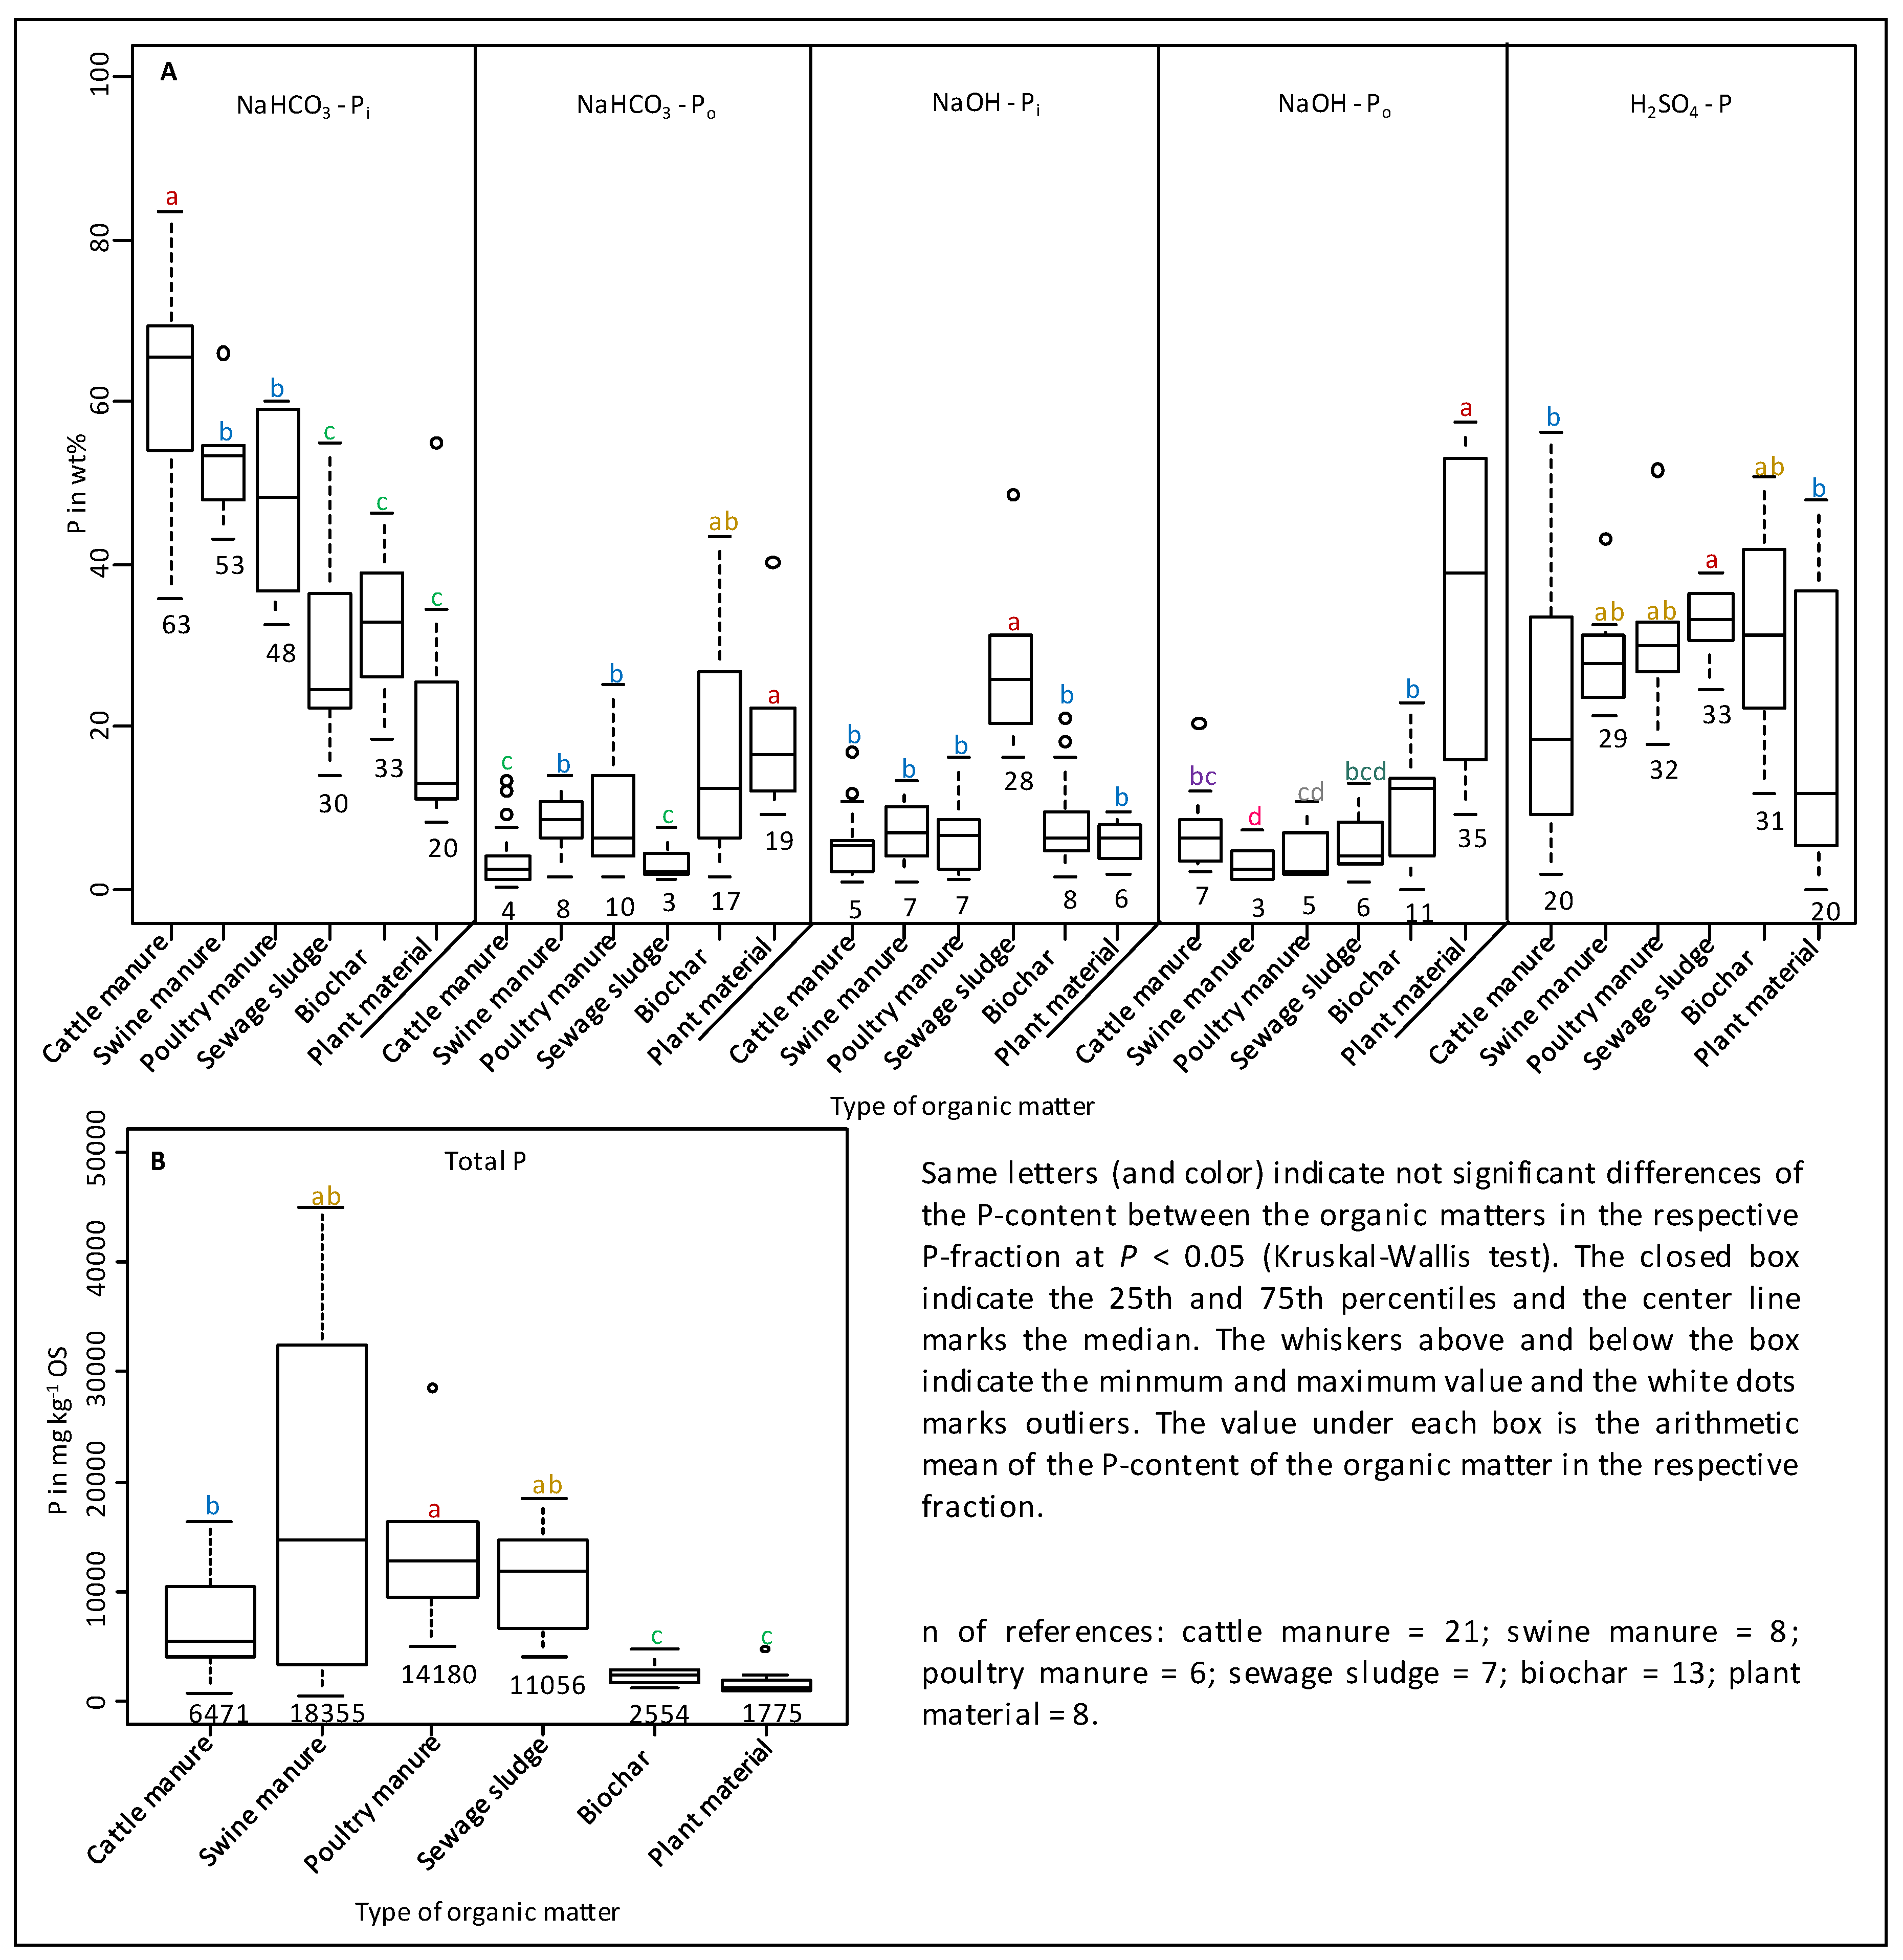
4.2. Sequential Phosphorus Fractions

Potential input of amendments based on elemental concentrations is supported by clear differences in the sequential P fractions between our Anthrosols. The PCA of the SF clustered these soils according to their geographical region indicating a similar input of organic matter type and/or pedogenesis in the soils of a certain region (Figure 2B). For further information on organic matter type within a cluster the proportions of P-fractions from the Anthrosols were compared with analogous data of soils worldwide (fertilized and unfertilized arable, grass and forest soils, natural soils, Anthrosols and peats) by means of PCA (Figure 7). This PCA showed a clear separation of P composition of the reference soils by applied manure and usage. The PC1 explained 63% of the variance and sharply separated 88 of 108 animal manure amended reference soils by higher proportions of H2SO4-P from the other reference soils (mineral-P or + FYM, sewage sludge and compost amended soils, natural soils, and Anthrosols). The PC2 (24%) generally separated 80 of 103 natural grass/forest/peat soils and pasture soils by higher proportions of Po (NaHCO3 + NaOH) from some soils amended with composts, sewage sludge, and animal manure that were enriched in Pi (NaHCO3 + NaOH) (Figure 7). Generally, the PCA of the P speciation revealed different inputs in our investigated Anthrosols due to their clustering to amended and unamended reference soils. The similarities of the P speciation from the Norwegian soils, especially the NaOH (63%) and NaHCO3 (24%) fractions were similar to composts, sewage sludge, and mineral P + FYM amended soils (Figure 8). In detail, the high NaOH-Pi proportions from the Norwegian soils (in average 45%) significantly exceeded all measured NaOH-Pi proportions in manured soils, native soils and in the German and Danish Anthrosols (in average 10 to 26%). The same similarities were found for proportions of NaHCO3-Pi (in average 17%) in the Norwegian soils.
Sewage sludge manure itself is high in moderately labile P [56,124,132] and fresh animal manures are high in labile P [79,131]. It is shown in Figure 9 that, in average sewage sludge, manure has up to 4× higher proportions of NaOH-Pi (28%) and up to 1.8× less NaHCO3-Pi (30%) in comparison to animal manure (cattle, swine, poultry: NaOH-Pi: 6.6%; NaHCO3-Pi: 55%). Various long-term experiments showed that the high proportions of NaOH-Pi in sewage sludge and/or compost manures could be traced in amended soils [51,52,90]. Chang et al. [142] reported a general shift from the mainly occurring Ca-P in a calcareous soil to Al-P and Fe-P after the application of sewage sludge for about five years. Although sewage sludge is not directly comparable to human excrements from ancient times (due to the modern additions of Fe and Al in the treatment plant), it can be assumed that the P-composition of the Norwegian Anthrosols is the result of the input of composts that were enriched in NaOH-Pi. Furthermore, the addition of human excrements is also possible due to their extraordinary higher Fe-content (15×) compared to sewage sludge (Table 5). Enrichment of NaOH-Pi after application of such amendments may be due to high concentrations of Al and Fe, which adsorb and thus accumulate soluble phosphate ions [124]. The clear enrichment of NaOH-Pi and the extremely high concentrations of P, Al, and Fe in the Norwegian soils indicate an application of compost and/or human excrements rather than animal manure and/or mineral fertilizer.
In contrast to the Norwegian profiles, the 5× lower P concentrations of the German soils at Fehmarn and the Norwegian profile S were mainly characterized by the stable P fractions (H2SO4-P + residual-P: 81%) (Table 1 and Table 2). Especially the proportions of H2SO4-P in these soils (58%) were highly similar to H2SO4-P of animal manure– (46%) and biochar-amended soils (49%) and were significantly different to natural soil and other fertilized soils (Figure 8). This as well as the clear clustering of these soils in the PCA indicates an input of animal manure and/or biochar to the German soils at Fehmarn and Norwegian profile S (Figure 7). Possible manures are e.g., cattle, swine and poultry manure. These manures primarily contained NaHCO3-Pi (48 to 63%) and H2SO4-P (20 to 32%) but were also similar to biochar (NaHCO3-Pi: 33; H2SO4-P: 31%) (Figure 9). After cattle manure application to soils for five years, higher proportions of NaHCO3-Pi (+9%) and HCl-Pi (+7%) were detected, whereas swine manure application only changed the residual-P fraction (+7%) in comparison to the control [53]. Further, various other studies also observed a general enrichment of NaHCO3-Pi and/or H2SO4-Pi after long-term cattle and/or poultry manure application [53,102,105], in contrast to swine manure–amended soils that revealed only enrichments of P in the H2SO4-P and/or residual-P fractions [53,105,143]. These facts suggest an input of cattle and/or swine manure to German soils at Fehmarn and the Norwegian profile S. However, Hao et al. [102] detected a strong increase in P concentrations (in average up to +2298 mg kg−1) after different rates of cattle manure application to Canadian soils suggesting a low manuring level in German soils at Fehmarn due to their relatively low Pt concentrations (455 mg kg−1). Biochars can be another possible source of P suggested by high proportions of H2SO4-P in the soils (Table 5). It can be assumed that the high proportion of Ca-P in the Fehmarn soils as well as the moderate proportions in the Norwegian soils in Jæren may originate from inputs of combustion residues. Indeed, the high presence of combustion residues were confirmed by high proportions of BC in these soils (Fehmarn 15% and Jæren 12% BC in Corg) [1,2,3]. Further, a significantly positive correlation for the proportions of H2SO4-P and BC + Ca-P was detected (data not shown). Since the Fehmarn soils were only slightly acidic (pH 6.8, Acksel et al. [1,2]) and enriched in Ca-P, it could be possible that application of biochar transformed these soils from stronger acidic to less acidic conditions because biochar application to soils increases the pH value [144,145].
In summary, the comparison of the P composition (especially H2SO4-P) provided indication for the input of animal manure in Norwegian profile S and animal manure and biochar in the German soils at Fehmarn. In contrast, the low concentrations of Pt (360 mg kg−1) and high Po proportions (56%) of the German soils at Poel and the Danish profile S-7 indicated a rather natural P origin. This is supported by Guggenberger et al. [82], who reported similar Po proportions of around 66% in grassland and forest soils of Germany.

4.3. P Speciation by P K-Edge XANES

Differences and similarities in P composition between the Anthrosols of Norway, Denmark and Germany can be seen from the PCA of specific P species derived from P K-edge XANES (Figure 5A), which shows similar separation of the soils compared with the PCAs of the P fractions and the element composition, respectively (Figure 2A,B). The P K-edge XANES spectra revealed that high proportions of Al-P and Fe-P in the Norwegian soils corresponded to high NaOH-Pi proportions from SF. This corresponds to enrichments of Al-P, Fe-P, and NaOH-Pi, which were obtained (by P K-edge XANES and SF) in long-term field experiments with continuous application of compost and mineral P [61]. Furthermore, the detected high proportions of Ca-P by P K-edge XANES in the German soils at Fehmarn and Norwegian profile S correspond to the proportions of H2SO4-P from SF (Table 2 and Table 3). A simultaneous enrichment of these compounds was also detected (by P K-edge XANES and SF) in a long-term field experiment after continuous application of animal manure [69]. The detected proportions of Porg (by P K-edge XANES) were generally lower than the proportions of NaHCO3-Po and NaOH-Po (by SF) but nevertheless also demonstrated an enrichment of Po in the German soils at Poel and the Danish profile S-7 in comparison to the other Anthrosols (Table 2 and Table 3). These Po enrichments in the German soils at Poel and the Danish profile S-7 were similar to native and tame grassland soils as reflected by P K-edge XANES and 31P-NMR [64], indicating a natural P-source. Generally, the detected P-species of P K-edge XANES yielded complementary results to the SF and thus provided compelling evidence for an application of manures/composts in the Anthrosols from Norway and from Germany at the island of Fehmarn rather than in those from Germany at the islands of Poel and the Danish profile S-7.

4.4. P Speciation by 31P-NMR

In the Norwegian Anthrosols, high concentrations of monoesters and orthophosphates as well as the ratios of monoesters to diesters (up to 40) were detected (Table 4), which were comparable to those of intensively amended soils that received various organic amendments [61,71,72,73]. This suggests strong application of P-rich amendments to the Norwegian soils. By comparing our 31P-NMR spectra with spectra of other studies, further amendment classification was elucidated. For example, from 31P-NMR spectra of a Danish long-term field experiment with animal manure, Guggenberger et al. [82] reported a different P-composition in the amended in comparison to the control soil. They found that animal manure amended soils showed increased proportions of orthophosphate (49%), decreased proportions of monoesters (35%) and diesters (10%), as well as constant proportions of pyrophosphates and phosphonates, in comparison to a control soil (orthophosphates 26%; monoesters 47%; diesters 13%) [82]. Further, Hinedi et al. [152] demonstrated an incubation experiment of sludge-amended soil with complete hydrolyzation of monoesters and diesters after 140 days of incubation in alkaline soil while monoesters, as well as pyrophosphate, were still detected after that time. They also detected hydroxyapatite and pyrophospates in sludge-amended soils by solid-state 31P-NMR [153]. From this, it can be deduced that the high proportions of orthophosphate and monoesters, in the Norwegian soils (except profile S) resulted from the application of various animal and/or human excrements. This was in good agreement with the SF and P K-edge XANES results (Section 4.2 and Section 4.3).
Also, a detailed look into the monoester region revealed similarities between the Norwegian soil spectra (except profile S) and the mineral and compost amended soil spectra shown in Koch et al. [61]. In particular, the characteristic 1:2:2:1 ratio of the four main peaks of myo-IHP was detected in similar proportions in the Anthrosols (4 to 6% of Pt) compared with the soils from Koch et al. (2018) (3 to 5% of Pt). Additionally, the presence of neo-, chiro- and scyllo-IHP in the Norwegian Anthrosols agreed with those of Koch et al. [61] suggesting mineral and/or compost amendment of the Norwegian soils. However, the concentrations of myo-IHP and scyllo-IHP in the Norwegian Anthrosols (except profile S) were clearly higher than the mineral and compost amended soils from Koch et al. [61] questioning this amendment for Norwegian soils.
A significant source of IHP-compounds in soils are plants and manures [154]. Typically, myo-IHP in soils originates from swine, poultry and diary manures, various seeds, roots, and microorganisms, while neo-IHP mainly originates from microbes [64] and amoebas [155]. Chiro-IHP can originate from epimerization of myo-IHP [156] and scyllo-IHP from epimerization of myo-IHP or from microorganisms [157,158]. Further, chiro- and neo-IHP were found in aerobic sewage sludge [159] and parasitic amoebae as well as in human intestinal parasites [160]. From the high proportions of IHP in the Norwegian Anthrosols (Table S1) it thus can be assumed that these soils were amended with various excrements. Manure originating from monogastric animals could be possible because it represents a significant source of IHP [155], while ruminant manure is rather poor in IHP because these animals digest vegetative plant material of their diets by phytase enzymes [161,162]. However, ruminant manures cannot be excluded due to the similarities of the myo-IHP concentration in the Norwegian Anthrosols with those of various pastures in England and Wales [163], New Zealand [80], and Irish grassland soils [164] that received P from excrements.
In addition to excrements, microorganisms may have also contributed to the high accumulation of myo-IHP in the Norwegian soils which is supported by the simultaneous accumulation of the stereoisomers of myo-IHP, DNA, pyrophosphate, and phosphonolipids/phosphonates. Significant increases of IHP (especially neo-IHP) in native grassland in comparison to cropland soils in Canada were particularly attributed to microbes [64]. P-compounds such as DNA, pyrophosphate, and phosphonates were also linked to microorganisms [163,165]. Further, slightly higher proportions of DNA and pyrophosphate in the upper compared to the underlying horizons of all Anthrosols may point toward a microbial origin of these compounds because the microbial activity is generally higher in topsoils than in subsoils [166]. Thus, the accumulation of the monoesters in our Anthrosols cannot solely be assigned to manure application but may also be assigned to natural microbial processes that, however, may have been supported by the excremental amendment of soils [167,168].
The Po composition of the German and Danish Anthrosols and the Norwegian profile S were characterized by low proportions of orthophosphates (12 to 46%), high proportions of diesters (7–20%) and low monoesters/diesters ratios (in average 2, maximum 3). This indicates a natural origin of these P pools because natural soils were shown to be more enriched in diesters and monoesters, whereas agricultural soils were dominated by monoesters [75,169,170]. This is in accordance with various 31P-NMR analyses of native forest and grassland soils in Germany, forest soils in Sweden and grassland soils in New Zealand, which revealed high proportions of monoesters (47%) and diesters (11%), low monoesters/diesters ratios (4.6), and only 33% orthophosphates [82,165,171,172]. It implies that especially the P composition in the German Anthrosols at Poel and the Danish profile S-7 likely originates from natural conditions and/or inputs of Pt- and Pi-poor amendments rather than from animal manures, human excrements, and/or composts. An alternative soil amendment is marine biomass such as seaweed that has a long history as soil conditioner [173]. Seaweed such as Fucus vesiculosus from the Scottish beach is poor in Pt (2800 mg kg−1) and has high Po proportions (38 to 53%) in comparison to compost (Pt: up to 3100 mg kg−1; Po: 9 to 33%), sewage sludge (Pt: 20800 mg kg−1; Po: 5 to 12%) [174], and various animal manures (Pt: up to 8000 mg kg−1; Po: 12 to 20%) [79]. Supported by S-isotope data, which provided clear evidence for the input of marine biomass in these soils [2], it can be assumed that the P-composition in the German Anthrosols at Poel and the Danish profile S-7 was affected by inputs of marine biomass. Furthermore, a purely natural origin of the soil P in the German Anthrosols at Fehmarn and in the Norwegian profile S can be excluded due to the very high proportions of Ca-P detected by the SF (up to 61%) and P K-edge XANES (up to 36%), which were probably more likely caused by the addition of animal manure, as discussed with the SF results. In contrast, the sole considerations of the proportions of the monoesters provided no hints of manuring activities due to only slight differences between the Anthrosols (except of profile S) and the similarities to forest and grassland soils of the compiled references. In summary, the results of 31P-NMR complement the results of the SF and P K-edge XANES all showing strong indications for the input of animal manure, compost and human excrements in the Norwegian Anthrosols and animal manure in the German Anthrosols at Fehmarn, while the German Anthrosols at Poel and the Danish profile S-7 were most likely amended with seaweed.

4.5. Complementary Archeological Evidence for the Northern European Agricultural History

For interpreting the P speciation of our Anthrosols, it can be helpful to consider knowledge from archeological and historical sources for the respective region of the soils. The regions of Karmøy and Jæren (Norway) have a long land use history and it is assumed that the agricultural usage started about 5500 BP, since in old settlements from the Paleolithic there was no evidence for agricultural practices [175]. Currently, 25% of the region of Karmøy is agricultural land [176] that is dominated by grassland/pasture [177]. The Norwegian side at Feøy (profile F) was used as pasture for sheep grazing during sample collection, while Hillesland (profile Hi) and Sandhåland (profile S) were used as grassland [3]. The deforestation at Feøy started more than 2000 years ago [178], thus having a long history of livestock grazing. A farm at Hillesland started in the 1700s, and in the second part of the century, the manuring technique was based on composting waste from slaughtering and fish cleaning [179]. In the 1800s, marine biomass, peat, mould, and heather were also composted [179]. The oldest farm in Sandhåland (profile S) dates back to the 17th century and had been fertilized with deposits of decomposing marine biomass and peat mixed with organic materials (heather and fish residues) since the 1800s until the 1960s [180]. However, Lundberg [180] assumed that the establishment may even date back to the older Iron Age. The earlier cultivation of the soils at the farm of Sandhåland and the other Anthrosols in SW Norway is supported by AMS 14C dating of their underlying horizons (30 to 65 cm) [3]. Acksel et al. [3] reported that the soils in Karmøy (profile F, Hi, and S) and Jæren (profile PE1 and PE4) formed between the Viking Age (about AD 800 to AD 1000) and the Roman Iron Age (500 BC to AD 500), respectively. Therefore, it seems that these regions have a longer agricultural history than reported. From this, the question arises which kind of agricultural usage had been applied before the 17th century. For a long time, it has been known that in Western Norway peat was brought into the stables and mixed with animal manure and later used as soil amendment [126,181,182,183,184]. It can be assumed that these manuring techniques had been applied long before the 17th century due to the horizon thickness of up to 90 cm in the plaggen profiles PE1–PE4. Correspondingly, the oldest dated AMS 14C age in the profile PE1 was 1542 ± 20 BP of the plaggic Anthrosols in Jæren [3]. Dalsgaard et al. [19] reported a similar plaggen technique as the usage of sods from heathlands mixed with manure in anthropogenic soils at an old farm in Denmark and assumed that this cultivation started 2300 years BP. It is also assumed that seaweed and peat had been mixed with cattle manure before adding to fields in this region [19]. The P-composition of the Norwegian profiles PE1 and PE4 is in accordance with archaeological data [179,180] and deliver clear evidence for the usage of peat and animal manure in these Anthrosols in addition to seaweed and combustion residues. Furthermore, it can be assumed that sheep and cattle manure have been used for the plaggic management rather than various others (e.g., swine and/or poultry) due to the current extensive use of grazing sheep and the long history of sheep, cattle, and horse grazing derived from Lundberg [178]. However, it seems that, in particular, sheep manure has been used for soil amelioration because the sheep farming at Karmøy increased in the last 300 years, with a cattle/sheep ratio from 1 (in the year 1723) to 3.5 to 6.8 (in the year 1865) [179]. Lundberg and Handegård [179] reported that the farmers even further increased the numbers of sheep in the 1900s. From the composition of sheep manure, which is higher in P (8000 mg P kg−1), H2SO4-P (28%), and Ca (12900 mg kg−1) than cattle manure [79], it should be assumed that the Norwegian Anthrosols would be more enriched in Ca-P (P-composition of various animal manure are shown in Figure 9). However, high proportions of NaOH-Pi in the Norwegian Anthrosols (with exception of profile S) were detected, which can be explained by the usage of peat because peat is high in Fe and Al (Table 5) and can react with the soluble P of the sheep manure. The usage of peat and its mixing with animal manures in the Karmøy region (profile F, Hi, and S) was very low or was not practice, which can be derived from the low horizon thickness. Additionally, that can also be derived from the limited occurrence of peat, especially at the small island of Feøy (1.3 km2), and much more rock outcrops in comparison to the Jæren region. The P-composition and the archaeological data from this region indicate the usage of composting materials and their mixing with marine biomass, organic household waste (human excreta), sheep excrements, and possibly some peat.
The high proportions and concentrations of Ca-P in the Norwegian Anthrosol of Sandhåland (profile S) may have been caused due to its location directly at the beach. Direct application of shell sand or indirect Ca inputs by marine biomass along with inputs of sheep manure plausibly explain binding of soluble manure-P by Ca-containing minerals in the soil after application. Evidence of the application of shell sand to soils as fertilizer was found at many historical sites such as in Scotland [29] or Ireland [24]. Further mixing of sand with sheep excrements in stables and later application to fields [185], which seems to have been a general ancient practice at coastal areas. The lower P concentration of this profile in comparison to the other Norwegian soils indicates less manuring and/or a time-period of application. From this we summarize that the profile S had strongly been amended with seaweed and moderately with sheep manure. Another important question is the aspect of quantity of soil amendments which is difficult to calculate. For example, we estimated an input of dried seaweed around 14 t ha−1 and/or 46 t ha−1 fresh seaweed per year in Hillesland, 16 and/or 52 t ha−1 at Feøy, 4 t ha−1 and/or 13 t ha−1 at Sandhåland, and 13 t ha−1 and/or 43 t ha−1 at Jæren for about 1000 years of cultivation [3].
Archaeological data supported also the usage of animal manures at the German island of Fehmarn. The cultural development at the Baltic Sea coast of Germany changed between 6100 and 6000 years BP from the use of marine resources to a productive agriculture [186]. It is assumed that farming started with the Funnelbeaker culture (6200 to 4800 BP) in the Baltic Sea region [187,188]. AMS 14C dating and complementary literature strongly indicate a formation of Baltic Anthrosols between the Nordic Bronze Age (3800 to 2800 BP) and the Roman Iron Age (2700 to 2000 BP) [2]. An archaeological site called Wangels (4400 to 3800 calBC) is directly situated close to the profile F-6 at the peninsula of Wagrien, in the direct vicinity of the island of Fehmarn. At this site many animal bones were found in a soil horizon and were assigned to 446 mammal bones, 12 bird bones, and 31 fish bones [189]. The majority of these animal bones was assigned to domestic animals [186]. Lübke et al. [186] showed many findings of domestic cattle bones (4838 to 3703 calBC) and a lower occurrence of sheep, goat, and swine bones at the archaeological site of Rosenhof, directly located at the profile F-6. Therefore, we assume that the German Anthrosols at the island of Fehmarn and at the peninsula of Wagrien were amended most likely with cattle excrements, which was also supported by the P-composition (Section 4.2, Section 4.3 and Section 4.4). In contrast, domestic animal bones were not found at the archaeological site Timmendorf-Nordmole 1 (6400 to 6100 BP) at the island of Poel [190]. Instead, mainly fish residues that accounted for 95% of all material was detected [190]. Seventy-eight percent of the total area of the island of Poel were agriculture land and pasture and grassland were rare in 1698 [191]. Greenage and roughage were very scarce due to the small abundance of pastures, and this limited the livestock husbandry so that animal manures were scarcely available for soil amendment [191]. At the island of Poel, a low livestock abundance in earlier times points to a low manuring practice with various excrements or manures in those Anthrosols. That can also be assumed for the Danish profile S-7 supported by high proportions of Po in this profile. It seems that the German Anthrosols at the island of Poel and the Danish profile S-7 were amended mainly with marine biomass, as supported by the S-isotope data [2].

5. Conclusions

The extensive comparisons of the complementary results from total elemental concentration in aqua regia extracts, SF, P K-edge XANES, and 31P-NMR of the Anthrosols under study with those from differently used and managed soils from literature and the alignment to archaeological references indicated input of various amendments to the Anthrosols. In detail, the P-composition and the archaeological data delivered clear evidence for the usage of peat, sheep manure, composts, and human excreta in addition to marine biomass and combustion residues in the Norwegian Anthrosols. Our investigations support the hypotheses from past studies that the Anthrosols in the Jæren region have been formed by the usage of peat, which was brought into stables as alternative bedding material, mixed with sheep manure, and later incorporated into these soils. The element composition and specific P species in the Norwegian Anthrosols at the islands of Karmøy and Feøy implied the incorporating of composts including materials such as seasand, organic household waste (human excreta), and sheep excrements in addition to marine biomass. Furthermore, we assume that the P-composition in the German Anthrosols at the island of Fehmarn and at the peninsula of Wagrien resulted from the application of domestic cattle manure as strongly supported by the archaeological findings of cattle bones in this region and the high proportions of Ca-P. In addition, the P-composition supports the input of combustion residues. Based on the low livestock history at the German island of Poel and the high proportions of Po in those Anthrosols, we assume that these soils were little manured with various excrements or manures but rather received marine biomass, which can be concluded for the Danish Anthrosol profile S-7 as well.
The ancient soil amendments, which are now sustained for more than 2000 years, by adding marine biomass, excrement, and compost from almost all regionally available organic matter sources, have greatly improved the ecological soil functions. Therefore, we can learn from the ancient agricultural practice that recycling organic matter and P from humans and local, area-adapted livestock improves soils and sustainably builds-up soil fertility for many generations. Today, adaptations of these old culture techniques are strongly recommended to feed a growing human population along with saving mineable P resources in order to combat climate change effects and maintain ecosystem health.

Supplementary Materials

The following are available online at https://www.mdpi.com/2571-8789/3/4/72/s1, Figure S1: Soil profiles at the island of Poel in Germany (P-4 and P-3), of Sjaelland in Denmark (S-7) and of Fehmarn in Germany (F-8), Table S1: P concentrations and proportions of the detected P-species of 31P-NMR spectra of 6 Northern European Anthrosols (F: Feøy; S: Sandhåland; PE1: Njærheim; S7: Vordingborg; F-6: Großenbrode; P-3: Niendorf), Figure S2: LCF results of the soil samples F-6 41-53 and Hi 30-45.

Author Contributions

Conceptualization, A.A. and P.L.; Methodology, A.A., P.L., Y.H. and K.B.; Validation, A.A.; Formal Analysis, A.A.; Investigation, A.A.; Writing-Original Draft Preparation, A.A.; Writing-Review & Editing, A.A., Y.H., K.B. and P.L.; Visualization, A.A.; Supervision, P.L.; Project Administration, P.L.; Funding Acquisition, P.L.

Funding

Parts of this work have been funded by the German Federal Ministry of Education and Research (BMBF) project InnoSoilPhos (No. 031A558) in the frame of the BonaRes-Program. The P K-edge XANES research described in this paper was performed at the Canadian Light Source (CLS), which is supported by the Canadian Foundation for Innovation, Natural Sciences and Engineering Research Council of Canada, the University of Saskatchewan, the Government of Saskatchewan, Western Economic Diversification Canada, the National Research Council Canada, and the Canadian Institutes of Health Research.

Acknowledgments

We thank E. Heilmann for lab assistance, S. Willbold for 31P-NMR measurements (Central Institute for Engineering, Electronics and Analytics, Analytics (ZEA-3), Forschungszentrum Jülich GmbH, 52425 Jülich, Germany). Thanks are also due to the landowners on Karmøy and Feøy who gave us permission to take soil samples from their land.

Conflicts of Interest

The authors declare no conflict of interest.

References

  1. Acksel, A.; Amelung, W.; Kühn, P.; Gehrt, E.; Regier, T.; Leinweber, P. Soil organic matter characteristics as indicator of Chernozem genesis in the Baltic Sea region. Geoderma Reg. 2016, 7, 187–200. [Google Scholar] [CrossRef]
  2. Acksel, A.; Kappenberg, A.; Kühn, P.; Leinweber, P. Human activity formed deep, dark topsoils around the Baltic Sea. Geoderma Reg. 2017, 10, 93–101. [Google Scholar] [CrossRef]
  3. Acksel, A.; Giani, L.; Stasch, C.; Kühn, P.; Eiter, S.; Potthoff, K.; Regier, T.; Leinweber, P. Humus-rich topsoils in SW Norway—Molecular and isotopic signatures of soil organic matter as indicators for anthropo-pedogenesis. Catena 2019, 172, 831–845. [Google Scholar] [CrossRef]
  4. Blume, H.P.; Leinweber, P. Plaggen soils: Landscape history, properties, and classification. J. Plant Nutr. Soil Sci. 2004, 167, 319–327. [Google Scholar] [CrossRef]
  5. Gerlach, R.; Baumewerd-Schmidt, H.; van den Borg, K.; Eckmeier, E.; Schmidt, M.W.I. Prehistoric alteration of soil in the Lower Rhine Basin, Northwest Germany-archaeological, 14C and geochemical evidence. Geoderma 2006, 136, 38–50. [Google Scholar] [CrossRef]
  6. Gerlach, R.; Fischer, P.; Eckmeier, E.; Hilgers, A. Buried dark soil horizons and archaeological features in the Neolithic settlement region of the Lower Rhine area, NW Germany: Formation, geochemistry and chronostratigraphy. Quat. Int. 2012, 265, 191–204. [Google Scholar] [CrossRef]
  7. Giani, L.; Makowsky, L.; Mueller, K. Plaggic Anthrosol: Soil of the Year 2013 in Germany: An overview on its formation, distribution, classification, soil function and threats. J. Plant Nutr. Soil Sci. 2014, 177, 320–329. [Google Scholar] [CrossRef]
  8. Klamm, M. Aufbau und Entstehung eisenzeitlicher Ackerfluren “celtic fields”. Neue Untersuchungen im Gehege Ausselbek, Kr. Schleswig-Flensburg. Archäol. Inf. 1993, 16, 122–124. [Google Scholar]
  9. Lauer, F.; Pätzold, S.; Gerlach, R.; Protze, J.; Willbold, S.; Amelung, W. Phosphorus status in archaeological arable topsoil relicts-Is it possible to reconstruct conditions for prehistoric agriculture in Germany? Geoderma 2013, 207, 111–120. [Google Scholar] [CrossRef]
  10. Wiedner, K.; Schneeweiß, J.; Dippold, M.A.; Glaser, B. Anthropogenic dark earth in Northern Germany—The Nordic Analogue to terra preta de Índio in Amazonia. Catena 2015, 132, 114–125. [Google Scholar] [CrossRef]
  11. Davidson, D.; Dercon, G.; Simpson, I.; Dalsgaard, K.; Spek, T.; Plant, D.A. The identification and significance of inputs to Anthrosols in North-West Europe. Atti Della Soc. Toscana Sci. Nat.-Mem. Ser. A 2007, 112, 79–83. [Google Scholar]
  12. Dercon, G.; Davidson, D.A.; Dalsgaard, K.; Simpson, I.A.; Spek, T.; Thomas, J. Formation of sandy anthropogenic soils in NW Europe: Identification of inputs based on particle size distribution. Catena 2005, 59, 341–356. [Google Scholar] [CrossRef]
  13. Domhof, J. Strooiselwinning voor potstallen in verband met de profielopbouw van heide-en oude bouwlandgronden. Boor En Spade 1953, 6, 192–203. [Google Scholar]
  14. Pape, J.C. Plaggen soils in the Netherlands. Geoderma 1970, 4, 229–255. [Google Scholar] [CrossRef]
  15. Van Smeerdijk, D.G.; Spek, T.; Kooistra, M.J. Anthropogenic soil formation and agricultural history of the open fields of Valthe (Drenthe, the Netherlands) in mediaeval and early modern times. In Neogene and Quaternary Geology of North-West Europe; Contributions on the Occasion of Waldo, H. Zagwijn’s Retirement; Mededelingen/Rijks Geologische Dienst: Haarlem, The Netherlands, 1995; Volume 52, pp. 451–479. [Google Scholar]
  16. Spek, M. The Age of Plaggen Soils. In An Evaluation of Dating Methods for Plaggen Soils in The Netherlands and Northern Germany; Food and Agriculture Organization: Rome, Italy, 1992. [Google Scholar]
  17. Bastiaens, J. Bodemsporen van beddenbouw in het zuidelijk deel van het plaggenlandbouwareaal. Hist. Geogr. Tijdschr. 1994, 12, 8. [Google Scholar]
  18. Langohr, R. Anthropic impact on the soilscape of the agricultural land in Belgium since early Neolithic: Contribution from archeopedology. In Etude et Gestion des Sols; Food and Agriculture Organization: Rome, Italy, 2001. [Google Scholar]
  19. Dalsgaard, K.; Karlsen, A.D.; Larsen, L. The farmer and the landscape. In Between Sea and Heather—Landscape and Settlements of the Ulfborg District Until 1700; Dalsgaard, K., Eriksen, P., Jensen, J.V., Rbmer, J.R., Eds.; Aarhus University Press: Aarhus, Denmark, 2000; pp. 87–103. (In Danish) [Google Scholar]
  20. Gormsen, G. Traditional heathland farming in Western Denmark. Reconstruction of an agricultural system from a peasant diary. Ethnol. Scand. 1991, 21, 105–125. [Google Scholar]
  21. Nielsen, N.H.; Kristiansen, S.M. Identifing ancient manuring: Traditional phosphate vs. multi-element analysis of archaeological soil. J. Archaeol. Sci. 2014, 42, 390–398. [Google Scholar] [CrossRef]
  22. Stoklund, B. Turf manuring on the Danish island of Laeso. Geogr. Tidsskr. 1999, 1, 209–214. [Google Scholar]
  23. Wilson, C.A.; Davidson, D.A.; Cresser, M.S. Multi-element soil analysis: An assessment of its potential as an aid to archaeological interpretation. J. Archaeol. Sci. 2008, 35, 412–424. [Google Scholar] [CrossRef]
  24. Conry, M.J. Plaggen soils. A review of man-made raised soils. Soils Fertil. 1974, 37, 319–326. [Google Scholar]
  25. Barber, J.W. Excavations on Iona, 1979. In Proceedings of the Society of Antiquaries of Scotland; National Museum of Antiquities of Scotland: Edinburgh, UK, 1981; Volume 111, pp. 282–380. [Google Scholar]
  26. Carter, S. A reassessment of the origins of the St Andrews «garden soil». Tayside Fife Archaeol. J. 2001, 7, 87–92. [Google Scholar]
  27. Davidson, D.A.; Carter, S.P. Micromorphological evidence of past agricultural practices in cultivated soils: The impact of a traditional agricultural system on soils in Papa Stour, Shetland. J. Archaeol. Sci. 1998, 25, 827–838. [Google Scholar] [CrossRef]
  28. Davidson, D.A.; Simpson, I.A. The formation of deep topsoils in Orkney. Earth Surf. Process. Landf. 1984, 9, 75–81. [Google Scholar] [CrossRef]
  29. Entwistle, J.A.; Abrahams, P.W. Multi-element analysis of soils and sediments from Scottish historical sites. The potential of inductively coupled plasma-mass spectrometry for rapid site investigation. J. Archaeol. Sci. 1997, 24, 407–416. [Google Scholar] [CrossRef]
  30. Simpson, I.A. The chronology of anthropogenic soil formation in Orkney. Scott. Geogr. Mag. 1993, 109, 4–11. [Google Scholar] [CrossRef]
  31. Simpson, I.A. Relict properties of anthropogenic deep top soils as indicators of infield management in Marwick, West Mainland, Orkney. J. Archaeol. Sci. 1997, 24, 365–380. [Google Scholar] [CrossRef]
  32. Simpson, I.A.; Dockrill, S.J.; Bull, I.D.; Evershed, R.P. Early anthropogenic soil formation at Tofts Ness, Sanday, Orkney. J. Archaeol. Sci. 1998, 25, 729–746. [Google Scholar] [CrossRef]
  33. Simpson, I.A.; van Bergen, P.F.; Perret, V.; Elhmmali, M.M.; Roberts, D.J.; Evershed, R.P. Lipid biomarkers of manuring practice in relict anthropogenic soils. Holocene 1999, 9, 223–229. [Google Scholar] [CrossRef]
  34. Giani, L.; Chertov, O.; Gebhardt, C.; Kalinina, O.; Nadporozhskaya, M.; Tolkdorf-Lienemann, E. Plagganthrepts in northwest Russia? Genesis, properties and classification. Geoderma 2004, 121, 113–122. [Google Scholar] [CrossRef]
  35. Hubbe, A.; Chertov, O.; Kalinina, O.; Nadporozhskaya, M.; Tolksdorf-Lienemann, E.; Giani, L. Evidence of plaggen soils in European North Russia (Arkhangelsk region). J. Plant Nutr. Soil Sci. 2007, 170, 329–334. [Google Scholar] [CrossRef]
  36. Kalinina, O.; Chertov, O.; Nadporozhskaya, M.; Giani, L. Properties of soil organic matter of Plaggic Anthrosols from Northwest Germany, Northwest and North Russia. Arch. Agron. Soil Sci. 2009, 55, 477–492. [Google Scholar] [CrossRef]
  37. Glaser, B.; Haumaier, L.; Guggenberger, G.; Zech, W. The ‘Terra Preta’ phenomenon: A model for sustainable agriculture in the humid tropics. Naturwissenschaften 2001, 88, 37–41. [Google Scholar] [CrossRef] [PubMed]
  38. Liang, B.; Lehmann, J.; Solomon, D.; Kinyangi, J.; Grossman, J.; O’Neill, B.; Skjemstad, J.O.; Thies, J.; Luizão, F.J.; Petersen, J.; et al. Black Carbon increases cation exchange capacity in Soils. Soil Sci. Soc. Am. J. 2006, 70, 1719. [Google Scholar] [CrossRef]
  39. Solomon, D.; Lehmann, J.; Thies, J.; Schäfer, T.; Liang, B.; Kinyangi, J.; Neves, E.; Petersen, J.; Luizao, F.; Skjemstad, J. Molecular signature and sources of biochemical recalcitrance of organic C in Amazonian Dark Earths. Geochim. Cosmochim. Acta 2007, 71, 2285–2298. [Google Scholar] [CrossRef]
  40. Holliday, V.T.; Gartner, W.G. Methods of soil P analysis in archaeology. J. Archaeol. Sci. 2007, 34, 301–333. [Google Scholar] [CrossRef]
  41. Bethell, P.; Máté, I. The Use of Soil Phosphate Analysis in Archaeology: A Critique. I: Scientific Analysis in Archaeology and its Interpretation; Henderson, J., Ed.; Monograph No. 19; Oxford University Committee for Archaeology: Oxford, UK, 1989. [Google Scholar]
  42. Eidt, R.C. Advances in Abandoned Settlement Analysis: Application to Prehistoric Anthrosols in Colombia, South America; Center for Latin America, University of Wisconsin-Milwaukee Milwaukee: Milwaukee, WI, USA, 1984; ISBN 0-930450-53-1. [Google Scholar]
  43. Proudfoot, B. The Analysis and Interpretation of Soil Phosphorus in Archaeological Contexts. In Geoarchaeology; Davidson, D.A., Shakley, M.L., Eds.; Duckworth: London, UK, 1976; pp. 93–113. [Google Scholar]
  44. Provan, D.M.J. Soil phosphate analysis as a tool in archaeology. Nor. Archaeol. Rev. 1971, 4, 37–50. [Google Scholar] [CrossRef]
  45. Condron, L.M.; Newman, S. Revisiting the fundamentals of phosphorus fractionation of sediments and soils. J. Soils Sediments 2011, 11, 830–840. [Google Scholar] [CrossRef]
  46. Negassa, W.; Leinweber, P. How does the hedley sequential phosphorus fractionation reflect impacts of land use and management on soil phosphorus: A review. J. Plant Nutr. Soil Sci. 2009, 172, 305–325. [Google Scholar] [CrossRef]
  47. Hedley, M.J.; Stewart, J.W.B.; Chauhan, B.S. Changes in inorganic and organic soil phosphorus fractions induced by cultivation practices and by laboratory incubations 1. Soil Sci. Soc. Am. J. 1982, 46, 970. [Google Scholar] [CrossRef]
  48. Tiessen, H.; Moir, J.O. Characterization of available P by sequential extraction. Soil Sampl. Methods Anal. 1993, 7, 5–229. [Google Scholar]
  49. Cross, A.F.; Schlesinger, W.H. A literature review and evaluation of the. Hedley fractionation: Applications to the biogeochemical cycle of soil phosphorus in natural ecosystems. Geoderma 1995, 64, 197–214. [Google Scholar] [CrossRef]
  50. Leinweber, P.; Haumaier, L.; Zech, W. Sequential extractions and 31P-NMR spectroscopy of phosphorus forms in animal manures, whole soils and particle-size separates from a densely populated livestock area in northwest Germany. Biol. Fertil. Soils 1997, 25, 89–94. [Google Scholar] [CrossRef]
  51. Scherer, H.; Sharma, S. Phosphorus fractions and phosphorus delivery potential of a luvisol derived from loess amended with organic materials. Biol. Fertil. Soils 2002, 35, 414–419. [Google Scholar]
  52. Su, J.; Wang, H.; Kimberley, M.O.; Beecroft, K.; Magesan, G.N.; Hu, C. Fractionation and mobility of phosphorus in a sandy forest soil amended with biosolids. Environ. Sci. Pollut. Res.-Int. 2007, 14, 529–535. [Google Scholar] [CrossRef]
  53. Qian, P.; Schoenau, J.J.; Wu, T.; Mooleki, P. Phosphorus amounts and distribution in a Saskatchewan soil after five years of swine and cattle manure application. Can. J. Soil Sci. 2004, 84, 275–281. [Google Scholar] [CrossRef]
  54. Kruse, J.; Abraham, M.; Amelung, W.; Baum, C.; Bol, R.; Kühn, O.; Lewandowski, H.; Niederberger, J.; Oelmann, Y.; Rüger, C. Innovative methods in soil phosphorus research: A review. J. Plant Nutr. Soil Sci. 2015, 178, 43–88. [Google Scholar] [CrossRef] [Green Version]
  55. Abdala, D.B.; da Silva, I.R.; Vergütz, L.; Sparks, D.L. Long-term manure application effects on phosphorus speciation, kinetics and distribution in highly weathered agricultural soils. Chemosphere 2015, 119, 504–514. [Google Scholar] [CrossRef]
  56. Ajiboye, B.; Akinremi, O.O.; Racz, G.J. Laboratory characterization of phosphorus in fresh and oven-dried organic amendments. J. Environ. Qual. 2004, 33, 1062–1069. [Google Scholar] [CrossRef]
  57. Ajiboye, B.; Akinremi, O.O.; Hu, Y.; Jürgensen, A. XANES speciation of phosphorus in organically amended and fertilized Vertisol and Mollisol. Soil Sci. Soc. Am. J. 2008, 72, 1256. [Google Scholar] [CrossRef]
  58. Beauchemin, S.; Hesterberg, D.; Chou, J.; Beauchemin, M.; Simard, R.R.; Sayers, D.E. Speciation of phosphorus in phosphorus-enriched agricultural soils using X-ray absorption near-edge structure spectroscopy and chemical fractionation. J. Environ. Qual. 2003, 32, 1809. [Google Scholar] [CrossRef] [PubMed]
  59. Kar, G.; Hundal, L.S.; Schoenau, J.J.; Peak, D. Direct chemical speciation of P in sequential chemical extraction residues using P K-edge X-ray absorption near-edge structure spectroscopy. Soil Sci. 2011, 176, 589–595. [Google Scholar] [CrossRef]
  60. Khatiwada, R.; Hettiarachchi, G.M.; Mengel, D.B.; Fei, M. Speciation of phosphorus in a fertilized, reduced-till soil system: In-field treatment incubation study. Soil Sci. Soc. Am. J. 2012, 76, 2006. [Google Scholar] [CrossRef]
  61. Koch, M.; Kruse, J.; Eichler-löbermann, B.; Zimmer, D.; Willbold, S.; Leinweber, P.; Siebers, N. Geoderma Phosphorus stocks and speciation in soil profiles of a long-term fertilizer experiment: Evidence from sequential fractionation, P K-edge XANES, and P NMR spectroscopy. Geoderma 2018, 316, 115–126. [Google Scholar] [CrossRef]
  62. Liu, J.; Yang, J.; Cade-Menun, B.J.; Liang, X.; Hu, Y.; Liu, C.W.; Zhao, Y.; Li, L.; Shi, J. Complementary phosphorus speciation in agricultural soils by sequential fractionation, solution 31P nuclear magnetic resonance, and phosphorus K-edge X-ray absorption near-edge structure spectroscopy. J. Environ. Qual. 2013, 42, 1763–1770. [Google Scholar] [CrossRef]
  63. Liu, J.; Hu, Y.; Yang, J.; Abdi, D.; Cade-Menun, B.J. Investigation of soil legacy phosphorus transformation in long-term agricultural fields using sequential fractionation, P K-edge XANES and solution P NMR spectroscopy. Environ. Sci. Technol. 2014, 49, 168–176. [Google Scholar] [CrossRef]
  64. Liu, J.; Cade-Menun, B.J.; Yang, J.; Hu, Y.; Liu, C.W.; Tremblay, J.; LaForge, K.; Schellenberg, M.; Hamel, C.; Bainard, L.D. Long-term land use affects phosphorus speciation and the composition of phosphorus cycling genes in agricultural soils. Front. Microbiol. 2018, 9, 1–14. [Google Scholar] [CrossRef]
  65. Lombi, E.; Scheckel, K.G.; Armstrong, R.D.; Forrester, S.; Cutler, J.N.; Paterson, D. Speciation and distribution of phosphorus in a fertilized soil. Soil Sci. Soc. Am. J. 2006, 70, 2038. [Google Scholar] [CrossRef]
  66. Luo, L.; Ma, Y.; Sanders, R.L.; Xu, C.; Li, J.; Myneni, S.C.B. Phosphorus speciation and transformation in long-term fertilized soil: Evidence from chemical fractionation and P K-edge XANES spectroscopy. Nutr. Cycl. Agroecosyst. 2017, 107, 215–226. [Google Scholar] [CrossRef]
  67. Peak, D.; Kar, G.; Hundal, L.; Schoenau, J. Kinetics and mechanisms of phosphorus release in a soil amended with biosolids or inorganic fertilizer. Soil Sci. 2012, 177, 183–187. [Google Scholar] [CrossRef]
  68. Prietzel, J.; Thieme, J.; Paterson, D. Phosphorus speciation of forest-soil organic surface layers using P K-edge XANES spectroscopy. J. Plant Nutr. Soil Sci. 2010, 173, 805–807. [Google Scholar] [CrossRef]
  69. Sato, S.; Solomon, D.; Hyland, C.; Ketterings, Q.M.; Lehmann, J. Phosphorus speciation in manure and manure-amended soils using XANES spectroscopy. Environ. Sci. Technol. 2005, 39, 7485–7491. [Google Scholar] [CrossRef] [PubMed]
  70. Toor, G.S.; Peak, J.D.; Sims, J.T. Phosphorus speciation in broiler litter and turkey manure produced from modified diets. J. Environ. Qual. 2005, 34, 687–697. [Google Scholar] [CrossRef] [PubMed]
  71. Annaheim, K.E.; Doolette, A.L.; Smernik, R.J.; Mayer, J.; Oberson, A.; Frossard, E.; Bünemann, E.K. Long-term addition of organic fertilizers has little effect on soil organic phosphorus as characterized by 31P NMR spectroscopy and enzyme additions. Geoderma 2015, 257, 67–77. [Google Scholar] [CrossRef]
  72. Doolette, A.L.; Smernik, R.J.; Dougherty, W.J. Spiking Improved Solution Phosphorus-31 Nuclear Magnetic Resonance Identification of Soil Phosphorus Compounds. Soil Sci. Soc. Am. J. 2009, 73, 919. [Google Scholar] [CrossRef]
  73. Dou, Z.; Ramberg, C.F.; Toth, J.D.; Wang, Y.; Sharpley, A.N.; Boyd, S.E.; Chen, C.R.; Williams, D.; Xu, Z.H. Phosphorus speciation and sorption-desorption characteristics in heavily manured soils. Soil Sci. Soc. Am. J. 2009, 73, 93. [Google Scholar] [CrossRef]
  74. Hansen, J.C.; Cade-Menun, B.J.; Strawn, D.G. Phosphorus speciation in manure-amended alkaline soils. J. Environ. Qual. 2004, 33, 1521–1527. [Google Scholar] [CrossRef]
  75. Hawkes, G.E.; Powlson, D.S.; Randall, E.W.; Tate, K.R. A 31P nuclear magnetic resonance study of the phosphorus species in alkali extracts of soils from long-term field experiments. J. Soil Sci. 1984, 35, 35–45. [Google Scholar] [CrossRef]
  76. Koopmans, G.F.; Chardon, W.J.; Dolfing, J.; Oenema, O.; Van der Meer, P.; Van Riemsdijk, W.H. Wet chemical and phosphorus-31 nuclear magnetic resonance analysis of phosphorus speciation in a sandy soil receiving long-term fertilizer or animal manure applications. J. Environ. Qual. 2003, 32, 287–295. [Google Scholar] [CrossRef]
  77. Koopmans, G.F.; Chardon, W.J.; McDowell, R.W. Phosphorus movement and speciation in a sandy soil profile after long-term animal manure applications. J. Environ. Qual. 2007, 36, 305. [Google Scholar] [CrossRef]
  78. Li, M.; Zhang, J.; Wang, G.; Yang, H.; Whelan, M.J.; White, S.M. Organic phosphorus fractionation in wetland soil profiles by chemical extraction and phosphorus-31 nuclear magnetic resonance spectroscopy. Appl. Geochem. 2013, 33, 213–221. [Google Scholar] [CrossRef]
  79. McDowell, R.W.; Stewart, I. Phosphorus in fresh and dry dung of grazing dairy cattle, deer, and sheep. J. Environ. Qual. 2005, 34, 598–607. [Google Scholar] [CrossRef] [PubMed]
  80. McDowell, R.W.; Condron, L.M.; Stewart, I.; Cave, V. Chemical nature and diversity of phosphorus in New Zealand pasture soils using 31P nuclear magnetic resonance spectroscopy and sequential fractionation. Nutr. Cycl. Agroecosyst. 2005, 72, 241–254. [Google Scholar] [CrossRef]
  81. Shafqat, M.N.; Pierzynski, G.M.; Xia, K. Phosphorus source effects on soil organic phosphorus: A 31P NMR study. Commun. Soil Sci. Plant Anal. 2009, 40, 1722–1746. [Google Scholar] [CrossRef]
  82. Guggenberger, G.; Christensen, B.T.; Rubæk, G.; Zech, W. Land-use and fertilization effects on P forms in two European soils: Resin extraction and 31P-NMR analysis. Eur. J. Soil Sci. 1996, 47, 605–614. [Google Scholar] [CrossRef]
  83. Solomon, D.; Lehmann, J. Loss of phosphorus from soil in semi-arid northern Tanzania as a result of cropping: Evidence from sequential extraction and 31P-NMR spectroscopy. Eur. J. Soil Sci. 2000, 51, 699–708. [Google Scholar] [CrossRef]
  84. Turrion, M.B.; Lafuente, F.; Aroca, M.J.; López, O.; Mulas, R.; Ruipérez, C. Characterization of soil phosphorus in a fire-affected forest Cambisol by chemical extractions and 31P-NMR spectroscopy analysis. Sci. Total Environ. 2010, 408, 3342–3348. [Google Scholar] [CrossRef]
  85. Murphy, J.; Riley, J.P. A modified single solution method for the determination of phosphate in natural waters. Anal. Chim. Acta 1962, 27, 31–36. [Google Scholar] [CrossRef]
  86. Acksel, A.; Baumann, K.; Hu, Y.; Leinweber, P. A critical review and evaluation of some P-research methods. Submitt. Commun. Soil. Sci. Plant Anal. 2019, 9. [Google Scholar] [CrossRef]
  87. Baumann, K.; Glaser, K.; Mutz, J.-E.; Karsten, U.; MacLennan, A.; Hu, Y.; Michalik, D.; Kruse, J.; Eckhardt, K.-U.; Schall, P. Biological soil crusts of temperate forests: Their role in P cycling. Soil Biol. Biochem. 2017, 109, 156–166. [Google Scholar] [CrossRef]
  88. R Core Team. R: A Language and Environment for Statistical Computing. 2013. Available online: https://cran.biodisk.org/web/packages/dplR/vignettes/intro-dplR.pdf (accessed on 29 October 2019).
  89. Schnepel, C.; Potthoff, K.; Eiter, S.; Giani, L. Evidence of plaggen soils in SW Norway. J. Plant Nutr. Soil Sci. 2014, 177, 638–645. [Google Scholar] [CrossRef]
  90. Kidd, P.S.; Domínguez-Rodríguez, M.J.; Díez, J.; Monterroso, C. Bioavailability and plant accumulation of heavy metals and phosphorus in agricultural soils amended by long-term application of sewage sludge. Chemosphere 2007, 66, 1458–1467. [Google Scholar] [CrossRef] [PubMed]
  91. Sui, Y.; Thompson, M.L.; Shang, C. Fractionation of phosphorus in a Mollisol amended with biosolids. Soil Sci. Soc. Am. J. 1999, 63, 1174–1180. [Google Scholar] [CrossRef]
  92. Xu, G.; Shao, H.; Zhang, Y.; Junna, S. Nonadditive effects of biochar amendments on soil phosphorus fractions in two contrasting soils. Land Degrad. Dev. 2018, 29, 2720–2727. [Google Scholar] [CrossRef]
  93. Agbenin, J.O.; Goladi, J.T. Dynamics of phosphorus fractions in a savanna Alfisol under continuous cultivation. Soil Use Manag. 1998, 14, 59–64. [Google Scholar] [CrossRef]
  94. Keller, M.; Oberson, A.; Annaheim, K.E.; Tamburini, F.; Mäder, P.; Mayer, J.; Frossard, E.; Bünemann, E.K. Phosphorus forms and enzymatic hydrolyzability of organic phosphorus in soils after 30 years of organic and conventional farming. J. Plant Nutr. Soil Sci. 2012, 175, 385–393. [Google Scholar] [CrossRef]
  95. Lehmann, J.; Lan, Z.; Hyland, C.; Sato, S.; Solomon, D.; Ketterings, Q.M. Long-term dynamics of phosphorus forms and retention in manure-amended soils. Environ. Sci. Technol. 2005, 39, 6672–6680. [Google Scholar] [CrossRef]
  96. Mao, X.; Xu, X.; Lu, K.; Gielen, G.; Luo, J.; He, L.; Donnison, A.; Xu, Z.; Xu, J.; Yang, W. Effect of 17 years of organic and inorganic fertilizer applications on soil phosphorus dynamics in a rice–wheat rotation cropping system in eastern China. J. Soils Sedim. 2015, 15, 1889–1899. [Google Scholar] [CrossRef]
  97. Reddy, D.D.; Rao, A.S.; Takkar, P.N. Effects of repeated manure and fertilizer phosphorus additions on soil phosphorus dynamics under a soybean-wheat rotation. Biol. Fertil. Soils 1999, 28, 150–155. [Google Scholar] [CrossRef]
  98. Tran, T.S.; N’dayegamiye, A. Long-term effects of fertilizers and manure application on the forms and availability of soil phosphorus. Can. J. Soil Sci. 1995, 75, 281–285. [Google Scholar] [CrossRef]
  99. Campbell, C.A.; Biederbeck, V.O.; Selles, F.; Schnitzer, M.; Stewart, J.W.B. Effect of manure and P fertilizer on properties of a Black Chernozem in southern Saskatchewan. Can. J. Soil Sci. 1986, 66, 601–614. [Google Scholar] [CrossRef]
  100. Couto, R.d.R.; Ferreira, P.A.A.; Ceretta, C.A.; Lourenzi, C.R.; Facco, D.B.; Tassinari, A.; Piccin, R.; Conti, L.D.; Gatiboni, L.C.; Schapanski, D. Phosphorus fractions in soil with a long history of organic waste and mineral fertilizer addition. Bragantia 2017, 76, 155–166. [Google Scholar] [CrossRef] [Green Version]
  101. Guardini, R.; Comin, J.J.; Schmitt, D.E.; Tiecher, T.; Bender, M.A.; dos Santos, D.R.; Mezzari, C.P.; Oliveira, B.S.; Gatiboni, L.C.; Brunetto, G. Accumulation of phosphorus fractions in typic Hapludalf soil after long-term application of pig slurry and deep pig litter in a no-tillage system. Nutr. Cycl. Agroecosyst. 2012, 93, 215–225. [Google Scholar] [CrossRef]
  102. Hao, X.; Godlinski, F.; Chang, C. Distribution of phosphorus forms in soil following long-term continuous and discontinuous cattle manure applications. Soil Sci. Soc. Am. J. 2008, 72, 90–97. [Google Scholar] [CrossRef]
  103. López-Contreras, A.Y.; Hernández-Valencia, I.; López-Hernández, D. Fractionation of soil phosphorus in organic amended farms located on savanna sandy soils of Venezuelan Amazonian. Biol. Fertil. Soils 2007, 43, 771–777. [Google Scholar] [CrossRef]
  104. Motavalli, P.P.; Miles, R.J. Soil phosphorus fractions after 111 years of animal manure and fertilizer applications. Biol. Fertil. Soils 2002, 36, 35–42. [Google Scholar]
  105. Sharpley, A.N.; McDowell, R.W.; Kleinman, P.J.A. Amounts, forms, and solubility of phosphorus in soils receiving manure. Soil Sci. Soc. Am. J. 2004, 68, 2048–2057. [Google Scholar] [CrossRef]
  106. Zheng, Z.; Simard, R.R.; Lafond, J.; Parent, L.E. Pathways of soil phosphorus transformations after 8 years of cultivation under contrasting cropping practices. Soil Sci. Soc. Am. J. 2002, 66, 999–1007. [Google Scholar] [CrossRef]
  107. Zheng, Z.; MacLeod, J.A.; Sanderson, J.B.; Lafond, J. Soil phosphorus dynamics after ten annual applications of mineral fertilizers and liquid dairy manure: Fractionation and path analyses. Soil Sci. 2004, 169, 449–456. [Google Scholar] [CrossRef]
  108. Condron, L.M.; Goh, K.M. Effects of long-term phosphatic fertilizer applications on amounts and forms of phosphorus in soils under irrigated pasture in New Zealand. J. Soil Sci. 1989, 40, 383–395. [Google Scholar] [CrossRef]
  109. Lehmann, J.; Campos, C.V.; de Macêdo, J.L.V.; German, L. Sequential P fractionation of relict anthropogenic dark earths of Amazonia. Amaz. Dark Earths Explor. Space Time 2004, 26416, 113. [Google Scholar]
  110. Magid, J. Vegetation effects on phosphorus fractions in set-aside soils. Plant Soil 1993, 149, 111–119. [Google Scholar] [CrossRef]
  111. Richards, J.E.; Bates, T.E.; Sheppard, S.C. Changes in the forms and distribution of soil phosphorus due to long-term corn production. Can. J. Soil Sci. 1995, 75, 311–318. [Google Scholar] [CrossRef]
  112. Verma, S.; Subehia, S.K.; Sharma, S.P. Phosphorus fractions in an acid soil continuously fertilized with mineral and organic fertilizers. Biol. Fertil. Soils 2005, 41, 295–300. [Google Scholar] [CrossRef]
  113. Agbenin, J.O.; Tiessen, H. Phosphorus transformations in a toposequence of lithosols and cambisols from semi-arid northeastern Brazil. Geoderma 1994, 62, 345–362. [Google Scholar] [CrossRef]
  114. Alt, F.; Oelmann, Y.; Herold, N.; Schrumpf, M.; Wilcke, W. Phosphorus partitioning in grassland and forest soils of Germany as related to land-use type, management intensity, and land use–related pH. J. Plant Nutr. Soil Sci. 2011, 174, 195–209. [Google Scholar] [CrossRef]
  115. Araújo, M.S.B.; Schaefer, C.E.R.; Sampaio, E.V.S.B. Soil phosphorus fractions from toposequences of semi-arid Latosols and Luvisols in northeastern Brazil. Geoderma 2004, 119, 309–321. [Google Scholar] [CrossRef]
  116. Chen, C.R.; Condron, L.M.; Davis, M.R.; Sherlock, R.R. Effects of afforestation on phosphorus dynamics and biological properties in a New Zealand grassland soil. Plant Soil 2000, 220, 151–163. [Google Scholar] [CrossRef]
  117. Cross, A.F.; Schlesinger, W.H. Biological and geochemical controls on phosphorus fractions in semiarid soils. Biogeochemistry 2001, 52, 155–172. [Google Scholar] [CrossRef]
  118. Derry, D.D.; Voroney, R.P.; Briceño, J.A. Long-term effects of short-fallow frijol tapado on soil phosphorus pools in Costa Rica. Agric. Ecosyst. Environ. 2005, 110, 91–103. [Google Scholar] [CrossRef]
  119. Schlichting, A.; Leinweber, P.; Meissner, R.; Altermann, M. Sequentially extracted phosphorus fractions in peat-derived soils. J. Plant Nutr. Soil Sci. 2002, 165, 290–298. [Google Scholar] [CrossRef]
  120. Schoenau, J.J.; Stewart, J.W.B.; Bettany, J.R. Forms and cycling of phosphorus in prairie and boreal forest soils. Biogeochemistry 1989, 8, 223–237. [Google Scholar] [CrossRef]
  121. Tchienkoua, M.; Zech, W. Chemical and spectral characterization of soil phosphorus under three land uses from an Andic Palehumult in West Cameroon. Agric. Ecosyst. Environ. 2003, 100, 193–200. [Google Scholar] [CrossRef]
  122. Tiessen, H.; Salcedo, I.H.; Sampaio, E.V.S.B. Nutrient and soil organic matter dynamics under shifting cultivation in semi-arid northeastern Brazil. Agric. Ecosyst. Environ. 1992, 38, 139–151. [Google Scholar] [CrossRef]
  123. Tiessen, H.; Stewart, J.W.B.; Moir, J.O. Changes in organic and inorganic phosphorus composition of two grassland soils and their particle size fractions during 60–90 years of cultivation. J. Soil Sci. 1983, 34, 815–823. [Google Scholar] [CrossRef]
  124. Malik, M.A.; Khan, K.S.; Marschner, P.; Ali, S. Organic amendments differ in their effect on microbial biomass and activity and on P pools in alkaline soils. Biol. Fertil. Soils 2013, 49, 415–425. [Google Scholar] [CrossRef]
  125. Edmeades, D.C. The long-term effects of manures and fertilisers on soil productivity and quality: A review. Nutr. Cycl. Agroecosyst. 2003, 66, 165–180. [Google Scholar] [CrossRef]
  126. Myhre, B. Arable fields and farm structure. Archaeol. Environ. 1985, 4, 69–82. [Google Scholar]
  127. Rose, C.; Parker, A.; Jefferson, B.; Cartmell, E. The characterization of feces and urine: A review of the literature to inform advanced treatment technology. Crit. Rev. Environ. Sci. Technol. 2015, 45, 1827–1879. [Google Scholar] [CrossRef]
  128. Faridullah, F.; Khalid, Z.; Irshad, M.; Alam, A.; Ahmed, T.; Bhatti, Z. Fractionation of phosphorus in human and animal wastes. Minerva Biotecnol. 2015, 27, 63–70. [Google Scholar]
  129. Feachem, R.G. Health Aspects of Excreta and Wastewater Management; review and analysis, part 1; World Bank: Washington, DC, USA, 1978. [Google Scholar]
  130. Strauss, M. Health Aspects of Nightsoil and Sludge Use in Agriculture and Aquaculture. Part II: Pathogen Survival; International Reference Centre for Waste Disposal: Duebendorf, Switzerland, 1985. [Google Scholar]
  131. Li, G.; Li, H.; Leffelaar, P.A.; Shen, J.; Zhang, F. Characterization of phosphorus in animal manures collected from three (dairy, swine, and broiler) farms in China. PLoS ONE 2014, 9, e102698. [Google Scholar] [CrossRef] [PubMed]
  132. Gagnon, B.; Demers, I.; Ziadi, N.; Chantigny, M.H.; Parent, L.-E.; Forge, T.A.; Larney, F.J.; Buckley, K.E. Forms of phosphorus in composts and in compost-amended soils following incubation. Can. J. Soil Sci. 2012, 92, 711–721. [Google Scholar] [CrossRef] [Green Version]
  133. Gagnon, B.; Simard, R.R. Soil P fractions as affected by on-farm composts in a controlled incubation study. Can. J. Soil Sci. 2003, 83, 223–226. [Google Scholar] [CrossRef]
  134. Larrea-Marín, M.T.; Pomares-Alfonso, M.S.; Gómez-Juaristi, M.; Sánchez-Muniz, F.J.; de la Rocha, S.R. Validation of an ICP-OES method for macro and trace element determination in Laminaria and Porphyra seaweeds from four different countries. J. Food Compos. Anal. 2010, 23, 814–820. [Google Scholar] [CrossRef]
  135. Mæhre, H.K.; Malde, M.K.; Eilertsen, K.E.; Elvevoll, E.O. Characterization of protein, lipid and mineral contents in common Norwegian seaweeds and evaluation of their potential as food and feed. J. Sci. Food Agric. 2014, 94, 3281–3290. [Google Scholar] [CrossRef] [PubMed]
  136. Biancarosa, I.; Belghit, I.; Bruckner, C.G.; Liland, N.S.; Waagbø, R.; Amlund, H.; Heesch, S.; Lock, E.J. Chemical characterization of 21 species of marine macroalgae common in Norwegian waters: Benefits of and limitations to their potential use in food and feed. J. Sci. Food Agric. 2018, 98, 2035–2042. [Google Scholar] [CrossRef]
  137. Huth, V.; Günther, A.; Augustin, J.; Borraz, E.; Ellerbrock, R.; Giebels, M.; Hierold, W.; Hoffmann, M.; Jurasinski, G.; Rosskopf, N.; et al. Treibhausgas-Emissionen aus wiedervernässten Niedermooren Nordostdeutschlands. In Proceedings of the DBG Mitteilungen Band 116-2013-Exkursionsführer Rostock, Rostock, Germany, 7–12 September 2013; Volume 116, p. 180, ISBN 0343-1071. [Google Scholar]
  138. Lehmann, J.; Pereira, J.; Steiner, C.; Nehls, T.; Zech, W.; Glaser, B. Nutrient availability and leaching in an archaeological Anthrosol and a Ferralsol of the Central Amazon basin: Fertilizer, manure and charcoal amendments. Plant Soil 2003, 249, 343–357. [Google Scholar] [CrossRef]
  139. Schmidt, M.J.; Py-daniel, A.R.; Paula, C.D.; Valle, R.B.M.; Caromano, C.F.; Texeira, W.G.; Barbosa, C.A.; Fonseca, J.A.; Magalhães, M.P.; Silva, D.; et al. Dark earths and the human built landscape in Amazonia: A widespread pattern of anthrosol formation. J. Archaeol. Sci. 2014, 42, 152–165. [Google Scholar] [CrossRef]
  140. Reimann, C.; Birke, M.; Demetriades, A.; Filzmoser, P.; O’Connor, P. Chemistry of Europe’s Agricultural Soils, Part A; Schweitzerbart: Stuttgart, Germany, 2014. [Google Scholar]
  141. Barej, J.A.M.; Pätzold, S.; Perkons, U.; Amelung, W. Phosphorus fractions in bulk subsoil and its biopore systems. Eur. J. Soil Sci. 2014, 65, 553–561. [Google Scholar] [CrossRef]
  142. Chang, A.C.; Page, A.L.; Sutherland, F.H.; Grgurevic, E. Fractionation of Phosphorus in Sludge-Affected Soils 1. J. Environ. Qual. 1983, 12, 286–290. [Google Scholar] [CrossRef]
  143. Qian, P.; Schoenau, J.J. Fractionation of P in soil as influenced by a single addition of liquid swine manure. Can. J. Soil Sci. 2000, 80, 561–566. [Google Scholar] [CrossRef] [Green Version]
  144. van Zwieten, L.; Kimber, S.; Morris, S.; Chan, K.Y.; Downie, A.; Rust, J.; Joseph, S.; Cowie, A. Effects of biochar from slow pyrolysis of papermill waste on agronomic performance and soil fertility. Plant Soil 2010, 327, 235–246. [Google Scholar] [CrossRef]
  145. Peng, X.; Ye, L.L.; Wang, C.H.; Zhou, H.; Sun, B. Temperature- and duration-dependent rice straw-derived biochar: Characteristics and its effects on soil properties of an Ultisol in southern China. Soil Tillage Res. 2011, 112, 159–166. [Google Scholar] [CrossRef]
  146. Frossard, E.; Tekely, P.; Grimal, J.Y. Characterization of phosphate species in urban sewage sludges by high-resolution solid-state 31P NMR. Eur. J. Soil Sci. 1994, 45, 403–408. [Google Scholar] [CrossRef]
  147. Khan, K.S.; Joergensen, R.G. Changes in microbial biomass and P fractions in biogenic household waste compost amended with inorganic P fertilizers. Bioresour. Technol. 2009, 100, 303–309. [Google Scholar] [CrossRef] [PubMed]
  148. Ngo, P.-T.; Rumpel, C.; Ngo, Q.-A.; Alexis, M.; Vargas, G.V.; de la Luz Mora Gil, M.; Dang, D.-K.; Jouquet, P. Biological and chemical reactivity and phosphorus forms of buffalo manure compost, vermicompost and their mixture with biochar. Bioresour. Technol. 2013, 148, 401–407. [Google Scholar] [CrossRef]
  149. Sharpley, A.; Moyer, B. Phosphorus forms in manure and compost and their release during simulated rainfall. J. Environ. Qual. 2000, 29, 1462–1469. [Google Scholar] [CrossRef]
  150. Xu, G.; Zhang, Y.; Shao, H.; Sun, J. Pyrolysis temperature affects phosphorus transformation in biochar: Chemical fractionation and 31P NMR analysis. Sci. Total Environ. 2016, 569, 65–72. [Google Scholar] [CrossRef]
  151. Zvomuya, F.; Helgason, B.L.; Larney, F.J.; Janzen, H.H.; Akinremi, O.O.; Olson, B.M. Predicting phosphorus availability from soil-applied composted and non-composted cattle feedlot manure. J. Environ. Qual. 2006, 35, 928. [Google Scholar] [CrossRef]
  152. Hinedi, Z.R.; Chang, A.C.; Lee, R.W.K. Mineralization of phosphorus in sludge-amended soils monitored by phosphorus-31-nuclear magnetic resonance spectroscopy. Soil Sci. Soc. Am. J. 1988, 52, 1593–1596. [Google Scholar] [CrossRef]
  153. Hinedi, Z.R.; Chang, A.C. Solubility and phosphorus-31 magic angle spinning nuclear magnetic resonance of phosphorus in sludge-amended soils. Soil Sci. Soc. Am. J. 1989, 53, 1057–1061. [Google Scholar] [CrossRef]
  154. Leytem, A.B.; Plumstead, P.W.; Maguire, R.O.; Kwanyuen, P.; Brake, J. What aspect of dietary modification in broilers controls litter water-soluble phosphorus. J. Environ. Qual. 2007, 36, 453–463. [Google Scholar] [CrossRef] [PubMed]
  155. Giles, C.; Cade-Menun, B.; Hill, J. The inositol phosphates in soils and manures: Abundance, cycling, and measurement. Can. J. Soil Sci. 2011, 91, 397–416. [Google Scholar] [CrossRef]
  156. L’annunziata, M.; Gonzalez, J. Soil metabolic transformations of carbon-14-myo-inositol, carbon-14-phytic acid and carbon-14-iron (III) phytate. In Soil Organic Matter Studies; International Atomic Energy Agency: Vienna, Austria, 1977. [Google Scholar]
  157. Smith, D.H.; Clark, F.E. Anion-exchange chromatography of inositol phosphates from soil. Soil Sci. 1951, 72, 353–360. [Google Scholar] [CrossRef]
  158. Caldwell, A.; Black, C. Inositol hexaphosphate: II. Synthesis by soil microorganisms 1. Soil Sci. Soc. Am. J. 1958, 22, 293–296. [Google Scholar] [CrossRef]
  159. Cosgrove, D.J. Inositol polyphosphates in activated sludge 1. J. Environ. Qual. 1973, 2, 483–485. [Google Scholar] [CrossRef]
  160. Martin, J.-B.; Laussmann, T.; Bakker-Grunwald, T.; Vogel, G.; Klein, G. Neo-inositol polyphosphates in the amoeba entamoeba histolytica. J. Biol. Chem. 2000, 275, 10134–10140. [Google Scholar] [CrossRef]
  161. Simons, P.C.M.; Jongbloed, A.W. Influence of nutritional and physiological factors on phosphorus content of animal manures. In Sponsored by the Commission of the European Communities, Directorate-General for Agriculture, and Directorate-General for Research, Science and Education, Proceedings of the Phosphorus in Sewage Sludge and Animal Waste Slurries: EEC Seminar/Organized Jointly by the CEC and the Institute for Soil Fertility, Haren (Gr.), Groningen, Netherlands, 12–13 June 1980; Hucker, T.W.G., Catroux, G., Eds.; Dordrecht: Holland, The Netherlands; D. Reidel Pub. Co.: Boston, MA, USA; Sold: Hingham, MA, USA, 1981. [Google Scholar]
  162. Barnett, G.M. Phosphorus forms in animal manure. Bioresour. Technol. 1994, 49, 139–147. [Google Scholar] [CrossRef]
  163. Turner, B.L.; Mahieu, N.; Condron, L.M. The phosphorus composition of temperate pasture soils determined by NaOH-EDTA extraction and solution 31P NMR spectroscopy. Org. Geochem. 2003, 34, 1199–1210. [Google Scholar] [CrossRef]
  164. Murphy, P.N.C.; Bell, A.; Turner, B.L. Phosphorus speciation in temperate basaltic grassland soils by solution 31P NMR spectroscopy. Eur. J. Soil Sci. 2009, 60, 638–651. [Google Scholar] [CrossRef]
  165. Tate, K.R.; Newman, R.H. Phosphorus fractions of a climosequence of soils in New Zealand tussock grassland. Soil Biol. Biochem. 1982, 14, 191–196. [Google Scholar] [CrossRef]
  166. Lavahun, M.F.E.; Joergensen, R.G.; Meyer, B. Activity and biomass of soil microorganisms at different depths. Biol. Fertil. Soils 1996, 23, 38–42. [Google Scholar] [CrossRef]
  167. Fraser, D.G.; Doran, J.W.; Sahs, W.W.; Lesoing, G.W. Soil microbial populations and activities under conventional and organic management. J. Environ. Qual. 1988, 17, 585–590. [Google Scholar] [CrossRef]
  168. Martyniuk, S.; Wagner, G.H. Quantitative and qualitative examination of soil microflora associated with different management systems. Soil Sci. 1978, 125, 343–350. [Google Scholar] [CrossRef]
  169. Condron, L.M.; Frossard, E.; Tiessen, H.; Newmans, R.H.; Stewart, J.W.B. Chemical nature of organic phosphorus in cultivated and uncultivated soils under different environmental conditions. J. Soil Sci. 1990, 41, 41–50. [Google Scholar] [CrossRef]
  170. Canellas, L.P.; Espindola, J.A.A.; Guerra, J.G.M.; Teixeira, M.G.; Velloso, A.C.X.; Rumjanek, V.M. Phosphorus analysis in soil under herbaceous perennial leguminous cover by nuclear magnetic spectroscopy. Pesqui. Agropecu. Bras. 2004, 39, 589–596. [Google Scholar] [CrossRef] [Green Version]
  171. Vincent, A.G.; Schleucher, J.; Gröbner, G.; Vestergren, J.; Persson, P.; Jansson, M.; Giesler, R. Changes in organic phosphorus composition in boreal forest humus soils: The role of iron and aluminium. Biogeochemistry 2012, 108, 485–499. [Google Scholar] [CrossRef]
  172. McDowell, R.W.; Cade-Menun, B.; Stewart, I. Organic phosphorus speciation and pedogenesis: Analysis by solution 31P nuclear magnetic resonance spectroscopy. Eur. J. Soil Sci. 2007, 58, 1348–1357. [Google Scholar] [CrossRef]
  173. Chapman, V.J. Seaweeds and Their Uses, 2nd ed.; Springer: Methuen, MA, USA; London, UK, 1970; p. 304. [Google Scholar]
  174. Stutter, M.I. The composition, leaching, and sorption behavior of some alternative sources of phosphorus for soils. Ambio 2015, 44, 207–216. [Google Scholar] [CrossRef]
  175. Hernæs, P. Karmoys Historie–som det Stiger Frem. Bind 1: Fra Istid til 1050; Karmoy Kommune: Kopervik, Norway, 1997. [Google Scholar]
  176. Statistics Norway Tabell: 09594: Arealbruk Og Arealressurser, Etter Arealklasser (km2). 2017. Available online: https://www.ssb.no/statistikkbanken (accessed on 30 November 2017).
  177. Puschmann, O.; Reid, S.J.; Fjellstad, W.J.; Hofsten, J.; Dramstad, W. Tilstandsbeskrivelse av Norske Jordbruksregioner ved Bruk av Statistikk. NIJOS-rapport 17. 2004. Available online: https://nibio.brage.unit.no/nibio-xmlui/handle/11250/2558439 (accessed on 29 October 2019).
  178. Lundberg, A. Karmøys Flora: Biologisk Mangfald i Eit Kystlandskap; Bergen-Sandviken Fagbokforl: Sandviken, Norway, 1998; ISBN 82-7674-472-9. [Google Scholar]
  179. Lundberg, A.; Handegaard, T. Changes in the spatial structure and function of coastal cultural landscapes. GeoJournal 1996, 39, 167–178. [Google Scholar] [CrossRef]
  180. Lundberg, A. Changes in the land and the regional identity of western Norway. The case of Sandhåland, Karmøy. In Nordic Landscapes: Region and Belonging on the Northern Edge of Europe; University of Minnesota Press: Minneapolis, MA, USA, 2008; pp. 344–371. [Google Scholar]
  181. Kvamme, M. En vegetasjonshistorisk undersøkelse av kulturlandskapets utvikling på Lurekalven, Lindås hd., Hordaland. Unpublished Cand. Real Thesis, University of Bergen, Bergen, Norway, 1982. [Google Scholar]
  182. Myhre, B. The Early Viking Age in Norway. Acta Archaeol. 2000, 71, 35–47. [Google Scholar] [CrossRef]
  183. Opedal, A. Homslands large bosetningshistorie. Fra Haug Ok Heidni 1994, 3, 19–21. [Google Scholar]
  184. Sølvberg, I.Ø. Driftsmåter i Vestnorsk Jordbruk Ca. 600–1350; Universitets-forl.: Bergen, Norway, 1976; Volume 4, ISBN 82-00-01571-8. [Google Scholar]
  185. Donaldson, J. General View of the Agriculture of the County of Nairn, the Eastern Coast of Inverness-shire, and the Parish of Dyke, and Part of Edenkeillie, in the County of Elgin, and Forres. By James Donaldson… Drawn Up for the Consideration of the Board of Agriculture and Internal Improvement; B. Millan: London, UK, 1794. [Google Scholar]
  186. Lübke, H.; Lüth, F.; Terberger, T.; Landesmuseum, A.; für Bodendenkmalpflege, L. Neue Forschungen zur Steinzeit im südlichen Ostseegebiet. Beitr. Zur 2004, 46, 221–241. [Google Scholar]
  187. Preuß, J. Das Neolithikum in Mitteleuropa. Kulturen–Wirtschaft–Umwelt vom 6. Bis 3. Jahrtausend vu Z. In Übersichten zum Stand der Forschung; Beier & Beran: Weissbach, Germany, 1998; p. 700. [Google Scholar]
  188. Schier, W. Extensiver Brandfeldbau und die Ausbreitung der neolithischen Wirtschaftsweise in Mitteleuropa und Südskandinavien am Ende des 5. Jahrtausends v. Chr. Prähistorische Z. 2009, 84, 15–43. [Google Scholar] [CrossRef]
  189. Heinrich, D. Die Tierknochen des frühneolithischen Wohnplatzes Wangels LA 505. Ein Vorbericht. Offa 1999, 54, 43–48. [Google Scholar]
  190. Schmölcke, U. Küstenleben vor 6200 Jahren-Archäozoologische Untersuchungen der Tierknochen von Timmendorf-Nordmole (Insel Poel). Natur- und Landeskunde; Zeitschrift für Schleswig-Holstein: Hamburg, Germany; Mecklenburg, Germany, 2003; Volume 110, pp. 100–105. [Google Scholar]
  191. Schleinert, D. Die Schwedische Landesaufnahme der Insel Poel 1698; Edition Temmen: Bremen, Germany, 2009. [Google Scholar]
Figure 1. Locations of the Anthrosols at the islands of Poel and Fehmarn in Germany (P-1: Gollwitz; P-3, P-5: Niendorf; F-6: Großenbrode; F-8: Westermarkelsdorf; F-9: Gahlendorf), at the island of Sjaelland in Denmark (S-7: Vordingborg), in the region of Jæren (PE1: Njærheim; PE4: Årsvoll), and at the island of Karmøy and Feøy in Norway (Hi: Hillesland; S: Sandhåland; F: Feøy).
Soilsystems 03 00072 g001
Figure 2. Principal component analysis (PCA) score plot of the proportions of the elements of 12 Northern European soil profiles (F, H, S, PE1, PE4, S-7, F-6, F-8, F-9, P-1, P-3, P-5) (data in Table 1) (A) and of the proportions of the P species from the SF of 6 Northern European soil profiles (F, S, PE1, S-7, F-6, P-3) (data in Table 2) (B). The upper horizons are represented in italics and underlying horizons as bold symbols. Differently colored areas represent clusters of soils according to their element or P composition; arrows indicate the presence of specific elements or P-compounds in the soil samples (arrow direction shows direction of elements or P-compound enrichment; arrow length shows intensity of enrichment).
Soilsystems 03 00072 g002
Figure 3. Stacked normalized P K-edge XANES spectra of 10 Northern European Anthrosols (Hi: Hillesland; F: Feøy; S: Sandhåland; PE1: Njærheim; PE4: Årsvoll; S7: Vordingborg; F-6: Großenbrode; F-9: Gahlendorf; P-5, P-3: Niendorf).
Soilsystems 03 00072 g003
Figure 4. 31P nuclear magnetic resonance (31P-NMR) spectra of NaOH-EDTA extracts of six Northern European soils (F: Feøy; S: Sandhåland; PE1: Njærheim; S7: Vordingborg; F-6: Großenbrode; P-3: Niendorf). The vertical scale was standardized to 1 based on the MDPA peak (methylene diphosphonic acid). Detailed illustrations of the monoester regions (6.5 to 6.2 ppm and 5.7 to 2.5 ppm) including peak assignments are shown in Acksel et al. [86].
Soilsystems 03 00072 g004
Figure 5. PCA score plot of the proportions of the P species from P K-edge XANES of 10 Northern European soil profiles (F, H, S, PE1, PE4, S-7, F-6, F-9, P-3, P-5) (data in Table 3) (A) and of the proportions of the P species from 31P-NMR of 6 Northern European soil profiles (F, S, PE1, S-7, F-6, P-3) (data in Table 4) (B). The upper horizons are represented in italics and underlying horizons as bold symbols. Differently colored areas represent clusters of soils according to their P composition; arrows indicate the presence of specific P-compounds in the soil samples as detected by P K-edge XANES and 31P-NMR (arrow direction shows direction of P-compound enrichment; arrow length shows intensity of enrichment).
Soilsystems 03 00072 g005
Figure 6. Box plot of the Pt concentrations in the Anthrosols of this study, in reference soils with different amendments, Anthrosols, and in native soils. References: A: [51]; B: [51,52,90,91]; C: [92]; D: [93,94,95,96,97,98]; E: [51,53,58,83,93,94,95,96,97,98,99,100,101,102,103,104,105,106,107]; F: [51,58,62,93,94,96,97,98,100,104,106,107,108,109,110,111,112]; G: [109,110]; H: [52,83,91,93,100,103,104,105,110,113,114,115,116,117,118,119,120,121,122,123], Negassa W. (unpublished data).
Soilsystems 03 00072 g006
Figure 7. PCA score plot of the relative proportions of P-fractions as percent of the sum of fractions (NaHCO3-Pi + NaHCO3-Po + NaOH-Pi + NaOH-Po + H2SO4-Pi) in soils from the present study and reference soils. The PCA illustrates the separation of reference soils according to the type of manure applied and soil usage as well as the grouping of the Anthrosols under study with soils that received specific fertilizers. The values in the parenthesis show the proportions of the explained total variance of each compound. Letters next to the data symbols refer to reference: a [51], b [98], c [95], d [105], e [114], f [108], g [53], h [103], I [112], j [62], k [120], l [102], m [52], n [90], o [109], p [110], q [106], r [107], s [141], t [119], u [58], v [104], w [94], x [132], y [99], z [100], A [96], B [123], C [111], D [93], E [97], F [116], G [118], H Negassa W. (unpublished data), L [115], M [101], N [91], O [113], P [117], Q [83], R [121], S [122].
Soilsystems 03 00072 g007
Figure 8. Box plot of the relative proportions of the P-fractions as percent of the sum of fractions (NaHCO3-Pi + NaHCO3-Po + NaOH-Pi + NaOH-Po + H2SO4-P) in the Anthrosols of the present study, in reference soils with different amendments, in other Anthrosols, and in native soils. References: A: [51]; B: [51,52,90,91]; C: [92]; D: [93,94,95,96,97,98]; E: [51,53,58,83,93,94,95,96,97,98,99,100,101,102,103,104,105,106,107]; F: [51,58,62,93,94,96,97,98,100,104,106,107,108,109,110,111,112]; G: [109,110]; H: [52,83,91,93,100,103,104,105,110,113,114,115,116,117,118,119,120,121,122,123], Negassa W. (unpublished data).
Soilsystems 03 00072 g008
Figure 9. Box plot of the relative proportions of the P-fractions to the sum of fractions (NaHCO3-Pi + NaHCO3-Po + NaOH-Pi + NaOH-Po + H2SO4-P) (A) and total P (B) in various organic amendments. References: [56,79,120,124,131,132,146,147,148,149,150,151].
Soilsystems 03 00072 g009
Table 1. Mean concentrations of Pt, Al, Ca, Fe, K, Mg, and Mn (mg kg−1). Values within the same element with the same letter are considered not significantly different. Values in parenthesis show the relative proportion of each element as percent of the sum of elements (Al + Ca + Fe + K + Mg + Mn) and were calculated by using amount of substance (mol).
SiteDepth (cm)PtAlCaFeKMgMn
mg kg−1mg kg−1 soil (% of mol kg−1 Soil)
Island of Feøy (SW Norway)
F0–303087 c18967 c(38)9163 c(12)30374 ab(30)714 kl(1)7902 b(18)1220 cd(1)
30–453682 a19383 c(39)7135 c(10)31593 a(31)662 l(1)7763 b(17)1587 ab(2)
Island of Karmøy (SW Norway)
Hi0–303196 b24735 ab(44)8332 bc(10)28436 c(24)1662 efg(2)9599 a(19)1796 a(2)
30–452223 g25363 a(43)7848 c(9)29809 bc(24)1565 fgh(2)11422 a(21)1347 bc(1)
S0–301118 h8374 hi(13)68987 ab(72)8955 k(7)1099 i(1)3667 e(6)595 h(<1)
30–45869 i6364 k(7)114252 a(83)7375 n(4)1010 ij(1)4060 d(5)425 m(<1)
Jæren region (SW Norway)
PE10–302623 d10998 gh(43)3915 hi(10)18374 fg(35)1122 i (3)1580 j(7)498 i(1)
35–602690 d11806 fg(45)3125 ij(8)19374 f(36)1084 i(3)1634 j(7)651 g(1)
PE40–302584 e13586 ef(39)6098 d(12)24502 e(34)1718 def(3)3524 f(11)887 f(1)
35–602490 f14319 e(39)5592 de(10)26179 d(34)2318 bc(4)3946 d(12)892 ef(1)
Island of Sjaelland (Denmark)
S-70–10323 q4096 l(42)1641 l(11)5145 o(26)1078 i(8)1012 o(12)173 q(1)
10–45318 q3588 l(41)1438 m(11)5105 o(28)841 jk(7)871 p(11)211 pq(1)
Island of Fehmarn (Germany)
F-60–41527 l7544 ij(43)2886 jk(11)9378 j(26)1668 efg(7)1783 i(11)423 m(1)
41–53264 s11316 gh(45)3101 ij(8)14895 i(29)2057 cd(6)2347 hi(10)982 de(2)
F-80–26567 k17595 cd(50)4572 fg(9)17586 gh(24)3547 a(7)3325 f(10)341 op(<1)
26–34304 r21186 bc(47)4318 gh(7)25425 de(28)3681 a(6)4891 c(12)624 gh(1)
F-90–35621 j14019 e(47)4769 ef(11)14993 i(24)3325 ab(8)2447 gh(9)459 l(1)
35–75444 n14946 de(47)5442 de(12)16551 h(25)2857 abc(6)2622 g(9)471 kl(1)
Island of Poel (Germany)
P-10–20349 p6441 k(45)1564 l(7)8475 lm(28)1521 gh(7)1413 kl(11)416 mn(1)
50–90305 r6387 k(46)1998 k(10)8151 mn(28)1121 i(6)1156 n(9)478 jk(2)
P-30–45477 m6803 jk(45)1556 l(7)8952 k(29)1722 de(8)1451 k(11)409 n(1)
45–75404 o6307 k(44)1613 l(8)8536 l(29)1392 h(7)1352 lm(11)402 n(1)
P-50–47437 n6582 k(45)1555 l(7)8664 l(29)1440 h(7)1308 m(10)496 ij(2)
47–80244 t4305 l(46)1047 m(8)5407 o(28)786 kl(6)824 p(10)363 o(2)
Table 2. Mean P concentrations (mg kg−1) in different extracts of the sequential P fractionation. Pt is the sum of sequentially extracted fractions, sometimes slightly different from Pt-values in Table 1. Values within Pt and the same P-species with the same letter are considered not significantly different.
SiteDepth (cm)PtSequentially Extracted Fractions
Resin-PNaHCO3-PiNaHCO3-PoNaOH-PiNaOH-PoH2SO4-PResidual-P
mg kg−1mg P kg−1 (% of Pt)
Island of Feøy (SW Norway)
F0–303370 b76 ab (2)415 cd (12)325 a (10)1438 ab (43)790 a (23)326 cd (10)0 j (0)
30–453916 a69 abc (2)592 a (15)312 a (8)1919 a (49)729 a (19)294 ef (8)0 j (0)
Island of Karmøy (SW Norway)
Hi0–303320 b96 a (3)494 ab (15)235 ab (7)1455 ab (44)736 a (22)305 de (9)0 hij (0)
30–452127 e77 ab (3)329 de (15)142 cd (6)945 ef (43)431b (19)204 ij (9)95 bcde (4)
S0–30956 ef38 ef (3)112 gh (10)22 kl (2)125 fg (11)92 gh (8)567 a (51)162 abcd (15)
30–45666 f25 ghi (3)95 hi (11)3 m (<1)52 h (6)39 lm (5)451 bc (52)203 ab (23)
Jæren region (SW Norway)
PE10–302708 c98 a (4)469 bc (17)247 ab (9)1189 cd (44)424 b (16)281 ef (10)0 hij (0)
35–602760 c72 abc (3)534 ab (19)168 bc (6)1356 bc (49)372 b (13)259 fg (9)0 ghi (0)
PE40–302376 d56 bcd (2)248 fg (10)130 cde (5)1020 de (39)393 b (15)528 ab (20)208 ab (8)
35–02279 d48 cde (2)275 ef (11)125 de (5)963 ef (39)379 b (15)489 bc (20)211 a (8)
Island of Sjaelland (Denmark)
S-70–10344 j13 kl (4)32 mn (9)109 ef (32)22 lm (6)108 d (32)59 o (17)0 ij (0)
10–45315 k14 jkl (4)28 n (9)79 gh (25)29 k (9)105 def (33)61 no (19)3 hij (1)
Island of Fehmarn (Germany)
F-60–41451 g33 efg (6)39 lm (7)58 hi (11)55 h (10)46 jk (9)220 hi (42)76 defg (14)
41–53204 n6 mn (2)12 p (5)14 klm (5)25 kl (10)61 hi (23)86 l (32)59 defg (22)
F-80–26416 h29 fgh (5)46 jk (8)30 jk (5)43 ij (8)42 kl (7)226 ghi (40)151 abcd (27)
26–34222 mn3 n (1)12 p (4)8 lm (3)5 n (2)10 m (3)185 jk (61)82 cdef (27)
F-90–35451 g38 def (6)31 n (5)47 i (8)50 hi (8)55 ij (9)230 gh (37)170 abc (27)
35–75307 k17 ijk (4)40 klm (9)8 lm (2)30 k (7)41 kl (9)172 k (39)137 abcd (31)
Island of Poel (Germany)
P-10–20343 j8 lm (2)27 n (8)69 h (20)38 j (11)119 c (34)81 lm (23)6 hij (2)
50–90276 l7 mn (2)14 op (5)47 ij (15)28 kl (9)107 de (35)74 mn (24)29 efgh (9)
P-30–45478 g19 ijk (4)66 ij (14)122 de (26)83 g (17)101 efg (21)85 l (18)0 hij (0)
45–75384 i7 lm (2)19 o (5)101 fg (25)52 h (13)121 c (30)85 l (21)20 fghi (5)
P-50–47401 hi21 hij (5)43 kl (10)77 gh (18)58 h (13)118 c (27)84 l (19)36 efgh (8)
47–80237 m6 mn (2)14 o (6)46 i (19)18 mn (7)96 fg (39)56 o (23)8 hij (3)
Table 3. Relative proportions of P species determined by P K-edge XANES spectroscopy. Goodness of fit: r-factor = 0.001 to 0.009.
SiteDepth (cm)PorgFeAlCaK
%
Island of Feøy (SW Norway)
F0–305652406
30–459612600
Island of Karmøy (SW Norway)
Hi0–3010553500
30–458603200
S0–30124703111
30–4512440369
Jæren region (SW Norway)
PE10–305702500
35–609454500
PE40–307702200
35–606742100
Island of Sjaelland (Denmark)
S-70–103055078
10–453055078
Island of Fehmarn (Germany)
F-60–41134802415
41–53254401615
F-90–35183902320
35–75214801319
Island of Poel (Germany)
P-30–451783000
45–751189000
P-50–4721561743
4802854764
Table 4. Concentrations of total P (mg kg−1) in the NaOH-EDTA extract and the concentrations of organic and inorganic phosphorus compounds determined in the NaOH-EDTA extracts of soil samples by solution 31P NMR spectroscopy. Values in parenthesis show the proportions of the P species of Pt of AR.
SiteDepth (cm) P Groups in NaOH-EDTA Extract
Pt in NaOH-EDTA ExtractPhosphonate/PHOSPHONOLIPIDSOrthophosphateOrthophosphate MonoesterOrthophosphate DiesterPyrophosphate
mg P kg−1mg P kg−1 (% of Pt)
Island of Feøy and Karmøy (SW Norway)
F0–30349215 (<1)1958 (56)1353 (39)145 (4)22 (<1)
30–4540129 (<1)2653 (66)1308 (33)33 (1)10 (<1)
S0–306940 (0)416 (37)174 (16)97 (9)8 (1)
30–453970 (0)217 (25)114 (13)63 (7)3 (<1)
Jæren region (SW Norway)
PE10–3026344 (<1)1834 (68)670 (25)113 (4)12 (<1)
35–6027594 (<1)2004 (73)638 (23)108 (4)5 (<1)
Island of Sjaelland (Denmark)
S-70–102440 (0)65 (19)109 (32)66 (19)4 (1)
10-–452330 (0)72 (23)110 (35)49 (15)1 (<1)
Island of Fehmarn (Germany)
F-60–414020 (0)243 (46)115 (22)41 (8)4 (1)
41–531660 (0)32 (12)80 (30)52 (20)2 (1)
Island of Poel (Germany)
P-30–453670 (0)159 (33)121 (25)85 (18)1 (<1)
45–753130 (0)87 (22)168 (42)58 (14)1 (<1)
Table 5. Total element concentrations as reported in literature for various soil amendments, peat, Anthrosols, and surrounding agriculture soils of the respective region of the Anthrosols under study.
Amendments/SoilsPtCaAlFeMgKMnReferences
mg kg−1 (Dry Basis)
Various Organic Amendments
Human excrement4300–160002680–4270-200000930–28601780–7160 [127,128,129,130]
Swine manure32950332251375195012950-400[56,131]
Cattle manure5125241008800452516200-200[56,79,105,131]
Sheep manure80001300035001300---[79]
Sewage sludge manure15550518502390013600---[56]
Deer manure74001170053002600---[79]
Poultry manure9500290006002850880011000265[124,131]
Farm yard manure400077000-600090008400320[124]
Cattle compost4000–182002400034002500500022000-[132,133]
Sheep compost19100 [133]
Swine compost700035000800200070006000-[132]
Poultry (litter) compost14000–297001200020003100590017000-[132,133]
Sewage sludge compost7000250003100835059008650410[124,132]
Seaweed of Norway, Baltic sea and France600–25005300–175004070–2000800–214009400–35700−3900[134,135,136]
Peat and Anthrosols
Dry peat of NO Germany14000100000560002660009400113001100[137]
Anthrosol of Amazonia240013000-140400017300210[138]
Anthrosol of Amazonia3600420030000-460860240[139]
Anthrosol of Germany10006600-6700890710650[10]
Agriculture Soils of SW Norway
(Ap: 0–20 cm, n = 2218, 1 site 2500 km²)900–16001700–32006900–1130010200–17600370–1500240–72080–250[140]
Agriculture Soils of NO Germany
(Ap: 0–20 cm, n = 2218, 1 site 2500 km²)207–4601701–32002500–690010201–17600371–1500720–1300250–460[140]

