Predicting Migratory Corridors of White Storks, Ciconia ciconia, to Enhance Sustainable Wind Energy Planning: A Data-Driven Agent-Based Model


1
Department of Geoinformatics (Z_GIS), University of Salzburg, Schillerstraße 30, 5020 Salzburg, Austria
2
Max Planck Institute for Ornithology, Vogelwarte Radolfzell, Schlossalee 2, 78315 Radolfzell, Germany
3
School of Technology, Environments and Design, Discipline of Geography and Spatial Sciences, University of Tasmania, Churchill Avenue, Hobart, Tasmania 7001, Australia
*
Author to whom correspondence should be addressed.
Sustainability 2018, 10(5), 1470; https://doi.org/10.3390/su10051470
Submission received: 6 March 2018
/
Revised: 1 May 2018
/
Accepted: 5 May 2018
/
Published: 8 May 2018
Abstract
:White storks (Ciconia ciconia) are birds that make annual long-distance migration flights from their breeding grounds in the Northern Hemisphere to the south of Africa. These trips take place in the winter season, when the temperatures in the North fall and food supply drops. White storks, because of their large size, depend on the wind, thermals, and orographic characteristics of the environment in order to minimize their energy expenditure during flight. In particular, the birds adopt a soaring behavior in landscapes where the thermal uplift and orographic updrafts are conducive. By attaining suitable soaring heights, the birds then use the wind characteristics to glide for hundreds of kilometers. It is therefore expected that white storks would prefer landscapes that are characterized by suitable wind and thermal characteristics, which promote the soaring and gliding behaviors. However, these same landscapes are also potential sites for large-scale wind energy generation. In this study, we used the observed data of the white stork movement trajectories to specify a data-driven agent-based model, which simulates flight behavior of the white storks in a dynamic environment. The data on the wind characteristics and thermal uplift are dynamically changed on a daily basis so as to mimic the scenarios that the observed birds experienced during flight. The flight corridors that emerge from the simulated flights are then combined with the predicted surface on the wind energy potential, in order to highlight the potential risk of collision between the migratory white storks and hypothetical wind farms in the locations that are suitable for wind energy developments. This work provides methods that can be adopted to assess the overlap between wind energy potential and migratory corridors of the migration of birds. This can contribute to achieving sustainable trade-offs between wind energy development and conservation of wildlife and, hence, handling the issues of human–wildlife conflicts.

1. Introduction
1.1. Background
Every year, thousands of birds fly from their breeding sites in Europe to their wintering grounds in sub-Saharan Africa. To achieve this feat, the birds depend on the prevailing weather conditions, topography, and landscape characteristics [1,2]. However, the anthropogenic activities in the flight paths, particularly the continued development of wind energy infrastructure, poses a risk to the birds. More specifically, the development of wind farms in close proximity to the nesting locations, foraging patches, and migratory corridors of birds adversely affects the bird populations and behavior [3,4]. In particular, the establishment of wind farms contributes to habitat loss, barrier effects, disturbance, and to an increase in the mortality rates from the collision between birds and wind farm infrastructure, including turbines and cables [5,6,7]. The risk is worse for the migratory species that have no experience flying in the wind farm locations and only encounter wind turbines and other wind energy related infrastructure in the course of their migratory flights [8].
White storks (Ciconia ciconia) are an example of bird species that make annual migratory flights from their breeding grounds in Europe to wintering locations in Africa. During the migratory flights, the white storks, because of their large sizes, rely more on the wind characteristics, orographic updraft, and site-specific thermals, to facilitate their flight, rather than on their flapping behavior [9]. Their dependence on the weather and topography contributes to the vulnerability [10] of the birds to collision with wind turbines, power cables, and other anthropogenic infrastructure that may be in their flight path. This is particularly true in cases where wind farms are located in the potential flight corridors of the migratory birds. Indeed, the poor siting of wind farms dramatically increases the risk of collision with birds [11]. The evaluation of the collision related mortality of birds within wind farms traditionally relies on the identification and enumeration of bird carcasses within wind farms [12]. The pre-installation assessment of the risk of collision has also depended on the sighting of birds in the proposed wind farm locations.
Furthermore, studies on the collision risk of the birds in wind farms have predominantly been conducted in Europe and North America. This is, in part, because of the considerable investment in wind energy in these regions. Other assessments of the collision risk have also been conducted at bird convergence locations at Gibraltar in the south of Spain [13,14] and in the south of Israel [15,16], as the birds fly into continental Africa. The paucity of the studies on the collision risk between the migratory birds and wind farms in Africa can be attributed to the low amounts of the installed generation capacity of wind-based electricity in the continent. The global drive to improve access to clean energy has led to an increased investment in wind energy in Africa. Additionally, with the setting up of the turbine manufacturing factories in the continent, the installed capacity is likely to increase. This is evident with the latest installations in Ethiopia, Kenya, and Tanzania [17], which, traditionally, have not been the largest generators of wind-based energy in the continent.
The emerging interest and investment in wind energy related projects in Africa, which is the traditional wintering ground for white storks (and other European bird species), brings to the fore the questions on the possible impact of the wind energy installations on migratory birds. The specific questions of interest include the following: (a) What is the spatial variability of wind energy potential in the African continent? (b) What is the proximity of the high wind energy potential areas to the traditional bird migratory corridors and wintering sites? (c) What is the potential risk of collision posed by wind farms were they to be built in corridors that are preferred by migratory birds?
Attempts have been made to map the wind energy potential in the continent [18,19]. Usually, these have been at the continental level with the results being summarized at the country level. Additionally, some of the studies have evaluated the wind energy potential within individual countries [20,21,22]. However, most of the data from these studies are not publicly available. Furthermore, in our analysis of the literature, we did not find any studies in Africa where the potential effects of wind energy projects on expansive corridors of migration for birds has been assessed. Commonly, the potential impact of wind energy projects is examined as part of environmental assessment prior to the implementation of wind farm projects. In the European Union, bird sensitivity maps are used to steer the wind energy development away from most sensitive areas as a way of reducing the risk of collision [23]. Similarly, in United States, the government agencies like the U.S. Fish and Wildlife Service (FWS) have responsibility to manage and regulate endangered animal species [24]. Consequently, accurate collision prediction models are required as a pre-requisite to wind energy development. It is therefore important to develop methods and tools that can accurately predict the risks that emerge from the interaction between the birds and wind energy infrastructure.
1.2. Related Work
Agent-based models (ABM) or individual-based models (IBMs), as they are commonly known within ecology [25], are powerful tools for predicting and visualizing the interactions between animals and their environment [5,26]. In the study of migratory birds, individual-based models have been used to simulate and understand the soaring and gliding behavior among the migratory white storks [27]. Similarly, Deinhardt et al. [28] used agent-based models to combine the Global Positioning System (GPS) trajectories, topographic information, and data on uplift in order to predict the new migratory corridors for the golden eagles (Aquila chrysaetos) in North America. Furthermore, Zurell et al. [29] investigated the influence of resource limitations on the spatial structure of the white stork population density and reproductive rates.
Scientific models are commonly specified, implemented, and used in order to estimate the risk of collision between the birds and wind energy installations. In particular, Collision Risk Models (CRM) [24], which are numerical in nature, have commonly been employed to assess the risk of collision, resulting from the existing and pre-installed wind farms. As with other numerical models that are used to simulate animal behavior, typical CRMs do not consider the autonomous behavior of the individual bird agents in determining the risk of collision, for instance, by taking actions to avoid collision [30,31]. As a result, IBMs have been specified, as they allow for the implementation of individual agent-specific characteristics, which influence the risk of collision [32]. Other agent-based models have been developed to improve the collision-risk-related data collection strategies [33].
Within ecology, the individual based models have traditionally been specified from the documented theories and knowledge about the system of interest [34]. With the advances in sensor and tracking technology, it is now possible to record fine-grained data in space and time about the systems in remote and inaccessible areas [35]. The data from these kinds of implementations can provide a basis for generating knowledge about the previously under researched systems [36]. Consequently, the data-driven approaches to knowledge discovery, through iterative modelling and simulation, have gained prominence. In relation to the current study, a major gap in the research, that is yet to be extensively explored, is the use of data-driven agent-based models in analysing the link between the bird behavior and the risk of collision between the birds and wind energy infrastructure.
There are three important components of data-driven modelling and simulation frameworks, namely, the model space, which specifies the general structure of the system of interest; search algorithm, which efficiently discover candidate system behaviors and fitness function to evaluate the performance of the search algorithm; and the candidate solutions [37]. As a result of the iterative nature of the data-driven modelling approaches, evolutionary algorithms are preferred for discovering significant system behaviors. These algorithms search for distinctive behaviors and patterns and optimize the solutions dynamically by comparing the model results with the observed patterns in the data. Genetic Algorithms (GA), which borrow from biological processes of evolution and natural selection [38], have been used in agent-based models [39,40].
In GA, an initial random population is introduced to provide a solution to the behavior patterns of interest. Through a process that is similar to biological evolution, the solutions are evolved and optimized through selection, crossover, and mutation. To facilitate the evolution, fitness values are assigned to candidate solutions based on how they perform in identifying the behaviors of interest. In order to produce an optimized solution, a process of selection is implemented to identify a set of fit solutions that can generate the next generation of solutions. There are six main selection strategies, including, roulette wheel selection, stochastic universal sampling, linear rank selection, exponential rank selection, tournament selection, and truncation selection [41]. In this work, we used an elitist roulette wheel selection.
1.3. Research Objectives
Our research objective was to predict the migration corridors of white storks from the individual bird flight behaviors and interactions with the environment. Additionally, we investigated whether the emerging corridors coincided with areas that had a high potential for wind energy development and, hence, were likely to contribute to the risk of collision between the birds and wind farms during the migratory flights. Here, we set out to estimate the wind energy potential within the East Africa region, particularly in a region that covers the Eastern Rift Valley from northern Kenya to central Tanzania. Additionally, we implemented an agent-based model to simulate the flights of the migrating white storks during their migration to southern Africa. Thereafter, we combined the emerging migratory corridors of the simulated white storks with the estimated wind energy potential surface in order to predict the potential locations of bird-friendly wind farms.
2. Materials and Methods
2.1. Study Area
The East African region is home to the Great Rift Valley. The Eastern Rift Valley is a recognized bird flyway [42], and is used by the migrating soaring birds during the wintering flights to the south of Africa. This is as a result of the topography of the valley, which provides a good orographic uplift, and also as a result of the availability of several lakes in the valley, which serve as foraging sites for different bird species. As a result of the expansive nature of the region, executing a detailed environment impact assessment prior to project implementation would have been expensive and untenable. Methods that combined the data from different sources and considered the dynamic interaction between multiple users of the environment were preferable when designing the sustainable resource use plans. Linking the geographic information systems (GIS) and agent-based models (ABM) could be better suited for such a task.
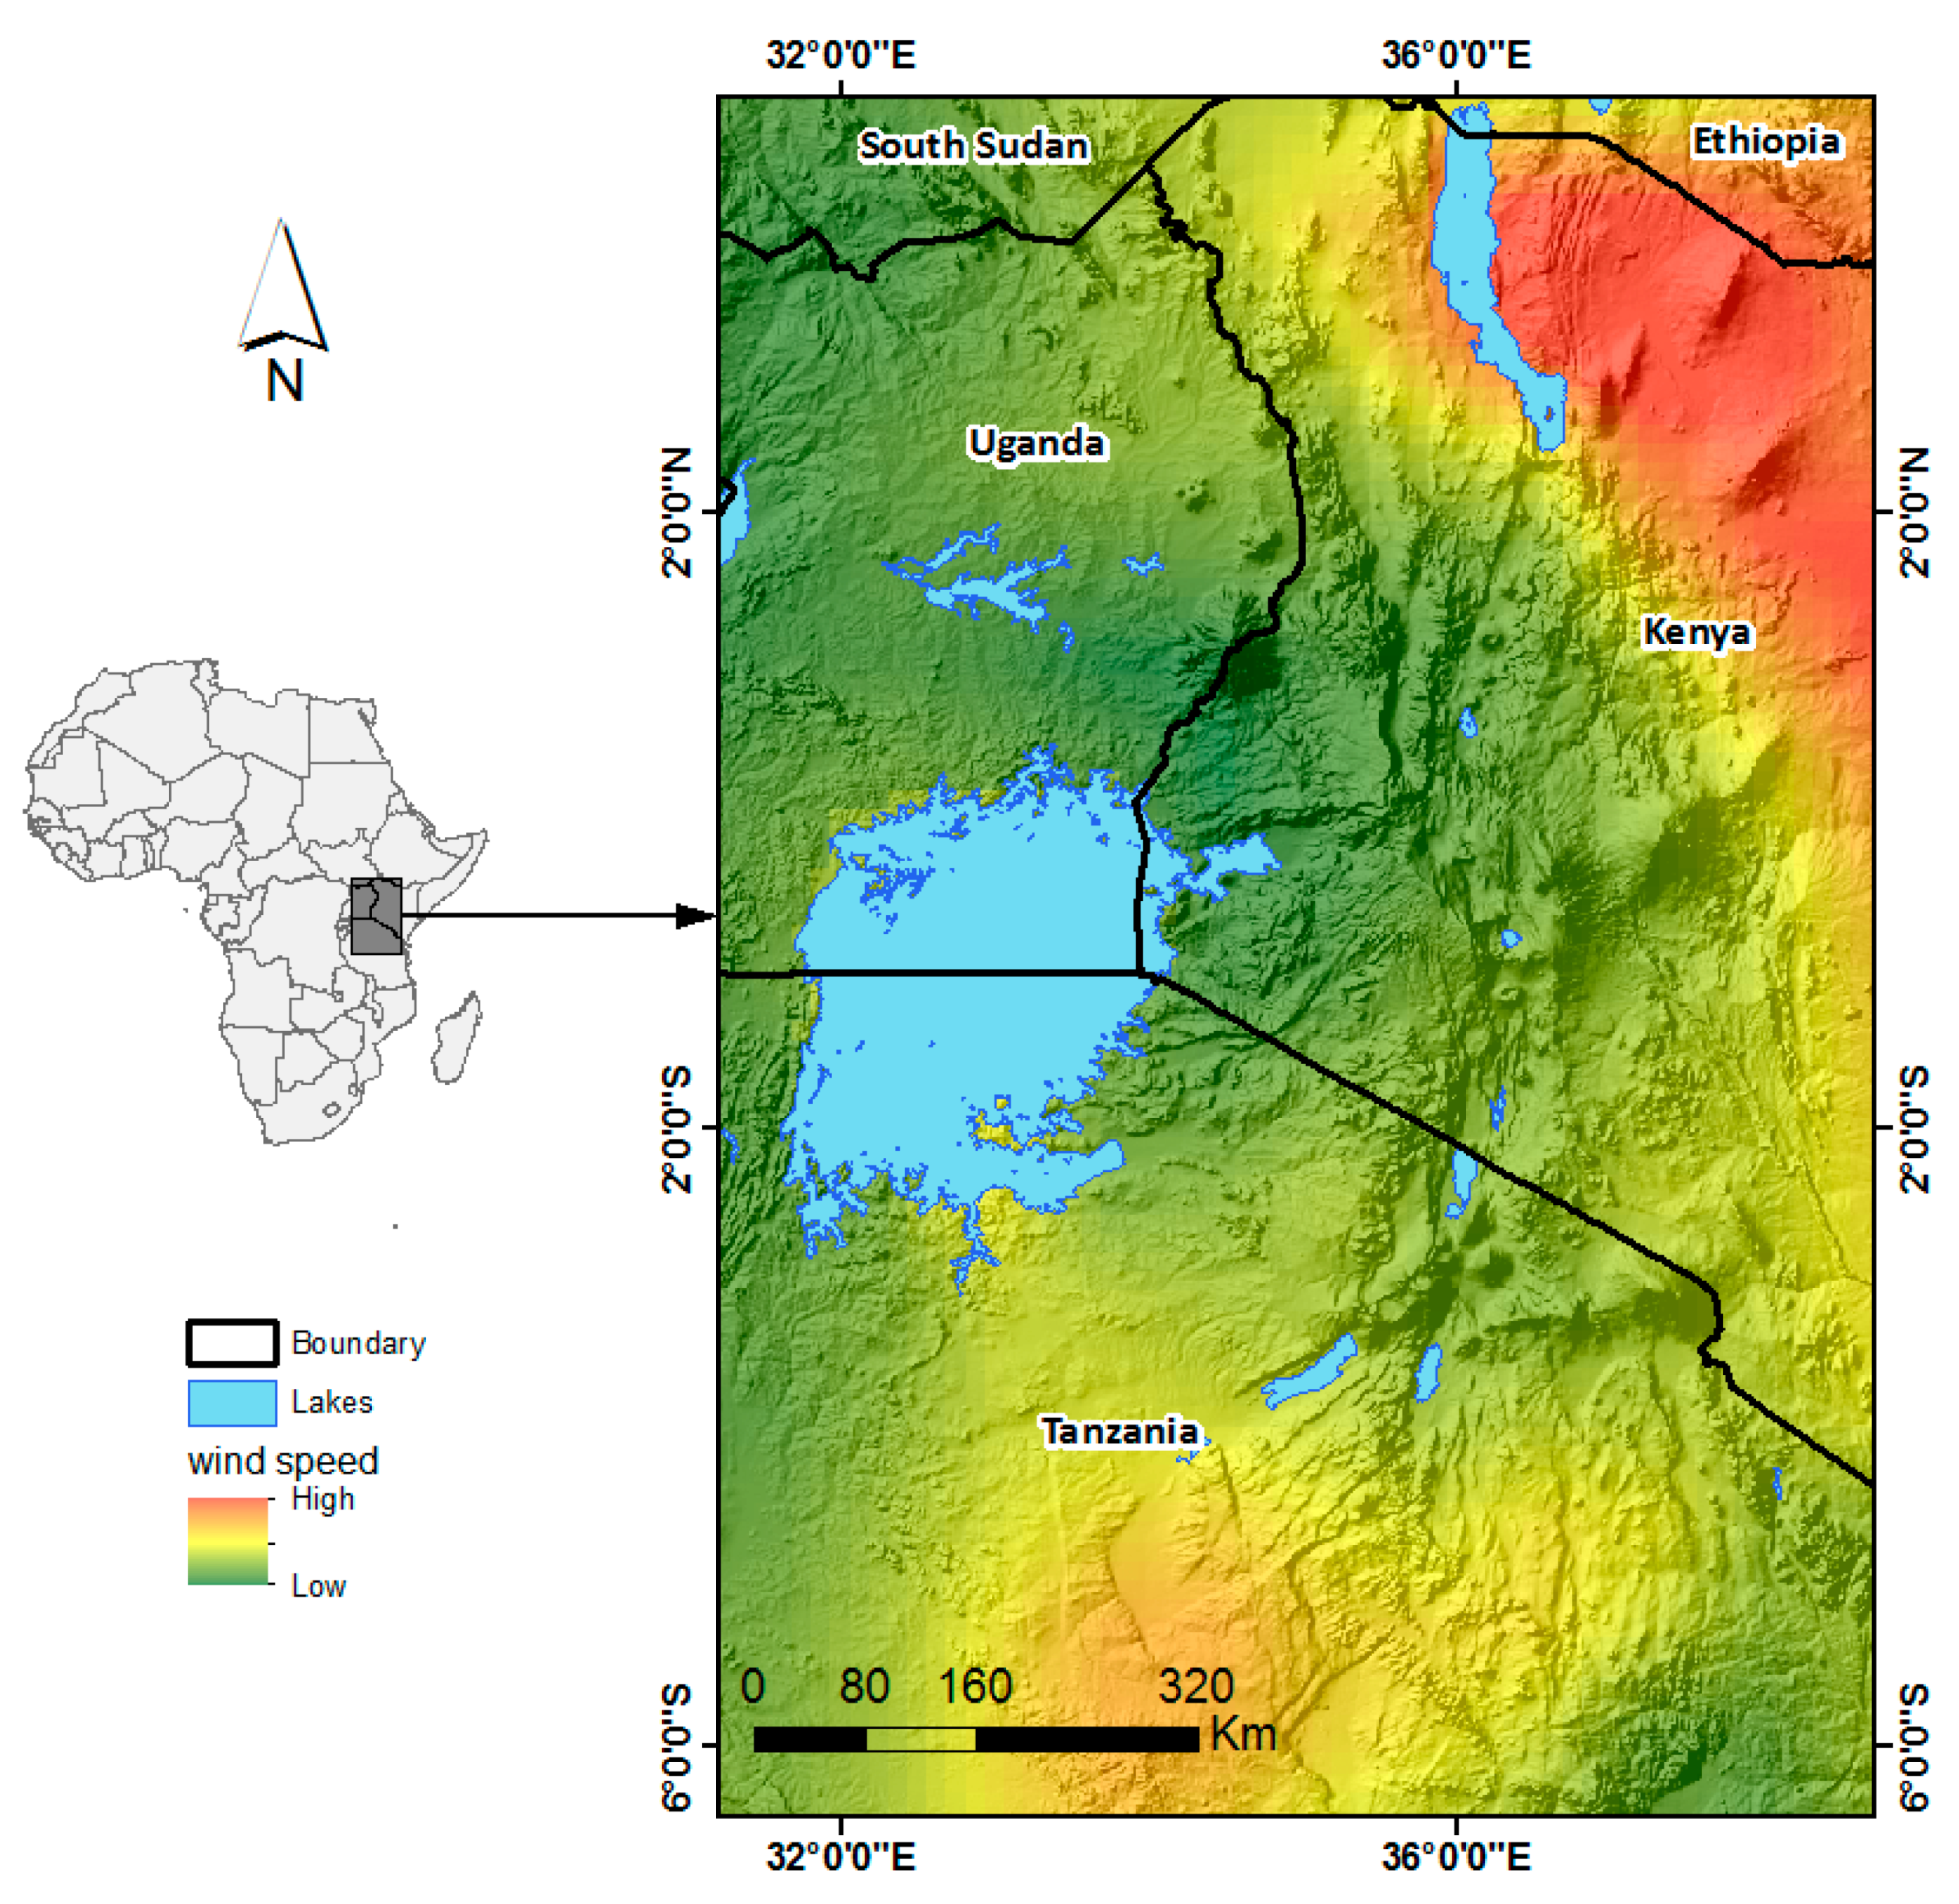
The area of study, which was approximately 700,00 km2, was located within East Africa, and covered the region between latitudes 6.42° S and 4.72° N and longitudes 31.18° E and 38.68° E. The area had recently been targeted for the implementation of one of the biggest wind energy projects in Africa, the Lake Turkana Wind Energy Project [43]. The average wind speed between 2006–2017 varied between 2 m/s to 8 m/s, with the highest values being associated with the mountain ranges in the north-eastern part of Kenya (Figure 1).
2.2. Data Sources and Pre-Processing
The GPS trajectories of juvenile white storks in their migratory journey, from their breeding grounds in Europe to the wintering grounds in southern Africa, provided the empirical data on the movement characteristics of the birds. The data [45] were initially collected so as to assess the cost of the migratory decisions of the white storks [46] and captured the flight paths of 54 birds in their journey to the wintering grounds and back. However, only five of the tagged birds had traversed the areas of study. Furthermore, only three of the trajectories of the birds that passed through the area of study were complete and usable in our work. We therefore used the observed trajectories of the three birds that passed through the area of the study to specify our model. Other spatial datasets (Table 1) provided the necessary variables so as to specify the characteristics of the environment over which the birds flew.
The thermal and orographic characteristics of the environment could influence the ground speed of the birds and the energy expenditure during flight [52]. We estimated the thermal uplift and orographic updraft by combining the topographic data (slope and aspect), wind characteristics (direction and speed), temperature, sensible heat flux, and relative humidity, based on the methods that were developed by Bohrer et al. [53].
From the observed trajectories, we created clusters of dominant flight behaviors, using the Expectation-Maximization Binary Clustering (EMBC) [54] method as it was implemented in the EMBC package in the R statistical software. We then subset the result and only used the parts of the trajectories that were classified as having high movement speeds and smaller navigation turns. This cluster represented the migration (relocation) flight behavior, as the birds tended to move faster and in regular orientations during the gliding flights.
In order to use the trajectories in an agent-based model, we created a regular trajectory with a constant time step of 10 min. We also resampled all of the raster data to a 1 km spatial resolution.
2.3. Model Specification
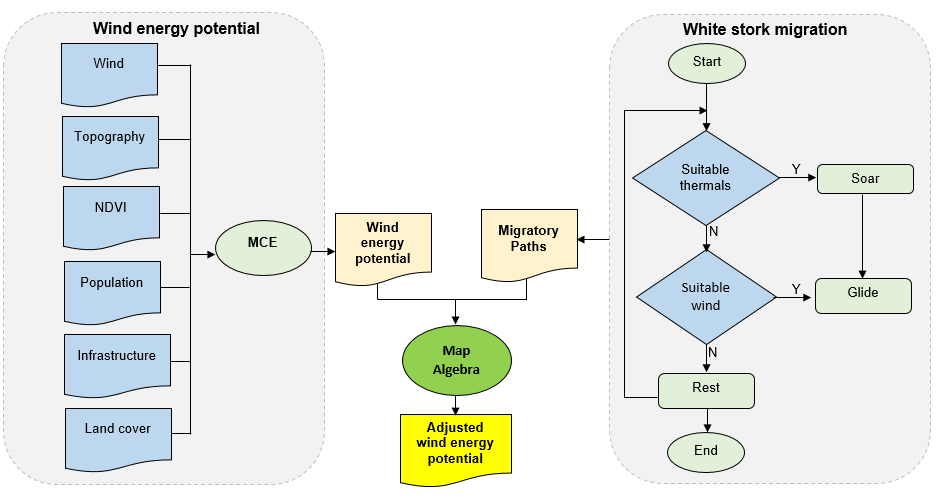
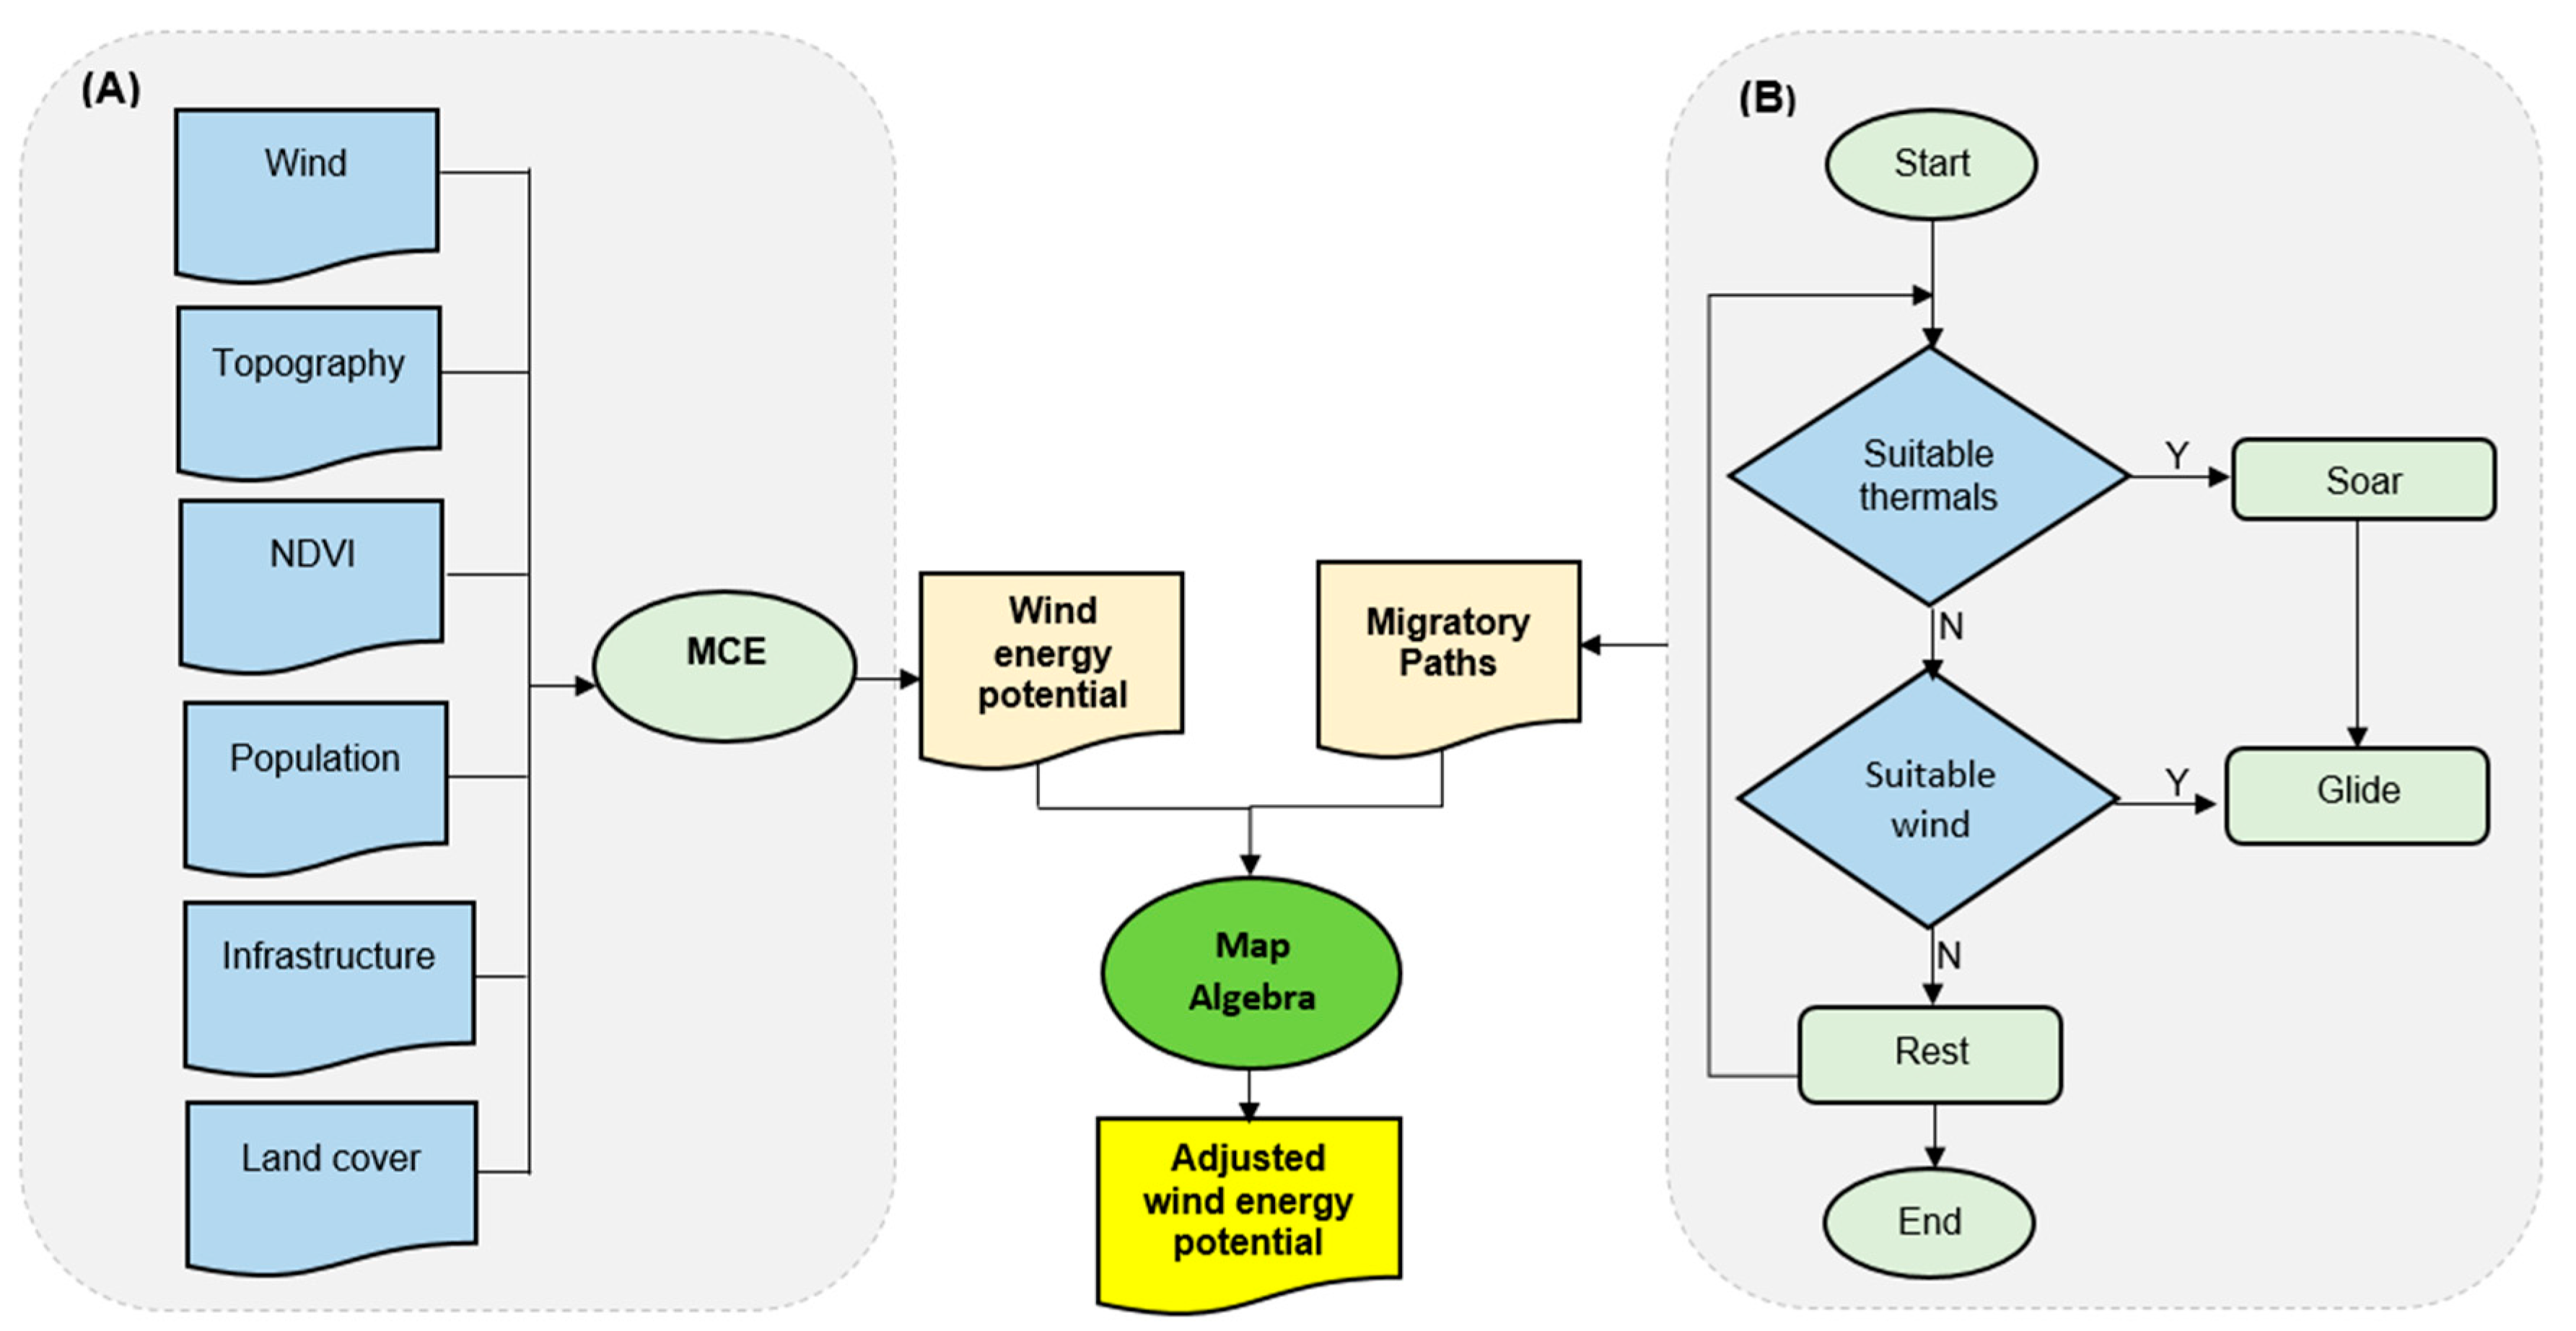
Conceptually, we combined two sub-models in this work (Figure 2). In the first part, we used a multi-criterial evaluation (MCE) model to derive a surface of the wind energy potential in the area of the study. In the second part, we specified a dynamic agent-based model of the white storks migration in the area of the study. In the agent-base model, the bird agents exhibited three main behaviors, which included soaring, gliding, and resting. From the local interaction of birds with their environment, we estimated the commonly occupied patches. We assumed that the commonly occupied patches represented the potential migratory corridors. We then combined the outputs of the two models in order to derive an adjusted surface of the wind energy potential that considered the potential use of some of the patches as the migratory paths behavior.
A simplified ODD (overview, design concepts, and details) protocol [55] was used to document the various aspects of the agent-based model. In summary, the important aspects of the models were as follows. An elaborate ODD protocol was provided in the supplementary materials.
2.3.1. Model Purpose
The main purpose of the agent-based model, as specified in this study, was to simulate the flight behavior of the white storks during the wintering migration. As a result, we assumed that birds in the area of the study flew southwards (from Europe) to the wintering grounds in southern Africa. We therefore only simulated the navigation behavior towards the south of the area of the study.
2.3.2. Model Entities, State Variables, and Scales
We specified two sets of agents in the model. The empirical white stork agents emulated the migration behavior of the white storks as it was captured in the observed trajectories. The simulated agents, on the other hand, predicted the flight behavior by adapting to the environmental characteristics in their locality. We specified the environment (patch variables) to include factors that would influence the flight patterns of the white storks [56]. Specifically, we used the spatial data that represented the wind speed, wind direction, orographic updraft, slope, normalized difference vegetation index (NDVI), human population density, and distance to water bodies. The wind speed and wind direction positively influenced the speed and direction of flight, while the vegetation (NDVI), human settlement, and water bodies were indicators of potential foraging sites. The topographic variables, which included the slope and updraft characteristics, were indicators of potential sites for the gliding and soaring behavior.
The agents had state variables that dynamically changed during the model run. Specifically, the step length, a proxy for the speed of movement, turn angle, and the flying height were the main variables that determined the flight behavior [57]. In the model, the step length and the turn angles of the simulated white storks were separately estimated as the linear functions of the environmental variables (Equations (1) and (2), respectively). We used seven environmental variables including the altitude, NDVI, updraft, slope, wind speed, wind direction, and population density, respectively.
where
- S0 instantaneous step length,
- E1 E7; environmental variables
- t0 instantaneous turn angle
- C1 random value representing intercept of linear function for step length
- C2 random value representing intercept of the linear function for turn angle
- f1; f14 random values to represent co-efficient of environmental variables. We used the first seven values to estimate step distance and the seven to estimate turn angles.
The flying height of an agent varied, depending on the updraft characteristics of a bird’s patch. For instance, in the patches that exhibited a good thermaling energy, the birds would gain height by soaring and regularly lose height when gliding.
From the observed trajectories, the real white storks were able to traverse the area of the study in less than one month (three weeks on average). We therefore assumed that the vegetation characteristics in the area of the study remained largely the same during the flight duration. As such, the NDVI data remained unchanged for the duration of the flight. Similarly, the topographic data, including the elevation, slope, and aspect remained unchanged during the simulation. On the other hand, the raster files that represented the wind speed, wind direction, and uplift characteristics data were updated dynamically after each day in the model time scale. In order to optimize the model, we estimated and used the updraft raster files from the arithmetic sums of the estimated orographic updraft and thermal uplift. The time step (temporal scale) for each simulation was 10 min. A day of simulation ran from 00:00 h to 19:00 h, this was the same duration that was captured in the observed trajectories.
2.3.3. Process Overview and Scheduling
The simulated white stork agents exhibited three main behavior characteristics, namely, they could soar, glide, and rest. We assumed that the intensive foraging behavior took place during the resting behavior. During this procedure, the simulated agents randomly walked within their present patch and only marginally turned their heading to an angle of less than 20° on either side. The soaring and gliding behavior were largely dependent on the thermal and wind characteristics of the environment. The birds used suitable updraft characteristics (a combination of thermal uplift and orographic updraft) to perform the soaring behavior. Similarly, the suitable wind speed and direction facilitated the gliding decisions. At each time step, the simulated agents checked the thermal characteristics of their patch. If there were suitable thermal characteristics, which we had assumed to be any thermal energy above 1 ms−1, the birds soared. Upon attaining a suitable soaring height, the birds performed a gliding behavior.
Apart from the processes that guided the flight behavior, the parameters for estimating the flight velocity and turn angles of the agents were progressively optimized through genetic algorithms. Specifically, we implemented an elitist selection criterion in the genetic algorithm to select the best performing parameters after each full run. The performance of the navigation parameters was evaluated by a fitness function. A fitness value was calculated and assigned to a simulated agent, based on the proximity of that agent location to the flight locations of the observed birds. The lowest performing agents were eliminated and their places were taken by new agents that were generated from a re-combination of the chromosomes of the parameters of the best performing agents. The fitness of the navigation parameters was evaluated at the end of the simulation run.
2.3.4. Design Concepts
In this model, we considered the following agent-based modeling design concepts.
- Emergence: From the individual white stork agent behaviors and interactions of the agent with its local environment, we were interested in the emergence of plausible trajectories. Furthermore, from the autonomous decisions of agents, we were interested in the system-level migratory corridors that emerged from the patch occupancy by the different agents.
- Adaptation: Bird agents adapted to their environment by, for instance, avoiding water bodies, soaring at patches with suitable thermals, and gliding when they had suitable flying heights that could facilitate the gliding and resting when the patch was neither suitable for soaring nor gliding.
- Sensing: Bird agents could perceive the differences in elevation, thermal characteristics, and water bodies. When elevation and thermals were suitable, birds soared and glided, and when the birds were closer to water bodies, they chose dry patches in their vicinity to fly to.
2.3.5. Model Output
As part of the output from the model, we defined a procedure in order to create a text file that contained a subset of the state variables of the agents at each run. Specifically, we recorded the arithmetic mean and standard deviation of the step distance, turn angles, flight height, and fitness values of the agents in each step of the model. Additionally, we specified a procedure so as to export a raster, which specified the number of agents that visited a particular patch during each simulation run.
2.4. Mapping Wind Energy Potential
We adopted the multi-criteria evaluation (MCE) approach to estimate the wind energy potential. We used the literature review to select the factors that had commonly been used to predict wind energy potential [58,59,60,61]. In particular, the main factors included the wind characteristics; topography, which could be derived from the slope and surface roughness; population density; proximity to major roads; proximity to existing transmission lines; and land cover characteristics. We derived the Topographic Roughness Index (TRI) from the digital elevation model, using a method that was developed by Riley et al. [62]. We adopted and modified the classification scheme, which was developed by Miller & Li [58], in order to reclassify each factor into the appropriate suitability classes (Table 2). As a result of the number of classes in the land cover surface, we presented the suitability score for each land cover class in Table 3.
In reclassifying the land cover classes (Table 3), we modified the Miller & Li scheme, so that water bodies were considered unsuitable, forested areas and perennially flooded surfaces were considered to be of low suitability, as building wind farms in such locations would lead to the destruction of forests and wetlands, which provide other vital ecosystem services to the resident communities. Open areas and locations of sparse vegetation were considered to exhibit the highest potential for establishing the wind energy infrastructure.
Based on the suitability classes and the suitability scores, we used the Weighted Overlay method in ArcGIS 10.4 software to combine the suitability factors. We assigned weights, which ranged from 1 to 3, to each suitability factor so as to reflect their relative importance in influencing the wind energy potential. The factors that significantly influenced the suitability of a site for wind energy development were assigned a weight of 3, while the factors with the marginal influence were assigned a weight of 1. The relative influence was estimated as the percentage of the weight that was assigned to each factor, relative to the sum total of the weights of all of the factors.
We considered the long-term average wind speed as the most significant determinant of the ambient wind energy potential and assigned it a relative influence of 25% (Table 4). Secondly, the topography, as represented in this case by the topographic roughness index (TRI), and slope were assigned a combined influence of a relative influence of 17%. This was shared between the TRI (8%) and slope (9%). The land cover characteristics were assigned a relative influence of 16%, while the distance to the main roads and to the existing transmission lines were each assigned an influence of 16%. Finally, the population density, which was a proxy for the urban and non-urban areas, was assigned a weight of 1, which corresponded to a relative influence of 8%. The non-urban areas (sparsely populated) were preferable for wind energy production [60], because of the minimized influence of noise and disturbance from the wind farms to the inhabitants in the surrounding areas.
The areas that corresponded to the protected areas, which included the forest reserves, national parks, and national reserves, were considered as unsuitable areas and were masked out from the results of the weighted overlay analysis. In the resulting surface of the wind energy potential, the cells that were classified with the high and highest wind energy potential were combined to represent the areas with a high suitability for wind energy development. In contrast, the cells that represented the low and lowest wind energy potential were merged so as to portray the locations with a low suitability for wind energy generation. As a result, the final map of the wind energy potential was designed to show the areas with a high, medium, and low suitability for wind energy generation.
2.5. Predicting Migratory Corridors of White Storks
We implemented a genetic algorithm in order to simulate the flight paths of 1000 bird agents in the area of the study. We iteratively implemented the algorithm for 50 generations. Each generation lasted for the duration of a complete model run. We set this to run for, at most, 2500 time steps in the model. In each time step, the fitness of the decision that was made by each agent was calculated as a function of the success of finding a soaring location and the proximity of the bird to the target patch. For each agent, we specified the target to be a patch within the southern border of the simulation world. The agents remembered their target patch throughout their entire lifetime (a simulation run). At the end of each generation, we replaced a proportion of the poorly performing agents and selected the remaining agents to hatch new agents in place of the replaced agents. We achieved this though selection and chromosome crossover procedures.
As part of the results from each simulation run, we exported a raster, which estimated the number of agents that visited a particular patch during the model run. From the 50 simulation runs, we selected the raster files from the last 25 model runs and computed the average raster. Furthermore, we divided the resulting raster by the number of bird agents that were in the simulation (1000 in this model) in order to estimate the patch occupancy rate. In the further steps, we used the raster of the patch occupancy rate as a proxy for the migratory corridors of the white storks in the area of the study.
2.6. Incorporating the Influence of Proximity to Predicted Migratory Corridors on Wind Energy Potential
In this study, we did not estimate the actual risk of collision between the birds and wind turbines at the actual wind farms. Instead, we assumed that the collision risk increased when the wind farms were built in close proximity to the potential corridors of bird migration. We combined the surface of the estimated wind energy potential with the predicted white stork migratory corridors. Specifically, we scaled the inverse of the patch occupancy rate to range from 0 to 3. This ensured that the range of the scaled raster of the patch occupancy was the same as the maximum number of the suitability classes, with 0 signifying a low wind energy potential and 3 signifying a high wind energy potential.
We then computed a weighted sum of the patch occupancy raster and original surface of the wind energy potential. As a result, we ended up with an adjusted surface of the wind energy potential. This surface considered the proximity of birds’ migratory corridor to the predicted wind energy potential surface. We then designed a map to visualize the adjusted surface of the wind energy potential that was cognizant of the migratory corridors.
3. Results
3.1. Flight Behavior of the Migratory White Storks
From the agent-based model, we plotted and analysed state variables of the bird agents. In particular, we examined the flying altitude, turn angles, speed (or step length), updraft characteristics of the visited patches, and fitness of the agents during the flight.
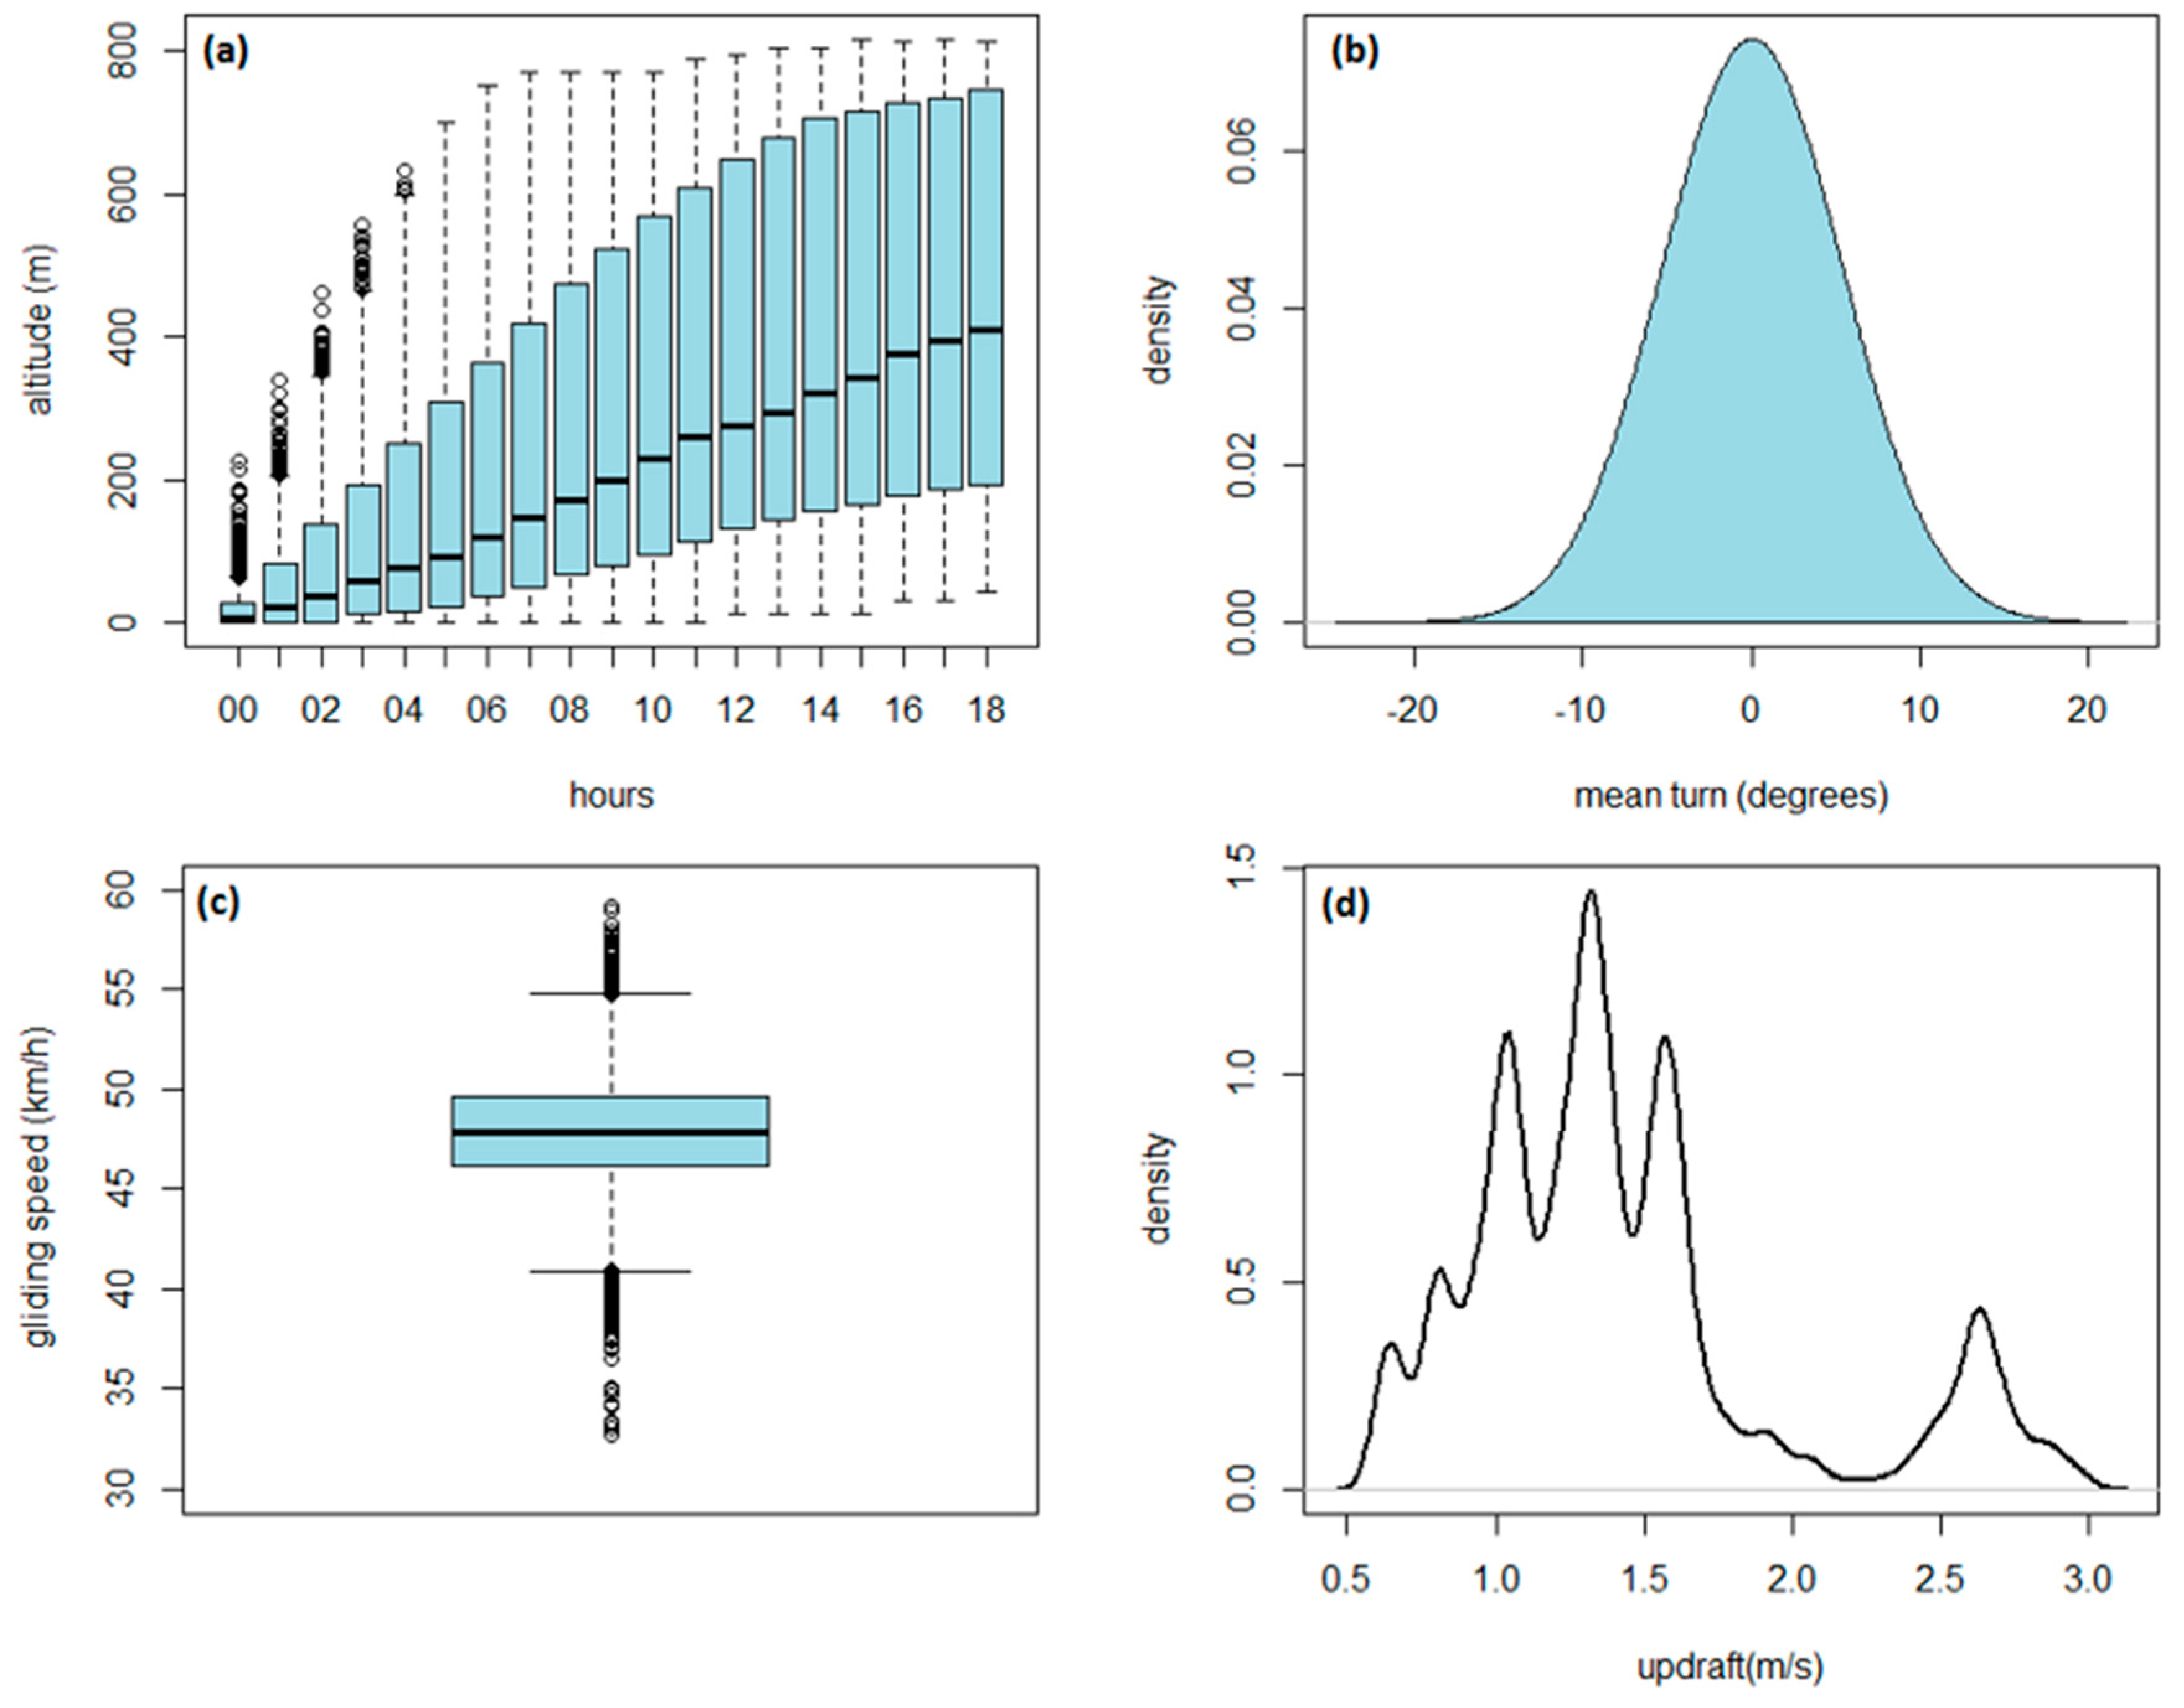
We found that the birds tended to fly higher (reaching a median of approximately 400 m above the ground) as the day progressed (Figure 3). This was similar to the flight height, which ranged between 400 m and 500 m, that had been observed among the migrating white storks in Bulgaria [63]. Additionally, the simulated birds exhibited regular turns of up to 20° in clockwise and anti-clockwise directions. Furthermore, we observed that during migration, the simulated white storks moved at an average speed ranging between 40 and 55 km h−1 (11 and 15 ms−1). Finally, the white stork agents preferred the patches with combined updrafts above 1 ms−1.
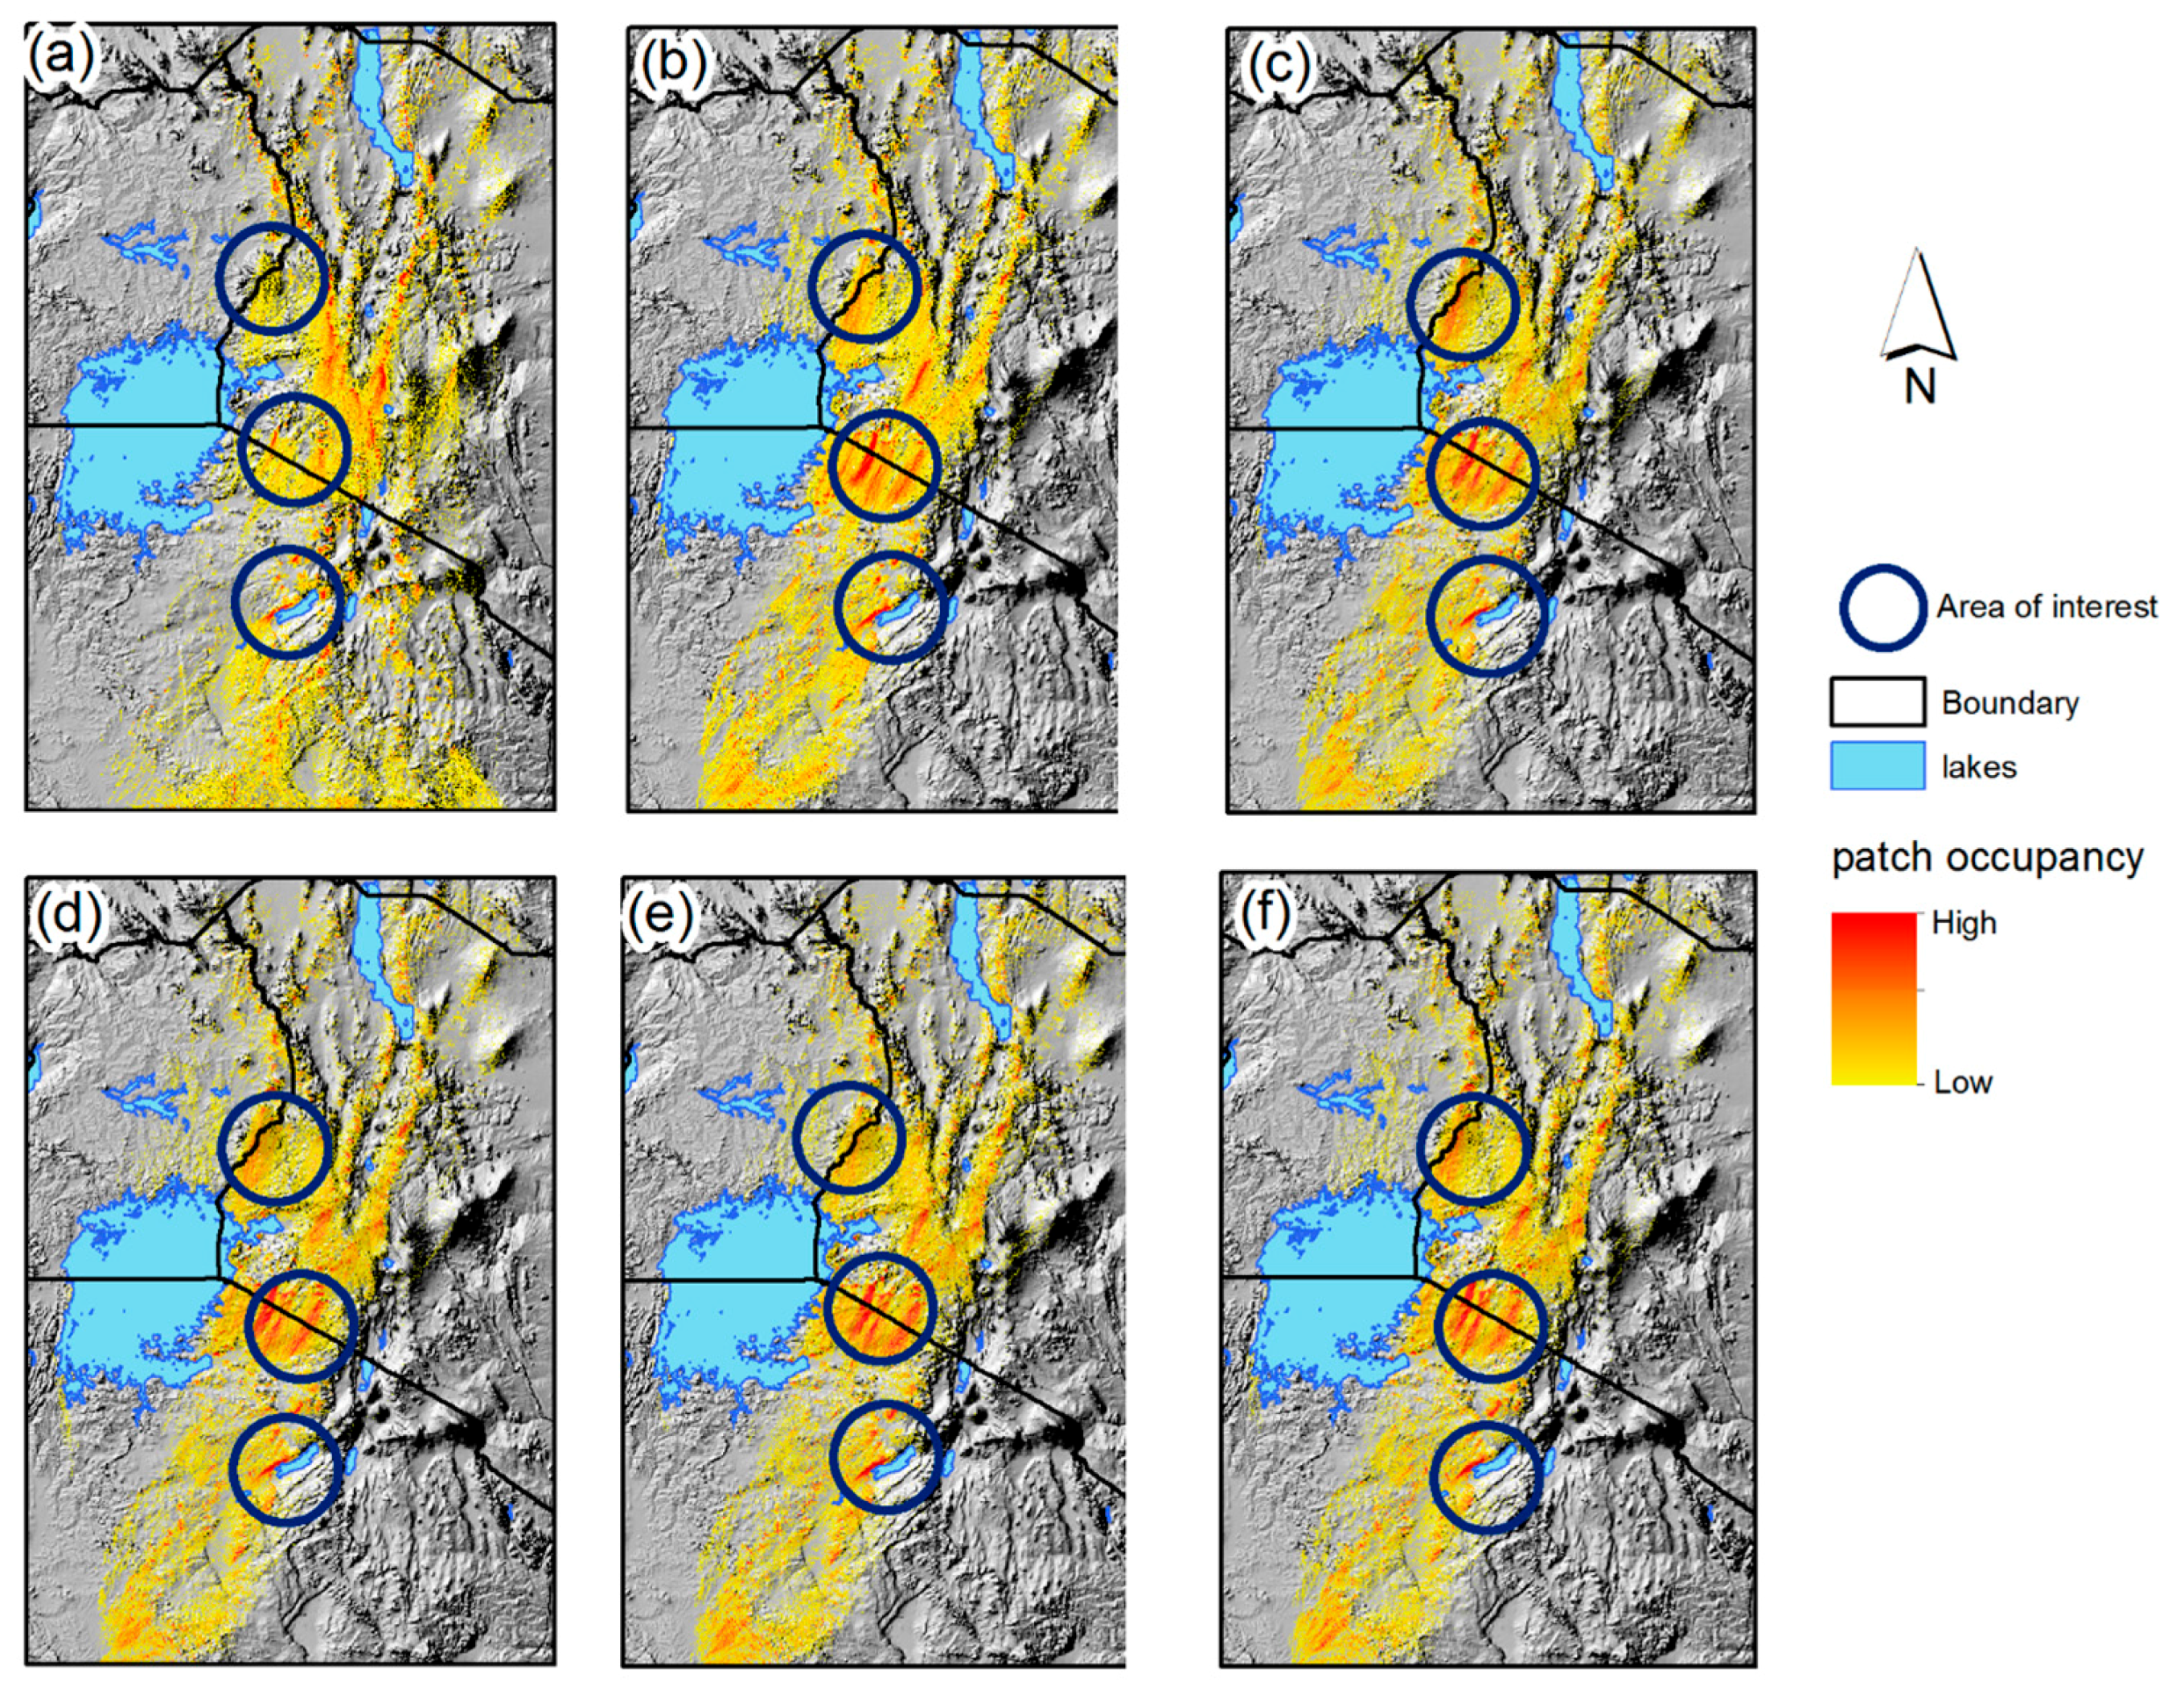
In this model, the individual bird agents made decisions to either glide or soar, based on the time of the day, patch characteristics, and the instantaneous flying altitude of the agent. Trajectories emerged from the individual agent behaviors and the interaction between the agents with the environment. By considering the patch as the smallest spatial unit and by looking at the bird agent behaviors at this scale, we visualized the patch occupancy rate as a macro-system outcome of the individual bird-agent decisions. The patch occupancy signified the rate at which the agents visited or stayed in a particular patch and had been used to evaluate the range [64] and metapopulational dynamics [65]. We mapped the variations in the patch occupancy for each model run at the 1st, 10th, 20th, 30th, 40th, and 50th generations (Figure 4). We observed that the areas with conspicuously high patch visitations were around Mt. Elgon in the border between Kenya and Uganda, the Maasai Mara–Serengeti corridor between Kenya and Tanzania, and around Lake Eyasi in Tanzania.
3.2. Wind Energy Potential from Classical Multi-Criteria Evaluation
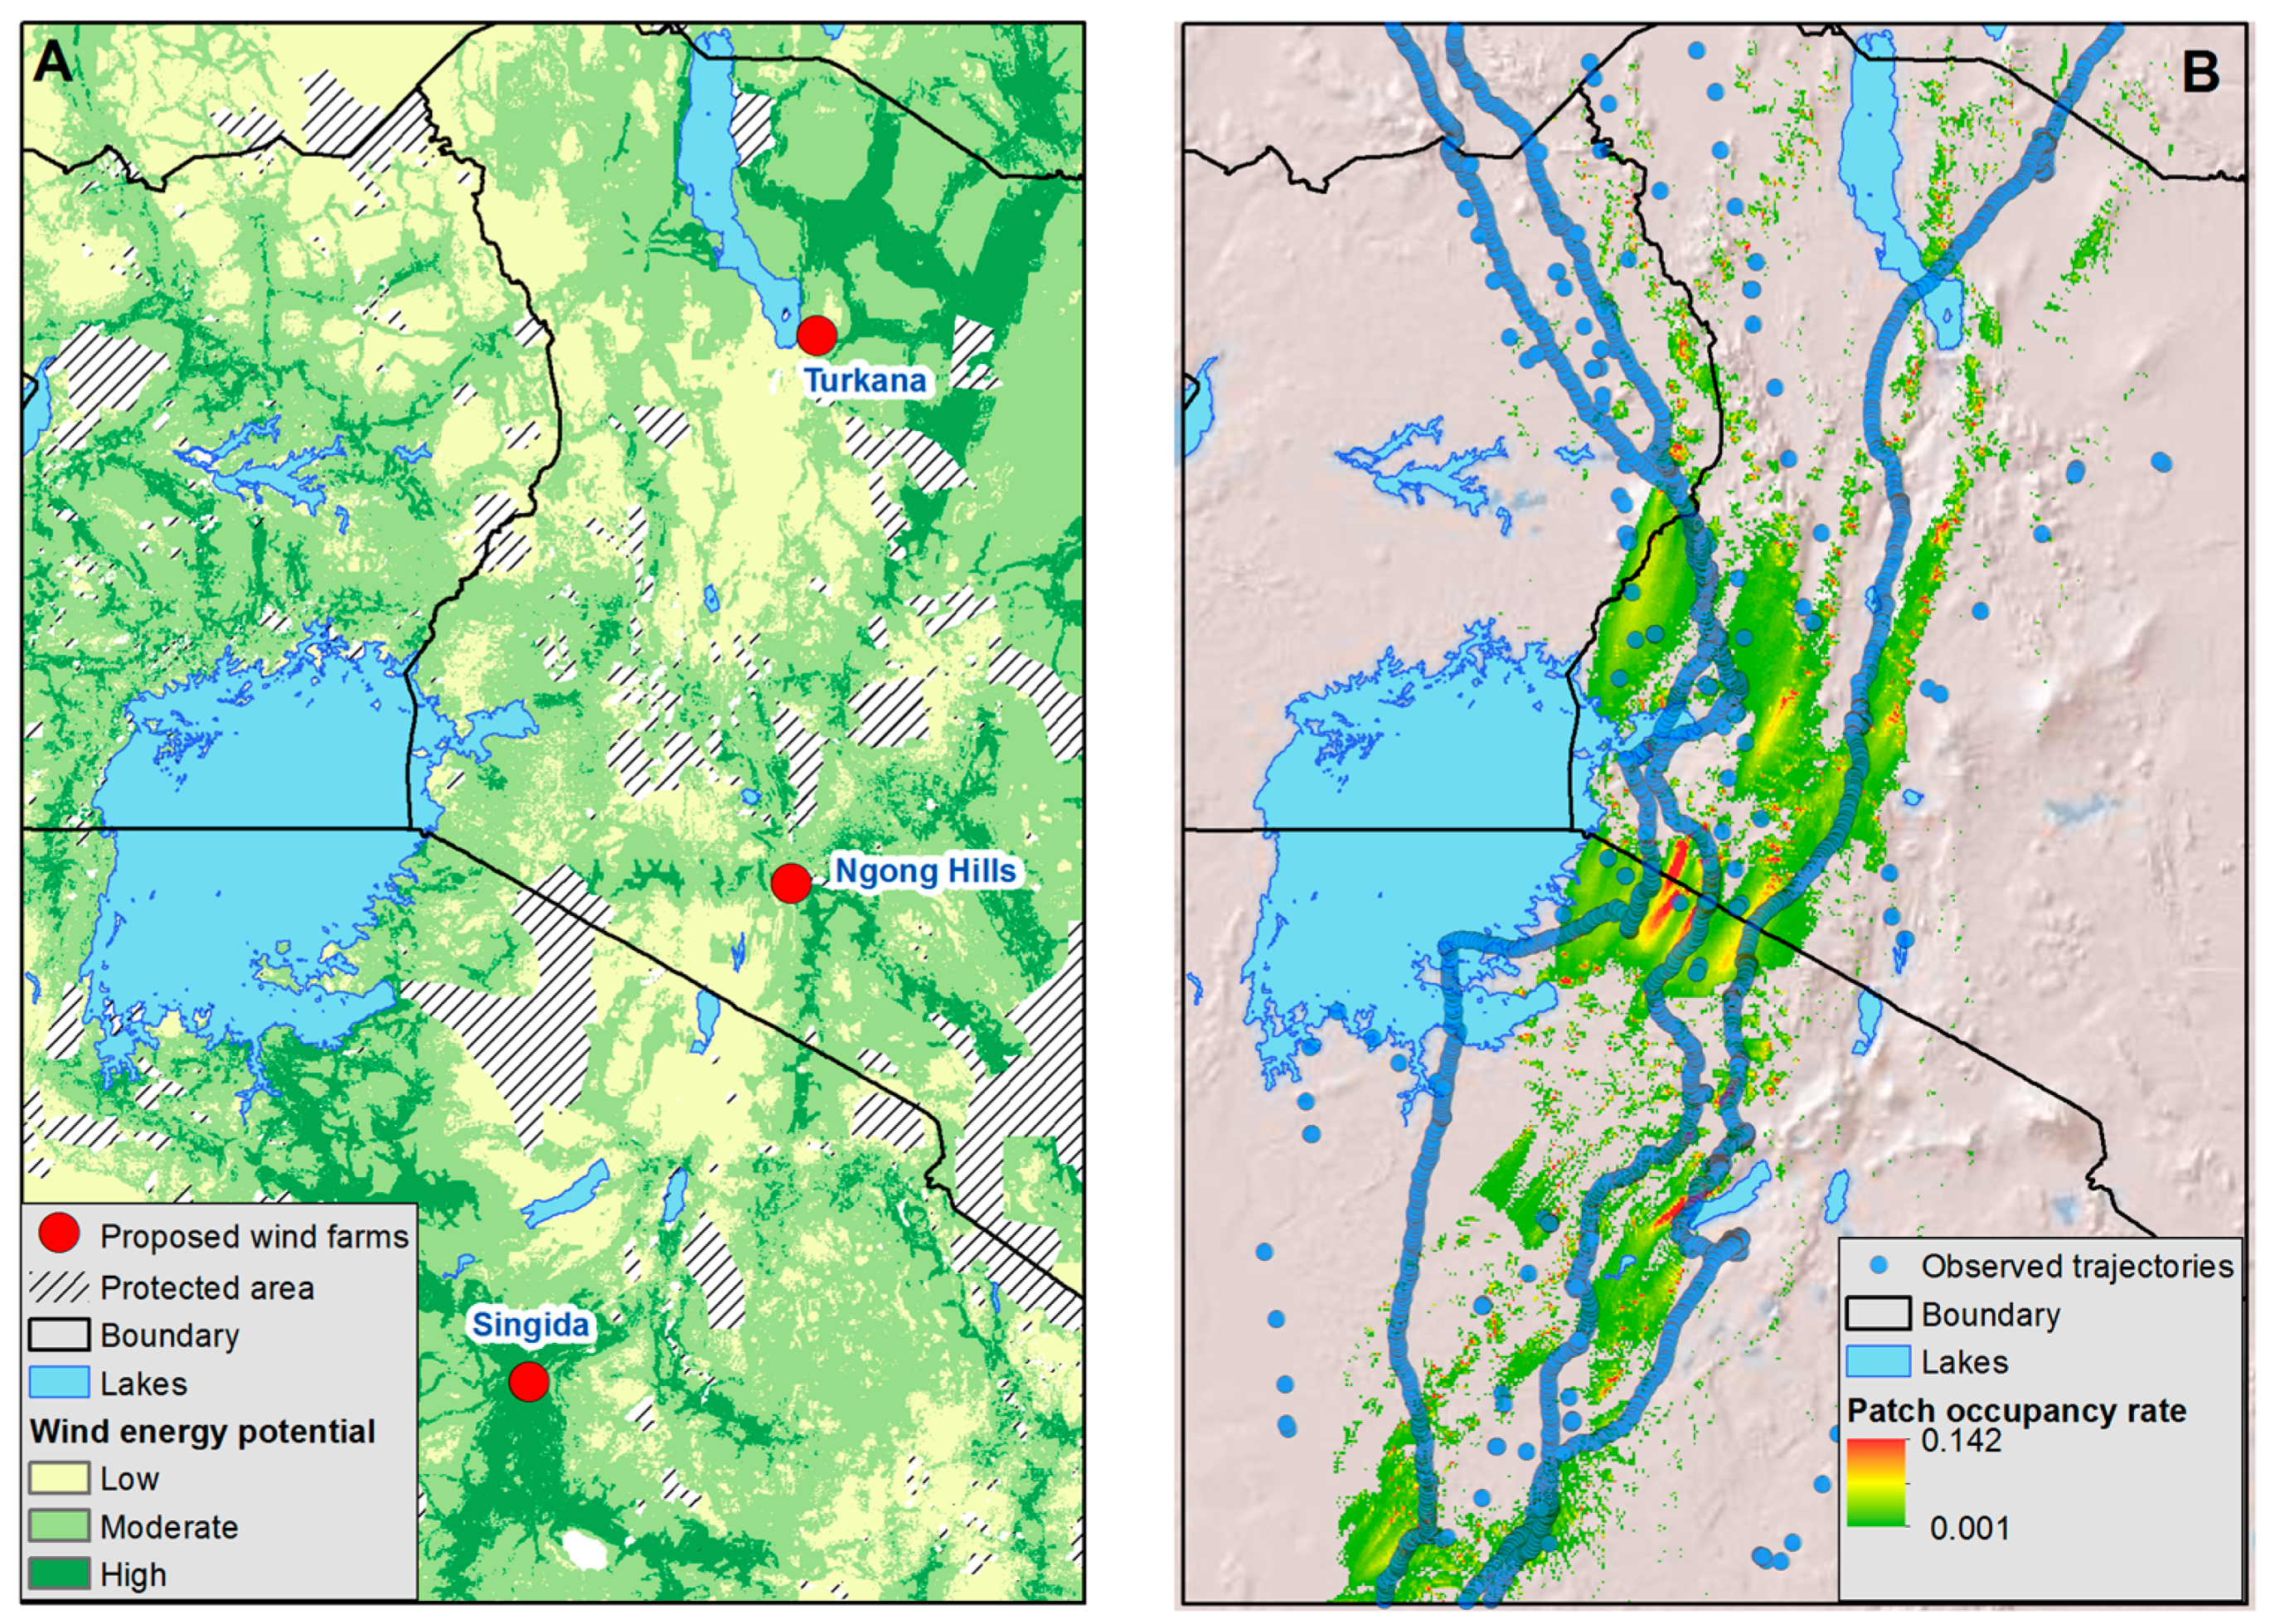
From the results of the multi-criteria evaluation, we presented the suitability of the wind energy potential in three categories (low, moderate, and high) (Figure 5A) and excluded the protected areas, which included forests, national parks, nature conservancies, and heritage sites. We estimated that 14% of the surface (outside of the protected areas and water bodies) in the area of the study exhibited a high potential wind energy generation, while approximately 60% of the area was moderately suitable. Traditionally, a suitability map of the kind that we designed could serve as the first basis of the assessment of wind energy resources.
3.3. Migratory Corridor of Simulated Birds
We calculated the patch occupancy rate as a proxy for the preference of a particular patch by the bird agents (Figure 5B). We observed that, during the migratory flights, the white storks preferred to fly on the ranges of the rift valley on the side that faced Lake Victoria. Additionally, we observed that, even within the corridor, there was a variation in the patch occupancy rate, with most of the preferred patches having an occupancy rate of approximately 0.14. The migratory corridor and the variation in the patch occupancy rate within the corridor provided a basis for adjusting the original wind energy potential surface. By overlaying the observed trajectories on the surface of the patch occupancy rate, we observed that, generally, the predicted pathway of the white stork migration tended to follow the pattern that was followed by the observed birds.
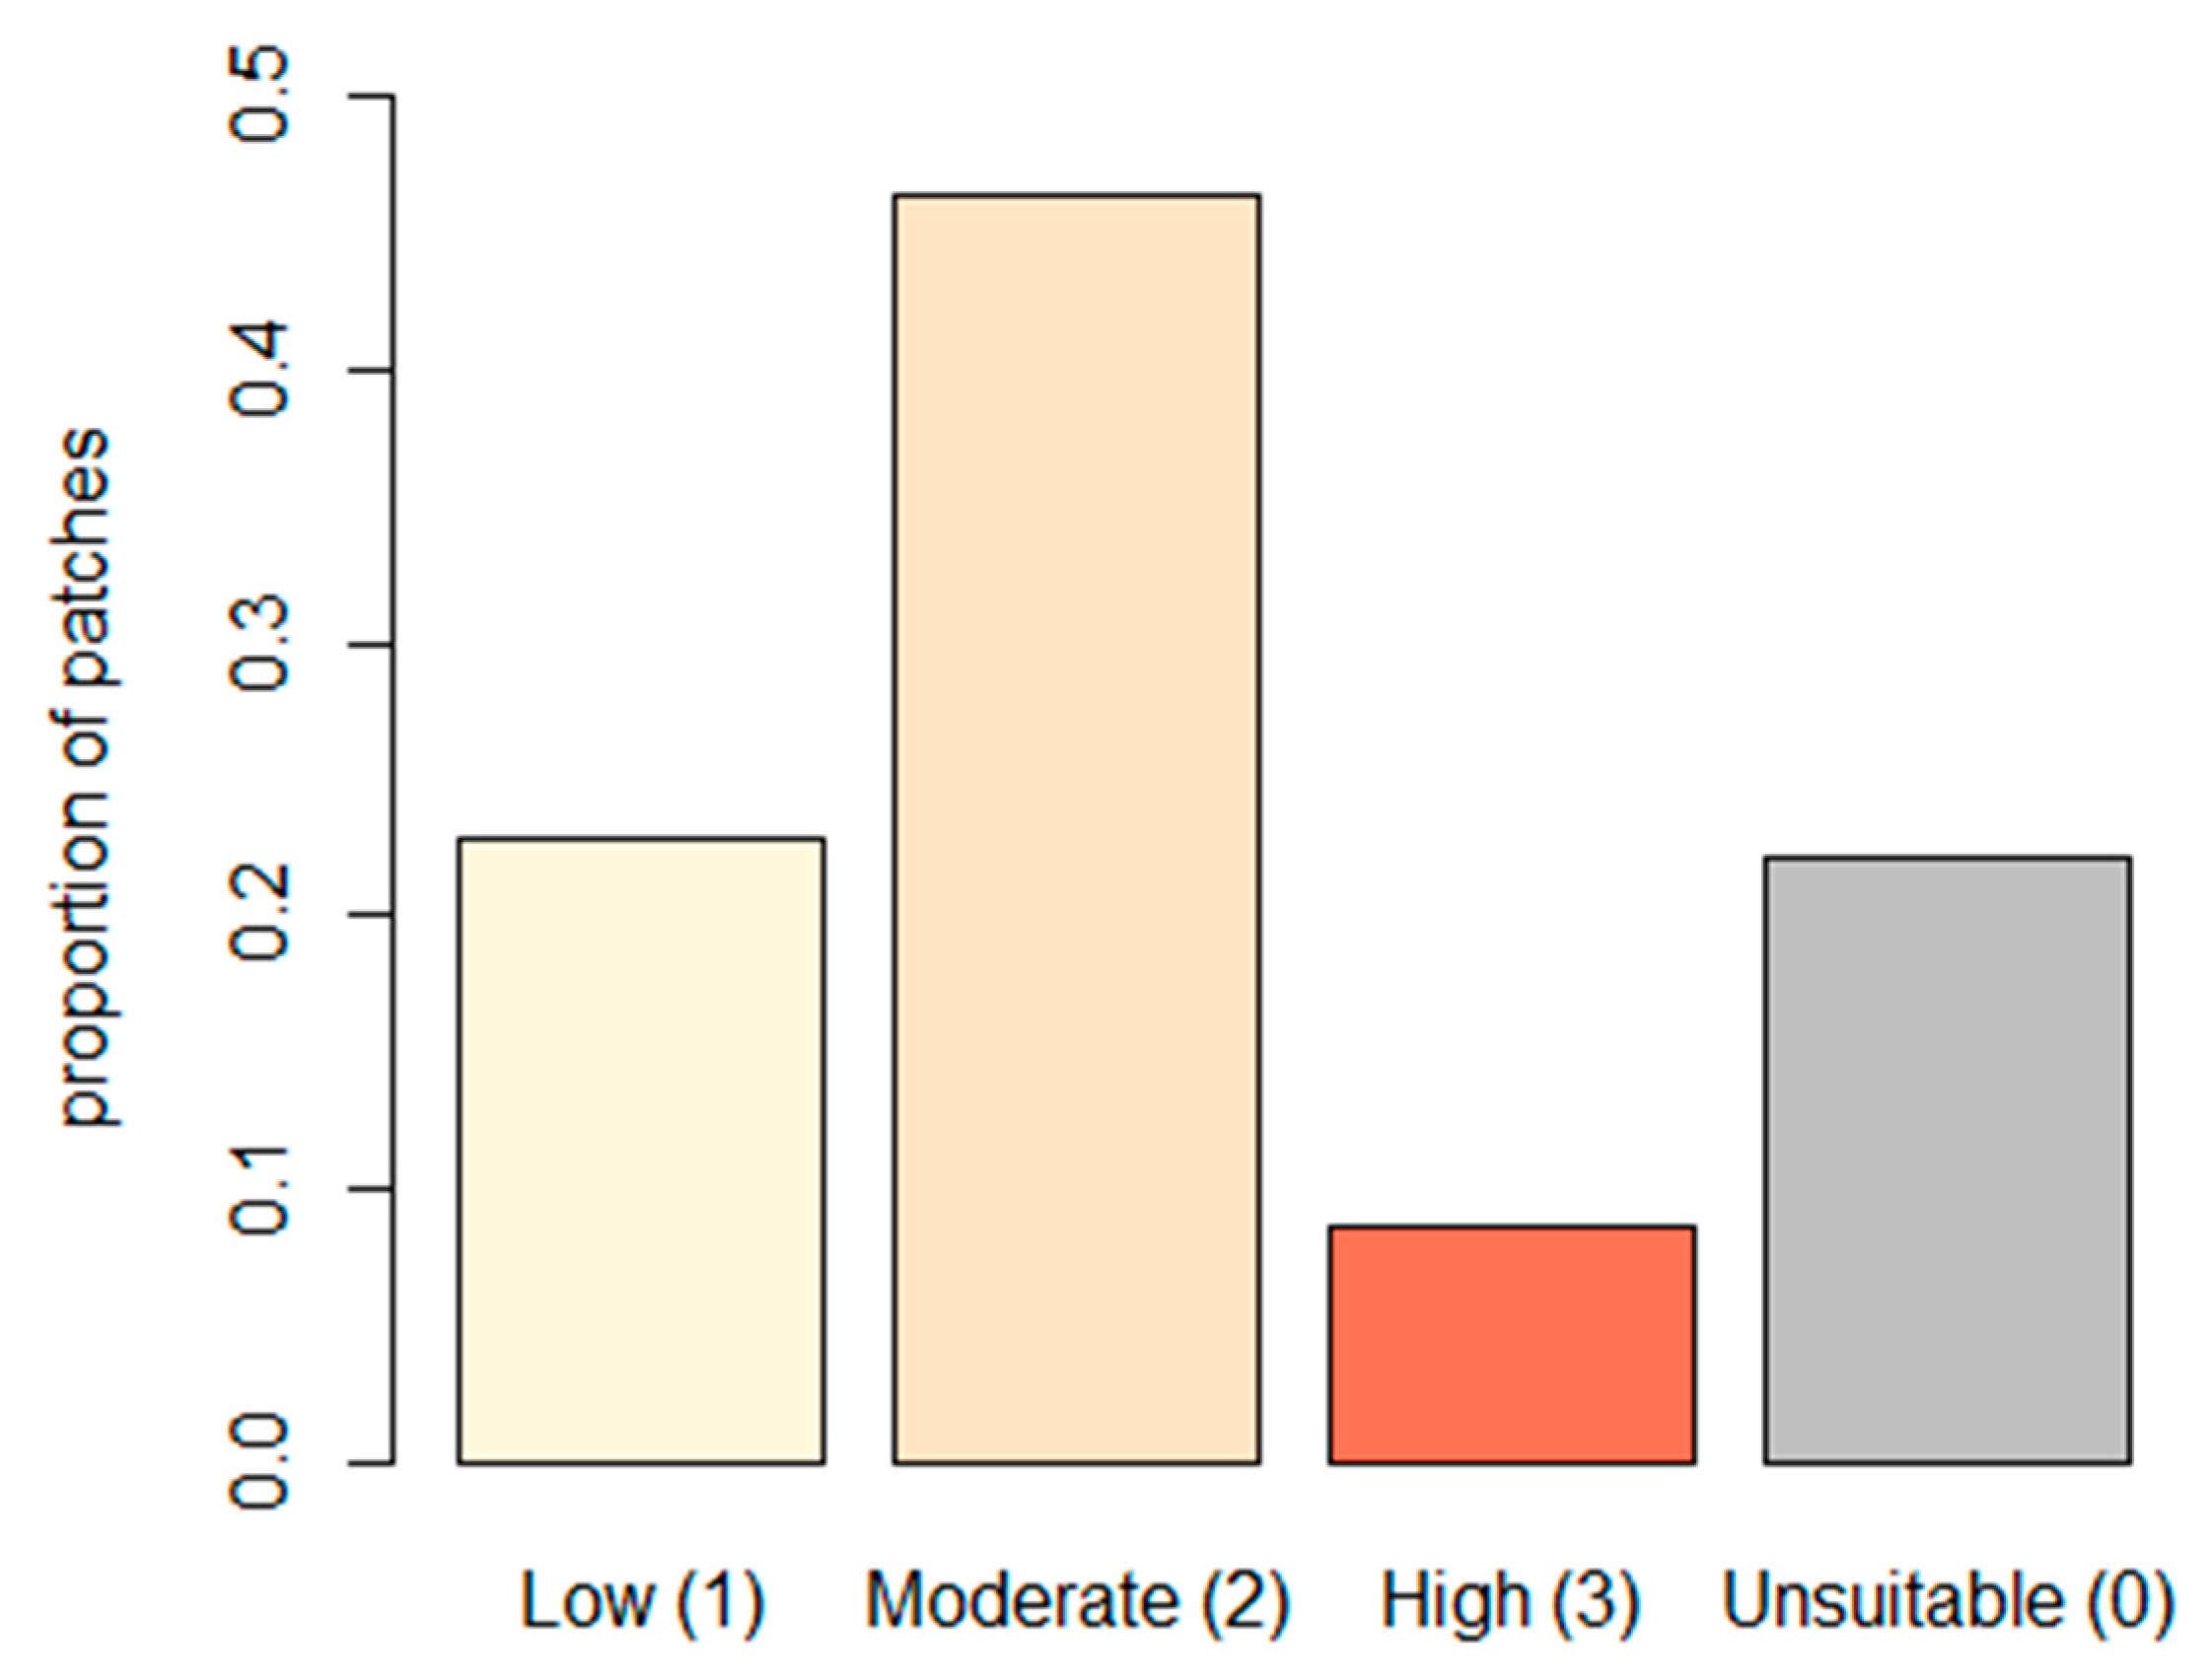
We also estimated that approximately 60% of the patches from the wind energy potential surface in the migratory corridor were classified to be moderately or highly suitable for the wind energy generation (Figure 6). Furthermore, we observed that some of the patches, which were initially classified as moderately suitable for wind energy development, might have potentially served as alternative sites when we considered that they were away from the bird flight corridors.
3.4. Wind Energy Potential Surface and Potential Collission Risk
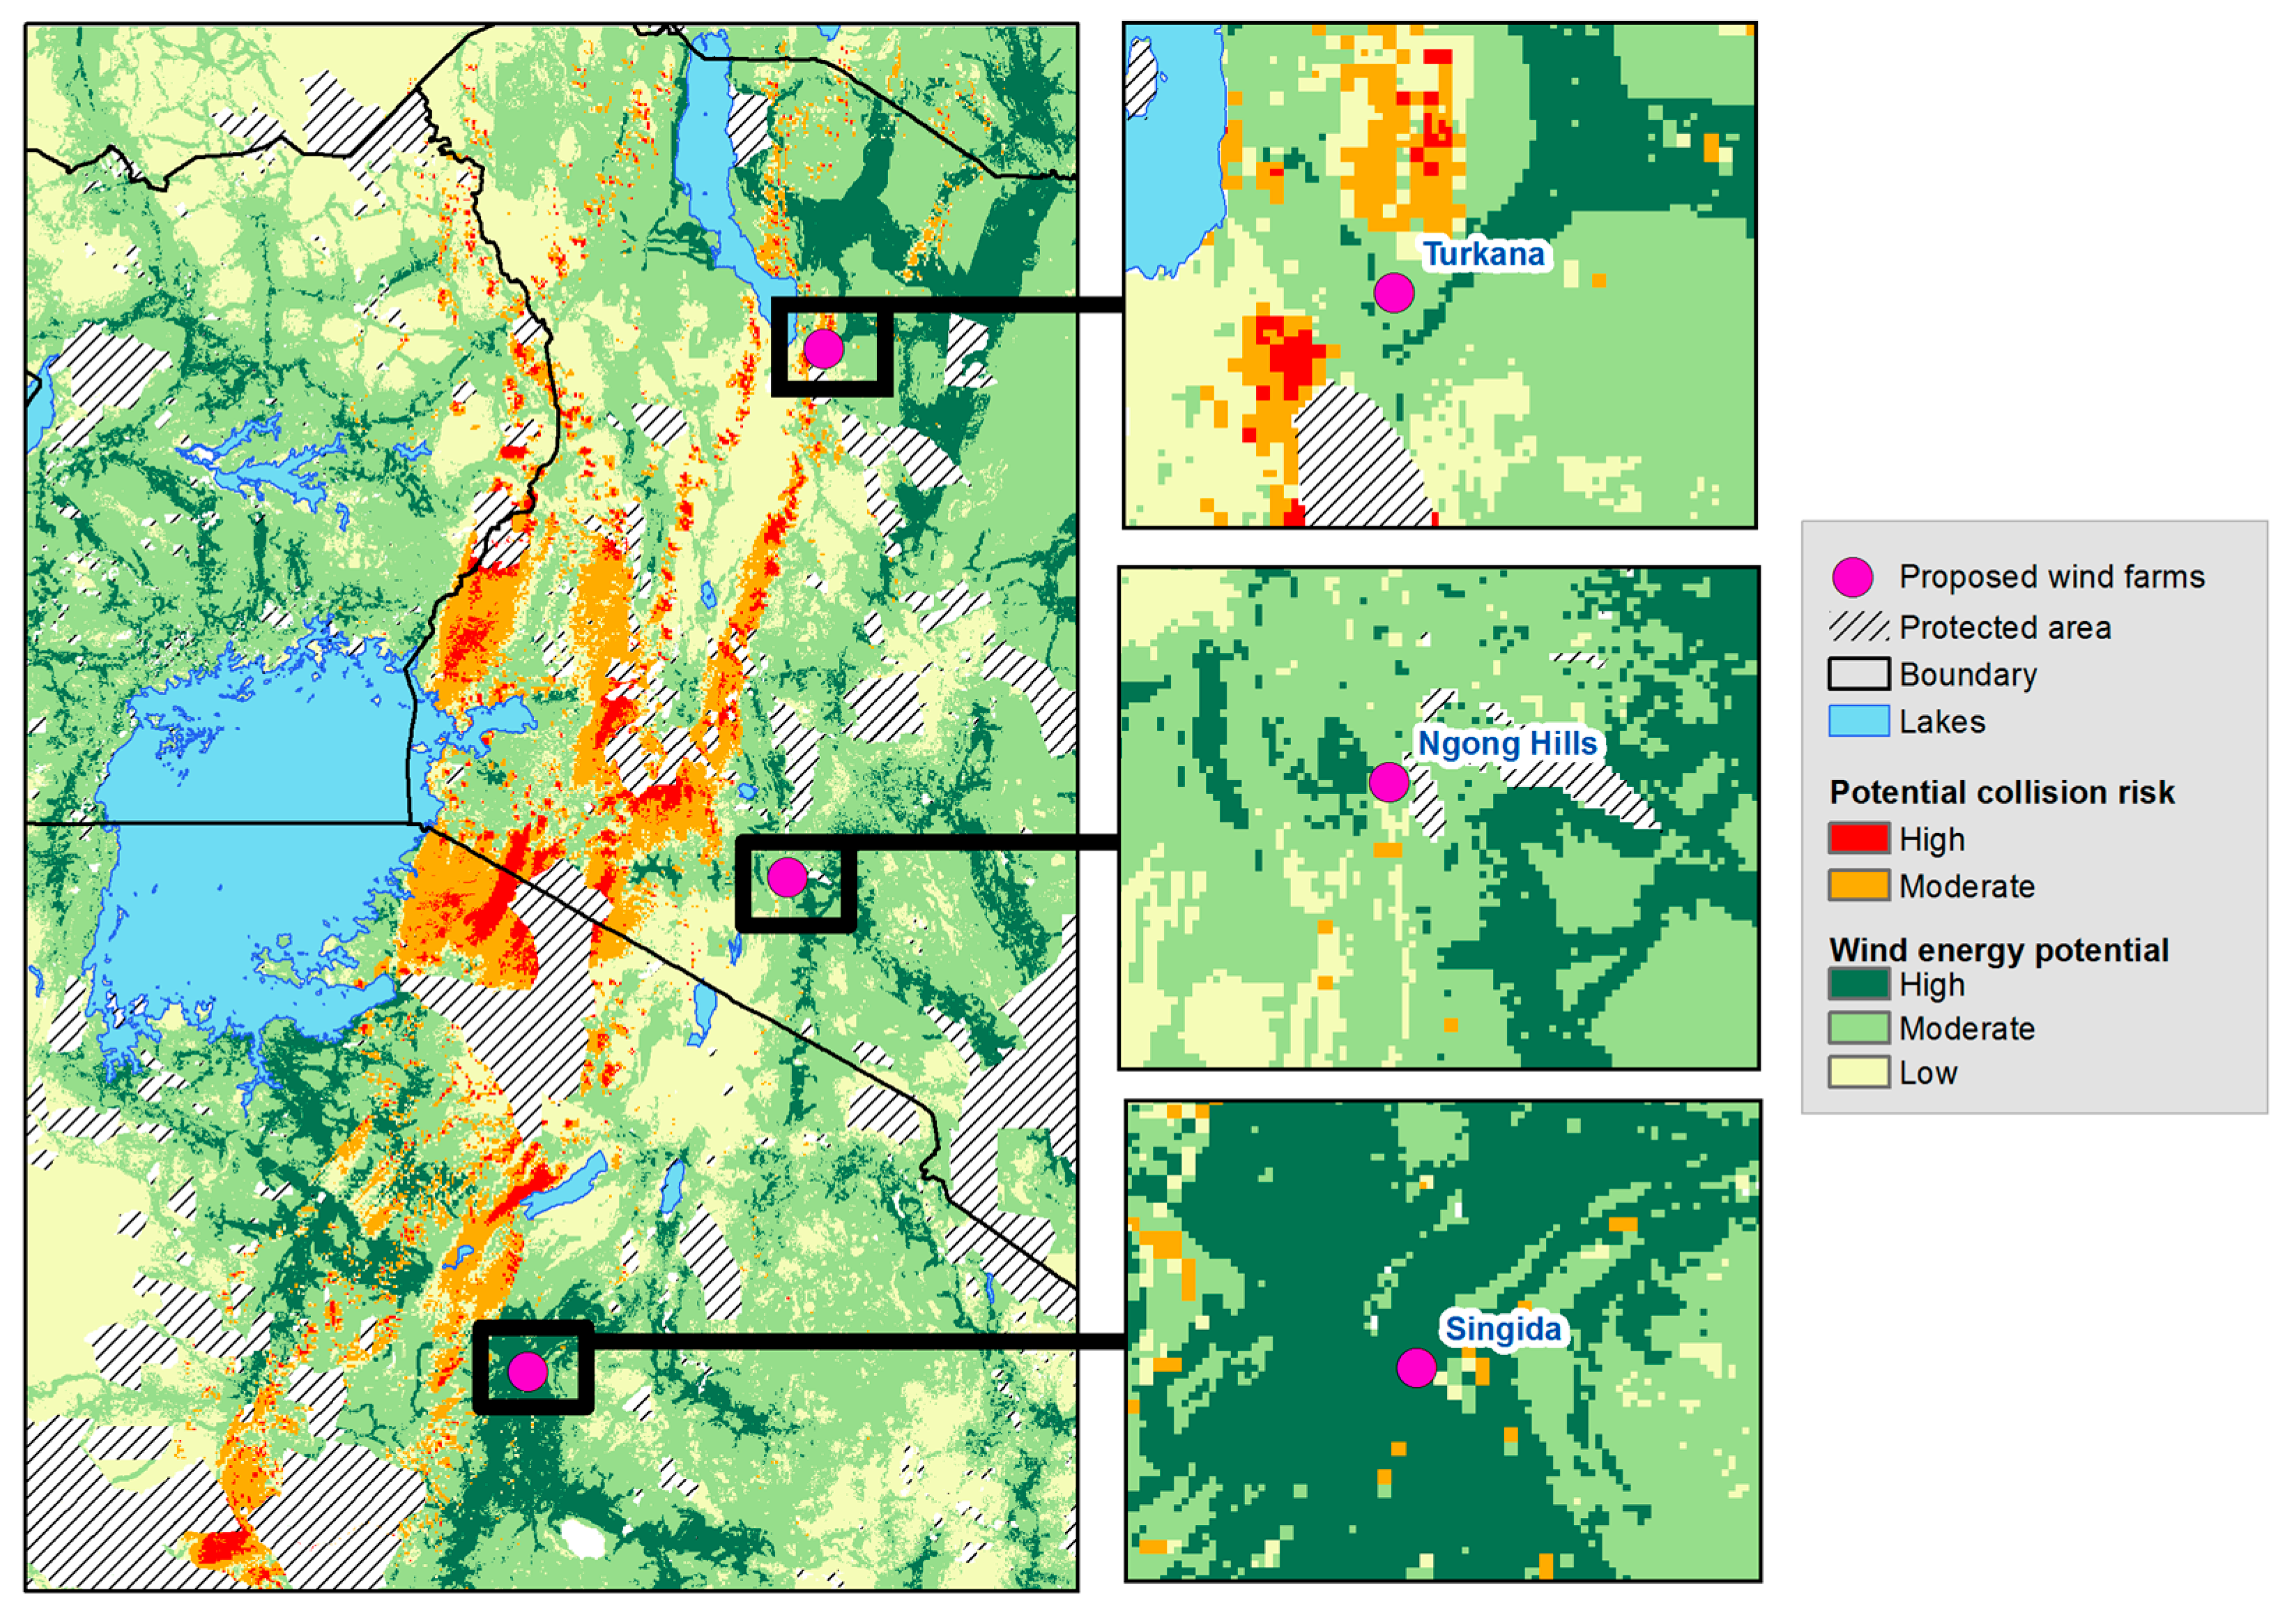
By combining the predicted white stork migratory corridors with the predicted surface of wind energy potential, we designed a suitability map that accounted for the locations that were preferred by the migratory birds (Figure 7). To highlight the potential migratory corridors, the patches that were frequently visited by the birds during flight were displayed in red shade while the moderately visited patches were shaded in orange
We observed that there were still contiguous patches, particularly towards Lake Victoria in Kenya and around Lake Eyasi in Tanzania, that were frequented by birds and, therefore, should preferably be conserved to protect the bird populations. Similarly, there were contiguous portions of land, particularly in the north eastern part of Kenya and in the southern parts of Tanzania, that exhibited a moderate or high potential for wind energy development, while having a lower risk of collision with birds, hence making it possible to achieve trade-offs between wildlife conservation and renewable energy planning. This type of zonation could provide an initial basis for sustainable natural resource planning to the benefit of conservation and the renewable energy development.
4. Discussion
Here, we set out to demonstrate the potential use of the data-driven agent based models and the classical GIS analysis methods to provide an initial assessment of the risk to the migratory white storks from the potential future wind farm development. We combined the predicted surface of the wind energy potential with the predicted white stork migratory corridors, so as to highlight the overlap between the wind energy potential and white stork migratory pathways. The fundamental insights and limitations of our work are summarized in the following sub-sections.
4.1. GNSS Tracking and Behavior Mapping
The advances in the Global Navigation Satellite Systems (GNSS) tracking technology have contributed immensely to the study of the behavior of animals in expansive environments [66]. Monitoring the population and behavior of animals has been important in order to ensure their conservation and to reduce the human–wildlife conflict [67]. However, the cost of tracking has remained high, thus making it impossible to track an entire population of a species of interest. Consequently, the scientific methods that would bridge the gap between data collection and knowledge discovery are necessary. Agent-based models, because of their efficiency in representing dynamic processes [68], have provided a good opportunity to augment the tracking efforts as a means of investigating, understanding, and representing the complexity of the animal ecosystems. Particularly, we adopted data-driven agent-based models as they could integrate both the measuring and computational aspects of an application [69]. Furthermore, the empirical data from GNSS together with spatial data from the remote sensing and sensor networks could support the representation of the spatially explicit environments [70]. This was important when examining the influence of the external environments on the behavior of the agents. Using the observed trajectories of the white storks, we estimated that the initial flight characteristics were as a function of the climatic and landscape characteristics of the location of the flight. We then used these initial characteristics as the initial solutions to simulate the flight paths of the white stork agents.
4.2. Dynamic Agent-Based Modeling for Space-Time Mapping
In ABMs, the agents could be specified to be dynamic, either in their state (being capable to change their behaviors) or in space (by moving, based on the prevailing characteristics of the environment) [68]. The dynamics within the ABM could be achieved by scheduling the sequence of the agent behaviors and by changing the characteristics of the environment iteratively. The use of spatially and temporally reference empirical data to calibrate the agents and to specify the patch variables in the model allowed us to simulate the white stork flight behavior in a dynamic environment. Specifically, the agents navigated in an environment that was characterized by wind (direction and speed), topography (elevation and slope), uplift (thermal and orographic updraft), vegetation (NDVI), and human settlements (population density). Feeding the high-resolution data about the topography, vegetation, and weather into the model allowed us to simulate a realistic environment in which the agents had flown. Moreover, by considering the proximity to the observed trajectories as one of the parameters of fitness, allowed us to partially validate the model in ‘real time’.
Consequently, our work demonstrated that the agent-based models, which were fueled by the high-resolution empirical data on the behavior of the agents, offered a means of linking the agent behavior to the dynamic environment characteristics. The spatial and temporal information from the observed trajectories provided the location and timestamp with which to link the agents with a rich environment as specified by the data from the satellite related products and GIS raster grids [71].
4.3. Emergence of Patterns from White Stork Agent Behaviors
A fundamental characteristic of the ABMs was the emergence of system level patterns from the local level interactions between the agents and their environments. In this work, the migratory paths had emerged from the behavior of the individual white storks in a dynamic environment. In particular, the individual bird decisions, at a local level, to either the soar, glide, or rest, had cumulatively led to the flight trajectories for the individual birds and the patch occupancy rate at the patch level. Consequently, the patterns of the commonly visited patches emerged at the landscape level. From the resulting white stork migratory paths, we managed to identify the high potential sites that were likely to pose a risk to the migrating birds.
The methods that were developed here demonstrated that a combination of data-driven agent-based models and classical GIS models could provide a means of assessing the influence of natural resource use on the wildlife conservation efforts. Such methods could be used to explore sustainable alternatives behavior when testing for different resource planning scenarios [72]. This supported the view that ABMs could provide an avenue for scientists to understand complex environmental problems [73] and to explore the alternatives that could sustainably address the problem at hand. Here, we demonstrated, for instance, that the wind and landscape characteristics were not only determinants of wind energy potentials but could also facilitate or hinder the movement of the birds in an environment, hence, influencing the risk of collision between the birds and wind energy infrastructure. As the sensor and tracking data became available, our method could be applied as an alternative to the traditional collision risk models that have largely depended on counting the carcasses of birds at wind farms, in order to estimate the risk posed by the specific wind farms to the bird populations.
4.4. Limitations and Future Research Directions
We identified two limitations in this study. Firstly, in order to identify the initial flight characteristics, we relied on the information from the empirical trajectories of the white storks. Since only three complete trajectories were available to cover the expansive area of study, this reduced the robustness of the initial parameters. Additionally, as a result of the limitations of data, the model was only verified with respect to the proximity of the flight paths to the observed trajectories. We also did not test for the replicability of the model in another environment. While the methods that we developed in this work were sound and replicable, the output should have been explored in the light of this limitation. As the sensors and GPS tracking devices become more affordable, methods like the one developed here could be tested and applied in data-rich environments. Secondly, we only simulated the flight behaviors of the migratory white storks. However, it was possible that there were other species, including the resident birds, bats, and insects, that might also be affected by the wind farms. An integrative modeling of the behavior patterns of the various species in the study area should have perhaps been considered for ensuring a more holistic and sustainable conservation of the ecosystem of interest.
In this study, we did not evaluate the specific impact of conserving the migratory corridors on the performance of wind energy installations. However, other studies had suggested that, as part of pre-construction assessment, plausible models could guide the siting of individual high-risk turbines to adjacent areas [74] with minimal impact on the overall wind farm performance. Alternatively, the optimization of turbine density [75] in locations that exhibited a high potential for wind energy development and a low-risk of collision, could also reduce the impact of the production losses, which were as a result of the conservation of high potential but high-risk corridors. Additionally, the models of the kind that were specified in this study could have also facilitated post-construction mitigation by highlighting the individual high-risk turbines that could be shut off temporarily in periods when there was a high frequency of birds near the wind farms. Shutting off the turbines during periods of high bird frequency was estimated to reduce the griffon vulture collision by up to 50%, while only resulting in an annual power loss of approximately 0.07% [76]. Similarly, by altering the speed of the high-risk turbines the bat mortality at wind energy facilities was reduced by up to 93% and only resulted in a less than 1% loss in the annual power production [77].
Further research should perhaps develop open and standardized methods so as to facilitate the integration of the dynamic data from the sensor web networks into agent-based models. This could promote the development of the data-driven models in real-time. In line with this, the propagation of uncertainty, from the trajectories and sensor data into agent-based models, was another area that might have concerned the researchers with an interest in data-driven simulation models. Additionally, future research could also focus on developing the metrics to dynamically document and visualize over-fitting in the data-driven simulation models. Finally, since the data-driven models relied on the behavioral patterns that were present in the observed data, another enviable research direction was how to formalize the pattern-oriented modelling framework.
5. Conclusions
Traditionally, the agent-based models have been specified from a known theory. With the advances in sensor and tracking technologies, it is now possible to record and measure the characteristics of animals as they continue with their normal routines in their natural habitats, even in remote areas. The data that are collected in these settings allow us to specify the realistic models in order to investigate the associated environmental processes. In the context of animals, such an understanding can lead to a more sustainable use of natural resources, while conserving the animals in the environment. In this work, we have combined the results from an agent-based model of the migratory white storks and the outputs of the multi-criteria evaluation of the wind energy potential, to identify the areas of overlap between the wind energy resources and the potential corridors of the migratory birds. The methods that are developed here can augment the available tools for carrying out the initial assessment for sustainable wind energy resource planning. By simulating the behaviors of the animals that use the locations that are targeted for wind energy development, the methods can contribute to the initial assessment of potential human–wildlife conflict. The results of this work contribute to the methods of the coupling data-driven agent-based models with the traditional GIS analysis of the sustainable resource assessment and planning.
Supplementary Materials
The following are available online at https://www.mdpi.com/2071-1050/10/5/1470/s1, Figure S1: Patterns of relative suitability of wind energy potential across different factors. (a) Long-term average wind speed data. (b) Topographic Roughness Index. (c) Slope (d) Population density (e) Land cover characteristics. (f) Distance from roads. (g) Distance to major electricity transmission lines.
Author Contributions
F.O. and K.S. conceived the idea and developed the overall framework of the model. F.O. implemented the model, performed data analysis, and geovisualization. F.O. wrote the paper with input from all of the authors. K.S. and J.A. provided critical scientific input and helped to shape the research, analysis, and manuscript.
Acknowledgments
This research is supported by the Austrian Science Fund (FWF) through the Doctoral College GIScience at the University of Salzburg (DK W1237-N23). The Max-Planck Institute for Ornithology, Department for Migration and Immuno-Ecology, and the University of Konstanz’s Department for Biology supported the collection of the empirical data of the storks that were used here. We are grateful to Andrea Flack, Wolfgang Fielder, and Martin Wikelski for collecting the field data of the white storks and for making them available. We are also grateful to Josef Strobl, Gudrun Wallentin, and Daniel Brown for providing useful comments that shaped this research and the manuscript.
Conflicts of Interest
The authors declare no conflict of interest.
References
- Vansteelant, W.M.G.; Shamoun-Baranes, J.; McLaren, J.; van Diermen, J.; Bouten, W. Soaring across continents: Decision-making of a soaring migrant under changing atmospheric conditions along an entire flyway. J. Avian Biol. 2017, 48, 887–896. [Google Scholar] [CrossRef]
- Shamoun-Baranes, J.; Leshem, Y.; Yom-Tov, Y.; Liechti, O. Differential Use of Thermal Convection by Soaring Birds over Central Israel. Condor 2003, 105, 208–218. [Google Scholar] [CrossRef]
- Zwart, M.C.; McKenzie, A.J.; Minderman, J.; Whittingham, M.J. Conflicts between birds and on-shore wind farms. In Problematic Wildlife; Springer: Berlin/Heidelberg, Germany, 2016; pp. 489–504. [Google Scholar]
- Winkelman, J. Birds and the wind park near Urk: Collision victims and disturbance of ducks, geese, and swans. RIN Rep. 1989, 89, 117–121. [Google Scholar]
- Barrios, L.; Rodríguez, A. Behavioural and environmental correlates of soaring-bird mortality at on-shore wind turbines. J. Appl. Ecol. 2004, 41, 72–81. [Google Scholar] [CrossRef] [Green Version]
- Drewitt, A.L.; Langston, R.H.W. Assessing the impacts of wind farms on birds. Ibis 2006, 148, 29–42. [Google Scholar] [CrossRef]
- Orloff, S.; Flannery, A. Wind Turbine Effects on Avian Activity, Habitat Use, and Mortality in Altamont Pass and Solano Country Wind Resource Areas: 1989–1991; Final Report; Biosystems Analysis: Alameda, CA, USA, 1992. [Google Scholar]
- Evans Ogden, L.J. Collision Course: The Hazards of Lighted Structures and Windows to Migrating Birds; World Wildlife Fund Canada and the Fatal Light Awareness Program: Toronto, ON, Canada, 1996. [Google Scholar]
- Liechti, F.; Ehrich, D.; Bruderer, B. Flight Behaviour of White Storks Ciconia Ciconia on Their Migration over Southern Israël. ARDEA 1996, 84, 3–11. [Google Scholar]
- Thelander, C.G.; Smallwood, K.S.; Rugge, L. Bird Risk Behaviors and Fatalities at the Altamont Pass Wind Resource Area: Period of Performance, March 1998–December 2000; National Renewable Energy Lab.: Golden, CO, USA, 2003. [Google Scholar]
- Pearce-Higgins, J.W.; Stephen, L.; Langston, R.H.; Bainbridge, I.P.; Bullman, R. The distribution of breeding birds around upland wind farms. J. Appl. Ecol. 2009, 46, 1323–1331. [Google Scholar] [CrossRef]
- Smallwood, K.S. Estimating wind turbine–caused bird mortality. J. Wildl. Manag. 2007, 71, 2781–2791. [Google Scholar] [CrossRef]
- Finlayson, C. Birds of the Strait of Gibraltar; Bloomsbury Publishing: London, UK, 2010. [Google Scholar]
- García, J.T.; Arroyo, B.E. Migratory movements of western European Montagu’s Harrier Circus pygargus: A review. Bird Study 1998, 45, 188–194. [Google Scholar] [CrossRef]
- Leshem, Y.; Yom-Tov, Y. Routes of migrating soaring birds. Ibis 1998, 140, 41–52. [Google Scholar] [CrossRef]
- Tsovel, A.; Allon, D. Soaring bird migration survey in the northern valleys of Israel, autumns 1988–90. In Raptors in Israel: Passage and Wintering Populations; International Birdwatching Center: Eilat, Israel, 1991; pp. 31–45. [Google Scholar]
- Mukasa, A.D.; Mutambatsere, E.; Arvanitis, Y.; Triki, T. 9 Development of Wind Energy in Africa. Incl. Growth Afr. Policies Pract. Lessons Learn. 2016, 23, 185. [Google Scholar]
- Mentis, D.; Howells, M.; Rogner, H.; Korkovelos, A.; Arderne, C.; Zepeda, E.; Siyal, S.; Taliotis, C.; Bazilian, M.; de Roo, A. Lighting the World: The first application of an open source, spatial electrification tool (OnSSET) on Sub-Saharan Africa. Environ. Res. Lett. 2017, 12, 085003. [Google Scholar] [CrossRef]
- Mentis, D.; Hermann, S.; Howells, M.; Welsch, M.; Siyal, S.H. Assessing the technical wind energy potential in Africa a GIS-based approach. Renew. Energy 2015, 83, 110–125. [Google Scholar] [CrossRef]
- Mentis, D.; Welsch, M.; Nerini, F.F.; Broad, O.; Howells, M.; Bazilian, M.; Rogner, H. A GIS-based approach for electrification planning—A case study on Nigeria. Energy Sustain. Dev. 2015, 29, 142–150. [Google Scholar] [CrossRef]
- Shata, A.A.; Hanitsch, R. Evaluation of wind energy potential and electricity generation on the coast of Mediterranean Sea in Egypt. Renew. Energy 2006, 31, 1183–1202. [Google Scholar] [CrossRef]
- Pegels, A. Renewable energy in South Africa: Potentials, barriers and options for support. Energy Policy 2010, 38, 4945–4954. [Google Scholar] [CrossRef]
- Gove, B.; Langston, R.; McCluskie, A.; Pullan, J.; Scrase, I. Wind Farms and Birds: An Updated Analysis of the Effects of Wind Farms on Birds, and Best Practice Guidance on Integrated Planning and Impact Assessment; BirdLife International: Cambridge, UK, 2013. [Google Scholar]
- New, L.; Bjerre, E.; Millsap, B.; Otto, M.C.; Runge, M.C. A Collision Risk Model to Predict Avian Fatalities at Wind Facilities: An Example Using Golden Eagles, Aquila chrysaetos. PLoS ONE 2015, 10, e0130978. [Google Scholar] [CrossRef] [PubMed]
- Grimm, V.; Railsback, S.F. Individual-Based Modeling and Ecology; Princeton University Press: Princeton, NJ, USA, 2013. [Google Scholar]
- Breckling, B.; Middelhoff, U.; Reuter, H. Individual-based models as tools for ecological theory and application: Understanding the emergence of organisational properties in ecological systems. Ecol. Model. 2006, 194, 102–113. [Google Scholar] [CrossRef]
- Van Loon, E.E.; Shamoun-Baranes, J.; Bouten, W.; Davis, S.L. Understanding soaring bird migration through interactions and decisions at the individual level. J. Theor. Biol. 2011, 270, 112–126. [Google Scholar] [CrossRef] [PubMed]
- Dennhardt, A.J.; Duerr, A.E.; Brandes, D.; Katzner, T.E. Modeling autumn migration of a rare soaring raptor identifies new movement corridors in central Appalachia. Ecol. Model. 2015, 303, 19–29. [Google Scholar] [CrossRef]
- Zurell, D.; Eggers, U.; Kaatz, M.; Rotics, S.; Sapir, N.; Wikelski, M.; Nathan, R.; Jeltsch, F. Individual-based modelling of resource competition to predict density-dependent population dynamics: A case study with white storks. Oikos 2015, 124, 319–330. [Google Scholar] [CrossRef]
- Band, W.; Madders, M.; Whitfield, D.P. Developing field and analytical methods to assess avian collision risk at wind farms. In Birds and Wind Farms: Risk Assessment and Mitigation; Scottish National Heritage: Perth, UK, 2007; pp. 259–275. [Google Scholar]
- Whitfield, D.P.; Madders, M. Deriving Collision Avoidance Rates for Red Kites Milvus. In Natural Research Information Note; Natural Research Ltd.: Banchory, UK, 2006. [Google Scholar]
- Eichhorn, M.; Johst, K.; Seppelt, R.; Drechsler, M. Model-Based Estimation of Collision Risks of Predatory Birds with Wind Turbines. Ecol. Soc. 2012, 17, 1. [Google Scholar] [CrossRef]
- Santos, M.; Bastos, R.; Ferreira, D.; Santos, A.; Barros, P.; Travassos, P.; Carvalho, D.; Gomes, C.; Vale-Gonçalves, H.M.; Braz, L.; et al. A spatial explicit agent based model approach to evaluate the performance of different monitoring options for mortality estimates in the scope of onshore windfarm impact assessments. Ecol. Indic. 2017, 73, 254–263. [Google Scholar] [CrossRef]
- DeAngelis, D.L.; Grimm, V. Individual-based models in ecology after four decades. F1000prime Rep. 2014, 6, 39. [Google Scholar] [CrossRef] [PubMed]
- Nittel, S. A Survey of Geosensor Networks: Advances in Dynamic Environmental Monitoring. Sensors 2009, 9, 5664–5678. [Google Scholar] [CrossRef] [PubMed]
- Dodge, S.; Bohrer, G.; Weinzierl, R.; Davidson, S.C.; Kays, R.; Douglas, D.; Cruz, S.; Han, J.; Brandes, D.; Wikelski, M. The environmental-data automated track annotation (Env-DATA) system: Linking animal tracks with environmental data. Mov. Ecol. 2013, 1, 3. [Google Scholar] [CrossRef] [PubMed]
- Keller, N.; Xiaolin, H. Data driven simulation modeling for mobile agent-based systems. In Proceedings of the 2016 Symposium on Theory of Modeling and Simulation (TMS-DEVS), Pasadena, CA, USA, 3–6 April 2016; pp. 1–8. [Google Scholar]
- Srinivas, M.; Patnaik, L.M. Genetic algorithms: A survey. Computer 1994, 27, 17–26. [Google Scholar] [CrossRef]
- Calvez, B.; Hutzler, G. Automatic tuning of agent-based models using genetic algorithms. In International Workshop on Multi-Agent Systems and Agent-Based Simulation; Springer: Berlin/Heidelberg, Germany, 2005. [Google Scholar]
- Stonedahl, F.; Wilensky, U. Finding Forms of flocking: Evolutionary search in abm parameter-spaces. In International Workshop on Multi-Agent Systems and Agent-Based Simulation; Springer: Berlin/Heidelberg, Germany, 2010. [Google Scholar]
- Jebari, K.; Madiafi, M. Selection methods for genetic algorithms. Int. J. Emerg. Sci. 2013, 3, 333–344. [Google Scholar]
- Kirby, J.S.; Stattersfield, A.J.; Butchart, S.H.M.; Evans, M.I.; Grimmett, R.F.A.; Jones, V.R.; O’Sullivan, J.; Tucker, G.M.; Newton, I. Key conservation issues for migratory land- and waterbird species on the world’s major flyways. Bird Conserv. Int. 2008, 18, S49–S73. [Google Scholar] [CrossRef]
- International Renewable Energy Agency (IRENA). Unlocking Renewable Energy Investment: The Role of Risk Mitigation and Structured Finance; IRENA: Abu Dhabi, UAE, 2016; pp. 54–55. [Google Scholar]
- Dee, D.P.; Uppala, S.; Simmons, A.; Berrisford, P.; Poli, P.; Kobayashi, S.; Andrae, U.; Balmaseda, M.; Balsamo, G.; Bauer, P. The ERA-Interim reanalysis: Configuration and performance of the data assimilation system. Q. J. R. Meteorol. Soc. 2011, 137, 553–597. [Google Scholar] [CrossRef]
- Flack, A.; Fiedler, W.; Blas, J.; Pokrovski, I.; Mitropolsky, B.; Kaatz, M.; Aghababyan, K.; Khachatryan, A.; Fakriadis, I.; Makrigianni, E.; et al. Data from: Costs of Migratory Decisions: A Comparison across Eight White Stork Populations; Movebank Data Repository: Radolfzell, Germany, 2015. [Google Scholar]
- Flack, A.; Fiedler, W.; Blas, J.; Pokrovsky, I.; Kaatz, M.; Mitropolsky, M.; Aghababyan, K.; Fakriadis, I.; Makrigianni, E.; Jerzak, L.; et al. Costs of migratory decisions: A comparison across eight white stork populations. Sci. Adv. 2016, 2, e1500931. [Google Scholar] [CrossRef] [PubMed]
- Jenness, J.; Dooley, J.; Aguilar-Manjarrez, J. GIS-Based Tools for Inland Aquatic Resource Management; Africa Water Resource Database: Rome, Italy, 2007. [Google Scholar]
- Swets, D.L. A weighted least-squares approach to temporal smoothing of NDVI. In Proceedings of the 1999 Annual Conference of American Society for Photogrammetry and Remote Sensing, Portland, OR, USA, 17–21 May 1999. [Google Scholar]
- Bontemps, S.; Defourny, P.; Bogaert, E.V.; Arino, O.; Kalogirou, V.; Perez, J.R. GLOBCOVER 2009-Products Description and Validation Report; European Space Agency (ESA): Paris, France, 2011. [Google Scholar]
- Linard, C.; Gilbert, M.; Snow, R.W.; Noor, A.M.; Tatem, A.J. Population distribution, settlement patterns and accessibility across Africa in 2010. PLoS ONE 2012, 7, e31743. [Google Scholar] [CrossRef] [PubMed]
- Lehner, B.; Döll, P. Development and validation of a global database of lakes, reservoirs and wetlands. J. Hydrol. 2004, 296, 1–22. [Google Scholar] [CrossRef]
- Weinzierl, R.; Bohrer, G.; Kranstauber, B.; Fiedler, W.; Wikelski, M.; Flack, A. Wind estimation based on thermal soaring of birds. Ecology Evol. 2016, 6, 8706–8718. [Google Scholar] [CrossRef] [PubMed]
- Bohrer, G.; Brandes, D.; Mandel, J.T.; Bildstein, K.L.; Miller, T.A.; Lanzone, M.; Katzner, T.; Maisonneuve, C.; Tremblay, J.A. Estimating updraft velocity components over large spatial scales: Contrasting migration strategies of golden eagles and turkey vultures. Ecol. Lett. 2012, 15, 96–103. [Google Scholar] [CrossRef] [PubMed]
- Garriga, J.; Bartumeus, F. Generating the Results with the EMbC R-Package. Available online: http://journals.plos.org/plosone/article/file?id=info%3Adoi/10.1371/journal.pone.0151984.s002&type=supplementary (accessed on 30 April 2018).
- Grimm, V.; Berger, U.; DeAngelis, D.L.; Polhill, J.G.; Giske, J.; Railsback, S.F. The ODD protocol: A review and first update. Ecol. Model. 2010, 221, 2760–2768. [Google Scholar] [CrossRef]
- Van den Bossche, W.; Berthold, P.; Kaatz, M.; Nowak, E.; Querner, U. Eastern European White Stork Populations: Migration Studies and Elaboration of Conservation Measures; Bundesamt für Naturschutz (BfN)/German Federal Agency for Nature Conservation: Bonn, Germany, 2002. [Google Scholar]
- Garriga, J.; Palmer, J.R.B.; Oltra, A.; Bartumeus, F. Expectation-Maximization Binary Clustering for Behavioural Annotation. PLoS ONE 2016, 11, e0151984. [Google Scholar] [CrossRef] [PubMed] [Green Version]
- Miller, A.; Li, R. A geospatial approach for prioritizing wind farm development in Northeast Nebraska, USA. ISPRS Int. J. Geo-Inf. 2014, 3, 968–979. [Google Scholar] [CrossRef]
- Yang, Z. Using GIS to Determine Wind Energy Potential in Minnesota, USA; Department of Resource Analysis, Saint Mary’s University of Minnesota: Winona, MN, USA, 2013; Volume 15, pp. 1–13. [Google Scholar]
- Rodman, L.C.; Meentemeyer, R.K. A geographic analysis of wind turbine placement in Northern California. Energy Policy 2006, 34, 2137–2149. [Google Scholar] [CrossRef]
- Tegou, L.-I.; Polatidis, H.; Haralambopoulos, D.A. Environmental management framework for wind farm siting: Methodology and case study. J. Environ. Manag. 2010, 91, 2134–2147. [Google Scholar] [CrossRef] [PubMed]
- Riley, S.J. Index That Quantifies Topographic Heterogeneity. Intermt. J. Sci. 1999, 5, 23–27. [Google Scholar]
- Gerdzhikov, G.; Iliev, M.; Nikolov, S.C. Study on the White Stork (Ciconia ciconia) Autumn Migration, Northeastern Bulgaria. Acta Zool. Bulg. 2014, 66, 283–292. [Google Scholar]
- Guillera-Arroita, G. Modelling of species distributions, range dynamics and communities under imperfect detection: Advances, challenges and opportunities. Ecography 2017, 40, 281–295. [Google Scholar] [CrossRef]
- Chandler, R.B.; Muths, E.; Sigafus, B.H.; Schwalbe, C.R.; Jarchow, C.J.; Hossack, B.R. Spatial occupancy models for predicting metapopulation dynamics and viability following reintroduction. J. Appl. Ecol. 2015, 52, 1325–1333. [Google Scholar] [CrossRef]
- Safi, K.; Kranstauber, B.; Weinzierl, R.; Griffin, L.; Rees, E.C.; Cabot, D.; Cruz, S.; Proaño, C.; Takekawa, J.Y.; Newman, S.H.; et al. Flying with the wind: Scale dependency of speed and direction measurements in modelling wind support in avian flight. Mov. Ecol. 2013, 1, 4. [Google Scholar] [CrossRef] [PubMed]
- Janssen, V. GNSS-based animal tracking: An indirect approach. In Proceedings of the 18th Association of Public Authority Surveyors Conference, Canberra, Australia, 12–14 March 2013. [Google Scholar]
- Brown, D.G.; Riolo, R.; Robinson, D.T.; North, M.; Rand, W. Spatial process and data models: Toward integration of agent-based models and GIS. J. Geogr. Syst. 2005, 7, 25–47. [Google Scholar] [CrossRef]
- Darema, F. Dynamic Data Driven Applications Systems: New Capabilities for Application Simulations and Measurements; Springer: Berlin/Heidelberg, Germany, 2005; pp. 610–615. [Google Scholar]
- Tang, W.; Bennett, D.A. Agent-based Modeling of Animal Movement: A Review. Geogr. Compass 2010, 4, 682–700. [Google Scholar] [CrossRef]
- Kays, R.; Crofoot, M.C.; Jetz, W.; Wikelski, M. Terrestrial animal tracking as an eye on life and planet. Science 2015, 348, aaa2478. [Google Scholar] [CrossRef] [PubMed]
- Couclelis, H. Macrostructure and microbehavior in a metropolitan area. Environ. Plan. B Plan. Des. 1989, 16, 141–154. [Google Scholar] [CrossRef]
- Bonabeau, E. Agent-based modeling: Methods and techniques for simulating human systems. Proc. Natl. Acad. Sci. USA 2002, 99, 7280–7287. [Google Scholar] [CrossRef] [PubMed]
- Miller, T.A.; Brooks, R.P.; Lanzone, M.; Brandes, D.; Cooper, J.; O’Malley, K.; Maisonneuve, C.; Tremblay, J.; Duerr, A.; Katzner, T. Assessing Risk to Birds from Industrial Wind Energy Development via Paired Resource Selection Models. Conserv. Biol. 2014, 28, 745–755. [Google Scholar] [CrossRef] [PubMed]
- Ritter, M.; Pieralli, S.; Odening, M. Neighborhood effects in wind farm performance: A regression approach. Energies 2017, 10, 365. [Google Scholar] [CrossRef]
- De Lucas, M.; Ferrer, M.; Bechard, M.J.; Muñoz, A.R. Griffon vulture mortality at wind farms in southern Spain: Distribution of fatalities and active mitigation measures. Biol. Conserv. 2012, 147, 184–189. [Google Scholar] [CrossRef] [Green Version]
- Arnett, E.B.; Huso, M.M.; Schirmacher, M.R.; Hayes, J.P. Altering turbine speed reduces bat mortality at wind-energy facilities. Front. Ecol. Environ. 2011, 9, 209–214. [Google Scholar] [CrossRef]
Figure 1.
Study area depicting the 10 year (2006–2017) average wind speed, as estimated by the European Centre for Medium-Range Weather Forecasts (ECMWF) reanalysis data [44].
Figure 1.
Study area depicting the 10 year (2006–2017) average wind speed, as estimated by the European Centre for Medium-Range Weather Forecasts (ECMWF) reanalysis data [44].

Figure 2.
Conceptual framework of the geographic information systems (GIS)-derived wind energy potential surface and agent-based modeling of the white stork migratory flights. (A) A simplified framework for mapping the wind energy potential. Factors are combined using a multi-criteria evaluation method to create a representative wind energy potential surface. (B) A simplified flow diagram of the agent-based model of the white storks migratory flight behavior. We assume that the birds predominantly use soaring and navigation manoeuvers during flight. MCE—multi-criterial evaluation.

Figure 3.
Flight parameters of the simulated white stork: (a) box plots depicting the hourly variation in the flying altitude of the simulated birds; (b) probability density plot of the mean turn angles; (c) box plot of the gliding speed of the simulated birds; and (d) the density distribution of the updraft of the visited patches.

Figure 4.
Variation in the patch occupancy by model generations. (a) 1; (b) 10; (c) 20; (d) 30; (e) 40; and (f) 50 generations. The area of interest highlights the locations in the map where conspicuous patterns of high occupancy have emerged.
Figure 4.
Variation in the patch occupancy by model generations. (a) 1; (b) 10; (c) 20; (d) 30; (e) 40; and (f) 50 generations. The area of interest highlights the locations in the map where conspicuous patterns of high occupancy have emerged.

Figure 5.
Main outputs from multi-criteria evaluation and agent-based model. (A) Predicted spatial variability of wind energy potential from the classical multi-criteria evaluation. Areas shaded in the dark green shade are potentially highly suitable for wind energy installations, while the areas that are shaded in light yellow shade exhibit low suitability. (B) Emergent migratory pathways of white storks together with the observed trajectories. The most visited patches were those at the border point between Kenya and Tanzania in the Maasai Mara—Serengeti region and also around Lake Eyasi in Tanzania.

Figure 6.
Proportion of the patches from the wind energy potential surface in the predicted migratory corridor. Approximately 60% of the patches in the predicted corridor of the white stork migration had either a moderate or high potential for wind energy generation.
Figure 6.
Proportion of the patches from the wind energy potential surface in the predicted migratory corridor. Approximately 60% of the patches in the predicted corridor of the white stork migration had either a moderate or high potential for wind energy generation.

Figure 7.
Adjusted wind energy potential based on the influence of the migratory corridors of the white storks. Locations that are shaded in dark green represent areas that exhibit a high potential for wind energy development and are likely to pose the lowest risk to the migratory birds. Patches that are shaded in red and orange represent areas that are likely to frequently be visited by the migratory white storks.


Table 1.
List of data and associated data sources.
| Type | Data Variable | Data Source | Date |
|---|---|---|---|
| Observed trajectories | GPS trajectories of white storks | Movebank database [45] | 2013–2014 |
| Elevation | Consolidated digital elevation model (DEM) at 1 km resolution | Food and Agricultural Organization (FAO) Geonetwork [47] | 2007 |
| Vegetation index | Normalized Difference Vegetation Index (NDVI) | Moderate Resolution Image Spectroradiometer (MODIS) NDVI [48] | January 2014 |
| Land cover | Land cover classes | European Space Agency (ESA) GlobCover 2009 [49] | 2009 |
| Human population | Population Density | The AfriPop project [50] | 2010 |
| Weather characteristics | Wind speed | European Center for Medium-Range Weather Forecast (ECMWF) reanalysis data [44] | 2006–2017 |
| Wind direction | ECMWF reanalysis data | 2013–2014 | |
| Surface pressure | ECMWF reanalysis data | 2013–2014 | |
| Temperature | ECMWF reanalysis data | 2013–2014 | |
| Sensible heat flux | ECMWF reanalysis data | 2013–2014 | |
| Relative humidity | ECMWF reanalysis data | 2013–2014 | |
| Water bodies | Lakes | Global Lakes and Wetlands Database [51] | 2017 |
Table 2.
Wind energy potential suitability factors and related suitability score associated with each suitability factor.
Table 2.
Wind energy potential suitability factors and related suitability score associated with each suitability factor.
| Factors/Suitability Score | Highest (5) | High (4) | Medium (3) | Low (2) | Lowest (1) | Unsuitable (0) |
|---|---|---|---|---|---|---|
| Wind speed (m/s) | >8 | >7–8 | >6–7 | >5–6 | >3–5 | 0–3 |
| Slope (%) | 0–5 | >5–10 | >10–15 | >15–30 | >30–40 | >40 |
| Terrain Roughness Index | Level | Slightly rugged | Intermediately rugged | Moderately rugged | Highly rugged | Extremely rugged |
| Population density (people/km2) | 0–25 | >25–75 | >75–150 | >150–300 | >300–500 | >500 |
| Distance to major roads (km) | 0–1 | >1–2 | >2–5 | >5–10 | >10–20 | >20 |
| Distance to existing transmission lines (km) | 0–5 | >5–10 | >10–15 | >15–20 | >20–30 | >30 |
Table 3.
Suitability score for the land cover classes.
| Land Cover Class | Suitability Class | Suitability Score |
|---|---|---|
| Irrigated croplands | Lowest | 1 |
| Rain-fed croplands | High | 4 |
| Mosaic croplands/vegetation | High | 4 |
| Mosaic vegetation/croplands | High | 4 |
| Closed to open broadleaved evergreen or semi-deciduous forest | Medium | 3 |
| Closed broadleaved deciduous forest | Lowest | 1 |
| Open broadleaved deciduous forest | Low | 2 |
| Closed needle-leaved evergreen forest | Lowest | 1 |
| Open needle-leaved deciduous or evergreen forest | Low | 2 |
| Closed to open mixed broadleaved and needle-leaved forest | Low | 2 |
| Mosaic forest–shrubland/grassland | Medium | 3 |
| Mosaic grassland/forest–shrubland | Medium | 3 |
| Closed to open shrubland | Low | 2 |
| Closed to open grassland | Highest | 5 |
| Sparse vegetation | Highest | 5 |
| Closed to open broadleaved forest regularly flooded (fresh-brackish water) | Low | 2 |
| Closed broadleaved forest permanently flooded (saline-brackish water) | Low | 2 |
| Closed to open vegetation regularly flooded | Lowest | 1 |
| Artificial surfaces | Unsuitable | 0 |
| Bare areas | Highest | 5 |
| Water bodies | Unsuitable | 0 |
| Permanent snow and ice | Lowest | 1 |
| No data | Unsuitable | 0 |
Table 4.
Weights and associated relative influence of the factors contributing to the wind energy potential.
Table 4.
Weights and associated relative influence of the factors contributing to the wind energy potential.
| Layer | Assigned Weight | Relative Influence (%) |
|---|---|---|
| Wind speed (m/s) | 3 | 25 |
| Slope (%) | 1 | 9 |
| Terrain Roughness Index (TRI) | 1 | 8 |
| Population density (persons/km2) | 1 | 8 |
| Distance to roads (km) | 2 | 17 |
| Distance to existing transmission lines (km) | 2 | 17 |
| Land cover classes | 2 | 16 |
© 2018 by the authors. Licensee MDPI, Basel, Switzerland. This article is an open access article distributed under the terms and conditions of the Creative Commons Attribution (CC BY) license (http://creativecommons.org/licenses/by/4.0/).
Share and Cite
MDPI and ACS Style
Oloo, F.; Safi, K.; Aryal, J. Predicting Migratory Corridors of White Storks, Ciconia ciconia, to Enhance Sustainable Wind Energy Planning: A Data-Driven Agent-Based Model. Sustainability 2018, 10, 1470. https://doi.org/10.3390/su10051470
AMA Style
Oloo F, Safi K, Aryal J. Predicting Migratory Corridors of White Storks, Ciconia ciconia, to Enhance Sustainable Wind Energy Planning: A Data-Driven Agent-Based Model. Sustainability. 2018; 10(5):1470. https://doi.org/10.3390/su10051470
Chicago/Turabian StyleOloo, Francis, Kamran Safi, and Jagannath Aryal. 2018. "Predicting Migratory Corridors of White Storks, Ciconia ciconia, to Enhance Sustainable Wind Energy Planning: A Data-Driven Agent-Based Model" Sustainability 10, no. 5: 1470. https://doi.org/10.3390/su10051470
Note that from the first issue of 2016, this journal uses article numbers instead of page numbers. See further details here.