Article

Opportunities and Barriers for Water Co-Governance—A Critical Analysis of Seven Cases of Diffuse Water Pollution from Agriculture in Europe, Australia and North America

1
Department of Agroecology, Aarhus University, Blichers Alle 20, 8830-DK Tjele, Denmark
2
Centre for Climate and Safety, Faculty of Health, Science and Technology, Karlstad University, Karlstad 651 88, Sweden
3
Centre for Development, Environment and Policy, SOAS University of London, London WC1H 0XG, UK
4
SEGES, Landbrug & Fødevarer F.M.B.A., Agro Food Park 15, 8200 Aarhus N, Denmark
5
Geological Survey of Denmark and Greenland (GEUS), 1350 Copenhagen C, Denmark
6
Department of Infrastructure Engineering, the University of Melbourne, Parkville, Victoria 3010, Australia
7
Ecologic Institute, 10717 Berlin, Germany
8
Department of Water Management, Delft University of Technology, Stevinweg 1, 2628 CN Delft, The Netherlands
9
Department of Bioproducts and Biosystems Engineering, University of Minnesota, Falcon Heights, MN 55108, USA
10
International Plant Nutrition Institute, Stillwater, MN 55082, USA
11
Royal Haskoning DHV, P.O. Box 8064, NL-9702 KB Groningen, The Netherlands
12
Faculty of Spatial Sciences, Groningen University, Landleven 1, 9747 AD Groningen, The Netherlands
*
Author to whom correspondence should be addressed.
Sustainability 2018, 10(5), 1634; https://doi.org/10.3390/su10051634
Submission received: 9 April 2018 / Revised: 14 May 2018 / Accepted: 15 May 2018 / Published: 18 May 2018

Abstract

:
Diffuse Water Pollution from Agriculture (DWPA) and its governance has received increased attention as a policy concern across the globe. Mitigation of DWPA is a complex problem that requires a mix of policy instruments and a multi-agency, broad societal response. In this paper, opportunities and barriers for developing co-governance, defined as collaborative societal involvement in the functions of government, and its suitability for mitigation of DWPA are reviewed using seven case studies in Europe (Poland, Denmark, Sweden, The Netherlands and UK), Australia (Murray-Darling Basin) and North America (State of Minnesota). An analytical framework for assessing opportunities and barriers of co-governance was developed and applied in this review. Results indicated that five key issues constitute both opportunities and barriers, and include: (i) pressure for change; (ii) connected governance structures and allocation of resources and funding; (iii) leadership and establishment of partnerships through capacity building; (iv) use and co-production of knowledge; and (v) time commitment to develop water co-governance.

1. Introduction

Diffuse water pollution from agriculture (DWPA) can consist of nutrients from fertilizers and manure, sediment, pesticides, and salinity from irrigation return flows. It constitutes a threat to water quality and aquatic ecosystems in many farmed regions of the world [1,2,3,4,5,6,7]. Information regarding DWPA is incomplete and asymmetrical; the polluters often have more information than the regulators [8]. This makes mitigation a difficult challenge for public policy and governments, requiring complex, multi-faceted solutions [9,10].
Sources of DWPA can include agricultural fields and feedlots, rural domestic wastewater treatment systems, private gardens, wildlife, golf courses and other sport facilities. This makes DWPA more difficult to monitor and regulate than visible point sources, such as discharge from factories and large-scale urban wastewater treatment plants. Consequently, when adopted as a sole policy measure, the costs of regulation and its monitoring and enforcement will be high and likely prohibitive [11,12,13]. Diffuse Water Pollution from Agriculture is conventionally managed through a combination of policy instruments [10,14]. These can include command and control regulation, such as nationally set limits for applied nitrogen per hectare; voluntary adoption of best management practices resulting in environmental and farm management improvements; and market-based incentives such as fertilizer taxes, “cap-and-trade” schemes for nutrient or given agro-chemical use in a given area, and payments for ecosystem service (PES) compensation for production and income foregone [15].
None of these policies are likely to be sufficient and cost-effective if used alone. Advocates of command and control regulation argue that it can internalize the cost of pollution and provide a continuing incentive to improve agricultural practices in ways that minimize use of the polluting input. This has proven to be effective in reducing excess use of nutrients in farming in some regions and countries [16], but, when used in isolation, a “command and control” approach may not be a cost-effective and sustainable long-term solution to secure clean water [17], especially if such regulation is not accepted as reasonable and legitimate by stakeholders, and is thus met with social and political resistance and by poor levels of stakeholder compliance [18].
Voluntary adoption of best management practices encouraged by farm advisory systems can elucidate opportunities to protect the environment, whilst also saving on farm production and labour costs. Examples include soil testing and precision application of fertilizers, along with proper manure management. High rates of adoption may be difficult to achieve without a complementary “stick” provided by (a threat of) regulation, and, if change in practice is constrained by farm income or availability of capital for investment, a complementary “carrot” provided by subsidies and other forms of financial support may be necessary.
Information needs, costs, difficulty of monitoring, and attribution to a source, limit the scope to directly tax DWPA emissions. Taxes on the polluting inputs, such as fertilizer, have been employed, but effectiveness may be constrained by inelastic demand and trade competitiveness at feasible price levels. Such policy may also risk pollution swapping, and if applied uniformly at a national scale, may exhibit a poor match with local variation in ecosystem capacity to absorb pollution [10]. “Cap-and-trade” type schemes for inputs use or emissions have potential too, but are demanding of information and institutional development. Lastly, PES style compensation requires at least a complementary baseline of simple and enforceable regulation to distinguish between environmental standards that farmers are expected to meet at their own cost and higher standards for which society is willing to pay. Budget constraints will necessitate spatial targeting, whilst the challenge of monitoring necessitates high levels of voluntary compliance.
The complexities of this policy agenda, the diverse range of actors involved, and the need for budgetary efficiencies, spatial targeting, and voluntary compliance have implications for governance [19,20]. To improve the effectiveness of DWPA policy design and implementation, there is a need for improved knowledge on, first, which governance forms, structures, mechanisms and processes help tailor and deliver the right combination of regulation, incentives and voluntarism in a given location; and, second, how these governance forms, structures, mechanisms and processes can be developed given prevailing institutional opportunities and barriers.
Governance refers to how a society and its economy are managed, including its institutions, organizations and policies [21]. Besides such generic usage, “governance” has been understood in political science as a shift from government by solely state actors and institutions to multi-level and polycentric forms, involving private and civil society actors, along with distribution of responsibility and authority (e.g., [22,23,24,25]). This can result in collaborative governance or “co-governance”, which we define as direct societal involvement in the core functions of government [26]. Co-governance can be characterized as multi-level and polycentric, with tasks delegated to the most suitable scale given existing responsibilities, local specificities and the scale of the issues concerned [10,27]. Thus, co-governance refers to the transition from hierarchical governance and exercise of power by the state, to more dispersed and relational power, often exercised in layered networks of governmental actors and stakeholders that enter into collaborative relationships with each other. The role of government becomes one of process facilitation, rather than command and control.
The aim of this paper is to contribute to the understanding of alternative governance arrangements for management of DWPA. It presents new knowledge on the effectiveness of co-governance arrangements using an analysis of seven international case studies. It focuses on the identification of key enabling factors (opportunities) and constraining factors (barriers) for the development of effective co-governance arrangements for the mitigation of DWPA.
First, we present the method and cases. Then, we discuss in more detail co-governance for DWPA mitigation and develop a framework for analysing the case studies. Finally, we present the result of applying this framework to the seven cases, and draw several conclusions.

2. Materials and Methods—Case Studies on Water Co-Governance

In this study, a multiple case study design was applied [28], involving seven DWPA and co-governance arrangements (Table 1). Much of the literature on co-governance discusses single-case studies [29], but here a diverse set of case studies were selected to represent heterogeneity in the nature and severity of DWPA, the bio-physical, socio-economic and governance contexts, and governance approaches (see Appendix A for further description of the individual cases).
The seven cases were selected at an international workshop on water co-governance held in Copenhagen in 2016. The workshop (International workshop on Water co-governance—opportunities and barriers for effective decentralized decision-making in nonpoint source regulation of agriculture, held in Copenhagen, Denmark 28–29 November 2016) was initiated, co-organized and co-developed by the first author. At the workshop, 16 participants working with governance and DWPA theoretically and in practice were invited to present and share experiences regarding opportunities, barriers and outcomes from diverse co-governance frameworks (see Appendix E for a list of participants attending the workshop). The cases were selected by a case selection strategy based on having both most similar and typical cases on DWPA (DK, Sweden, NL and UK) and the most different and diverse cases on DWPA (USA, Australia, and Poland) [30]. By analysing both most similar and most different cases, the strategy was to be able to capture both the opportunities and barriers for improved water co-governance under different institutional arrangements. The aim of the workshop was to gather qualitative insights on opportunities and barriers for effective mitigation of DWPA. Researchers and practitioners were invited to present examples of how mitigation of DWPA was approached from a governance perspective. The workshop agenda progressed from empirical descriptive presentations of the seven case studies to the development of an analytical framework for comparative analysis (see Section 3 and Appendix B, Appendix C and Appendix D).
After the workshop, an electronic survey was prepared and distributed to the participating researchers to obtain further details about the cases. The case study experts scored each case for the key indicators that were developed as part of the analytical framework, using Likert-type scales [31]. This was supplemented by observational data and a narrative report of key processes and outcomes for each case study (see Appendix A for the narrative report summary and Appendix D for an overview of the survey structure).

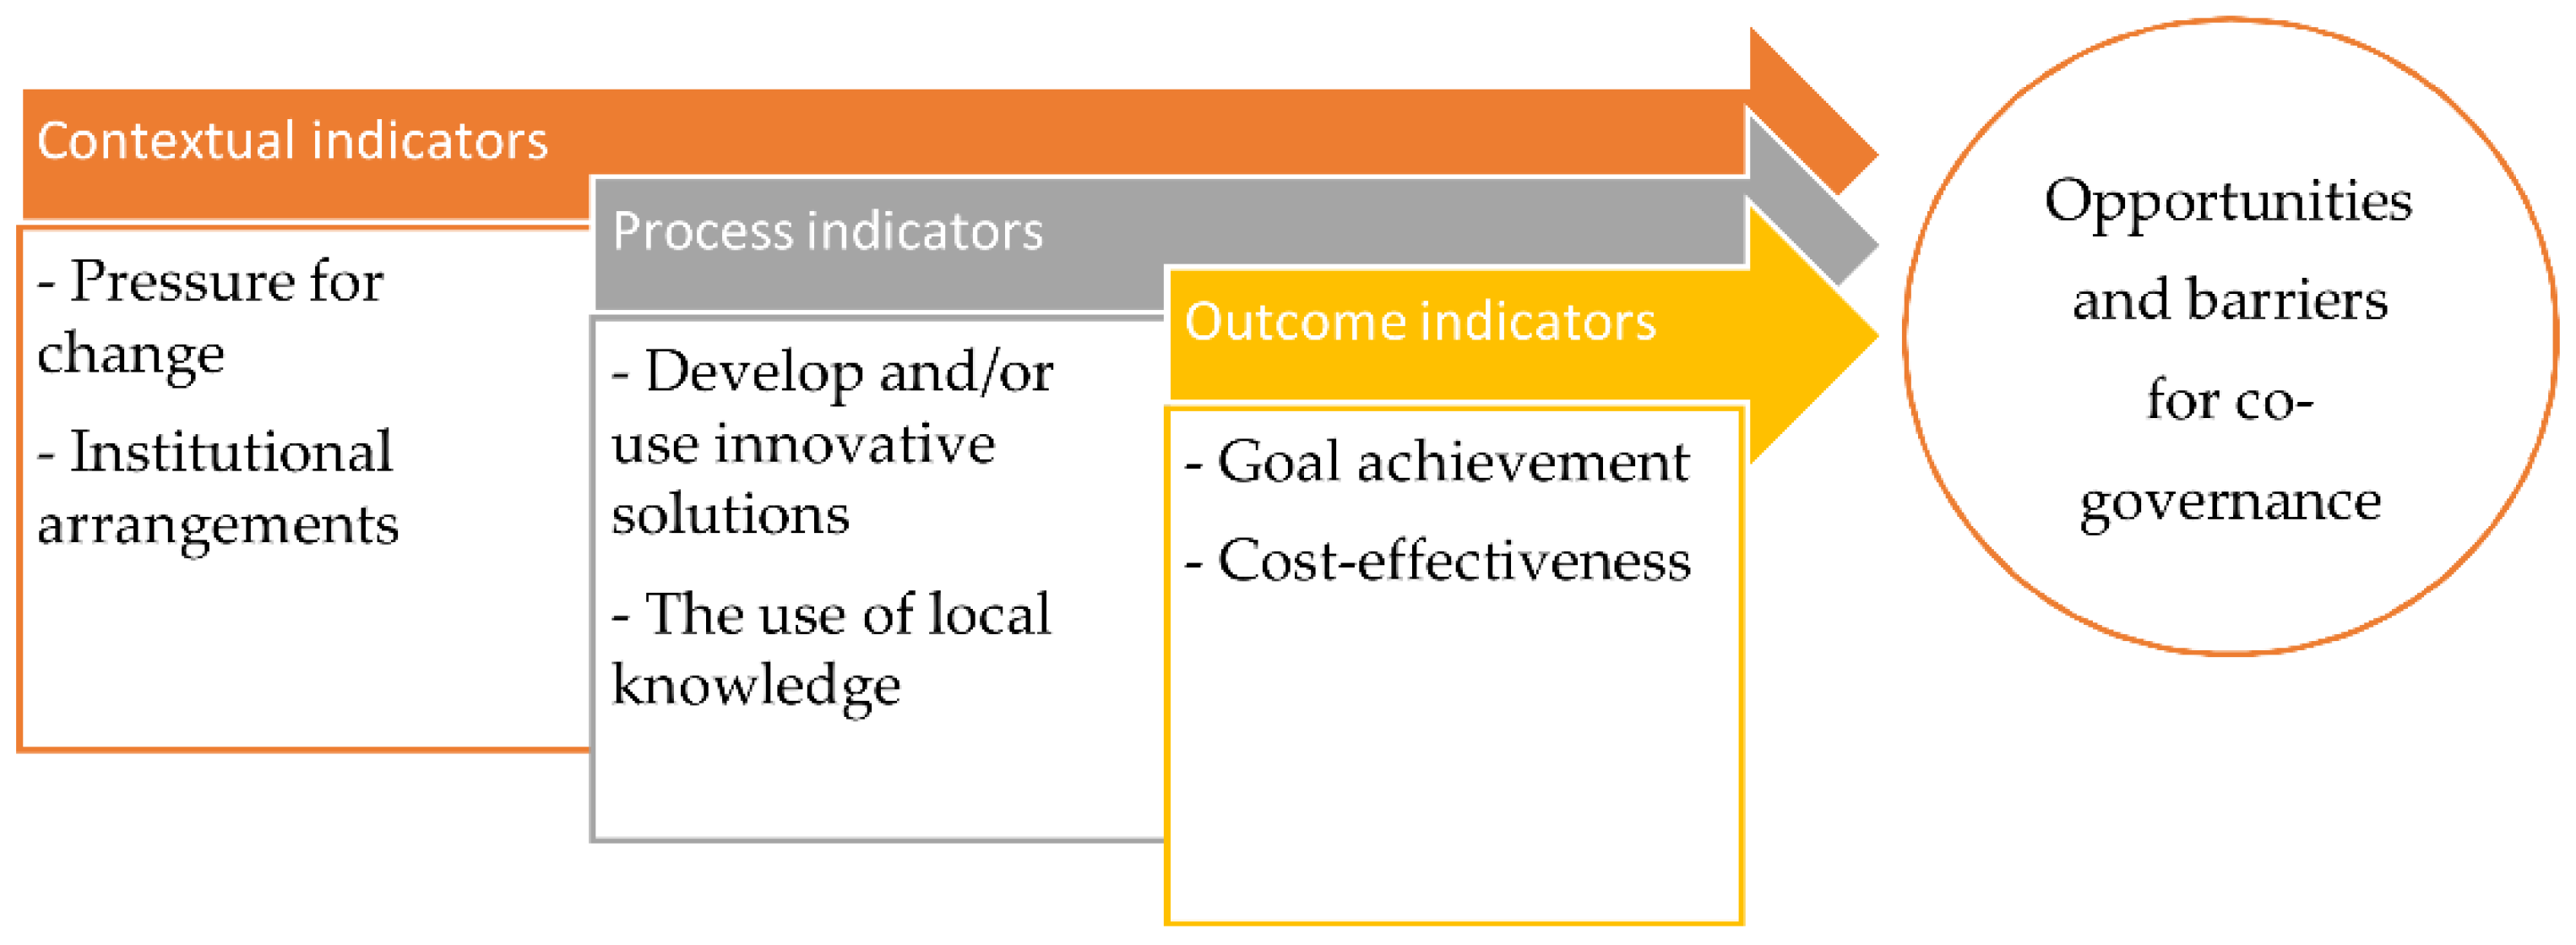
2.1. Analytical Framework

To identify opportunities and barriers for effective co-governance for mitigation of DWPA, an analytical framework was developed at the aforementioned workshop. This included the specification of indicators of effective co-governance. The use of such indicators can help to simplify and describe the case and communicate the findings in a detailed and structured way [32].
The analysis framework developed consists of six indicators: two contextual indicators ((i) pressure for change; and (ii) institutional arrangements (the degree of delegation of decision making by task)); two process indicators (iii) the ability to develop and/or use innovative solutions; and (iv) the use of local knowledge); and two outcome indicators (v) goal achievement; and (vi) cost-effectiveness) (Figure 1). This framework focuses on the nature and performance of co-governance currently observable in each case study. It is acknowledged that it does not itself address wider contextual factors including socio-economic and socio-political facilitators or constraints, although key issues are identified as concisely as possible in Appendix A.

2.2. Pressure for Change

The pressure for change indicator expresses the degree to which DWPA is recognized as a societal and political concern and a cause of environmental, social and economic costs. In studies completed in regions where farmers do not believe that agriculture contributes to water pollution, there is a low level of perceived pressure for change amongst the polluters, which may contribute to low uptake of DWPA mitigation measures [33]. In other examples, wider non-agricultural stakeholders put DWPA on the political agenda, resulting in an increased pressure for change from those experiencing the impacts of pollution (e.g., [34]).
A low level of pressure is unlikely to result in more than incremental change to existing regulation, policies and procedures, whilst a greater pressure for change is likely to result in widespread media coverage and increased societal awareness. This can prompt a political response, including emergency and longer-term measures.
Pressure for change is ranked from low, moderate, major to severe (see Appendix C). It is hypothesized that there may be a relationship between the level of pressure for change and the degree to which co-governance has developed in each case.

2.3. Institutional Arrangements

For this indicator or rather group of indicators, institutional arrangements are analysed in terms of the allocation of decision-making tasks relevant to DWPA mitigation; i.e., “who is responsible for which tasks”. The tasks are expressed in terms of steps in the policy cycle (policy formation, policy implementation and policy evaluation), and the allocation is expressed in terms of scale: local, regional or central (see Appendix B). The aim is to explore how responsibilities for DWPA mitigation are shared or not shared between actors and levels of government, whether delegation occurs at the level most suitable to account for existing responsibilities and local specificities, and to be most effective for decision making for the issues concerned.

2.4. Process Indicators

Many indicators of successful co-governance processes have been identified in the literature and are sometimes also described as intermediary outcomes [35]. Process outcomes do not relate to a direct change in mitigation of DWPA at the point of time at which they are evaluated but can be essential to attain the expected outcome achievements [36]. The two process indicators chosen for this study can help describe how co-governance has been developed and what the cases are doing to address the DWPA problem. The two process indicators are the following:
(1)
The ability to develop and/or use innovative solutions in mitigating DWPA. In other words, how effectively do the stakeholders collaborate in developing and adopting solutions?
(2)
The use of local knowledge. This refers to: (a) the capacity for knowledge sharing, i.e., openness/accessibility of public sector data (including that of municipalities and water companies); and (b) the effectiveness of using data and knowledge (combining the use of public sector knowledge/data and local/private knowledge/data).
These indicators were ranked on a scale from none, weak, moderate, good to excellent (see Appendix C).

2.5. Outcome Indicators

The ultimate aims of DWPA mitigation are ecological and economic improvement. For these, many indicators can be found [35]. In this study, effectiveness is defined in terms of achieving two outcomes:
(1)
Goal achievement is assessed as the ability of governance arrangements to significantly contribute to achieve statutory local or national goals for DWPA mitigation and ecological improvement [35].
(2)
Cost-effectiveness is assessed as: (a) the ability of case governance arrangements to ensure that desired outcomes are being delivered affordably with the use of available resources; and (b) the ability of case governance arrangements to deliver desired outcomes at the lowest cost [35].
These indicators were ranked on a scale from none, weak, moderate, good to excellent (see Appendix C).

2.6. Opportunities and Barriers for Water Co-Governance

Based on the analysis of the contextual, process and outcome indicators, key issues are identified in the different cases that create either opportunities or barriers for co-governance for DWPA mitigation. Further data to inform this are drawn from the workshop presentations, workshop discussion and narrative template completed by case experts (see Appendix A, Appendix B, Appendix C, Appendix D and Appendix E).

3. Results

3.1. Pressure for Change

For the European cases, the assessment of pressure for change ranges from low to major. In the USA case, the ranking is moderate, and for the Australian case severe (see Table 2).
These assessments are made at the catchment/case study scale and relate to the perceived pressure for change from stakeholders. For example, in the Polish case based on the Kocinka catchment, there is a low level of pressure for change from farmers and rural communities. The area is rural and relatively economically underdeveloped, and, although farming is a significant source of water pollution, it is not highly intensive so there is little recognition amongst the farming community of the need for change. However, pressure for change, at national level and amongst stakeholders in government, is much higher (Appendix A.5), given the need to transpose and implement relevant EU directives and international concern regarding Poland’s contribution to nutrient pollution of the Baltic Sea.
In the Swedish case, pressure for change was low when the Tullstorp stream association was initiated in 2009, as the national response to DWPA. The EU Water Framework Directive (WFD) was at early stage of development, but local stakeholders were motivated to prepare for the introduction of new legislation, suggesting a moderate pressure for change from farmers and the rural community.
In the Danish and Dutch cases, the pressure for change in each locality was assessed as moderate, but the pressure for change at the national level was major. This is because mitigation of DWPA is a high profile, politicized and controversial issue within both Danish and Dutch society, given the trade-offs between the profitability of intensive agriculture and better water quality. In the 1980s, severe pressure for change was put on policy-makers to deal with DWPA in Denmark, which initiated a range of action plans, that were almost all implemented with a top-down approach [16].
The UK case concerns the national level rather than a local catchment situation, and the pressure for change has been assessed as “major”. The launch of the Catchment-Based Approach (CaBA) by government was part of the response to widespread pressures for improved implementation of the WFD, which led to environmental NGOs threatening to use a judicial review (Appendix A.4). At a local level, stakeholders including farmers recognized an impending threat of stricter and more vigorously enforced water protection regulation, but also an opportunity for more integrated land and water management strategies.
In the USA case, also larger in scale (the state of Minnesota), a co-governance framework for water quality was developed because of pressure in the form of stricter federal government requirements (USEPA), which were triggered by eutrophication problems in the Mississippi River contributing to the Gulf of Mexico hypoxic zone [37]. A critical factor was also the approval by state voters of an increase in sales tax for investment in cleaner water and other environmental improvements.
The Australian case is also large scale. In the Murray-Darling Basin, salinity can render water unusable for drinking and reduce agricultural yields and thereby farmer income. (Australia is an ancient dry continent and salt has accumulated in the landscape over millennia. While having economic benefits, the massive increase in irrigation started mobilizing the salt and river salinity started increasing. By the early 1980s, salinity levels at Morgan in South Australia exceeded 800 EC units (500 mg/L) for 18 months on end. In time, salinity levels have reached peaks of 1400 EC units, threatening the future of drinking water and irrigated horticulture. Ideally, drinking water should have less than 800 EC (WHO aesthetic limit), and horticultural crops are impacted above 500 EC. The Salinity and Drainage Strategy set a target to reduce the salinity levels at Morgan below a 90% percentile of 800 EC units for a benchmark climatic period). The fact that salinity was affecting the profitability of farms played a vital role that helped initiate co-governance. The upstream states of New South Wales and Victoria wish to manage water tables and discharge saline drainage water, but the downstream state of South Australia cannot tolerate high salinity levels. These pressures for change were therefore assessed as severe.

3.2. Institutional Arrangements

In all of the European cases, with exception to the Swedish study, the central government has the task and statutory responsibility of choosing goals and setting targets for mitigating DWPA (see Table 3). In Sweden, the goals related to the implementation of the WFD and are chosen at the regional level.
In the USA case, the tasks of choosing goals and setting targets are shared between the central level and local government. To meet Federal requirements, the Minnesota Pollution Control Agency (MPCA) must complete Total Maximum Daily Loads (TMDLs) for impaired State waters. Impairment goals are set based on these TMDL reports, but the methods for prioritizing and addressing the impairments are defined by each county’s Soil and Water Conservation agency, a Local Government Unit. Although the initial goals are set by the State in the form of Total Maximum Daily Loads, the local government establishes what the specific, more local goals will be and then they are shared with the MPCA, at the State level.
In the Australian case, choosing goals and setting the target for salinity management is a shared responsibility of the central and local level. The goals, targets and strategic framework of the Salinity and Drainage Strategy were developed by the then Murray-Darling Basin Commission (MDBC), replaced by the Murray-Darling Authority, in 2007. The MDBC was established as an unincorporated joint venture bringing together officials from three States and the Federal Government; however, the MDBC consulted with affected communities in developing the targets. In this way, the regional Salinity Action Plans (SAP) were developed by communities (bottom up) to achieve the target. The development of the Basin wide strategy was achieved by an effective partnership between the Federal and State governments (central level). The regional communities supported the strategy and developed their own partnerships with local stakeholders [38].
For tasks beyond setting of goals and targets (listed as (c)–(j) in Table 3), there is more diversity in the allocation of responsibility across the cases. The cases from Sweden, the Netherlands, the UK, Poland and Australia tend to exhibit a greater degree of decentralisation for tasks related to action planning and implementation.

3.2.1. Development and Use of Innovative Solutions and Use of Local Knowledge and Data

The Australian and USA cases stand out as scoring highest for the process and outcome indicators (see Table 4). The Netherlands and UK cases also exhibit some success by this measure.
An important part of the success in the Australian case has been locally developed innovative solutions, involving mapping and surveying regional soil salinity levels, in addition to re-allocating irrigation water away from the more saline soils (two highest soil salinity categories). This approach required a huge shift in community thinking, but because the decision was made by the local community, it was implemented. All data were shared across the area affected by the Basin Salinity and Drainage Strategy. Community groups preparing the plans had access to a high level of advice and knowledge from experts in the government agencies and access to all the available data. At the same time, the strategy and framework for the development of the SAP required co-production using both local knowledge of the local community group developing the SAP, and the scientific knowledge of State experts (e.g., hydrogeological), informed by the strategic framework provided by the Basin Salinity and Drainage Strategy.
In the Minnesota case, knowledge sharing and co-production of knowledge are continuing to improve with the process that has been deployed through the water quality framework. The One Watershed, One Plan (1W1P) (see Appendix A.6) approach has enhanced the local commitment to addressing the problem. There is an understanding that there is not an easy fix when it comes to water quality improvement. Rather, there are multi-faceted barriers that require everyone to collaborate and work together to address the problem holistically.
In the Dutch case, the leading example of innovation and use of local knowledge is that mitigation measures are identified and implemented together with the farmers at the farm level, based on the so-called Annual Nutrient Cycle Assessment (ANCA), with data from the farm. In the UK, Catchment Partnerships created under the CaBA are demonstrating success in stakeholder engagement, partnership working, leverage of multiple funding sources and used of shared data and decision support tools for local level planning [39].
The rankings for the Danish local case are moderate overall. Here, the preparation of action plans and the selection of measures are decided at the central government level and implementation has to follow national guidelines. New policies are typically implemented at national level without prior pilot projects. Altogether, the conditions for introducing innovative solutions are not good. The local catchment council has been excellent in implementing drainage solutions and wetlands by themselves; however, there is no coordination with official authorities.

3.2.2. Goal Achievement and Cost-Effectiveness

The development of the regional SAP in the Australian case has been successful in that the salinity target was reached in 2010 through the introduction of salinity debits and credits, water trading rules and salinity levies. At present, salinity levels are continuing to decline in the river basin. The formation of a river basin authority and the development of a single salinity strategy for the southern MDB allowed all the salt mitigation measures to be ranked according to cost-effectiveness (salt removed from the river/$). The strategy thereby assured that the most cost-effective options were selected and implemented. If the four States involved (Victoria, New South Wales, South Australia and Queensland) had made SAPs individually, higher cost solutions would have been selected because each State would have only been capable of investing within its own borders.
In the USA case, there is moderate evidence that the 1W1P process adopted in Minnesota will lead to well-coordinated implementation. All local and State agencies join together to inform the process, but ultimately the implementation plan is driven by the priorities of local stakeholders to refine the previously identified catchment-based strategies into an actionable path forward. The success can be explained by the programs for federal and State implementation funding being utilized by Local Government Units (LGUs) and landowners at the catchment scale. This suggests that the local implementation has been a defining factor for the Minnesota program. A key goal in this case has been to engage more people in the science available and the issues at hand, which can be seen by more programs currently being initiated to improve public outreach.
The Swedish case is an example of a bottom-up process initiated and driven by the landowners themselves. The goals were set by the landowners and are in some ways far from co-governance in that no authorities are directly involved in the project, as opposed to the USA and Australian cases. However, in the Swedish case, the landowners have achieved their own goal for implementation of measures and have restored 10 km of the stream and created 35 wetlands in the catchment.
In the Danish case, the top-down centralized regulation has been successful in goal achievement and ensured that farmers in Denmark have reduced nitrate leaching from the root zone by almost 50% between 1987 and 2007, through command and control measures [16]. However, additional reductions of 30–50% will be required to meet the WFD objectives of good ecological status. It has been suggested that to achieve these environmental objectives, agri-environmental measures should be spatially targeted to fields where nature is less effective at removing or retaining nitrogen [40,41].
The Dutch case shows evidence of both a decrease in the nitrate concentration of groundwater and an improvement in the economic performance of farms. The nitrate concentration decreased from approximately 90 to 75 mg NO3/L in the period 2011 to 2015, and the economic result of the implemented measures increased approximately €97 per hectare. This shows that outcomes can be delivered at a lower cost than by alternative means, and that the combination of top-down and bottom-up structures in the Netherlands makes goal achievement feasible and cost effective at the farm level. The success was achieved by setting clear targets at the farm level in combination with use of the farm management tool ANCA for monitoring. However, due to the voluntary nature of the project, only 20% of the farmers in the agricultural area participated. Hence, the achievement of regional goals at the scale of the recharge area has been limited, and at the national level, objectives for complying with the WFD objectives have not yet been met.
In the UK, the pilot and evaluation phase of the CaBA was concluded in March 2013. Over time, it is expected that the CaBA approach will mature as a mechanism for ensuring that there is strong local support, consensus, effective coordination, and efficient channelling of existing finances, new funding, and additional resources to deliver local aspirations for the water environment. The CaBA partnerships drive cost-effective practical delivery on the ground, resulting in multiple benefits, including improvements to water quality, enhanced biodiversity, reduced flood risk, resilience to climate change, and greater community engagement with the local river.
A contrasting case to the northwestern EU, Australian and USA cases is the Polish case. Poland has been successful in terms of achieving goals related to improving the water quality status of particular water bodies and has made progress in terms of harmonizing existing water legislation and its water governance structure with EU requirements. However, Poland’s performance in engaging local stakeholders has largely fallen short of the objectives set in the WFD, consistent with the results summarized with the Kocinka case.
Although there is some diversity, the rankings in Table 2, Table 3 and Table 4 tend to suggest that the European cases, which all operate under EU Directives related to DWPA (the WFD and the Nitrate Directive), are less developed in terms of their co-governance processes and outcomes for mitigation of DWPA than the Australian and USA cases. In the next section, key issues for these differences are discussed.

4. Discussion

The case study results suggest that the contextual, process and outcomes indicators for co-governance of DWPA mitigation are positively related. The two cases that score highest on the contextual indicators, the USA and Australian cases, also score highest on the process and outcome indicators. In this section, we discuss the opportunities and barriers for effective co-governance.

4.1. Pressure for Change

Pressure for change to mitigate DWPA can come from citizen’s expectations concerning water quality; from government in response to either citizen expectations or demands from higher-level government; and from farmers if DWPA harms their crops or to avert strict government regulation. If high enough, any pressure for change is an opportunity for effective co-governance, as shown in the USA and Australian cases. What may explain the shift in governance in the Australian case in comparison to the European cases, is that the pressure for change was severe and came from both political enforcement and societal concerns (see Table 2). The severe salinity issue in the MDB has been a major factor in achieving joint action and community support. A clear community understanding of the threat created political capital for reform, allowing governments and community groups to make some tough decisions. The fact that rising salinity directly impacted the profitability of the farms was also a key factor in persuading farmers and their communities to accept difficult decisions. Mitigation of DWPA can be difficult because the costs are individual and often upstream, while the benefits are often collective and downstream. Salinity has more immediate consequences for crops and drinking water supply than, for example, nitrate pollution, which can make mobilization of stakeholders, resources and change to mitigate salinity less difficult than it may be to mitigate nitrate pollution.
When the stakes are high and clear, as in the Australian case, this can create an opportunity for action and allocation of resources. This may be contrasted with the Polish case concerning nitrates, where pressure for change was lower due to lack of information and resources.
Pressure for change may also be primarily “top-down” and from government, as in the Swedish, Danish, Dutch and UK cases. Nutrient pollution can be very damaging to water quality, but not necessarily an issue for farmers unless national or international (EU) regulation limits the use of fertilizers and manures. Political and societal concerns may play a role as well, either as an opportunity or an obstacle.
For example, in the Dutch case, parliament decided that WFD-implementation should not lead to additional costs for the agricultural sector (Parliamentary Papers 2002, 27 625 Water Policy, Amendment Van der Vlies No. 92). This implies that in specific vulnerable areas, where the existing general rules on the use of manure and pesticides are insufficient, the WFD objectives may not be reached [42]. Meanwhile, the agricultural sector and especially younger farmers, have taken initiatives to introduce more sustainable farming practices on a voluntary basis.
The situation in the Danish case is similar. The newest N-reduction target for Norsminde by 2016 is about 70%. Studies have shown that such reductions can only be achieved by taking 50% of the agricultural land out of production [43]. The present Danish Minister of Environment and Food has stated that even a 10% reduction of agricultural area will not happen during his term, showing the difficulties for change when there is low pressure.

4.2. Connected Governance Structures and Allocation of Resources and Funding

A second key opportunity found in this study is the need for establishing connected governance structures (multi-level governance) in the institutional arrangements of mitigating DWPA. Many water systems are rather large (e.g., the Murray-Darling Basin) and may require a coordinated approach to maximize effectiveness and manage conflicts.
In the Australian and USA cases, we see that this issue is addressed by creating multi-level governance partnerships.
In the Australian case, many of the decision-making processes are shared between the central (river basin authority), regional (State governments) and local level (community groups). The community groups were formed by the State governments to develop the SAP. Since the Murray River flows through three States, the central level had to be involved as well. The Salinity and Drainage Strategy provides an example of balancing top down governance establishing targets and directing investment with bottom up governance reflecting the practicalities of addressing local problems.
In the USA case, the 1W1P vision had the purpose to align local water planning with State strategies. Although the initial goals are set by the State (i.e., meeting a specific water quality goal) the local government establishes what the specific more “local” goals will be and then they are shared at the State level. This kind of framework is trying to provide more ownership at the local catchment so that there is more collaboration and communication between all parties at the local scale as they work to meet the State goals. This results in a connected governance structures and decentralization of responsibility down to the most effective scale.
The main finding of the Australian, USA and UK cases is that targets and goals can be set at the central level if this is done in coordination with the local actors that are responsible for local implementation.
An explanation why water co-governance has not been so developed in the other European countries is that the institutional arrangements in many of the European countries are top-down and centralized (see Table 3). The Dutch case shows that if the co-governance initiative is purely voluntary and no central authority is part of the process, there is a low rate of participation and a risk of free riding behaviour (Appendix A.3). In the case study area WFD targets (50 mg NO3/L) were translated into targets for each participating farmer, to be realized by improving agricultural management. Plans are set-up and agreed on with the individual farmers. However, because of the voluntary character of the project, the plans have no formal status and there are no sanctions if they are not implemented.
In addition, the Danish and Swedish cases show that purely farmer driven, bottom up initiatives are not enough in themselves (Appendix A.1 and Appendix A.2). There will be a lack of integration in the formal regulatory framework, and central or regional goal setting is necessary for the creation of legitimacy and continuity in developing solutions for mitigating DWPA. Co-governance is by definition a process of interaction in which either the State “invites” stakeholders to participate in its core activities [26] or the stakeholders mobilize the State to engage in joint solutions of DWPA problems. Therefore, if there are no joint action and connected governance structures initiated either by the government or by stakeholders, no genuine or effective water co-governance is likely to develop.
Another key finding, related to the need for connected governance structures, is that hydrological boundaries, e.g., the watershed, and administrative boundaries often do not coincide. It is then important that the collaboration across administrative boundaries takes place. In the Australian case, for instance, implementation of cost-effective measures was made possible because the involved authorities cooperated across administrative borders. In the first stage, the most cost-effective salt mitigation schemes were in South Australia, which resulted in Victoria and New South Wales investing their funds in South Australia.
Another key finding from the Australian and USA cases is that delegation of authority to lower level actors requires allocation of funding and freedom to spend the funds according to locally chosen priorities. Resources and funding are essential to coordinate and host meetings, prepare reports and supporting documentation and implement communication and outreach efforts.
In the Australian case, the salinity issue required fundamental reforms. The River Murray Commission, which had been established in 1915 to manage water flows in the Murray River, had no role in water quality and its powers did not extend beyond the main river. In 1987, the Murray-Darling Basin Commission was created and the MDB Ministerial Council formed, which was assigned the key decision-making role. The first task of this new Commission was to develop the Salinity and Drainage Strategy. The strategy was successful and based on a combination of centrally driven governance and community consultation supported by local Salinity Action Plans, which were developed from the ground up by community groups empowered by regional (State) governments.

4.3. Establishment of Partnerships and Strong Leadership

The Australian, USA, UK and in part the Netherlands cases indicate that a key enabling factor for effective water co-governance is creating an institutional and administrative framework within which stakeholders with different interests can discuss and agree to cooperate and coordinate their actions. Therefore, partnerships are important and may function where other governing structures do not [21,29].
These cases support the findings from the literature that co-governance happens when affected stakeholders are engaged in an equal partnership and the stakeholders share their perspectives on the development and implementation of policies [44,45]. This implies that decision-making powers are shared with stakeholders affected by the policy (polycentric governance) [46].
The Polish case provides a contrasting example for the importance of partnership. Poland is characterized by a weak civil society with low levels of trust [47,48]. Low levels of trust are indicative of an unwillingness to participate and collaborate. The lack of a participatory culture in Poland is a major barrier to realizing water co-governance. A key lesson from the Polish case is that, due to lack of trust, there is a lack of support for delegating power from the central level to local level government and stakeholders. This can be explained with narrow perceptions of defining participatory approaches by the national government, revealing a reluctance towards devolving power to local levels of government.
In the Swedish case, the project manager was active in starting the project and provided the necessary leadership, perhaps because governmental did not. By having another person facilitate the process, the manager had the time and resources to search for additional funding and deal with administrative issues. Landowners would probably have been overwhelmed by these tasks if done alone. Trust in the “leader” is essential for establishing good relationship, but because the project manager was a farmer. All the landowners had trust in this person and in the first stage they all signed the agreement sending a positive signal to other landowners. Another important lesson from the Swedish case is that to establish partnerships, meetings also have to serve as a social get-together with the chance of exchanging information and knowledge. The question is whether the lessons from the Swedish case also apply elsewhere in Sweden and can be used to achieve national goals and integrate national regulatory frameworks.
One of the main reasons why there is currently no co-governance in the Polish Kocinka catchment is the missing need for action, along with the lack of ownership and leadership for starting such an initiative. In the USA case, a key issue was that a successful program requires clear communication regarding roles and expectations.
An important lesson from the Dutch case was that individual support and coaching by agricultural advisors was a major factor for implementation and participation in the project. This coaching was carried out by senior experts interested in the farmer and his management and providing advice based on farm specific conditions and practical experience of an experimental farm (De Marke) in the Netherlands. Without this support and coaching, the willingness of farmers to change and participate would have been substantially lower, reducing the chance of meeting the standards.

4.4. Innovative Solutions Through the Use and Co-Production of Knowledge

The co-governance structure in the Australian and USA cases has led to positive environmental outcomes by deploying new innovative solutions for water co-governance. For example, in the Australian case, the Nyah to the South Australian border SAP, contained a system of trading rules and levies to direct irrigation water away from high salinity impact zones to low impact zones. Additionally, stakeholders mapped the soil salinity levels in the Tragowell Plains SAP, which included a large data collection exercise by the local community and resulted in irrigation water being transferred away from the two most salinized soil categories. Both innovations were developed by the local community and required effective interchange of knowledge between the State and Local SAP, effectively co-producing scientific (e.g., hydrogeological) and local knowledge of the community group developing the SAP [49].
Data sharing and co-production of knowledge have been identified as important process indicators for development and success of co-governance. In the Australian case, data were shared across the area affected by salinity. At the same time, the local SAP required knowledge co-production combining local knowledge and experience with the scientific knowledge of State experts, informed by the strategic framework of the Basin Salinity & Drainage Strategy.
Similarly, in Minnesota, community input through a public participation process helped to incorporate local knowledge into the strategies. The first round of 1W1P pilot projects were launched in 2014 with the intent to build on existing catchment efforts, using local plans together with state and local knowledge, implementing a systematic and science-based approach to catchment management.
In the Swedish case, data are locally collected and shared openly, even though this knowledge sharing takes place only at the local level. Scientific actors and their expert knowledge are not involved in choosing the measures or integration of this knowledge at the catchment level or with other water councils. This is again related to the question of available funding and lack of multi-level coordination. The landowners are open to see improvements in environmental conditions if this does not hamper their business model in the absence of a coherent top-down framework of regulation and funding mechanisms.
Rogers and Hall [21] showed in the analysis of principles for better governance that a collaborative process should be open and transparent. This requires that decision making is transparent so that both insiders and outsiders can follow the necessary steps.
In the Dutch case, measures are identified and implemented together with the farmers at the farm level, based on the ANCA with farm scale data. Farmers are using the ANCA data to improve management for optimizing nutrient use efficiency. This is in contrast to the Polish case, where knowledge sharing is limited to the information and data that are relevant to achieving policy deliverables. Knowledge is collected at the local level and shared with higher levels of government, with central government determining what knowledge is relevant. At present, there is a limited opportunity for co-production of knowledge as collaboration and public engagement are largely absent.

4.5. Developing Co-Governance Takes Time

An additional and clear observation that emerges from the more successful case studies is that the development of effective co-governance is an evolutionary process that requires time. The USA case shows that finger-pointing to fix DWPA problems does not work. Rather, these problems are multi-faceted and require everyone to collaborate and work together to address the problem holistically. There are no easy fixes and it takes time. In the USA case, time and patience were essential to the development of the partnerships in order to create a catchment-based management plan. Taking time at the beginning to coordinate and ensure clear and consistent communication may smooth the process later. Including stakeholders with a range of expertise, backgrounds, and perspectives into the partnership and valuing their input resulted in more trust, which should lead to more acceptance and better implementation of the resulting strategy.
In the Australian case, time for institutional development was also shown to be essential. It took a long time to reach a consensus over difficult issues in the MDB.
In the Dutch case, considerable time was needed to build trust, create awareness, and show (with monitoring results and farm data) what role the farmers have in the DWPA and how the measures implemented help in reducing the nitrate concentration.

5. Conclusions

Co-governance is not an end in itself, but a means to an end. In the context of this paper, its value is its potential to enhance both better social outcomes and better water quality by better implementation of DWPA policies [50]. Evidence for improvement can be difficult to find, given monitoring challenges and time lags. The seven cases applied in this study, have shown that actual environmental improvements can be achieved under co-governance arrangements. Moreover, this paper shows that five opportunities and barriers for water co-governance may exist and that experiences may be shared across catchments, regions and nations.
In our study of the seven cases on water co-governance in a DWPA context, we have identified a number of opportunities and barriers for co-governance:
  • pressure for change;
  • connected governance structures and allocation of resources and funding;
  • establishment of partnerships and strong leadership through capacity building;
  • use and co-production of knowledge; and
  • developing co-governance takes time.
First, when dealing with a challenging problem such as DWPA mitigation, a high level of pressure for change (e.g., Australian case) can be an opportunity for co-governance development and a low level an obstacle (e.g., Polish case). However, social and political factors may play a role as well. This is shown in the Danish case, where societal pressure has pushed for reforms and regulation of the agricultural sector, which through the last 30 years have reduced the nitrogen leaching by 50%.
Second, effective co-governance requires institutional arrangements in the form of multi-level governance structures that connect and coordinate top-down policy frameworks and funding mechanisms with bottom-up planning and implementation, the latter being essential for knowledge co-production, innovation and supporting voluntarism. The current provisions of the EU WFD directive could prompt and support such institutional arrangements because the WFD directive is a “framework” directive. It sets ambitious goals but there is flexibility for member states on how these are achieved. In turn, member states can delegate that responsibility to a local level.
Third, establishment of partnerships and strong leadership through capacity building and knowledge sharing is essential for the development and support of connected governance structures. Member states need to invest in the capacity building necessary for the co-governance necessary to plan and manage change. The needs for horizontal integration and coordination are also important and could be further researched. This can facilitate planning alignment and complementarities in resource use and interventions. Relevant observation and literature also notes the importance of “bridging” or “boundary” organisations (e.g., [51]).
Last, we have shown in our analysis that developing effective co-governance frameworks for mitigating DWPA takes considerable time to deliver upon intended objectives. At the same, it is important that stakeholders are involved early in the policy phases to create trust and commitment. It is also important that there is continuity in policy, political support for institutional arrangements and funding mechanisms.
By focusing on a qualitative analysis of five opportunities and barriers in different contexts, we have identified new and transferable knowledge from our cases that expands the current knowledge of what makes multi-level co-governance work.
The five opportunities and obstacles are by no means exhaustive, but if they were addressed comprehensively and consistently they offer real promise of sustainable environmental outcomes in the world’s important water systems.

Author Contributions

M.G., F.G., A.L.H. and J.C.R. designed the study and arranged the workshop; M.G., B.H., L.S., F.G., A.L.H., J.L., G.M., E.M., E.P., H.P., N.S., C.v.d.V., and J.C.R participated in the workshop and performed the research; M.G., B.H., L.S., C.V. and J.C.R. analysed the data; all authors reviewed and discussed the results; and M.G. took the lead and wrote the paper.

Acknowledgments

Thanks are due to all the participants attending the international workshop on co-governance held in Copenhagen in 2016. The study was funded by the DNMARK strategic research alliance, supported by the Danish Council for Strategic Research (Ref. 12-132421), and co-funded by BONUS SOILS2SEA, TRENDS, MACSUR, the INTERREG projects TOPSOIL and Water CO-Governance, and the HORIZON 2020 project FAIRWAY.

Conflicts of Interest

The authors declare no conflict of interest. The founding sponsors had no role in the design of the study; in the collection, analyses, or interpretation of data; in the writing of the manuscript, and in the decision to publish the results.

Appendix A. Case Study Profiles—Narrative Summary

Appendix A.1. Case Study Profile for Norsminde Catchment, Denmark—Nitrate Responses to Centralization and Hierarchical Governance

Appendix A.1.1. Context

The Norsminde Fjord catchment (101 km2) constitutes one of the 90 Danish catchments subject to nitrate reduction targets from a given coastal land area. Eighty-two per cent of the land use is agricultural land in rotation. According to the second generation of the Water Framework Directive (WFD) River Basin Management Plan (RBMP) (2015–2021), the Nitrogen (N) load to Norsminde Fjord is 132 T N/year, of which 86% originates from agriculture. The reduction target in the present RBMP is 37 T N/year, while a reduction of an additional 33 T N/year has been postponed to the third RBMP (2021–2027) [52].
This situation reflects one of the key problems Denmark is facing with respect to WFD implementation and goal achievement. Although Denmark has reduced nitrate leaching from the root zone by almost 50% between 1987 and 2007 [16], additional reductions of 30–50% will be required to meet the WFD objectives of good ecological status, even when climate change impacts are not considered. Mitigation is possible, however it will require measures both on agricultural fields and outside [41]. Under the current institutional arrangements and policy framework, reductions in nutrient inputs of this magnitude would have such serious impacts that agricultural operations in many regions would or may have to change.
It has been suggested that agri-environmental measures should be spatially targeted to fields where nature provides least removal/retention of N. This can potentially achieve 5–10% additional nitrate reduction through optimal spatial location of for example catch crops, constructed mini-wetlands, etc. To exploit the full potential of spatially targeted measures, nitrate retention maps with a fine spatial resolution (1–25 ha) are necessary. However, the level of uncertainty associated with maps at this resolution is too high for use in government top-down regulation.
Hence, the government have used retention maps with typically >100 km2 resolution in areas where restrictions have been imposed. These maps have a lower level of uncertainty, but they also cancel out almost all economic and environmental gains of a spatially differentiated approach. Under a co-governance regime it should potentially be possible to exploit the information in fine scale retention maps and harvest part of the 5–10% extra reduction potential for optimal use of fields. The full potential of 5–10% can, however, not be reached due to uncertainty. In addition, it would become possible to exploit new drainpipe measures such as constructed wetlands, bioreactors and saturated buffer zones that potentially can reduce N even more.

Appendix A.1.2. Pressure for Change

The pressure level for this case is moderate to major. Nitrogen mitigation is a very political and controversial issue of major significance for the economy in the Danish agricultural sector, which is why the pressure for changes is major. However, at the same time, there is a moderate level of pressure for change because of the voluntariness of demands for implementation of measures.

Problem to be Addressed

How can the N reduction targets be achieved in a manner that allow profitable agriculture to continue?

Appendix A.1.3. Present Governance System

The present governance system is centralised with the central government and Ministry for Food and Environment, and related agencies making all decisions regarding use of agri-environmental measures, including norms for fertilizer use, at farm level.
In Denmark, the preparation of action plans and the selection of Programs of Measures (PoM) are decided at central government level, and the implementation has to follow national guidelines. At the same time, DWPA mitigation measures have been uniformly located irrespective of the local retention capacity, implying that it has not been very cost-effective. This is because new policies in Denmark typically are implemented at national level without prior pilot project experiments. This makes the local authorities and local stakeholders very dependent on the central government agencies’ catalogue of measures. To monitor and control implementation, the government requires farmers to report detailed fertilizer and field plans for cropping systems and fertilizer use. Government monitoring focuses on relatively large catchments to evaluate if the reduction targets to the coastal waters are achieved. Farmers fulfilling the central government requirements receive subsidies from the EU CAP and Rural Development Program.

Appendix A.1.4. Main Activities

In 2012, a catchment council of the Norsminde Fjord catchment was established. The catchment council is a voluntary local cooperative forum for stakeholders, farmers and authorities working together to contribute to achieving good environmental status in the fjord. There are currently 18–20 members of the catchment council. Besides this council, regional water councils operate on river basin scale, which will in the future deliver the co-governance arrangements.
The Danish case is a good example of a bottom-up initiative driven by local landowners, with the local catchment council, that has been very active in collaborating with research projects and in engaging farmers in discussions of N mitigation measures and governance. However, as the catchment council has no formal role in implementing DWPA measure, no Danish authorities are directly involved.

Appendix A.1.5. Stakeholder Resources

Danish farmers have a long tradition for cooperation among themselves and with authorities and researchers. Farmers are tired of the existing centralised governance regime and have expressed a desire to be empowered to make local decisions based on local data to collectively meet the nitrate reduction targets as long as it makes farming possible in the future [53]. However, farmers also question the new spatially differentiated approach, and have concerns on the effectiveness and implementation possibilities of this new approach.
Besides the catchment council, there has been a short period with the experiment of introducing water councils at river basin district scale to solve stream issues in 2014 and again in 2017, in the whole of Denmark. Evidence from this water council process documents that there is an opportunity for more water co-governance in Denmark and that many local stakeholders are keenly interested in being actively involved in the decision-making process and implementation, despite the mandate of the temporary water councils being quite limited [54,55,56]. The central government, however, has hesitations to whether a co-governance structure would work in practice and the central authorities may not have sufficient capacity to deal with this very different type of governance.

Appendix A.2. Case Study Profile for the Tullstorp Stream, Sweden—Governance and Strong Leadership

Appendix A.2.1. Context

Before the introduction of the WFD [57], Swedish water policy has traditionally been shaped by the central state as the regulatory authority, with the municipalities being the main actors for planning. The regional level has played a relatively minor, and mainly controlling, role [58]. Therefore, it is the 290 local municipalities that have had prime responsibility for long-term water and land use planning [59]. Despite the dominance of municipal-level planning, some limited management activities did occur at the scale of waterways and catchments. For example, several Swedish municipalities formed voluntary joint water quality management associations at the catchment scale, although their activities were mainly limited to monitoring [60]. The introduction of the WFD has brought large changes to Swedish water governance: introducing the river basin as a geographical unit, establishing a new and parallel administrative system to the existing one, shifting from local to regional and super-regional planning scales and shifting the model for legitimization from local representative democracy to decision-making by experts complemented by stakeholder involvement [59,61].
The Tullstorp stream case is located in southern Sweden and the main objective of the project is to reduce the outflow of nutrients to the Baltic Sea. The Tullstorp stream is 30 km with a catchment area of 63 km2. Eighty-five per cent of the land is used for agricultural purposes. The project “aims to capture N and phosphorus from farmland, thus preventing it from reaching the sea, whilst reducing the need for maintenance and helping to address flooding problems and stream restoration” [62].

Appendix A.2.2. Pressure for Change

For the Tullstorp Stream project example, there was no urgent need for being active. Thus, the pressure for change was moderate to low. One of the reasons the association was formed was to be more prepared once new laws, frameworks, etc. (similar to WFD) are adopted. The activity was very much driven by private initiative of a major landowner.

Appendix A.2.3. Problem to be Addressed

In Sweden as a whole, water resources are not scarce compared to many other countries. There is, generally, enough water for drinking, industrial/agricultural use, recreational purposes and for nature’s needs. In different parts of the large country, however, there are different problems. For example, in southern Sweden, where much land is occupied by agriculture, there are problems with eutrophication. In other parts, acidification is a problem, and hydropower production clearly affects the ecosystems of the regulated rivers. During the latest years, water scarcity has occurred in some places, mainly in southern Sweden.
In the Tullstorp Stream case, the status of the stream is according to the WFD classified as moderate and the river transports approximately 250 tons of N and 4 tons of phosphorous every year to the Baltic Sea [63]. In addition to the nutrients input from agriculture, private landowners not connected to the municipality sewage treatment can serve as an additional source of nutrients. In the area of Tullstorp Stream, ca. 200 out of 600 house properties in the catchment area are not connected to sewage treatment. One additional point of concern for the landowners was the uncertainty as to how legislation (especially WFD) would affect farmers in the future [63].

Appendix A.2.4. Present Governance System

Implementation of the WFD has brought far-reaching change for water resource governance in Sweden. A new administration for river basin management was built up, in parallel with the old and still existing system, with relevant institutional structures formed accordingly [61]. Five super-regional River Basin District (RBDs) were established, and in each RBD a regional Water Authority (Vattenmyndighet) is assigned as the competent authority. The Water Authority role is taken on by one of the regional county administrative boards (länsstyrelse) in the RBD, which is responsible for co-ordinating water management between the counties in the RBD [64].
Within each RBD, formal decision-making is mandated to a drafting committee (beredningssekretariat) comprised of experts appointed by the national government [61]. With the strong emphasis on RBDs and regional counties, national co-ordination became rather weak; consequently, a new national co-ordinating authority was set up in 2011 RBD. Local municipalities remain responsible for implementation. However, they also still have their own parallel and overlapping mandate in relation to physical planning, as well as their own decision-making system which is based on local representative democracy. This situation makes the over-all system for water management in Sweden highly complex (overlapping administrative scales, mandates and different modes of decision-making).
The Tullstorp stream project started in 2007 and, in 2009, local farmers and landowner founded the Tullstorp Stream Economic Association (TSEA), which is now responsible for the project. Formal decisions are taken by the board of representatives and a project manager is in charge of all administrative burdens. For the landowner, it is voluntary to participate. The association developed a process, where landowners are asked to participate and sign an agreement, giving the association the right to carry out activities connected to the restoration and future management on their land. The landowner still owns the land and can use it according to the agreement and receives financial compensation. For the first part of the restoration project, a stretch of the river was selected and all 45 landowners signed the agreement [65].

Appendix A.2.5. Main Activities

In the Tullstorp case, 35 wetlands with 105 hectares have been constructed and 10 km river has been restored between 2009 and 2016 [65]. Following measures were undertaken:
  • Creating wetlands;
  • Re-meandering of Tullstorp stream;
  • Creating flooding areas/ buffer zones;
  • Levelling the river banks; and
  • Tree planting.

Appendix A.2.6. Stakeholder Resources

The WFD has triggered the introduction of various mechanisms for public and stakeholder participation in Sweden, to complement the WFD induced top-down expert based decision-making mode. While Law 2004:660, which transposes the WFD into Swedish legislation, does not specify the role of public participation, there are three entry-points for active involvement.
First, the main instrument for participation is a system of water councils at the sub-basin level [61]. There are about 100 water councils in Sweden. These can be created in a bottom-up manner by municipalities or water associations RBD [64], and they receive a small financial support from the WFD administration. The water councils function as sounding boards at every step of the planning processes, with the aim of incorporating local knowledge, and commenting on official proposals or preparing and presenting their own proposals RBD [64]. Second, representatives from the business sector and environmental groups can be appointed as experts to the Water Boards at the RBD scale [60]. Third, water boards and water councils are complemented by open consultations and reference groups at the national and regional levels. Reference groups comprise stakeholders such as farmers’ associations, forestry, NGOs and water companies, and provide a platform for information exchange and discussion of policies.
Due to the change of perspective on the framing of the water problem many stakeholders are critical of the WFD. They believe that the environmental objectives (good ecological status) represent a nature preservationist perspective, and that the WFD work does not engage with the political side of water governance—making value trade-offs and democratic setting of priorities.
For the Tullstorp stream case, stakeholder engagement is a key element of the case study. Many of the landowners took part in the planning from the very beginning and so made sure that their wishes were met.

Appendix A.3. Case Study Profile for the Province of Overijssel, The Netherlands—The Mutual Gains Approach in Recharge Areas of Vulnerable Drinking Water Abstractions

Appendix A.3.1. Context

Groundwater in the Netherlands is a major resource for drinking water. In the province of Overijssel, it is the only source for drinking water. As such, it must be carefully monitored and managed. Evaluation for the EU WFD showed that protection of this valuable resource needs improvement. The Drinking Water Protection File identifies necessary measures needed per water abstraction site. The Protection File is part of the Dutch national WFD implementation strategy, intended to improve the protection level of groundwater resources. It consists of a national top-down framework and a regional bottom-up process, which, respectively, enforces commitment and enhances stakeholder awareness regarding risks and actions needed regarding the identification and implementation of measures enhancing the protection level of groundwater resources RBD [66]. One of the measures to be implemented is focused on reduction of the nitrate leaching towards groundwater in the recharge areas of vulnerable abstraction sites in Overijssel.
The groundwater hydrology in the Province of Overijssel is controlled by unconsolidated Quaternary sediments (e.g., [67]). The groundwater abstractions are located in regions with sandy unconfined aquifers of Pleistocene origin. Often, clay layers occur within the Pleistocene sand layers, dividing the system in two or more aquifers. Consequently, the regional geohydrological situation is heterogeneous, resulting in a wide range of travel times of groundwater flowing towards the abstraction wells. Infiltration of rainfall is by far the major contributor for the recharge in these sandy areas, with typical recharge figures of around 300 mm/year.
Since 2011, the province of Overijssel and water company Vitens together with Wageningen University, Countus, Stimuland and Royal HaskoningDHV support dairy farmers to improve their mineral management in the recharge areas of five vulnerable drinking water abstractions. This mutual gain approach resulted in both a decrease in the nitrate concentration of the shallow phreatic groundwater and an increase of the economic result of the farm. The nitrate concentration decreased from approximately 90 to 75 mg NO3/L in the period 2011–2015 and the economic result of the implemented measures was approximately €97 per hectare. The approach therefore was supported by the farmers, their representatives and the boards of the province and water company. However, the WFD objectives are not yet met: neither for the farms that joined the project, nor in the remaining approximately 70% of the agricultural area in the recharge areas considered.
To meet the WFD objectives, the scope of the project is widened. Major farms with a total area up to 50% of the agricultural area in the recharge areas were identified and invited to the project. The current participating farmers were helped to become more autonomous in identifying and implementing measures. At the same time, the role of these farmers changed from participant to ambassador and agricultural consultant towards potential new participants. Finally, the need to change the current agricultural practice was communicated to agricultural contractors and fertilizer and feed advisors. In addition, the approach has become a special-groundwater part of a province wide approach to improve agricultural practice.
If initiatives are supported by regional policy, the approach and efforts of the farmers to adjust their management to meet the WFD objectives seem effective. There are no ready to use concepts for upscaling the initiatives to a level of participation that corresponds to 50% of the total agricultural area or more. From the preliminary results, it can be concluded that rolling out the approach of supporting each individual farmer is not possible—because the measure is on voluntary base and some farmers decline the invitation to join the project—and hardly feasible because of organizational and financial reasons. Newly developed approaches could be anchored by agricultural contractors. Therefore, there is a need to relate the approach to regional developments and institutional context. Meeting the WFD objectives in vulnerable areas is therefore only possible when there is a general or regional improvement of the mineral management as a basis with the possibility of additional support in the most vulnerable areas.

Appendix A.3.2. Problem to be Addressed

How can the reduction targets be achieved in a manner that allow profitable agriculture to continue? Moreover, how can this be accomplished on a voluntary basis and without paying the farmers for implementing measures?

Appendix A.3.3. Present Governance System

The present governance system is centralised with the central government and ministry for Food and Environment, and related agencies making all decisions regarding use of agri-environmental measures, including norms for fertilizer use, at farm and field level. To monitor and control implementation, the government requires farmers to report detailed fertilizer and field plans for cropping systems and fertilizer use. Government monitoring focuses on relatively large groundwater bodies on the one hand and the quality of abstracted water at drinking water production sites at the other hand.
The political choice in the Netherlands that WFD implementation should not lead to additional costs for the agricultural sector (Parliamentary Papers 2002, 27 625 Water Policy, Amendment Van der Vlies No. 92) implies that, in some vulnerable areas, the existing general rules on the use of manure and pesticides are insufficient to meet the WFD objectives [42]. At the same time, environmental policy has become embedded in the social and economic processes of parties other than governmental organizations, such as businesses, NGOs, and citizens [68]. Consequently, many spatial planning processes in the Netherlands are now organized as bottom-up processes in which the stakeholders negotiate with each other in a network structure instead of top-down processes with the government as the dominant party (e.g., [69,70,71]). The solution of environmental problems is no longer seen as the exclusive responsibility of government; rather, quasi-governmental organizations, the business community, civic organizations, and citizens are demanding a greater voice in resource planning [68]. Therefore, the pilot is based on voluntarism and mutual gain.

Appendix A.3.4. Main Activities

After setting-up of the Drinking Water Protection Files in 2009 and Programme of Measures in 2010, the pilot project as one of the measures started in 2011. The main activities were local recruitment sessions to invite farmers, kitchen table meetings with interested farmers to get insight in their agricultural management and to identify and implement measures, group meetings, field excursions and the set-up of a groundwater monitoring network. Last year (2016), effort was put into increasing the autonomy of the existing group of 18 farmers and in recruitment of new farmers. Currently, 32 farmers participate with an agricultural area of approximately 30% of the total agricultural area within the recharge area of the abstraction sites.

Appendix A.3.5. Stakeholder Resources

Dutch farmers have a long tradition of cooperation among themselves and with authorities and researchers. Farmers are tired of the existing centralised governance regime. On the other hand, they are afraid of “Brussels” in a sense that high nitrate concentrations in groundwater may lead to loss of the derogation, which will have a strong financial impact. Due to policy changes over the last period, farmers consider the government as unreliable. Therefore, we address them as agricultural entrepreneurs and ask them to consider our offer as a business deal keeping in mind that participation is on a voluntary basis. Meanwhile, the farmers are enthusiastic over the project and they accept a role as ambassador show their farms, participate in meetings with other farmers, exchange experiences and ways of working, etc. However, the farmers do not feel responsible for recruiting new farmers to extend the participating agricultural area to meet the WFD standards at the scale of the recharge area.

Appendix A.3.6. Pressure for Change

The pressure level for this case is major. Nitrogen mitigation is a very political and controversial issue of major significance for economy in the Dutch agricultural sector.

Appendix A.4. Case Study Profile for the Catchment Based Approach in UK—Governance and Decentralized Decisions Making

Appendix A.4.1. Context

The origins of the Catchment Based Approach (CaBA) in England lie in the limitations, limited pubic participation, data inaccuracies and relatively top down approach of the first cycle of river basin management planning for implementation of the EU WFD. Lessons from research into more decentralized and participatory approaches, lobbying by environmental NGOs and a threatened application for a judicial review of the inadequacies of government plans, led by 2011 to recognition by government that more locally focused decision making and action should become central to future improvements to the water environment and in support of river basin management planning as part of Water Framework Directive activities.
In early 2011, after talks with the Department for Environment Food and Rural Affairs (Defra) and the Environment Agency (EA), WWF-UK and the Angling Trust withdrew their application for judicial review of the government’s implementation of the WFD, particularly in relation to River Basin Management Plans (RBMPs). The main commitments secured included: £110 million of new investment in environmental water quality through a new “catchment restoration fund”; a shift to more localised, catchment-based implementation of the directive, starting with 10 pilot catchments; investment in identifying the reasons for the decline of freshwater ecosystems; more vigorous enforcement of existing regulation, in particular regarding diffuse pollution; and a commitment to introducing stronger future regulation if necessary.
The government’s policy framework for CaBA recognized that the water environment is affected by all activity on land as well as by abstracting, using and returning water to rivers, the sea and the ground; that catchments are the natural scale to consider this aspect of the environment, and that better coordinated action is desirable at the catchment level by all those who use water or influence land management; that this requires greater engagement and delivery by stakeholders at the catchment as well as local level, supported by the Environment Agency and other organisations. Finally, that these approaches are necessary when trying to address the significant pressures placed on the water environment by diffuse pollution from both agricultural and urban sources, and widespread, historical alterations to the natural form of channels [72].
The aim of the pilot catchments (expanded from 10 to 25) was to test the longer-term viability of the approach through developing a clear understanding of the issues in the catchment, involvement of local communities in decision-making by sharing evidence and prioritizing actions. In addition, the pilots looked for opportunities to better co-ordinate and integrate projects to address local issues in a more cost-effective way. The pilots were also important in starting to test and assess different ways of working, learning initial lessons around engagement, collaboration and catchment planning first hand [72].
Since 2013, CaBA has evolved from 25 pilot catchments to national coverage by 102 Catchment Partnerships (CPs). As a trial of stakeholder participation and partnership working, the programme stands out in its scope, timescales and remit. The government aims to support delivery of the EU Water Framework Directive but CPs generally choose to address an integrated land, water, environment and local economy agenda. CaBA is testing multi-level and polycentric co-governance, including the benefits of public participation, localism, and shared learning. Evidence of success is growing as illustrated below.

Appendix A.4.2. Problem to be Addressed

WFD delivery/implementation, including Article 14. More generally a better water environment.

Appendix A.4.3. Present Governance System

River basin planning is the technical process for developing River Basin Management Plans. The Environment Agency (who is responsible for producing these plans) is the designated competent agency and will act as the link between river basin planning and the Catchment Based Approach. The CaBA is however also supplemented within a suite of statutory and voluntary actions, including advice, incentives, regulatory activity and other mechanisms to support the CaBA measures required [72].

Appendix A.4.4. Main Activities

Each of the 102 partnerships has developed individually but with similarities: 85 have a steering group, 94 have developed a shared vision for their catchment, and 98 have a Catchment Action Plan. Nationally, over 36,000 people have been involved: each partnership has typically directly engaged between 60 and 200 individuals, and 20 different organisations across a range of sectors. Water companies and landowners are highly engaged groups, but fewer CPs have successfully engaged with Local Authorities and Local Enterprise Partnerships, although numbers are growing.
To 2017, at least 1100 different activities have been reported across the partnerships with river habitat restoration the most common, followed by engagement, rural diffuse pollution and evidence investigation. A total in excess of £212 million has been invested, through collaborative working, in activities to improve the health of rivers and their catchments. Government has directly invested, through CP hosting costs, delivery funds, and other Environment Agency catchment partnership-specific funding schemes, while funds leveraged by CPs from non-governmental sources total over £109 million (non-Government funding sources include water companies, EU funds, waste companies and landfill taxes, and lottery funds) [39].
“For every £1 directly invested by Government, the partnerships have raised £8.63 from nongovernmental funders. River and riparian restoration has been undertaken by 82% of partnerships, enhancing many kilometres of river. Although a number of partnerships are predominantly urban, 52% of partnerships have undertaken farmer engagement, providing advice to benefit both the farm business and the environment. Partnerships have implemented more than 200 projects to open up rivers and streams to migratory fish and eel. 77% of partnerships have engaged with their local community, providing a range of volunteer opportunities and training in citizen science techniques including biological sampling and water quality monitoring” [39].

Appendix A.5. Case Study Profile for the Kocinka Catchment, Poland—Governance and the Need for Institutional Reforms

Appendix A.5.1. Context

The water management sector of Poland is currently in the process of organizational and structural reform. Driving the reform is the external pressure from the European Union for Poland to comply with water policy. At present, Poland risks financial penalization due to improper and insufficient transposition of the Water Framework Directive (WFD) [57] and Nitrates Directive (ND). In 2013, Poland was referred to the EU Court of Justice due to shortcomings in domestic transposition, including the absence of Annexes and gaps in monitoring of water status. In the same year, Poland was also referred to the Court for failing to address water pollution stemming from nitrates by designating an insufficient amount of Nitrate Vulnerable Zones (NVZs), along with the lack of effective measures. The ND has proven to be problematic as demonstrated by the fact that every Member State has experienced difficulties in fulfilling their respective implementation duties. The point of departure of the case study is to examine the potential of co-governance to address non-point source pollution control in Poland.
Poland dedicates approximately half of its total land area to agricultural activities. A significant portion is dedicated to livestock production, which produces a high amount of nitrate pollution. As a Baltic state, 98% of its surface waters drain to the Baltic Sea. Further, Poland makes up half of the total population of the Baltic Sea Basin. Based on these conditions, Poland constitutes the state with the greatest influence on the ecological status of the Baltic Sea. Indeed, monitoring data demonstrate that Poland contributes the most nitrate runoff. There is external pressure from the EU to improve water management through greater Directive compliance performance. Therefore, the state faces considerable pressure to reduce nitrate pollution stemming from agricultural sources to improve quality status of both fresh and marine waters.
Poland has made recent amendments to its Water Law to meet formal EU transposition requirements. Despite attempts of structural reform, further measures are necessary to deliver upon the principles of Integrated Water Resource Management (IWRM), which the WFD is built upon. An integral aspect is stakeholder participation in realizing IWRM. The case study will evaluate the opportunities and barriers to realizing water co-governance in Poland. The assessment is based on a review of the existing water management system and includes the following components to evaluate overall governance capacity to realizing co-governance: (i) the existing institutional structure and arrangements (ii) administrative culture; (iii) social capital and the capacity of civil society; and (iv) perceptions towards public participation.
The Polish Case Study is the Kocinka catchment. It is located in the south of Poland in the Oder River Basin. The catchment is mostly agricultural with pine forests dominating in the lower reach. The Kocinka region is considered fairly representative of Poland with regard to soil types, land use and agricultural practices. Crops are generally rain-fed and do not require irrigation, although areas with light soil may be irrigated during dry spells, and raising the retention capacity of the soil in these areas is considered highly desirable. The number of part-time farms in the Kocinka region is high at 2000 supplementing their farm income through off-farm work, in comparison to 3255 full-time farmers. In the areas surrounding Kocinka—in Lubliniec County in particular—the main crops are rye, wheat, oats, barley and potatoes, and animal husbandry, where present, focuses on pig farming. The use of pesticides and mineral fertilizers is often limited by financial constraints, and the level of mechanization is low. In addition, the Kocinka River is popular for trout fishery. Agricultural land constitutes 71% of the entire Kocinka catchment with 4656 farms cultivating 13,780,645 ha. The Kocinka catchment is not considered a Nitrate Vulnerable Zone, but it is regarded as eutrophic, or at a high risk of eutrophication, with high surface water levels in nitrate and phosphorus especially due to agricultural use of fertilizer.

Appendix A.5.2. Problem to be Addressed

Member States, such as Poland, face considerable constraints in terms of managing nitrate pollution stemming from agricultural sources. There is also greater responsibility and pressure on the state to do more to achieve nitrate reduction targets [73]. Confronting the national context of Poland highlights the challenge of achieving higher water quality standards for Europe. Despite a confluence of constraining factors, is there potential for co-governance in the Polish case?

Polish Case

At this time, even though there is a major or severe level of external pressure for change at the national level, other factors in the Polish case make water co-governance challenging, and, in the future, this may also influence the pressure level for change on a more local level.
The water management sector of Poland is currently in the process of organizational and structural reform. The reform is driven by external pressure from the EU to improve water management through greater Directive compliance performance. Therefore, Poland faces considerable pressure to reduce DWPA to improve quality status of both fresh and marine waters. In this context, the opportunities for co-governance to address DWPA in Poland could prove useful.
Considering the various pressures on the Polish State in terms of harmonizing domestic legislation with EU obligations, participatory approaches are not a priority of the State. The requirement of the inclusion of public participation in water management is interpreted and applied in a narrow manner, with minimal measures being applied. Public participation is interpreted as a consultation process, where knowledge transfer is a one-way transaction, consisting of water experts and officials informing the public of its activities.

Appendix A.5.3. Present Governance System

Water management in Poland is largely governed from top-down, with the central government being the key actor in the decision-making process. The current structure consists of a two-tiered centralized system headed by the Ministry of the Environment and the National Water Management Authority (NWMA). The NWMA oversees the seven Regional Water Management Boards, which govern ten water basins in Poland. The structure was institutionalized based on the Water Law of 2001 under the provision of disseminating water management from the national to the regional level. National plans are prepared by the President of NWMA and regional plans are prepared by the respective Directors of the RWMBs. The specifications set forth in the regional plans are to be carried out by municipal authorities. There are current plans to further reform the structure and system of water management to meet compliance measures with EU legislative requirements and to enhance implementation performance of the Polish state as previously stated above.

Appendix A.5.4. Main Activities

At present, Poland has made amendments to its Water Law to meet formal EU transposition requirements. The Water Law was introduced in 2001 and constitutes the main legal framework for water policy. The 2017 structural reforms include the restructuring of public institutions responsible for the management of water resources, in addition to the abolishment of fee exemptions, while concurrently raising fee prices. The draft also includes a provision of introducing a unified organizational unit called Państwowe Gospodarstwo Wodne “Wody Polskie” which is responsible for the supervision of integrating water management agencies and their activities. The introduction of the new institution is aimed at addressing insufficiencies within the current water management system. The designation of a government agency dedicated to coordination and the promotion of inter-sectoral integration is aimed at the fulfilment of harmonization with legislation of the Water Framework Directive, along with the Nitrates Directive.

Appendix A.5.5. Stakeholder Resources

Poland is characterized by a weak civil society with low social capital levels [47,48], which constitute a hindrance to realizing co-governance. Low social capital levels are indicative of a lack of trust and unwillingness to engage through cooperative and participative means. The lack of a participatory culture in Poland is a major barrier to realizing co-governance.

Appendix A.5.6. Pressure for Change

Poland faces a confluence of constraining factors, along with considerable external pressure to reform the state’s water management system and reduce nitrate pollution. High nutrient loadings to the Baltic Sea, in tandem with court proceedings by the European Court of Justice for failure to comply with both the Nitrates and Water Framework Directives highlight the severity of the Polish situation.
For the Kocinka case study, there seems to be a low pressure for change (the pressure is rather economically driven) because many farmers are only part-time farmers and are not involved and do not seem to want to be involved in governance processes. Therefore, there is no recognition for the need of change on the local level.

Appendix A.6. Case Study Profile for Minnesota State, USA—1 Watershed 1 Plan—The Water Quality Framework

Appendix A.6.1. Context

Minnesota has a long history of water management by local government. The One Watershed, One Plan (1W1P) also referred to as the watershed water quality framework is rooted in this history. The 1W1P was initiated, in 2011, at a round table with local the local government units (Association of Minnesota Counties, Minnesota Association of Watershed Districts, and Minnesota Association of Soil and Water Conservation Districts). The roundtable recommended that water resource management should be based on catchment boundaries.
The State of Minnesota, USA, contains the source of the Mississippi River, which flows over 3730 km south through or adjacent to 10 states, before entering the Gulf of Mexico. Over the past several decades, it had become increasingly evident that the symptoms of eutrophication in the Gulf of Mexico were spreading due to increased nutrient loads, resulting in the degradation of water quality [37]. In response, the Mississippi River/Gulf of Mexico Watershed Nutrient Task Force was established by the United States Environmental Protection Agency (USEPA), and, as part of the revised 2008 Action Plan, 12 basin states were called to develop state-level nutrient reduction strategies by 2013 to improve water quality in the Mississippi River Basin, and ultimately reduce, mitigate, and control hypoxia in the Gulf of Mexico (Mississippi River/Gulf of Mexico Watershed Nutrient Task Force, 2008). These strategies were intended to be a collaborative effort, combining both current and new nutrient reduction efforts.

Appendix A.6.2. Problem to be Addressed

In the Minnesota reduction strategy, the goal is stated: “The goal of the Minnesota Nutrient Reduction Strategy is to guide the state in reducing excess nutrients in waters, so that in-state and downstream water quality goals are met [74]. The goal is to achieve 45% reduction in phosphorus and a 20% reduction in current nitrogen concentrations to the Mississippi River by 2025, and a 45% reduction by 2040” [75].

Appendix A.6.3. Present Governance System

At the same time that the Mississippi River/Gulf of Mexico Watershed Nutrient Task Force was meeting (2008), voters in the State of Minnesota passed the historic Clean Water, Land and Legacy Amendment to the Minnesota Constitution. This Legacy Amendment imposed a three-eighths of one percent sales tax for 25 years, until 2034, for the sake of cleaner water, healthier habitat, better parks and trails and sustaining the arts and cultural heritage. Thirty-three percent of these funds were allocated directly to the Clean Water Fund, which may only be spent to protect, enhance, and restore water quality in lakes, rivers, and streams and to protect groundwater from degradation.
This was a game-changer for water resource management in Minnesota. With this increased funding, public expectations drove the need for improved coordination amongst the State’s water management agencies.

Appendix A.6.4. Main Activities

In response to the demand to meet public expectations, the Water Quality Framework was developed to enhance coordination and clarify roles in an integrated water governance structure so that it is clear who is responsible at each stage in the process, enhancing the efficiency for collaboration between state and local partners.
The policy framework transitioned from top-down management to a bottom-up approach, systematically delivering data, research, and analysis while empowering local action and implementation. The Water Quality Framework begins with Monitoring and Assessment through a watershed-based approach to systematically assess the condition of lakes and streams on a ten-year cycle, to inform future implementation activities. State agencies lead these monitoring efforts, with the assistance from the local government units (LGUs) within the watershed. Water resource characterization and problem identification incorporates science and data synthesis into the Framework through the use of models and spatial mapping tools to encourage the understanding of interactions, stressors and threats to the watershed. Private consultants or researchers are commonly contracted to complete these assessments using the best science and resources available. Water Restoration and Protection Strategies (WRAPS) are developed for each watershed based on the data summarized through the characterization process. The WRAPS identify priority sub-watersheds and inform local planning. Community input through a public participation process helps to incorporate local knowledge into the summarized strategies. Comprehensive watershed management is driven by the LGUs to ensure a local commitment for prioritized, targeted and measurable actions.
This comprehensive assessment resulted in a document referred to as One Watershed One Plan (1W1P). All local, state and federal agencies join together to inform the process, but ultimately the implementation plan is driven by the priorities of local stakeholders to refine the previously identified watershed-based strategies into an actionable path forward.

Appendix A.6.5. Stakeholder Resources

The first round of 1W1P pilot projects were launched in 2014 with the intent to build on existing watershed efforts, using local plans together with state and local knowledge, implementing a systematic and science-based approach to watershed management. A successful program requires clear communication regarding roles and expectations. Results from the experience indicated that time and patience was essential to the development of the partnerships to create a watershed-based management plan following a co-governance structure. Taking time at the beginning to coordinate and ensure clear and consistent communication, encourages the development of a smooth process. Including stakeholders with a range of expertise, backgrounds, and perspectives into the partnership and valuing their input resulted in a higher level of trust, which should lead to improved strategy adoption and implementation. As the 1W1P process evolves, there will be a less aggressive timeline to help alleviate the frustration of rapid coordination, which should result in a larger number of stakeholders and public participants included in discussions [76].

Appendix A.6.6. Pressure for Change

In Minnesota, the citizens voted in 2008 for an amendment to the Minnesota Constitution, which resulted in a 25-year sales tax increase for the sake of cleaner water, healthier habitat, better parks, sustained arts and heritage. This was a game-changer for water resource management in Minnesota. With this increased funding, public expectations drove the need for improved coordination amongst the State’s water management agencies. The external pressure for change led to the development of a catchment-based water quality framework, transitioning from a top-down management approach to a bottom-up water co-governance approach, systematically delivering data, research and analysis while empowering local action and implementation.

Appendix A.7. Case Study Profile for the Murray Darling Basin, Australia—Governance Structures and Water Market

Appendix A.7.1. Context

The Murray Darling Basin covers one million square km, approximately one seventh of the Australian continent. The Basin encompasses four of the Australian States, namely Victoria, New South Wales South Australia and Queensland. Under the Commonwealth Constitution, water management is a responsibility of the States. The Commonwealth or national Government wields influence through its financial powers, or through the implementation of international treaties such as the Ramsar Convention governing the protection of wetlands.
Governance of the Murray Darling Basin was one the most difficult challenges during the negotiations to form a federation. The conflicts of interest were a substantial barrier and it took some 15 years before the governance of the Basin took shape with agreement on bulk water sharing and creation of the River Murray Commission. The River Murray Commission had four Commissioners, one each from Victoria, New South Wales, South Australia and the Commonwealth.
The Commission had powers to initiate construction of dams, weirs and locks along the river, and to direct their operation. The States supervised the construction and provided operational staff for the works within their boundaries. The costs of capital works were shared equally among the four Governments, and the operational costs were shared equally among the three States. Requirement of consensus was a key principle of governance: all the Commissioners had to agree before anything could happen. Consensus had a great strength: when consensus was reached, all parties had reached agreement and the outcome would be implemented effectively. However, consensus also had a weakness in that it took a long time to reach a consensus over difficult issues.
The River Murray Commission oversaw a large increase in construction of dams and weirs to provide reliable water supplies for irrigation. Construction boomed between the end of the Second World War and 1980. Some 13,000 GL were being diverted from the Murray River and its southern tributaries to irrigate 14,000 square km. Australia is an ancient dry continent and salt has accumulated in the landscape over millennia. While having economic benefits, the massive increase in irrigation started mobilising the salt and river salinity started increasing and by the early 1980s salinity levels at Morgan in South Australia exceeded 800 EC units (500 mg/L) for 18 months on end.

Appendix A.7.2. Problem to be Addressed

Ideally, drinking water should have less than 800 EC (WHO aesthetic limit) and horticultural crops are impacted above 500 EC. The increasing trend in salinity alarmed South Australia, the downstream State.

Appendix A.7.3. Present Governance System

Meanwhile, the irrigation districts in Victoria and New South Wales, the two upstream States, were suffering the effects of high water tables, and both States were seeking to improve the drainage systems and discharge more saline water into the River. South Australia, the downstream State suffering most from rising river salinities, objected vigorously. The River Murray Commission’s role did not include water quality and was unable to intervene, so nothing happened. Concerns about rising salinity levels provided the political impetus to reform governance by creating the Murray Darling Basin Commission (MDBC).
The role of the MDBC was expanded from the River Murray to include the whole Murray Darling Basin and its water related natural resources including water quality issues. Three Commissioners were appointed representing water, environment and agricultural agencies from each jurisdiction and an Independent President presided over their meetings. Importantly, the Commission now reported to a Ministerial Council responsible for decision making key decisions.

Appendix A.7.4. Main Activities

Development and implementation of a Salinity and Drainage Strategy was the first task of the new Commission.
In summary, the Strategy included the following elements.
Defined:
  • A salinity target of 800 EC units at Morgan in SA (a modelled target)
  • Salinity debits and credits as tradeable pollution rights
  • Accountable actions
  • A benchmark climatic period for modelling the target
Established:
  • Systems for salinity monitoring and reporting
  • A Register of salinity debits and credits
  • An Independent Audit Group
  • Peer review and accreditation of models for system behaviour and accountable actions
  • Comprehensive reviews at five-year intervals
Invested:
  • In salt interception schemes along the River on the basis of cost effectiveness regardless of geographic location to create 80 EC credits at Morgan in South Australia
Allocated:
  • 50 EC credits to improving the river
  • 15 EC credits to each of the two upstream State so that their irrigation systems could be drained
Required
  • All three States to remain in credit on the Register
The Strategy provided a top down governance framework that co-ordinated the work of community groups in the 14 irrigation districts in the southern Basin to develop local Salinity Management Plans. The Salinity and Drainage Strategy provides an example of balancing top down governance establishing targets and directing investment with bottom up governance reflecting the practicalities of addressing local problems. The Strategy has been reviewed every 15 years to accommodate changing circumstances and priorities. While the Salinity target has now been achieved, there is no room for complacency; continued vigilance and ongoing, rigorous implementation of the Strategy is required to ensure long term future.

Pressure for Change

The salinity issue in the Murray Darling Basin would be rated between Major and Severe, which is a major factor in achieving joint action and community support. If the historical trends in the early 1980s had been allowed to continue unchecked, the drinking water supplies of the city Adelaide (1 million people) and the regional towns along the Murray River would have been severely impacted. The irrigated horticultural industries would also have been severely impacted. Upstream irrigation areas would have been impacted by inability to properly drain them and discharge the drainage water to the river.

Appendix B. Overview of Institutional Arrangements Indicators

Table A1. Analysis of task allocation, showing an overview of responsibility for “who makes decisions” (who is responsible for which tasks) in the different steps in decision making (a)–(j).
Case Studies
Tasks—“who is responsible for which tasks”: C = Central; R = Regional; L = local
Policy formulation
  (a) Choosing goal
  (b) Setting targets
  (c) Allocation of resources for action plans
  (d) Prepare action plans
  (e) Approve action plans
Policy implementation
  (f) Implementation
  (g) Receipt of resources for action plans
Policy evaluation
  (h) Monitoring and control
  (i) Data collection
  (j) Data use
Policy formulation:
(a)
Choosing goals, for water quality.
(b)
Setting targets (who and which agency/agencies is/are responsible for corresponding DWPA targets. These can take the form of targets for specific water uses such as drinking and environmental water quality standards, or emission levels for water pollutants).
(c)
Allocating resources for action plan, (who and which agency/agencies is/are responsible for financing, also how are action plans financed, e.g., through charges and taxes, grants, etc.).
(d)
Prepare action plans (who and which agency/agencies is/are responsible for preparing the action plans).
(e)
Approve action plans (who and which agency/agencies is/are responsible for approving the action plans).
Policy implementation:
(f)
Implementation (at which level are the plans and goals implemented, involving the funding of measures and a division of labour. Separate tasks exist for the implementation of measures and policies to achieve this that can be shared between public, private and civil society actors).
(g)
Receipt of resources for action plans (who are the receiver of resources and funding in the implementation).
Policy evaluation:
(h)
Monitoring and control (at which level are enforcement in terms of monitoring and control taking place).
(i)
Data collection (who and which agency/agencies is/are responsible for the data collection of DWPA).
(j)
Data use (who uses data and for which purposes).

Appendix C. Overview of Co-Governance Indicators

Appendix C.1. Pressure for Change (Low, Moderate, Major, Severe)

Low
Partial failure to meet nationally set standards/targets. Unlikely to incur regulatory penalties from a higher authority. Of low societal concern (or awareness/understanding) or low political concern. Unlikely to result in more than incremental change over time to existing regulation, policies and procedures/actions.
Moderate
Complete or partial failure to meet nationally set standards/targets. May incur regulatory penalties from a higher authority. Prompts some societal concern (e.g., action or lobbying by “specialised” NGOs or community groups). Prompts moderate political concern and some evidence of action through policy change and/or budgetary allocation within conventional planning, policy and budgetary cycles.
Major
Significant and pressing failure to meet nationally set standards/targets. Likely to incur regulatory penalties from a higher authority. Prompts widespread societal awareness, concern and action (lobbying, communications, legal action, etc.). Prompts clear political prioritisation and clear evidence of action in the form of policy change and/or budgetary allocation within or in addition to conventional planning, policy and budgetary cycles.
Severe
Emergency (short term) or chronic (continuing) environmental disasters or degradation. Certain to incur penalties from a higher authority if of a relevant type. Prompts widespread media coverage, societal awareness and responses/actions. Prompts immediate political response including action through emergency or other direct/explicit measures.

Appendix C.2. Water Governance Capacity for Public Sector (Weak, Medium, Strong)

Weak
Limited capability exists to develop, facilitate and support co-production of knowledge and plans, and shared authority and responsibilities for implementation, with lower level and non-state actors.
Medium
There is localised evidence/examples that some capability exists to develop, facilitate and support co-production of knowledge and plans, and shared authority and responsibilities for implementation, with lower level and non-state actors.
Strong
Evidence exists of nationwide capability to develop, facilitate and support co-production of knowledge and plans, and shared authority and responsibilities for implementation, with lower level and non-state actors.

Appendix C.3. Water Governance Capacity for Civil Society (Weak, Medium, Strong)

Weak
No or only limited capability exists amongst national NGOs or other community-based organisations to mobilise stakeholder engagement or wider public awareness and participation, and to engage with relevant public sector agencies for co-production of knowledge and plans, and shared authority and responsibilities for implementation.
Medium
There is localised evidence/examples that some capability exists amongst national NGOs or other community-based organisations to mobilise stakeholder engagement or wider public awareness and participation, and to engage with relevant public sector agencies for co-production of knowledge and plans, and shared authority and responsibilities for implementation.
Strong
Evidence exists of well-developed nationwide capability amongst national NGOs or other community-based organisations to mobilise stakeholder engagement or wider public awareness and participation, and to engage with relevant public sector agencies for co-production of knowledge and plans, and shared authority and responsibilities for implementation.

Appendix C.4. Effectiveness (None, Weak, Moderate, Good, Excellent)

None
No evidence of positive outcomes (or at least reduced or halted negative outcomes).
Weak
Limited evidence of positive outcomes (or at least reduced or halted negative outcomes).
Moderate
Clear localised examples or other evidence of positive outcomes (or at least reduced or halted negative outcomes).
Good
Widespread and continuing evidence of positive outcomes/improvement.
Excellent
Widespread and continuing evidence of positive outcomes and achievement or near achievement of goals.
Table A2. Co-governance criteria.
Co-Governance CriteriaScale
Pressure for changeLow, moderate, major, severe
Water governance capacity for public sectorWeak, medium, strong
Water governance capacity for civil societyWeak, medium, strong
Effectiveness
  - Goal achievementNone, weak, moderate, good, excellent
  - Cost effectiveness 1—desired outcomes being delivered affordably with the use of available resourcesNone, weak, moderate, good, excellent
  - Cost effectiveness 2—desired outcomes being delivered at a lower cost than by alternative means as far as can be determined or judgedNone, weak, moderate, good, excellent
  - Development and use of innovative solutionsNone, weak, moderate, good, excellent
  - Use of local knowledge and data 1—Knowledge sharing—openness/accessibility of public sector scientific data (including that of municipalities and water companiesNone, weak, moderate, good, excellent
  - Use of local knowledge and data 2—Co-production of knowledge—combined use of scientific data and local knowledge/dataNone, weak, moderate, good, excellent

Appendix D. Survey Structure

Q1: Case study information
YesNoSpecify
The case study is an ongoing water co-governance project
The case study is about a finished water co-governance project
The case study is about a (possible) future water co-governance project
Q2: Which policy phase is the co-governance case in:
Policy PhaseYesNo
Problem identification (Initiation/agenda setting)
Policy Formulation
Policy Implementation
Monitoring
Policy evaluation
Q2A: How is the water management/planning structures, organized in your country and who is responsible?
YesNo
River Basin Management Plans
Programmes of Measures
Action plans
Other
Q3: Indicate whether the following stakeholders have been involved (yes or no) and, if so, to what degree?
Stakeholder Group InvolvedYesNoDegree of Involvement
WeakModerateGoodExcellent
Local governmental bodies
Regional governmental bodies
Central governmental bodies
Environmental NGOs
Farmer
Farmers organizations
General public
Others, specify:
Others, specify:
Q4: Which mechanisms have been used to involve stakeholders?
MechanismsYesNoDon’t knowStakeholder Groups Responsible for Involvement (Farmers, NGOs, etc.)Stakeholder Groups Involved (Farmers, NGOs, etc.)
Website with general information
Leaflets and printed newsletters
Survey/opinion polls
Information at public events such as exhibitions and information markets
Publication of meeting minutes and other case study documents
Possibility to comment in writing
Public hearings
Field trips/excursions
Interactive workshops for collective assessments and planning
One-to-one meetings “kitchen table meetings” e.g., at the house of a farmer
Citizens own initiative (Stakeholder initiated)
Citizens juries
Involvement in official structures (steering boards etc.)
Other mechanisms:
Q5: Does the co-governance case improve the quality of decisions?
Yes   No
If yes, how:
Q6: Does the co-governance case study increase legitimacy?
Yes   No
If yes, what form of legitimacy:
Q6A: Input legitimacy:
About inclusion: Are the involved stakeholders representative for the issue at stake?
_________________________________________________________________________________
In what sense?
_________________________________________________________________________________
Are both directly and indirectly affected stakeholders involved?
_________________________________________________________________________________
How were they invited and involved?
___________________________________________________________________________________
About consensus: does it promote mutual agreement among participants?
_____________________________________________________________________________
In what way?
_________________________________________________________________________________
How is it ensured that critical voices or minority groups are not excluded?
______________________________________________________________________________
About transparency: are the decision-making processes transparent?
_____________________________________________________________________________________________________________
What parts?
__________________________________________________________________________________
How/in what way?
_________________________________________________________________________________
Q6B: Output legitimacy:
About acceptance: are the rules/decision making accepted?
__________________________________________________________________________________
About enforcement/compliance: Is compliance verified and non-compliance sanctioned?
________________________________________________________________________________
Q7: Has the co-governance case study helped in developing ownership of the problem adressed?
Yes   No
If yes in what kind of way?
Developing commitment
Change behavior
Explain________________________________________________
Other ways______________________________________________
No
Why not
_______________________________________________________________
Q8: Has the governance case study helped in solving conflicts between stakeholders?
Yes
If yes in what kind of way?
______________________________________________________________
No, there was not really any significant conflicts
No, the conflict or conflicts still exists
______________________________________________________________
Q9: What have been the main factors/key issues promoting the success of co-governance in the case study?
Explain____________________________________________________________________________________________________________________________________________________________________________________________________________________________________
For each key issue and barrier, describe why and how:
_______________________________________________________________________________________________________________________________________________________________________________________
Q10: What have been the main/key barriers for co-governance in the case study?
Explain__________________________________________________________________________________________________________________________________________________________________________________________________________________________________________________________________________________________________________________________
For each key issue and barrier, describe why and how:
_______________________________________________________________________________________________________________________________________________________________________________________

Appendix E. List of Participants in the International Workshop

Table A3. List of participants.
NameInstitution
John LangfordMelbourne University, Australia
Cors van den BrinkRoyal HaskoningDHV, Netherlands
Beatrice HedelinKarlstad University, Sweden
Alistair MaltbyRivers Trust, England
Laurence SmithSOAS, England
Jes PedersenRegion Midt, Denmark
Keld RasmussenHorsens Municipality, Denmark
Grit MartinezEcologic Institute, Germany
Nico StelljesEcologic Institute, Germany
Morten GraversgaardAarhus University, Denmark
Jens Christian RefsgaardGEUS, Denmark
Anker Lajer HøjbergGEUS, Denmark
Flemming GertzSEGES, Denmark
Irene A. WiborgSEGES, Denmark
Ylva EngwallSwedish Agency for Marine and Water Management

References

  1. Smith, V.H. Eutrophication of Freshwater and Coastal Marine Ecosystems A Global Problem. Environ. Sci. Pollut. Res. 2003, 10, 126–139. [Google Scholar] [CrossRef]
  2. Foley, J.A.; DeFries, R.; Asner, G.P.; Barford, C.; Bonan, G.; Carpenter, S.R.; Chapin, F.S.; Coe, M.T.; Daily, G.C.; Gibbs, H.K.; et al. Global Consequences of Land Use. Science 2005, 309, 570–574. [Google Scholar] [CrossRef] [PubMed]
  3. Carpenter, S.R. Phosphorus control is critical to mitigating eutrophication. Proc. Natl. Acad. Sci. USA 2008, 105, 11039–11040. [Google Scholar] [CrossRef] [PubMed]
  4. Conley, D.J.; Bonsdorff, E.; Carstensen, J.; Destouni, G.; Gustafsson, B.G.; Hansson, L.; Rabalais, N.N.; Voss, M.; Zillén, L. Tackling hypoxia in the Baltic Sea: Is engineering a solution? Environ. Sci. Technol. 2009, 43, 3407–3411. [Google Scholar] [CrossRef] [PubMed]
  5. Vorosmarty, C.J.; McIntyre, P.B.; Gessner, M.O.; Dudgeon, D.; Prusevich, A.; Green, P.; Glidden, S.; Bunn, S.E.; Sullivan, C.A.; Reidy Liermann, C.; et al. Global threats to human water security and river biodiversity. Nature 2010, 467, 555–561. [Google Scholar] [CrossRef] [PubMed]
  6. Steffen, W.; Richardson, K.; Rockström, J.; Cornell, S.E.; Fetzer, I.; Bennett, E.M.; Biggs, R.; Carpenter, S.R.; De Vries, W.; de Wit, C.A.; et al. Planetary boundaries: Guiding human development 560 on a changing planet. Science 2015, 347, 1259855. [Google Scholar] [CrossRef] [PubMed]
  7. Shibata, H.; Galloway, J.N.; Leach, A.M.; Cattaneo, L.R.; Noll, L.C.; Erisman, J.W.; Gu, B.; Liang, X.; Hayashi, K.; Ma, L.; et al. Nitrogen footprints: Regional realities and global connections for reducing anthropogenic nitrogen losses to the environment. Ambio 2017, 46, 129–142. [Google Scholar] [CrossRef] [PubMed]
  8. Carpenter, S.R.; Caraco, N.F.; Correll, D.L.; Howarth, R.W.; Sharpley, A.N.; Smith, V.H. Nonpoint pollution of surface waters with phosphorus and nitrogen. Ecol. Appl. 1998, 8, 559–568. [Google Scholar] [CrossRef]
  9. Mateo-Sagasta, J.; Zadeh, S.M.; Turral, H. Water Pollution from Agriculture: A Global Review; The Food and Agriculture Organization of the United Nations Rome; The International Water Management Institute on Behalf of the Water Land; Ecosystems Research Program: Colombo, Sri Lanka, 2017.
  10. Smith, L.; Inman, A.; Lai, X.; Zhang, H.; Fanqiao, M.; Jianbin, Z.; Burke, S.; Rahn, C.; Siciliano, G.; Haygarth, P.M.; et al. Mitigation of diffuse water pollution from agriculture in England and China, and the scope for policy transfer. Land Use Policy 2017, 61, 208–219. [Google Scholar] [CrossRef]
  11. Bouwer, H. Integrated water management: Emerging issues and challenges. Agric. Water Manag. 2000, 45, 217–228. [Google Scholar] [CrossRef]
  12. Ribaudo, M.; Delgado, J.; Hansen, L.; Livingston, M.; Mosheim, R.; Williamson, J. Nitrogen in Agricultural Systems: Implications for Conservation Policy; ERR-127; U.S. Department of Agriculture: Washington, DC, USA, 2011.
  13. Baerenklau, K.A.; Wang, J. Model-based regulation of nonpoint source emissions. In The Handbook of Water Economics; Dinar, A., Schwabe, K.A., Eds.; Edward Elgar: Cheltenham, UK, 2015; pp. 313–327. [Google Scholar]
  14. OECD. Water Quality and Agriculture: Meeting the Policy Challenge; OECD Studies on Water; OECD Publishing: Paris, France, 2012. [Google Scholar]
  15. Carter, N. The Politics of the Environment; Cambridge University Press: Cambridge, UK, 2007. [Google Scholar]
  16. Dalgaard, T.; Hansen, B.; Hasler, B.; Hertel, O.; Hutchings, N.J.; Jacobsen, B.H.; Jensen, L.S.; Kronvang, B.; Olesen, J.E.; Schjørring, J.K.; et al. Policies for agricultural nitrogen management—Trends, challenges and prospects for improved efficiency in Denmark. Environ. Res. Lett. 2014, 9, 115002. [Google Scholar] [CrossRef]
  17. Tosun, J.; Koos, S.; Shore, J. Co-governing common goods: Interaction patterns of private and public actors. Policy Soc. 2016, 35, 1–12. [Google Scholar] [CrossRef]
  18. Thorsøe, M.H.; Graversgaard, M.; Noe, N. The challenge of legitimizing spatially differentiated regulation: Experiences from the implementation of the Danish Buffer zone act. Land Use Policy 2016, 62, 202–212. [Google Scholar] [CrossRef]
  19. Loppolo, G.; Cucurachi, S.; Salomone, R.; Saija, G.; Shi, L. Sustainable local development and environmental governance: A strategic planning experience. Sustainability 2016, 8, 180. [Google Scholar] [CrossRef]
  20. Aquilani, B.; Silvestri, C.; Ioppolo, G.; Ruggieri, A. The Challenging Transition to Bio-economies: Towards a New Framework Integrating Corporate Sustainability and Value Co-creation. J. Clean. Prod. 2018, 172, 4001–4009. [Google Scholar] [CrossRef]
  21. Rogers, P.; Hall, A.W. Effective Water Governance; TEC Background Papers No. 7; Global Water Partnership, Technical Committee: Stockholm, Sweden, 2003. [Google Scholar]
  22. Rosenau, J. Governance in the Twenty-first Century. Glob. Gov. 1995, 1, 13–43. [Google Scholar]
  23. Pierre, J.; Peters, G.B. Governance, Politics and the State; Peters, G.B., Pierre, J., Stoker, G., Eds.; Macmillan: Basingstoke, UK, 2000. [Google Scholar]
  24. Kooiman, J. Governing as Governance; Sage Publications: Thousand Oaks, CA, USA, 2003. [Google Scholar]
  25. Ostrom, E. Polycentric systems for coping with collective action and global environmental change. Glob. Environ. Chang. 2010, 20, 550–557. [Google Scholar] [CrossRef]
  26. Ackerman, J. Co-governance for accountability: Beyond “exit” and “voice”. World Dev. 2004, 32, 447–463. [Google Scholar] [CrossRef]
  27. Smith, L.; Porter, K.; Hiscock, K.; Porter, M.J.; Benson, D. (Eds.) Catchment and River Basin Management: Integrating Science and Governance. In Earthscan Studies in Water Resource Management; Routledge: Abingdon, UK; New York, NY, USA, 2015. [Google Scholar]
  28. Yin, R.K. Case Study Research. Design and Methods, 5th ed.; Sage Publications: Thousand Oaks, CA, USA; London, UK; New Dehli, India, 2013. [Google Scholar]
  29. Ansell, C.; Gash, A. Collaborative governance in theory and practice. J. Public Adm. Rese. Theory 2008, 18, 543–571. [Google Scholar] [CrossRef]
  30. Seawright, J.; Gerring, J. Case selection techniques in case study research: A menu of qualitative and quantitative options. Polit. Res. Q. 2008, 61, 294–308. [Google Scholar] [CrossRef]
  31. Likert, R. A Technique for the Measurement of Attitudes. Arch. Psychol. 1932, 140, 1–55. [Google Scholar]
  32. Wilson, G.A.; Buller, H. The use of socio-economic and environmental indicators in assessing the effectiveness of EU agri-environmental policy. Eur. Environ. 2001, 11, 297–313. [Google Scholar] [CrossRef]
  33. Blackstock, K.L.; Ingram, J.; Burton, R.; Brown, K.M.; Slee, B. Understanding and influencing behaviour change by farmers to improve water quality. Sci. Total Environ. 2010, 408, 5631–5638. [Google Scholar] [CrossRef] [PubMed]
  34. WWF. UK Briefing; WWF: Gland, Switzerland, 2015. [Google Scholar]
  35. Carr, G.; Blöschl, G.; Loucks, D.P. Evaluating participation in water resource management: A review. Water Resour. Res. 2012, 48, 11401. [Google Scholar] [CrossRef]
  36. Conley, A.; Moote, M.A. Evaluating collaborative natural resource management. Soc. Nat. Resour. 2003, 16, 371–386. [Google Scholar] [CrossRef]
  37. Rabalais, N.N.; Turner, R.E.; Scavia, D. Beyond science into policy: Gulf of Mexico hypoxia and the Mississippi River. BioScience 2002, 52, 129–142. [Google Scholar] [CrossRef]
  38. Murray‒Darling Basin Authority. General Review of Salinity Management in the Murray–Darling Basin. Licensed from the Murray‒Darling Basin Authority under a Creative Commons Attribution; Murray‒Darling Basin Authority: Canberra, Australia, 2014.
  39. CaBA. Catchment-Based Approach (CaBA): Monitoring and Evaluation; CaBA Benefits Working Group: London, UK, 2017. [Google Scholar]
  40. Commission on Nature and Agriculture. Richer Nature, New Environmental Regulation and New Growth Opportunities for Agriculture. Executive Summary the Danish Commission on Nature and Agriculture. 2013. Available online: www.naturoglandbrug.dk (accessed on 10 February 2018).
  41. Hansen, A.; Refsgaard, J.; Olesen, J.; Børgesen, C.D.; Karlson, I. Potential benefits of a spatially targeted regulation based on detailed N-reduction maps to reduce N-load from agriculture in groundwater dominated catchments. Sci. Total Environ. 2016, 595, 325–336. [Google Scholar] [CrossRef] [PubMed]
  42. Freriks, A.; Keessen, A.; Korsse, D.; Van Rijswick, H.F.M.W.; Bastmeijer, K. As Far as the Own Instruments Reach: A Study on the Position of the Provincie of North-Brabant and the North-Brabant Water Authorities in the Realization of the Water Framework Objectives, with Special Attention to the New Dutch Environmental Act; Utrecht University: Utrecht, The Netherlands, 2016. (In Dutch) [Google Scholar]
  43. Ørum, J.E.; Kjærgaard, C.; Thomsen, I.K. Landbruget og Vandområdeplanerne: Omkostninger og Implementering af Virkemidler i Oplandet til Norsminde Fjord; IFRO Rapport; Institut for Fødevare—Og Ressourceøkonomi, Københavns Universitet: Copenhagen, Denmark, 2017. [Google Scholar]
  44. Voorberg, W.H.; Bekkers, V.J.J.M.; Tummers, L.G. A Systematic Review of Co-Creation and Co-Production: Embarking on the social innovation journey. Public Manag. Rev. 2014, 17, 1333–1357. [Google Scholar] [CrossRef] [Green Version]
  45. Gouillart, J.F.; Hallett, T. Co-creation in government. Stanf. Soc. Innov. Rev. 2015, 13, 40–47. [Google Scholar]
  46. Runya, X.; Qigui, S.; Wei, S. The Third Wave of Public Administration: The New Public Governance. Can. Soc. Sci. 2015, 11, 11–21. [Google Scholar] [CrossRef]
  47. Hunka, A.; de Groot, W. Participative environmental management and social capital in Poland. Soc. Geogr. 2011, 6, 39–45. [Google Scholar] [CrossRef]
  48. Regulska, J. Governance or Self-governance in Poland? Benefits and Threats 20 Years Later. Int. J. Polit. Cult. Soc. 2009, 22, 537. [Google Scholar] [CrossRef]
  49. Jaensch, D.; Cooke, J. Mallee Salinity Workshop May 30, 2012 Executive Summary; Project Number: 1525-2-103; Mallee Catchment Management Authority: Irymple, Australia, 2013. [Google Scholar]
  50. Beierle, T.C.; Cayford, J. Democracy in Practice: Public Participation in Environmental Decisions; Resources for the Future Press: Washington, DC, USA, 2002; 160p. [Google Scholar]
  51. Brown, R.R.; Farrelly, M.A.; Loorbach, D.A. Actors Working the Institutions in Sustainability Transitions: The Case of Melbourne’s Stormwater Management. Glob. Environ. Chang. 2013, 23, 701–718. [Google Scholar] [CrossRef]
  52. Danish Nature Agency. Vandområdeplan 2015–2021 for Vandområdedistrikt Jylland og Fyn (Water Management Plan 2015–2021 for River Basin District Jutland and Funen); Environmental Ministry: Copenhagen, Denmark, 2016. [Google Scholar]
  53. Stelljes, N.; McGlade, K.; Martinez, G. BONUS SOILS2SEA Deliverable 6.4. Results from Stakeholder Workshops on Governance Concepts; Ecologic Institute: Berlin, Germany, 2017; Available online: www.soils2sea.eu (accessed on 4 April 2018).
  54. Graversgaard, M. Evaluering af Vandrådsarbejdet; Rapport Udarbejdet for Naturstyrelsen; Miljøministeriet: Copenhagen, Denmark, 2015. [Google Scholar]
  55. Graversgaard, M.; Thorsøe, M.H.; Kjeldsen, C.; Dalgaard, T. Evaluating public participation in Denmark’s water councils: How policy design and boundary judgements affect water governance! Outlook Agric. 2016, 45, 225–230. [Google Scholar] [CrossRef]
  56. Graversgaard, M.; Jacobsen, B.; Kjeldsen, C.; Dalgaard, T. Stakeholder Engagement and Knowledge Co-Creation in Water Planning: Can Public Participation Increase Cost-Effectiveness? Water 2017, 9, 191. [Google Scholar] [CrossRef]
  57. EU. Directive of the European Parliament and of the Council Establishing a Framework for Community Action in the Field of Water Policy; 2000/60/EC; EU: Brussels, Belgium, 2000; Volume 327, pp. 1–72. [Google Scholar]
  58. Hammer, M.; Balfors, B.; Mörtberg, U.; Petersson, M.; Quin, A. Governance of water resources in the phase of change: A case study of the implementation of the EU Water Framework Directive in Sweden. Ambio 2011, 40, 210–220. [Google Scholar] [CrossRef] [PubMed]
  59. Hedelin, B. Potential implications of the EU Water Framework Directive in Sweden. Eur. J. Spat. Dev. 2005, 14, 1–17. [Google Scholar]
  60. Lundqvist, L.J. Integrating Swedish Water Resource Management: A Multi-Level Governance Trilemma. Local Environ. 2004, 9, 413–424. [Google Scholar] [CrossRef]
  61. Hedelin, B.; Lindh, M. Implementing the EU Water Framework Directive: Prospects for sustainable water planning in Sweden. Eur. Environ. 2008, 18, 327–344. [Google Scholar] [CrossRef]
  62. Tullstorpsån Ekonomisk Förening. The Tullstorp Stream Project—From Source to Recipient. Project Flyer 2014. Available online: http://www.tullstorpsan.se/wp-content/uploads/2017/01/The-Tullstorp-Stream-Project.pdf (accessed on 20 March 2018).
  63. Svensson, E. The Tullstorp Stream Project—Success Factors, Challenges and Recommendations for Improvement of Agri-Environmental Projects. Project Report for Baltic Compact. 2014. Available online: http://www.balticcompass.org/Baltic-Compact-Materials/Tullstorp%20Stream%20case%20study_Baltic%20Compact_ESvensson_20141223.pdf (accessed on 20 March 2018).
  64. Andersson, I.; Petersson, M.; Jarsjö, J. Impact of the European Water Framework Directive on local-level water management: Case study Oxunda Catchment, Sweden. Land Use Policy 2012, 29, 73–82. [Google Scholar] [CrossRef]
  65. Sørensen, K.M. Identifying the Role of the Management Approach and the Project Manager on Landowner Participation in River Restoration: Two Case Studies of Skjern River and Tullstorp Stream. Master’s Thesis, University of Copenhagen, Copenhagen, Denmark, 2016. [Google Scholar]
  66. Van den Brink, C.; Wuijts, S. Towards an effective protection of groundwater resources: Putting policy into practice with the drinking water protection file. Water Policy 2016, 18, 19. [Google Scholar] [CrossRef]
  67. Dufour, F.C. Groundwater in the Netherlands: Facts and Figures. Netherlands; Institute of Applied Geoscience TNO: Delft, The Netherlands, 2000; 96p. [Google Scholar]
  68. Driessen, P.P.J.; Glasbergen, P. New Directions in Environmental Politics. Concluding Remarks. In Greening Society. The Paradigm Shift in Dutch Environmental Politics; Driessen, P.P.J., Glasbergen, P., Eds.; Kluwer Academic Publishers: Dordrecht, The Netherlands, 2002; pp. 245–262. [Google Scholar]
  69. De Roo, G. Planning per Se, Planning per Saldo: Conflicts, Complexity and Decision-Making in Environmental Planning. Ph.D. Thesis, Groningen University, Groningen, The Netherlands, 1999; 430p. (In Dutch). [Google Scholar]
  70. Driessen, P.P.J.; Glasbergen, P. Environment, Society and Policy; Elsevier: The Hague, The Netherlands, 2000; 474p. (In Dutch) [Google Scholar]
  71. Niekerk, F. The impact reported. The of Impact Assessments for the Planning of Traffic Infrastructure. Ph.D. Thesis, Groningen University, Groningen, The Netherlands, 2000; 392p. (In Dutch). [Google Scholar]
  72. Defra. Catchment Based Approach: Improving the Quality of Our Water Environment: A Policy Framework to Encourage the Wider Adoption of an Integrated Catchment Based Approach to Improving the Quality of our Water Environment; Department for Environment, Food and Rural Affairs: London, UK, 2013.
  73. Matysik, M.; Absalon, D.; Ruman, M. Surface water quality in relation to land cover in agricultural catchments (Liswarta river basin case study). Pol. J. Environ. Stud. 2015, 24, 175–184. [Google Scholar] [CrossRef]
  74. MPCA. The Minnesota Nutrient Reduction Strategy; Minnesota Pollution Control Agency: St. Paul, MN, USA, 2014. [Google Scholar]
  75. Andersson, W.P.; Wall, D.; Wasley, D. The Minnesota Nutrient Reduction Strategy; State of Minnesota: St. Paul, MN, USA, 2010.
  76. MNBWSR. One Watershed, One Plan: Lessons Learned from Pilot Watersheds; Minnesota Board of Water and Soil Resources: St. Paul, MN, USA, 2016. [Google Scholar]
Figure 1. Indicators of effective co-governance for mitigation of Diffuse Water Pollution from Agriculture.
Sustainability 10 01634 g001
Table 1. Selected case studies.
Case StudyLocationDiffuse Water Pollution from Agriculture
Norsminde catchmentDenmarkNitrogen in surface waters
Tullstorp streamSwedenNutrients in surface waters
Province of OverijsselThe NetherlandsNitrogen in groundwater
The Catchment Based ApproachUKSediment, nutrients and pesticides
Kocinka catchmentPolandNutrients in surface waters
State of MinnesotaUSANutrients in surface waters
Murray-Darling BasinAustraliaSalinity in surface and groundwater
Table 2. Expert rankings of the “pressure for change” (for mitigation of DWPA).
Case StudyPressure for Change
Norsminde catchment (Denmark)Moderate to Major
Tullstorp stream (Sweden)Low to Moderate
Province of Overijssel (The Netherlands)Moderate to Major
Catchment based approach (United Kingdom)Major
Kocinka catchment (Poland)Low
State of Minnesota (USA)Moderate
Murray-Darling Basin (Australia)Severe
Table 3. Analysis of task allocation, showing an overview of responsibility for “who makes decisions” (who is responsible for which tasks) in the different steps in decision-making (a)–(j).
Cases
Tasks— “who is responsible for which tasks”: C = Central; R = Regional; L = localNorsminde (DK)Tullstorp (SE)Overijssel (NL)CaBA (UK)Kocinka (PL)Minnesota (USA)MDB c (AUS)
(a) Choosing goalCRCCCC + L (State a)C d + R e
(b) Setting targetsCRL (R)C + LCC (State)C + R
(c) Allocation of resources for action plansCCRC + LCC (State)C + R
(d) Prepare action plansCRLR + LC + RC (State)L f
(e) Approve action plansCC + RRC + RCC (State)C + R
(f) ImplementationLLLR + LR + LR (LGU b) + LR + L
(g) Receipt of resources for action plansLR + LLR + LR + LR (LGU)R
(h) Monitoring and controlCC + R + LRR + LC + RC (State)R
(i) Data collectionCCR + LR + LC + RC (State) + R (LGU)R + L
(j) Data useC + LRR + LC + R + LC + RC (State)C + R + L
a State is a state agency for Minnesota, b Local Government Unit (LGU) is the county or catchment scale, c Murray-Darling Basin (MDB), d Central refers to the river basin authority (the Murray-Darling Basin Commission), e Regional was applied to State Governments (in the Australian federal system), f Local refers to the community groups that developed the local Salinity Action Plans.
Table 4. Processes and outcome indicators for effectiveness.
Effectiveness (None, Weak, Moderate, Good, Excellent)Norsminde (DK)Tullstorp (SE)Overijssel (NL)CaBA (UK)Kocinka (PL)Minnesota (USA)MDB (AUS)
Development and use of innovative solutionsWeakModerateGoodExcellentWeakGoodGood
Use of local knowledge and data 1—Knowledge sharing—openness/accessibility of public sector scientific data (including that of municipalities and water companies)NoneGoodExcellentModerateWeakGoodGood
Use of local knowledge and data 2—Co-production of knowledge—combined use of scientific data and local knowledge/dataModerateNoneGoodGoodWeakGoodGood
Goal achievementGoodExcellentGood/Weak 1ModerateNoneModerateExcellent
Cost effectiveness 1—desired outcomes being delivered affordably with the use of available resourcesModerateGoodGood/Weak 1GoodNoneGoodGood
Cost effectiveness 2—desired outcomes being delivered at a lower cost than by alternative means as far as can be determined or judgedWeakWeakGood/Weak 1ExcellentNoneGoodGood
1 Good at farm scale for participating farmers, weak at the scale of the recharge area considering that only approximately 20% of the agricultural area participates in program activity.

