A Stakeholder-Based Evaluation of the Most Suitable and Sustainable Delivery Fleet for Freight Consolidation Policies in the Inner-City Area


Department. of Infrastructure Engineering, University of Melbourne, Melbourne 3010, Australia
*
Author to whom correspondence should be addressed.
Sustainability 2019, 11(1), 124; https://doi.org/10.3390/su11010124
Submission received: 19 November 2018
/
Revised: 21 December 2018
/
Accepted: 22 December 2018
/
Published: 27 December 2018
(This article belongs to the Special Issue Decision Support Systems for Urban Logistics Planning: Multi-Stakeholder and Participative Approaches)
Abstract
:Freight carriers, receivers and citizens in the inner-city area suffer the most from issues impacting last mile delivery due to exacerbated traffic congestion, limited parking and unsustainable delivery vehicles. Freight consolidation policies offer a sustainable solution to address these problems. The freight vehicles used in the consolidated deliveries could play a significant role in the sustainability and success of these policies. This paper applies a multi-stakeholder decision support approach to evaluate the suitability and potential of various delivery fleet configurations in addressing the perspectives and requirements of all stakeholders involved in last mile delivery to perform the consolidated delivery in the inner-city area. The Multi-Actor Multi-Criteria Analysis (MAMCA) framework was utilised to assess and rank various delivery configurations involving a combination of eco-friendly delivery vans, trucks and cargobikes based on the objectives of the stakeholders. The weight allocation of the criteria was determined through the Fuzzy Analytic Hierarchy Process (F-AHP) method using responses collected from key actors representing all stakeholder groups in Melbourne, Australia. The multi-stakeholder analysis, which was performed using the Preference Ranking Organization Method for Enrichment Evaluation (PROMETHEE) method, suggested that the consolidated delivery should be performed using a combination of eco-friendly delivery vans and cargobikes to incorporate the concerns of the societal stakeholders and operational requirements of the business stakeholders. The mono-actor analysis revealed the heterogeneity of the stakeholders’ preferences and clashing views regarding the optimal delivery fleet. This highlights the importance of incorporating a multi-stakeholder perspective in the planning and selection of suitable urban freight policies. Accordingly, a suitable implementation plan for the consolidated delivery fleet was proposed to reflect the perspectives and requirements of these stakeholders.
1. Introduction
City centres still represent a major freight destination that attracts and generates significant levels of freight movements with very limited supply of available and affordable commercial and industrial lands to establish and operate logistics facilities. Freight delivery and pickup activities within the inner-city area are very complex due to the various and conflicting nature of freight demand, physical structure of the area, conflicting and sensitive surrounding uses and pedestrians as well as the high density of the delivery points and stops [1]. It can be argued that ensuring efficient deliveries and streamlined relationship between freight carriers and receivers in the inner-city has never been more critical due to the time-sensitive delivery expectations by the end-customers. The last leg of delivery in the inner-city area represents a major choke point and severe operational challenge for freight carriers. The inefficiencies and delivery challenges of freight carriers are considerably exacerbated in this area.
The significant vehicle-km that freight vehicles travel between distribution centres in suburban areas to receivers inside the city centre in addition to the often necessity to circulate around to find parking result in an additional fuel consumption and traffic congestion [2,3]. This is further complicated by inefficient on-street loading and parking infrastructure, which deteriorates the efficiency of last mile delivery [4]. Consequently, these freight movements cause several negative social, environmental and economic impacts on society and businesses in the inner-city area [5]. The majority of freight vehicles entering the inner-city area are diesel-powered light commercial vehicles (LCVs) delivering smaller and unoptimised loads [6]. For the same number of tonne-kilometre, freight vehicles involved in last mile delivery are more polluting than long-haul freight vehicles due to older vehicle age, lower vehicle load and lower operating speeds and idling [7]. Moreover, last mile delivery causes almost 16–50% of the transport-related emissions [8]. For instance, LCVs generated 13.3 million tonnes of CO2 equivalent emissions in London [9]. Moreover, it is estimated that a delivery van conducting last mile delivery would generate on average 21.7 kg of CO2 for an 80 km delivery trip [10].
Several policies and projects pertaining to last mile delivery have been implemented in several urban areas throughout Europe, Asian and North America. One of the most implemented solutions is the freight consolidation policy through an urban consolidation centre (UCC) [11]. The UCC provides freight carriers with a logistics facility usually located in suburban parts of the city to consolidate the deliveries to their receivers [12]. The UCC concept attempts to increase the load utilisation of delivery vehicles, minimise the total travelled distance per parcel and offer value-added and retailing services to receivers [13]. This contributes to reducing the number of freight vehicles in urban areas, improving the delivery reliability and enhancing the efficiency of freight carriers. For example, a UCC project in Antwerp, Belgium achieved a 22% reduction in total travelled distance and 36% reduction in fuel consumption using a fleet of 8-tonne rigid trucks compared with previous direct deliveries without consolidation [14]. The Bristol UCC in Bristol, UK, which operates two large trucks to deliver goods to 300 retailers in Broadmead Shopping Centre, achieved a reduction of 75% in vehicle kilometres, 89 tonnes of CO2 and 1,000 kg of NOx emissions [13]. The Regent St UCC in London achieved a reduction of 180,000 vehicle-km, 66 tonnes of CO2 and 2,300 kg of NOx emissions [15].
Furthermore, a large number of these UCCs have failed due to various reasons as highlighted in [16]. Similarly, the authors of [17] argue that inappropriate selection and configuration of the consolidated delivery fleet might have contributed to the inefficiencies and failure of many previous UCCs. Many research studies have evaluated previous concepts and implementations of UCCs using various approaches and aspects. However, it can be argued that assessment of the optimal freight vehicle including type, mix and technology for the consolidated deliveries in the inner-city area has not received similar academic attention beyond the fleet size and mix vehicle routing problem (VRP) techniques as utilised by the authors of [17,18]. A large number of similar studies on the vehicle fleet focused on the aspects of location assessment, reducing transport cost and travelled distance.
There are various stakeholders involved in last mile delivery with different and sometimes conflicting objectives and requirements. As these consolidated deliveries could be performed by various freight transport modes, it is important to evaluate beforehand the suitability and practicality of the different types of freight vehicles with respect to the objectives of all the stakeholders involved. Local authorities and citizens might find cargobikes more sustainable for delivery and pick up activities in the inner-city area while freight carriers might find delivery vans and trucks more suitable and cost-effective. The consolidated delivery fleet should not be selected to either address the operational requirements of freight carriers or the sustainability objectives and concerns of societal stakeholders. However, it is important to select the delivery configuration that addresses the various objectives of all stakeholders involved in last mile delivery. Many previous freight consolidation initiatives have failed in reality, even though they showed promising benefits in the development stage because they either favoured the objectives of selected stakeholders or neglected to include the objectives of all the stakeholders in the development stage [19]. It can be argued that many previous freight policies were proposed based on erroneous assumptions on the preferences of the stakeholders as well as their current practices and operational challenges. This contributed to the failure of some proposed solutions as they were irrelevant and impractical to the actual practices and requirements of freight carriers in the inner-city area.
Furthermore, many previous studies did not incorporate the objectives of the various stakeholders in their evaluation and decision-making. The type of freight transport modes and vehicles used by the UCC carrier to perform the consolidated deliveries in the inner-city area is very critical in reducing the negative impacts of last mile delivery as well as garnering acceptance from various stakeholders. It can be argued that many previous local governments and transport researchers paid more attention to promoting cargobikes to replace or complement conventional delivery vans. However, they did not pay similar attention to other key operational aspects that might critically affect the operational efficiency of freight carriers and receivers such as an ability to efficiently integrate with existing delivery operations or ensuring the security of the parcels. To foster the utilisation of environmentally friendly freight vehicles, the entire network from the shippers’ suburban distribution centres to the receiver inside the central city area needs to be systematically evaluated. This might not be an appropriate approach and contribute to failure or rejection of the proposed policy. This paper attempts to overcome this issue by applying a practical decision support system that ensures all the objectives of the various stakeholders are taken into consideration.
This paper applies a multi-stakeholder participatory decision-support approach to evaluate the suitability and potential of utilising eco-friendly freight vehicles to perform the consolidated deliveries in the inner-city area based on the objectives and perspectives of all the stakeholders involved in last mile delivery. The study attempts to identify the key objectives of all the stakeholders with respect to the freight consolidation policy as well as determining the relative importance of the objectives for each stakeholder group. The acquired knowledge facilitates an improved understanding of the various objectives and requirements of all the stakeholders with respect to the most suitable delivery fleet for the consolidated deliveries in the inner-city area. It enables incorporating all their perspectives in a suitable and appealing consolidated delivery fleet that addresses the operational, economic, social and environmental requirements in a balanced approach. Consequently, planners and decision-makers will be better-informed to set supporting policies and establish required initiatives to facilitate performing freight consolidation policies using sustainable freight vehicles. Using responses from key actors in Melbourne, Australia, the stakeholder analysis was performed using the Multi-Actor Multi-Criteria Analysis (MAMCA) framework, which was developed by Macharis [20]. The paper is structured as follows. Section 2 provides an overview of the literature on evaluation methods of freight transport projects as well as freight consolidation strategies and eco-friendly freight vehicles. Section 3 describes the steps of the MAMCA framework. Section 4 presents the results and analysis of the MAMCA application using the collected responses, while Section 5 discusses the results of the MAMCA application. Section 6 provides a concluding summary of the study.
2. Literature Review
2.1. Evaluation and Decision-Making Appraochces for Freight Transport Policies and Projects
2.1.1. Overview of Evaluation Methods for Freight Transport Policies and Projects
In order to support planners and policy-makers in the decision-making of new freight transport policies and solutions, it is essential to perform a comprehensive assessment of all the aspects and issues associated with the concept under consideration. This might play an important role in the success of the new freight transport policy or project [21]. Moreover, transport researchers have utilised various evaluation methods in the decision-making and assessment of previous freight transport projects including cost-effectiveness analysis (CEA), cost–benefit analysis (CBA), social cost–benefit analysis (SCBA) and multi-criteria decision analysis (MCDA) [22]. In their evaluation of the literature on the use of MCDA in field of transport, the authors of [23] highlighted that the most prevalent methods were the Analytic Hierarchical Process (AHP), Analytic Network Process (ANP), Elimination and Choice Expressing Reality (ELECTRE), Preference Ranking Organization Method for Enrichment Evaluation (PROMETHEE), Technique for Order of Preference by Similarity to Ideal Solution (TOPSIS) and MAMCA. One of the strengths of the MAMCA framework compared with other MCDA methods is that it permits every stakeholder group to have their own unique objectives or criteria in the analysis whereas the criteria are the same for all stakeholder groups in other MCDA techniques [24].
The authors of [25] warned that stakeholders would accept and cooperate with implemented measures and policies as long as they do not impose negative outcomes to their objectives and operations. Similarly, the utilised evaluation approach should systematically include the significance of each stakeholder’s objective while taking into consideration the complexity and diversity of last mile freight activities [26]. It is essential to systematically evaluate the entire urban freight network from the shippers’ suburban distribution centres to the receivers inside the inner-city area to facilitate a comprehensive understanding of the impacts of the freight project [27]. Using the SCBA method, the authors of [14] reported in their evaluation of the pilot stage of an operational UCC in Antwerp, Belgium that the consolidated deliveries were beneficial for society. However, the UCC did not generate a net societal benefit and was not financially viable due to the lower number of orders and high start-up costs.
2.1.2. Overview of the MAMCA Framework
Unlike other evaluation methods for freight transport solutions, the MAMCA approach involves and incorporates the objectives and views of all stakeholders in the analysis and policy recommendation not only in the early stages, but also throughout the whole evaluation process [28]. It organises the engagement and consultation of stakeholders in a structured and integrated approach to produce suitable and practical outcomes and facilitate successful implementation of the transport project [23]. It enables conducting the evaluation of alternatives of the freight transport solutions per each stakeholder group in addition to the aggregated evaluation for the multi-actor views. This produces evaluation results for each stakeholder group, which could be used to identify the alternative that might be supported the most by all groups. Involving the stakeholders to elicit weights for the criteria offers more insights about the individual decision-making of these stakeholders. The weight of the criteria could be allocated using various methods such as point allocation (100 point-scale) or a pairwise comparison approach using the AHP or ANP methods [22]. The AHP method, which was introduced by Saaty [29], structures the decision problem into a hierarchy and applies a system of pairwise comparison of the decision criteria to determine their weights. The AHP method utilises the mathematical techniques of eigenvectors and eigenvalues to determine the weight of each criterion [29]. Using the AHP method, each set of two criteria is paired and evaluated one-on-one using a 1–9 comparison scale. This process is repeated to pair each criterion with all other criteria to create an evaluation matrix.
However, when using the conventional AHP method, judgements are normally represented by exact or otherwise known as crisp values on the 1–9 comparison scale. The inherent subjectivity of human judgment is often vague, and their uncertain comparisons cannot be wholly represented with crisps values [30]. The authors of [31] argue that the fuzziness and vagueness in MCDA often result in inaccurate comparisons when using the conventional AHP method. Furthermore, it might be more convenient for decision-makers to assign linguistic variables (verbal) for comparisons rather than making crisp-value (numerical) comparisons [32]. Addressing these shortcomings gives rise to the use of fuzzy set theory [33] in MCDA to deal with vagueness in human judgements [34]. The fuzzy set theory requires the definition of a membership function for each verbal judgement [35]. The main concept is that a certain degree of an element belongs to a fuzzy membership set. The membership degrees range from 0 (completely not belonging) to 1 (completely belonging) [36].
The Fuzzy AHP (F-AHP), which was originally developed by Van Laarhoven and Pedrycz [37], complements the conventional AHP method especially when the fuzziness of the decision-makers in a group is taken into consideration. It incorporates fuzzy sets in the pairwise comparison to address the uncertainty and ambiguity associated with the conventional AHP method [38]. Several studies have demonstrated that the F-AHP method produced relatively more accurate results in decision-making than the conventional AHP method [39]. An overview of the several existing techniques of the F-AHP method for the prioritisation of the criteria is presented in [40]. Van Laarhoven and Pedrycz [37] compared fuzzy rations described by triangular membership functions while Buckley [41] used fuzzy weights and fuzzy utility to extend the AHP by the geometric mean method to obtain the fuzzy weight. Chang [42] introduced an approach to handling pairwise comparison scale based on triangular fuzzy numbers (TFNs) followed by introduction of the extent analysis method (EAM) for synthetic extent value of the pairwise comparison [43].
Furthermore, once the criteria weights are determined, any MCDA method could be applied to conduct the multi-criteria analysis of the alternatives. The AHP and PROMETHEE methods have been the most used MCDA methods in previous studies [23]. The PROMETHEE method, which was developed by Vincke and Brans [44] and later improved by Macharis et al. [45], is an outranking method that provides a ranking of several alternatives based on a set of often conflicting criteria. This method presents, visually through a line graph, to what extent the alternative contributes to each stakeholder’s objectives. Moreover, it is considered a relatively simpler ranking approach compared with other methods for multi-criteria analysis [46]. It has been successfully utilised in a large number of decision-making problems in various fields including transport and logistics over the last few years due to its user-friendly application and mathematical properties [47].
2.1.3. Practical Application of the MAMCA Framework
The MAMCA method has been used extensively in the evaluation of freight transport projects in many European cities. For instance, the authors of [48] utilised the MAMCA method to assess various alternative ring ways for a regional freight route in Flanders Region, Belgium. Similarly, the authors of [28] evaluated a demonstration that was set up by Kuehne and Nagel, which is a large multi-modal logistics service provider in Europe, to enable real-time monitoring using GPS of the cargo being transported on trains to Thessaloniki, Greece. The MAMCA results highlighted that the improved supply chain visibility due to the real-time monitoring highly satisfied the objectives of the various stakeholders involved in the multi-modal transport of the cargo. A trial by large food retailer in Brussels to change the timing of deliveries to off-hours for supermarkets was assessed using the MAMCA framework [49]. The stakeholder analysis indicated that the retailer preferred delivery distribution throughout the day while local authorities and citizens preferred morning deliveries.
Moreover, the authors of [26] evaluated the trial of using a mobile transshipment depot developed by TNT Express to conduct last mile deliveries by electrically assisted cargobikes in Brussels, Belgium. The MAMCA results indicated that the mobile depot solution was more suited to serving the objectives of the societal stakeholders, while the objectives of TNT Express, shippers and receivers were better served by the older approach of using freight trucks and delivery vans. However, the findings of this study could have been more useful if the alternatives included a combination of cargobikes and delivery vans. Comparatively, the authors of [50] evaluated alternative delivery schemes involving consolidation and night deliveries for construction logistics of a proposed campus building for the Amsterdam University of Applied Sciences in Netherlands. The MAMA results revealed the alternative delivery schemes were viewed preferably by all stakeholders compared with the current delivery approach of fragmented deliveries. Nevertheless, the generalisability of the findings of this study could be limited due to the inclusion of waterways transport that may not be suitable in other regions.
2.2. Overview of Freight Consolidation Strategies and Eco-Friendly Freight Vehicles
The rise of express and fragmented deliveries contributes to increasing operational challenges to freight carriers to maintain providing cost-effective and efficient delivery services [51]. For freight carriers to maintain offering low-cost and competitive services inside the inner-city area, they need improved coordination of the flows of goods, higher consolidation of freight movement and better multi-organisation cooperation [52]. Freight consolidation strategies offer an alternative and sustainable delivery approach to the challenges associated with last mile delivery [53]. Based on their evaluations of several UCCs in Europe, the authors of [54] highlighted the importance of the ability to scale up and down to reach economy of scale, ability to offer new services, logistics competence to access potential value streams and utilisation of advanced IT system as critical factors for viable UCCs. The UCC concept has been extensively evaluated by a large number of studies from various aspects including: location of the UCC [12,55], before-after assessment [56,57], ex-ante evaluation of the potential of UCC [58,59], social and environmental benefits analysis [14,60], role of public subsidies [61,62], stakeholders involvement and collaboration [49,63], financial viability of the UCC [11,64] and product/commodity type [65,66].
Sustainable delivery fleet should utilise near zero of zero-emission vehicle technologies and alternative fuel in order to reduce externalities and issues of last mile delivery, including emissions, noise, fuel and energy consumption, traffic congestion, traffic accidents and infrastructure degradation [67,68]. This facilitates improved energy efficiency, improved mobility, enhanced quality of life, lower environmental impact and lower total cost of ownership [69,70]. Moreover, the author of [71] suggested that the advancement in Industry 4.0 technologies offers real-time and hyperconnected delivery activities that facilitate more efficient energy consumption and sustainable deliveries. In recent years, there have been an increasing number of trials and experiments, especially in Europe, to utilise eco-friendly freight vehicles including both LCVs and cargobikes to reduce the emissions and externalities of last mile delivery [67]. There are several vehicle technologies for the eco-friendly LCVs that could be used including battery electric, hybrid electric and natural gas-powered delivery vans [72]. The main concerns of battery electric vehicles (BEVs) are the high purchase cost, limited driving range due to restricted capacity of the on-board electric battery, inconvenience of the charging time, and limited payload [68]. However, there are significant advantages that outweigh the disadvantages such as the eco-friendliness, lower running and maintenance costs, relative quietness of the engine and suitability to operate in imposed low-emission zones [73].
Furthermore, several research studies developed mathematical models to assess the potential and merits of using electric delivery vans and cargobikes in addressing negative impacts of last mile delivery. However, it is worth noting that these studies did not involve the objectives of the stakeholders in their analysis. The authors of [74] developed a decision support system using an agent-based simulation and dynamic routing and scheduling solution to investigate and test the impacts of conducting deliveries using conventional delivery vans by a freight carrier and cargobikes by freelancers that utilise micro-transshipment hubs for an application in Vienna, Austria. It was suggested that a fleet with different vehicle types (quadricycles and small vans) and technologies (diesel and electric) would reduce distribution costs of last mile delivery based on their developed fleet size and mix VRP with time windows for electric vehicles [18]. The authors of [75] developed an economic and environmental comparison model between BEVs and diesel delivery vans in European cities. They indicated that BEVs could be more cost-effective than diesel vans, especially in cities with high government subsidies for BEVs, and estimated that replacing new diesel vans with BEVs could achieve a 12–13% reduction in CO2 emissions.
Similarly, the two-echelon city distribution scheme developed by the authors of [76] illustrated that the combined use of delivery vans and cargobikes to perform deliveries in Vienna could achieve reductions in costs and emissions in some settings compared with vans alone. Furthermore, the trial of micro-UCC for office supplies in Central London indicated that the consolidated deliveries using electrically assisted cargobikes contributed to a reduction of 20% in vehicle kilometre travelled (VKT) and 54% in CO2 equivalent emissions [57]. Moreover, Gnewt Cargo, which delivers about 9500 parcels/day from two micro-UCCs in Central London, achieved a reduction of 20% in VKT and 67% in emissions per parcel using a fleet of electric vans and electric tricycles compared to that using conventional delivery vans [77]. Alternatively, the traffic simulation model developed by the authors of [70] estimated that up to 10% of delivery vans could be replaced by cargobikes to conduct last mile delivery with a maximum linear distance of 2 km.
As a conclusion, a great deal of the available academic literature on freight consolidation strategies and eco-friendly freight vehicles was conducted for European cities. A large number of these studies have been performed using ex-post evaluation methods to assess the impacts of these trials and demonstrations. Furthermore, large and growing body of the literature on the potential of eco-friendly freight vehicles has not paid particular attention to the objectives and requirements of the various stakeholders. This study attempts to fill this gap in knowledge by incorporating the perspectives of the stakeholders involved in last mile delivery to assess the optimal delivery fleet for the consolidated delivery in the inner-city area.
3. Methods
MAMCA Framework
The MAMCA approach consists of two main phases. The first phase, which includes four steps, focuses on acquiring the required information about the stakeholders and their objectives. The second stage, which includes three steps, conducts the multi-actor analysis of the alternatives based on the objectives of the stakeholders and proposes suitable implementation plans and policies. The following steps were used to evaluate and rank the most suitable consolidated delivery configurations for the consolidated delivery in the inner-city area [20]:
- 1st Step: Defining problems and identifying the alternative configurations for evaluation.
- 2nd Step: Identifying all stakeholders involved in last mile delivery and determining their objectives.
- 3rd Step: Converting the stakeholders’ objectives to criteria and assigning a weight that indicates the criteria’s importance based on the objective of the stakeholder.
This study applied Chang’s EAM F-AHP approach to calculate the fuzzy weights of the criteria. This approach starts with the use of TFNs for pairwise comparison by means of FAHP scale. Then, the EAM was applied to determine the criteria weights using synthetic extent values. A membership function was constructed for each linguistic term of the comparison scale for each criterion. A fuzzy evaluation matrix of the criteria could thus be theoretically constructed through the pairwise comparison of linguistic variables and respective TFNs as shown in Table 1 and Figure 1 [30,40]. After obtaining the weights for each criterion, they were normalised. Several methods exist to defuzzify the calculated scores. Some of these include the weighted average approach, centre of area (COA) or centroid, mean-max and the first (or last) of maxima membership. This study applied the COA defuzzification method, which is one of the most popular approaches in the literature [78]. For a comprehensive overview of Chang’s EAM F-AHP approach, refer to [31,43]. Accordingly, various key actors from all six stakeholder groups in Melbourne, Australia participated in a questionnaire to select the related linguistic variable to determine the importance levels of the criteria during August–September 2017. All participants gave their informed consent for inclusion before they participated in the study. The study was conducted in accordance with the Declaration of Helsinki, and the protocol was approved by the Ethics Committee of University of Melbourne (Ethics ID 1749808).
- 4th Step: Linking each criterion to a measurable or qualitative indicator to determine a score and measurement scale.
- 5th Step: Using developed indicators to perform the multi-criteria analysis to evaluate the alternatives with respect to the decision criteria.
This study utilised the PROMETHEE method to conduct the multi-criteria analysis of the alternatives. It is based on the calculation of a preference degree, which indicates how an alternative is preferred over another alternative from the decision-maker’s point of view. Each alternative is assessed based on different criteria to construct an evaluation table. Using this evaluation table, the alternatives are compared pairwise with respect to each criterion. The results are expressed by the preference functions, which calculate the difference between the assessments of each two alternatives and provide the preference degree from zero to one [79]. Zero indicates that there is no difference between the pair of the alternatives while 1 indicates a big difference. In addition to the evaluation table, the following information is required to rank the alternatives: the allocated weight of each criterion, the preference function for each criterion and whether the criterion is to be maximized or minimized [79]. Then, the matrix of global preferences is constructed by multiplying the preferences and the criteria weights to determine the outranking degree of the alternatives. A comprehensive overview of the mathematical equations and steps of the PROMETHEE method is provided in [46,47].
- 6th Step: The multi-criteria analysis provides a ranking of the various alternatives as well as highlighting the strengths and weaknesses of the alternatives with respect to their performance on the stakeholders’ criteria. A sensitivity analysis is performed to examine the significance of weight modifications on the final ranking and validate the robustness of the results.
- 7th Step: Clearly defined policy recommendations and implementation plans for optimal alternative should be provided to key decision-makers here to ensure it will be accepted by all stakeholder groups.
4. Case Analysis: Application and Results of MAMCA Framework
Using responses collected from key stakeholders in Melbourne, Australia, the MAMCA framework was applied to assess and select the most optimal and sustainable consolidated delivery fleet for the consolidated delivery in the inner-city area. The following steps were used to evaluate and rank the most suitable consolidated delivery configuration.
4.1. 1st Step: Identifying the Alternatives
The sustainability and financial viability aspects were taken into consideration in proposing the alternatives for the consolidated delivery. As the delivery consolidation policy aims to minimise negative impacts of last mile delivery on the amenity of the inner-city, it is important to include eco-friendly freight vehicles and cargobikes in the proposed alternatives. Starting from the assumption of freight carriers’ propensity for using delivery vans, various consolidated delivery fleet configurations using cargobikes, eco-friendly LCVs and/or freight trucks were proposed to be evaluated and compared with the business-as-usual (BAU) scenario using the MAMCA framework. These alternative configurations were proposed based on extensive evaluation of urban freight industry best practices as follow:
- Scenario #1 “Cargobike”: the consolidated delivery trips are conducted using only cargobikes as the parcel-carrying component.
- Scenario #2 “Eco-friendly LCV + Truck (only off-peak hours)”: the consolidated delivery trips are conducted using eco-friendly LCVs in all times and trucks only during off-peak hours.
- Scenario #3 “Eco-friendly LCV + Cargobike”: the consolidated delivery trips are conducted using eco-friendly LCVs and cargobikes with dedicated on-street loading zones in the inner-city area.
- Scenario #4 “BAU”: BAU where carriers deliver directly to the receivers using LCVs and trucks with no consolidation or coordination between the carriers.
4.2. 2nd and 3rd Step: Identifying Stakeholders and the Criteria Weights
Based on extensive desktop research to evaluate the literature on last mile delivery, six categories of stakeholders were considered for consideration in the MAMCA. An initial list of the objectives for each stakeholder group was developed. It was important for the respective objectives for each stakeholder group to be relevant, practical and encompassing daily operations and requirements. It can be argued that many previous studies that utilised MAMCA focused more on the environmental and social objectives and failed to pay the same attention to operational objectives. Accordingly, the list was discussed and assessed during visits and meetings with key organisations and actors from the stakeholder groups in Melbourne including Transport for Victoria, City of Melbourne’s Retail Strategy Group and leading freight carriers. Accordingly, the stakeholders’ objectives were updated based on discussion and feedback from key actors. Table 2 displays the final objectives of all the stakeholders and the weight of the criteria for each stakeholder group obtained by the F-AHP method.
The stakeholder groups are the logistics services providers (LSPs), receivers, shippers, local authorities, and citizens in addition to logistics property providers (LPPs). The LPP stakeholder group has not been frequently included in similar studies. LPPs are emerging as a significant stakeholder as they develop and lease facilities for logistics activities. Most commercial facilities in the inner-city area are usually leased for other uses, such as parking, showrooms, wholesale, and maintenance and repair. These providers scarcely offer to lease facilities in the inner-city area for warehousing and distribution activities as they could capitalise the return on investment by leasing them for other profitable commercial uses. Thus, it is important to involve the LPP in the MAMCA analysis to acquire their perspective on the proposed consolidation policy. The LSP stakeholder group includes freight carriers delivering and picking up parcels from shippers to receivers, the potential carrier of consolidated deliveries as well as freight forwarders that organise the delivery service. Receivers in the inner-city area are primarily retailers, wholesalers, offices, medical, education and government establishments as well as residents and workers. This significantly diverse mix of receivers typically has different delivery requirements and product/service ranges.
Cost of delivering/receiving the parcel represented the most important criterion for LSPs and receivers with respective weights of 27.03% and 35.17%. These stakeholders are very interested in reducing the transportation cost of delivering and receiving the parcels. For shippers, the most important criterion was receiver satisfaction with a weight of 35.39%. This could be attributed to shippers aiming to provide high-level service to their customers (the receivers). Delivery lead time was considered a very important criterion for both LSPs and shippers as these stakeholders aim to minimise the total duration between picking up and delivering the parcel as much as operationally possible. Consistent exchange of delivery documents and updates represented 3rd and 4th most important criterion for receivers and shippers. This criterion might affect the likely participation of freight carriers and receivers in the delivery consolidation policy as it impacts the service level between these stakeholders.
For local authorities and citizens, liveability of the inner-city area represented the most important criterion with respective weights of 35.52% and 47.19%. These stakeholders are very interested in improving the amenity of the inner-city area and the large presence of freight vehicles is a key issue. This was supported by urban accessibility and traffic safety being the 2nd most important criterion for these stakeholder groups respectively. For LPPs, profitability was the most important criterion with a weight of 44.74% as this stakeholder group aims to maximise profit of the commercial property leased as a consolidation facility (CF). Surprisingly, this stakeholder group indicated a high importance on the sustainable integration of the commercial property with surrounding uses in the area. This could be attributed to companies in this stakeholder group aiming to reduce negative impacts on urban environment and citizens and enhance the corporate social responsibility of the company. Low importance was assigned to connectivity and utilisation of transport infrastructure by participants from the local authorities and LPPs, which might be expected as these stakeholders were more interested in sustainability and profitability, respectively.
4.3. 4th Step and 5th Step: Indicators and Multi-Criteria Analysis of Alternatives
Many of the criteria displayed in Table 2, such as harmonious integration, convenient delivery and network utilisation, cannot be expressed in numbers. Furthermore, there was a lack of quantitative data from the local freight industry for many of these criteria. This issue was overcome due to the strengths of MAMCA framework not requiring availability of quantitative criterion to conduct the multi-criteria analysis of the alternatives as asserted by the authors of [24]. Accordingly, the qualitative indicators and units of measurement were acquired through comprehensive literature review and several consultation sessions with experts in the freight industry in Melbourne. Once the criteria weights were determined by the F-AHP method in the 3rd step, the MAMCATM software [80] was utilised to determine the overall evaluation scores of all the alternatives for each stakeholder group based on the PROMETHEE method. Experts from the local freight industry, key retailers, local authorities and the researchers participated in interactive sessions to perform the multi-criteria analysis of the alternatives with respect to stakeholders’ criteria. The evaluation scale used in the PROMETHEE method to perform the multi-criteria analysis of the four scenarios was qualitative (very negative, negative, slightly negative, neutral, slightly positive, positive, and very positive).
The MAMCATM software, which was developed by the Mobility, Logistics and Automotive Technology Research Centre (MOBI) at Vrije Universiteit Brussel, could be accessed online after obtaining a login credential at https://www.mamca.be. The user-friendly interface, which is developed in Java and PHP, enables the evaluator to define the alternatives of the project and the decision criteria as well as determining their priority weights by inviting the stakeholders to participate using the AHP method if necessary. The evaluator could perform the multi-stakeholder analysis of the alternatives by either the PROMETHEE or AHP method. Moreover, the results of the multi- and mono-stakeholder analysis are illustrated in figures that could be exported to offline options.
4.4. 6th Step: Results and Ranking of Alternatives
4.4.1. Multi-Actor Perspectives
The evaluation of the alternatives using the PROMETHEE method in the 5th step provided an evaluation score for each alternative for the six stakeholder groups. The multi-actor view of the alternative configurations of the consolidated delivery is displayed in Figure 2. The “Eco-friendly LCV + Cargobike” (3rd) scenario has achieved a relatively high evaluation score by all the stakeholder groups especially. The “Eco-friendly LCV + Truck” (2nd) scenario obtained good evaluation scores by the LPPs, receivers and shippers while citizens and local authorities did not view this scenario as favourable due to the inclusion of trucks. The “Cargobike” (1st) scenario received significantly different views from the six stakeholder groups. This scenario achieved the highest evaluation score for citizens and local authority. However, it achieved the lowest evaluation score for LSPs, receivers and shippers, as it would negatively impact the profitability and the service level of the freight carriers due to the restricted capacity of the cargobikes compared with freight vehicles. This is in contrast with the “BAU” scenario as it was viewed very poorly by the citizens and local authorities. It is interesting that the LSP stakeholder group viewed this scenario more favourable than the 1st and 2nd scenarios. This could be justified due to the additional transport cost resulting from the exclusive use of cargobikes and time-restricted use of trucks only during off-peak hours in the 2nd scenario. Moreover, LSPs preferred the 3rd scenario over the 2nd scenario as the time-restricted use of trucks would impact the efficiency and reliability of their delivery since receivers might not welcome off-peak deliveries without any incentives.
4.4.2. Mono-Actor Analysis
More insights can be obtained from the mono-actor analysis for each stakeholder group with respect to their individual views on the alternatives’ performance on each criterion. Figure 3 illustrates the evaluation scores of each alternative for the LSPs with respect to each criterion. The alternatives are indicated by the four coloured lines while the criteria weights are represented by the vertical bars shown in the horizontal axis. The scale in the left vertical axis indicates evaluation scores of the scenarios while the right vertical axis displays the criteria weights. While the overall performance scores displayed in Figure 2 for the 3rd and “BAU” scenarios with respect to the LSPs are very close, the performance of these two scenarios on each criterion is quite different as displayed in Figure 3. It is noteworthy that the “BAU” scenario performed significantly higher with respect to the vehicle fill-rate, transport cost and delivery security criteria while it was viewed poorly with respect to the multi-modality and delivery lead time criteria. Transport cost was the most important criterion for the LSPs, which might explain why the BAU received a higher overall evaluation score by the LSPs compared to those by the other stakeholder groups.
On the contrary, the 3rd scenario was viewed poorly with respect to the vehicle fill-rate and delivery security criteria, even though this scenario received the highest overall performance score for the LSPs. This might be a result of its superior performance on the delivery lead time and service level, which were the 2nd and 3rd most important criteria for this group. Moreover, the 2nd scenario received a higher evaluation score compared with the 3rd scenario with respect to the vehicle fill-rate, transport cost and delivery security criteria. However, these two scenarios were viewed more favourable compared with the BAU scenario with respect to the service level criterion, as the utilisation of eco-friendly LCVs might satisfy the sustainability interest of the receivers and shippers. Another advantage of the 3rd scenario compared to other scenarios was that it promotes multi-modality. It could be summarised that the “BAU” scenario is more favourable for the LSP stakeholder group from the economical and operational aspects, while the 3rd scenario is more suitable from the societal and sustainable aspects.
Similarly, Figure 4 illustrates the evaluation scores of each alternative for the receivers with respect to each criterion. The 2nd scenario was viewed more favourable compared with the other two scenarios with respect to the parcel delivery cost, which was considered the most important criterion for the receivers. This explains the high overall evaluation score for this scenario for the group, even though this scenario was not viewed as favourable with respect to the other criteria. Receivers believe that the use of cargobikes might negatively impact the delivery security and increase the delivery cost. However, the high evaluation score for the 3rd scenario with respect to the delivery punctuality criterion, which was the 2nd most important criterion, suggested that receivers believe utilisation of cargobikes facilitates quicker and more efficient deliveries in the congested inner-city area. In contrast, the 2nd and “BAU” scenarios received very low scores for this criterion. This could be attributed to the difficulty of finding parking and loading spaces for trucks, which would negatively impact the freight couriers’ efficiency and on-time deliveries.
Moreover, the 1st and 3rd scenarios received high scores for the business environment attractiveness since they facilitate reducing the presence of freight trucks. An interesting observation was the high evaluation score assigned to the 3rd scenario compared to the low score assigned to the “Cargobike” scenario for the delivery status criterion. This could be attributed to the fact that eco-friendly LCVs can deliver larger volumes of parcels compared with cargobikes and result in a smaller number of deliveries, which contribute to more efficient tracking and delivery updates. As the 2nd scenario promotes the use of trucks during off-peak hours, receivers viewed this scenario more favourable with respect to the convenient delivery criterion, which encourages distributing the deliveries during off-peak hours to avoid disrupting staff’s activities. The “Cargobike” and “BAU” scenarios received similar overall evaluation scores by the receivers even though they were viewed completely different with respect to each criterion, as can be seen in the peaks and roughs in Figure 4. While the 3rd scenario received low scores for the parcel delivery cost and delivery security criteria, this scenario might be the most suitable scenario for receivers due to its superior performance in the other criteria.
Figure 5 displays the evaluation scores of the alternatives for the mono-actor analysis for the shippers, which revealed slightly different views on the alternatives as their evaluation scores were much closer, except for the “Cargobike” scenario. It was expected that the “BAU” scenario would receive a high evaluation score for the delivery cost criteria, which represented the 2nd most important criterion for this group. However, it was remarkable that shippers ranked this scenario as the best option for the carrier’s availability criterion, which might suggest that shippers have doubts on cargobikes’ ability to provide continuous supply of delivery services. Similarly, the 3rd scenario and the “BAU” scenarios were ranked as the best two scenarios for the quick delivery criterion, which was the 3rd most important criterion. The time-limited use of trucks only during off-peak hours in the 2nd scenario contributed to the low rank for this scenario in the delivery lead time and carrier’s availability criteria. Furthermore, shippers ranked scenarios that utilised cargobikes (1st and 3rd scenarios) quite favourably for the receiver satisfaction criterion, which was the most important criterion. As this criterion was highly important for the shippers group, the “BAU” scenario overall evaluation score was not high, even though this scenario received higher scores in the other group’s criteria. For the delivery documentation criterion, the 3rd and 2nd scenario received very high scores compared with the “Cargobike” scenario and “BAU” scenario.
The results of the mono-actor analysis for the LPPs are illustrated in Figure 6. As profitability represented the most important criterion for this group, scenarios that utilised eco-friendly LCVs (2nd and 3rd scenarios) were ranked quite high while the “BAU” scenario was ranked as the worst for this criterion. This high ranking could be attributed to the notion that using eco-friendly LCVs for the consolidated delivery would make the facility more accepted for businesses and societal stakeholders, which would increase the attractiveness and leasing opportunity for the facility. Furthermore, the 1st and 3rd scenarios received high evaluation scores with respect to the repair & maintenance cost and harmonious integration criteria as they reduce the presence of freight trucks, which would minimise damage and deterioration to the CF. It is noteworthy that the “BAU” scenario was ranked high for the location accessibility criterion. For this criterion, the LPPs aim to have the facility closer to major freight corridors, which are mainly used by freight trucks. However, satisfying this objective would not guarantee excellent connectivity to the cycling infrastructure as well. This is validated by the low ranking of the 1st and 3rd scenario, which involve cargobikes, compared with the high ranking of the 2nd scenario with respect to this criterion. It is clear that scenarios that address environmental aspects, which were the 1st, 2nd and 3rd scenarios, were viewed more favourable by this stakeholder group compared with the “BAU” scenario.
The scenarios that addressed the socio-environmental concerns were ranked very high by the local authorities, as can be seen in the results of the mono-actor analysis illustrated in Figure 7. The 1st and 3rd scenarios, which facilitate eliminating freight trucks in the inner-city area, received very high evaluation scores for the urban accessibility, liveable city and impact on surroundings criteria. The inclusion of the cargobikes in the 3rd scenario contributed to this scenario being ranked 2nd preferred scenario for the impact on the surroundings criterion. Since the 2nd scenario involved trucks during the off-peak hours, it was not viewed very favourably by this stakeholder group with respect to these criteria. On the contrary, it was striking that the 2nd and “BAU” scenarios were ranked as the 1st and 2nd best alternatives with respect to the network utilisation criterion for the local authorities. This could be attributed to the concerns of local authorities that cargobikes might place more pressure on the cycling infrastructure that is already significantly used by residents while the 2nd and “BAU” scenarios could use major roads for the deliveries. However, it was striking that the 2nd scenario was ranked higher than 3rd scenario for the low-cost measure criterion, which was the 3rd most important criterion. This was unexpected, and it could be attributed to the notion that setting up the infrastructure for the 2nd scenario would be less costly than the 3rd scenario since freight carriers already utilised freight trucks. For this stakeholder group, the “Cargobike” was clearly the most preferred scenario, followed by the 3rd scenario.
Figure 8 clearly illustrates the superiority of the “Cargobike” scenario in satisfying the objectives of the citizens stakeholder group. For the quality of life criterion, which was the most important criterion for this stakeholder group, this scenario achieved a very high evaluation score and was followed by the 3rd and 2nd scenarios. The views were similar for the traffic safety criterion, which was the 2nd most important for this group. The “BAU” scenario received a very low evaluation score for these two criteria as expected. Residents and workers prefer the consolidated delivery to be conducted with very limited presence of freight vehicles to enhance the amenity of the inner-city area. Furthermore, the mono-actor analysis revealed that the preference margin between the “Cargobike” scenario versus the 2nd and 3rd scenarios is quite wider than the results indicated by the other stakeholder groups. It was striking that the Cargobike scenario was ranked as the 3rd best scenario for the product availability criterion following the 3rd and 2nd scenarios. This suggested that this stakeholder group might believe it would be operationally difficult for freight carriers to maintain delivering products using only cargobikes. Similar to the local authority stakeholder group, the most preferred scenario for the citizen group was the “Cargobike” scenario followed by the 3rd scenario.
4.4.3. Sensitivity Analysis
A sensitivity analysis was performed to examine the significance of modifying the criteria weights on the ranking of the four scenarios and validate the robustness of the results. The weights of the most important criteria were changed for the six stakeholder groups to determine any changes on ranking of the scenarios in the multi-actor analysis. Table 3 highlights the changes that were applied to the criteria weights for each stakeholder group and the resulting changes on the ranking and evaluation score of the alternatives.
For the LSP group, the criteria weight of transport cost and delivery lead time were changed to reflect the higher value that freight carriers might place with respect to these criteria. For the receivers group, the criteria weights of delivery punctuality” and convenient deliveries were changed as some receivers might view on-time and convenient deliveries as important as cost of the delivery itself. For the shippers group, the criteria weights of delivery cost and receiver satisfaction were changed as some shippers might place relatively more importance on delivery cost than receiver satisfaction. However, the ranking and evaluation scores of the four scenarios did not change for these three groups.
For the LPP group, the criteria weights of repair and maintenance cost”, location accessibility and harmonious integration were changed as some commercial property providers might not view the sustainable utilisation of the facility as important as efficiency and profitability of the facility. The only noticeable change was the slight drop in the evaluation score of “Cargobike” scenario. This could be attributed to the “Cargobike” scenario receiving the highest score for the harmonious integration criterion. For the local authority group, the criteria weights of low-cost measure and network utilisation criteria were changed as some local authorities might place more importance on the cost of the transport projects and enhanced utilisation of the transport network in their planning and decision-making. However, the ranking and evaluation scores of the four scenarios were consistent with previous results. For the citizens group, the criterion weight of the product availability” was changed to reflect the importance of product availability to other members in the citizens stakeholder group. There was a slight decrease in the overall evaluation score for the “Cargobike” scenario. This could be attributed to the concern that cargobikes might impact product availability.
5. Discussion and Policy Recommendations
5.1. Discussion of the Multi-Stakeholder Analysis
The results of the multi-criteria analysis of the four scenarios highlighted the strengths and weaknesses of the alternatives with respect to their performance on the stakeholders’ criteria. The sensitivity analysis validated the robustness of the results as altering the criteria weights for the stakeholder groups did not significantly change the ranking and evaluation scores of the four scenarios.
The high evaluation score for the “BAU” scenario by the LSPs suggests that while they might be interested in eco-friendly freight vehicles, they still prefer the current situation of using LCVs and trucks due to their competitive delivery cost. This highlights the need for planners and policy makers to set supporting policies and measures that address the operational and economic concerns of the freight carriers in proposed freight consolidation policies. Moreover, the mono-actor analysis of the LSPs further explains why the LSP group might prefer to keep the current situation and are reluctant to use cargobikes due to their negative impact on the service level, efficiency and cost of their delivery activities. This is in contrast with the view of the citizen and local authorities as they prefer to change the current situation and use cargobikes. Thus, policy-makers should consider supporting measures such as issuing favourable vehicle access permits and use of dedicated on-street loading zones to encourage the operator of the CF to utilise cargobikes and eco-friendly LCVs. This would enhance the efficiency of the consolidated deliveries, which might help compensate for the added transport cost of using cargobikes.
While receivers and shippers might be attracted to the environmental benefits of cargobike deliveries, they might be concerned about safety of the delivery and the additional transport cost. As shippers are more primarily concerned about satisfying the receivers, it was striking that they had very similar overall evaluation scores for the 2nd scenario (“Eco-friendly LCV + Truck”) and “BAU” scenario. This could be explained by their high interest in reducing the delivery cost to receivers. For the LPP group, the 3rd scenario (“Eco-friendly LCV + Cargobike”) was preferred over the 1st scenario (“Cargobike”). This might be attributed to the notion that there might be a financial risk by investing and setting up a facility only for cargobikes that might not be suitable for other potential commercial users. The 3rd scenarios received more positive and consistent preferences among all stakeholder groups. The use of eco-friendly LCVs addresses the sustainable interests of citizens, local authorities and LPPs while presenting LSPs, receivers and shippers with a delivery fleet that serves their operational requirements in a balanced approach.
This study included a more comprehensive breakdown of the stakeholder groups than other studies as it focused on logistics property developers, which was overlooked in previous studies. Moreover, this study incorporated different categories for the stakeholder objectives as more attention was paid to operational criteria than similar studies. The criteria weights obtained from the stakeholders as illustrated in Table 1 revealed somewhat contrasting views compared with similar criteria in previous European studies that utilised the MAMCA framework for freight projects. For instance, the transport cost was considered as the most important criterion for the LSP group while high-level service and viability of investment were the most important criteria in the studies conducted in Thessaloniki [28], Brussels [26] and Amsterdam [50]. However, delivery cost was viewed more importantly by the receivers group in the Thessaloniki and Brussels studies (61% and 47%, respectively) than the 35% allocated to this criterion in this study. A relatively different view was that the LSP group in most of the European studies paid more attention to employee satisfaction and green concern than the LSP group in this study. For the shippers group, the views were consistent with this study as offering high service value to receivers was viewed as the most important criterion in other studies. For the local authorities group, it was interesting to observe that cost of the measure was not viewed as important in other studies by the local authorities, which focused more on the quality of life criterion.
The multi-actor evaluation of the four scenarios achieved somewhat different rankings and views from those of similar scenarios in other studies. For example, both LSP groups in the Brussels’ study and this study had a high evaluation score for the “BAU” scenario while the LSP group in the Amsterdam study had a very low preference for this scenario. The eco-friendly scenario in the Amsterdam study was not viewed as favourable by the local authorities and citizens groups as they viewed water deliveries more useful. It is important to highlight that other studies attempted to evaluate different freight policies. However, it can be argued that comparing the results of this study to their results further highlights the heterogeneity of stakeholders’ views and complexity of decision-making with respect to freight policies.
Due to the participatory nature of this study, there are a few limitations that should be noted. While every effort has been made to identify the most important decision criteria that contribute to selecting most suitable and sustainable delivery fleet, other objectives not included may also be influential to respective stakeholder views and preferences. Moreover, the calculated criteria weights are sensitive and dependent on the views of the key actors that participated in the pairwise comparison. However, the inclusion of a sufficient number of actors from each stakeholder group ensured that different and representative views were sourced for the pairwise comparison. The multi-actor analysis was primarily performed using qualitative indicators, which might limit the generalisability of some of the results presented in this study. While the stakeholder engagement was conducted with stakeholders in Melbourne and the results can only allow for inferences in the area conducted; however, this study does provide relevant and transferrable insights for other regions considering freight consolidation policies.
5.2. Implemantion Plan and Policy Recommendation
The results of the MAMCA framework suggest that the “Eco-friendly LCV + Cargobike” scenario is very likely to receive overall support from all the stakeholders. Accordingly, this last step in the MAMCA framework presents a suitable implementation plan that allows the decision-makers to select the most suitable type of eco-friendly LCVs and cargobikes. There are several vehicle technologies for the eco-friendly LCVs that could be used including battery electric, hybrid electric and natural gas-powered delivery vans. Table 4 displays the main features of the top eco-friendly LCVs available in the Global markets.
As the proposed consolidated deliveries would not travel over a large geographical area in the inner-city area, the limited driving range of the BEV’s battery would not be a major concern. Consequently, it is recommended that the carrier of the consolidated delivery utilises a BEV for the consolidated distribution activities. The Voltia eNV200 Maxi is an excellent vehicle for the small–medium LCV range due to its superior loading capacity and relatively competitive price. For the large LCV range, the Renault Master ZE represents a suitable option, even though its purchase cost is quite high. However, its large loading capacity will enable delivering a larger number of parcels in a single delivery round compared with a smaller BEV.
The utilisation of BEVs requires many operational, technological and infrastructural changes and policies. The parcel volume and receivers’ delivery requirement need to be balanced with the somewhat limited load capacity of the BEV to ensure maintaining a high service and efficient distribution activities by the carrier of the consolidated delivery. Consequently, the delivery rounds should be planned more efficiently to ensure that the consolidation and distribution cost per parcel will not be significantly high. Similarly, the recharging schedule of the vehicles needs to be managed efficiently to minimise disrupting the fleet operations. Due to the close proximity of the CF to the inner-city area, depot-based slow-charging stations should be established at the facility to enhance the efficiency and reliability of the BEVs. Fast-charging stations might present a quick charging option at the depot. However, their infrastructure is significantly more expensive than that of slow-charging stations. Furthermore, it is important to schedule full recharge of these vehicles during an inactive period to ensure that the vehicles are always ready for distribution activities. Due to the advanced technologies of the BEVs, the drivers need to be trained properly on the recharging of the battery as well as the operational constraints of the vehicle. It is recommended that drivers of BEVs should be more technology-savvy and qualified than drivers of traditional vehicles.
Furthermore, local authorities are recommended to consider providing financial and non-financial incentives to the carrier of the consolidated delivery to promote the use of BEV. The financial incentives include purchasing subsidies and lower registration fees to reduce the purchase cost, exemption from toll charges and congestion charges. Moreover, local authorities should consider setting supporting policies that would enhance the efficiency and reliability of the BEV in the inner-city area. These supportive policies include establishing publicly accessible charging stations, prioritised use of on-street parking and loading spaces, longer access time windows and favourable access to use pedestrian zones for loading activities. The public charging stations in the inner-city area will enhance the usability of the BEVs and reduce the risk that the vehicles might stop their distribution activities due to low battery. Moreover, the favourable access policies will make the distribution activity of the consolidation delivery more efficient and compensate some of the operational constraints of the BEV.
Similarly, there are different types of cargobikes that can be utilised for the consolidated deliveries including front-loading long-wheelbase bikes, boxes or trike bikes, four-wheel electrically assisted bikes. It is important to select the cargobikes that facilitate larger load volume and more efficient delivery rounds. The four-wheel electrically assisted cargobike represent the most suitable cargobike. This type of cargobike has an attached container that can carry loads up to 150 km or 1 m3 [77]. The cyclist can comfortably ride this bike daily up to 50 km to deliver parcels in the inner-city area. These cargobikes should complement and assist the electric LCVs. They present the carrier of the consolidated delivery with reliable and quick access to receivers in very congested parts in the inner-city area where BEVs might have operational difficulties. Moreover, the carrier could utilise these cargobikes for deliveries during restricted time windows for the BEVs.
Figure 9 illustrates the proposed layout of the CF that incorporate the most optimal delivery configuration based on the MAMCA results. Furthermore, the proposed layout was discussed with experts from leading freight carriers to ensure reflecting the operational requirements and best practices of the freight industry. It is essential for the facility to have a high floor-to-ceiling height to accommodate receiving deliveries from participating freight carriers using articulated and heavy rigid trucks. It is recommended to separate the parking bays designated for freight vehicles of participating freight carriers from the loading bays of the CF BEVs and cargobikes. This facilitates easy ingress and egress and efficient traffic flow of the vehicles within the facility.
The number of parking bays for the CF BEVs and cargobikes depends on the facility daily throughput (number of parcels/day) and the configurations of the delivery rounds. The handling and sorting area for the incoming parcels should be adjacent to both zones of parking/loading bays to facilitate efficient and quick transfer of the incoming parcels. The inner-city area is divided into the number of delivery destination zones, which will depend on the number of receivers and configuration of delivery rounds. Each BEV and cargobike will be assigned to a specific delivery destination zone within the inner-city area, which they will deliver to on a daily basis. This helps the drivers get familiar with the area and the receivers. The number of delivery rounds for each BEV and cargobike will depend on the load capacity of the vehicle, delivery volume and requirements of the receiver as well as the operational practices and safety regulations of the local freight industry.
The participating freight carriers will bring their parcels to the CF on delivery vans and/or trucks preferably during the early morning hours. The incoming parcels should be loaded on pallets. Depending on the size and volume of parcels, each pallet can contain up to 50 units. This will reduce the delivery cost per parcel due to the lower delivery cost of palletised parcels. If the incoming parcels are broken in individual shipments, there will be no cost saved for the freight carriers and the CF carrier. Moreover, the incoming parcels will be offloaded and transferred to the handling and sorting area using forklifts and/or jack pallets. The parcels will be sorted and bundled for each designated delivery zone and moved to loading bays of the BEV and cargobikes using cage trolleys or containers. Each cage trolley contains bundled parcels for a specific BEV or cargobike that are addressed to neighbouring receivers within their designated delivery zone. Consequently, the driver of the BEV or the cargobike will sort and sequence the parcels into their vehicle from the transferred cage trolley or containers for each delivery round. Moreover, the hand-held scanning devices should allow for instant connectivity and information transfer to enable real-time tracking of the parcels and facilitate efficient delivery updates for both freight carriers and receivers.
6. Conclusions
Successful delivery consolidation strategies could be a trade-off between transshipment and distribution costs, externalities, the interest of stakeholders and the formulation of required and supporting regulations and incentives. At the end, the various stakeholders need to take these aspects into consideration when assessing and selecting the type and mix of freight vehicles to perform the consolidated deliveries in the congested inner-city area, which underlines the difficulties associated with freight consolidation policies. Consequently, the optimal configuration for the consolidated delivery fleet should address the sustainable, societal, economic and operational objectives and requirements by all the stakeholders in a balanced approach.
This paper utilised the MAMCA framework to evaluate the suitability and practicality of various freight vehicles to conduct the consolidated deliveries in the inner-city area with respect to their potential in achieving the various objectives of all stakeholders involved in last mile delivery. The researchers made a strenuous effort to ensure including relevant and practical objectives that might be very important in reality for the stakeholders in their decision-making with respect to freight consolidation policies. The allocated criteria weights highlighted how stakeholders differed in their perspectives on the optimal delivery fleet for the consolidated deliveries. Different stakeholder groups assigned conflicting scores for shared objectives. However, some criteria were prevalent for most stakeholders, primarily the transport cost for business stakeholders and liveability for societal stakeholders.
The multi-criteria analysis produced a ranking of the various alternatives as well as in-depth understanding of how each alternative was viewed by each stakeholder group. This clearly highlighted how the objectives of the six stakeholder groups result in different and clashing views of each alternative. The study attempted to delve more into the mono-actor analysis than other studies that utilised the MAMCA framework to acquire more individual perspectives from the clashing stakeholders. The mono-actor analysis provided new insights on why some business stakeholders might reject cargobikes as they adversely affect the efficiency of their operations. An important lesson is that there is no single solution that could address or satisfy all the objectives of all the various stakeholders. This further raises the need for researchers and policy-makers to avoid focusing only on most visible or influential stakeholders in last mile delivery and ensure incorporating the objectives and requirements of all stakeholders. The combined use of eco-friendly delivery vans and cargobikes represented the consolidated delivery fleet configuration with the best chance of receiving consensus based on all the stakeholders’ preferences. It offered a sustainable delivery fleet that addresses the concerns and requirements of all stakeholder groups. Performing consolidated deliveries in the inner-city area using battery electric delivery vans and cargobikes contributes to reducing emissions, noise and traffic congestion around receivers, especially in heavily dense and congested areas. This enhances the amenity of the area and quality of life for customers, retailers and residents.
The insights and perspectives on the four scenarios acquired from the six stakeholder groups by the MAMCA framework provide the local authorities and transport scholars with valuable information that could be used to formulate suitable and sustainable freight solutions and policies to address the challenges and negative impacts of last mile delivery in the inner-city area. The participatory decision support approach could be utilised by local authorities to act proactively and set policies that promote and support freight carriers to utilise eco-friendly vehicles. It is recommended that local authorities assess the merits and associated costs of applying the implementation plan to set up a suitable CF and establish a Public Private Partnership (PPP) with a leading freight carrier to operate the CF. The PPP agreement should set clear objectives and performance-zoning codes to be met by the CF operator to perform the consolidated deliveries BEVs and cargobikes to receivers in the inner-city area.
Due to the inclusion of the perspectives of local authorities and citizens, local authorities could use this framework as a lobbying tool to justify preserving industrial lands and setting supporting policies to establish future consolidation facilities in the inner-city area. Managers of delivery companies could utilise the proposed implementation plan for setting up and operating suitable and sustainable consolidation facilities in the congested central city area that takes into consideration their operational and locational requirements as well as sustainable delivery fleet. In order to reduce the additional transshipment and consolidation costs, it is essential for participating freight carriers to increase the vehicle fill-rate of their incoming vehicles to the CF through palletisation of parcels and the use of large trucks.
Author Contributions
Conceptualization, K.A. and R.G.T.; methodology, K.A. and R.G.T.; data curation, K.A.; project administration, R.G.T.; investigation, K.A.; formal analysis, K.A.; writing of the original draft, K.A.; writing of review and editing, K.A. and R.G.T.; supervision, R.G.T.
Funding
This research received no external funding.
Acknowledgements
The primary author (Khalid Aljohani) would like to extend his gratitude to University of Jeddah, Saudi Arabia for the financial support in his PhD research scholarship, part of which is the research presented herein. The authors express their gratitude to the MOBI Research Centre (Vrije Universiteit Brussel) for the access to use the MAMCA Software. The authors express their gratitude to the Volvo REF Center of Excellence for Sustainable Urban Freight Systems (CoE-SUFS) for their financial support to cover the article-processing charge to publish this article.
Conflicts of Interest
The authors declare no conflicts of interest.
References
- Antún, J.P.; Reis, V.; Macário, R. Strategies to Improve Urban Freight Logistics in Historical Centers: The Cases of Lisbon and Mexico City. In City Logistics 3: Towards Sustainable and Liveable Cities; Taniguchi, E., Thompson, R., Eds.; Wiley-ISTE: London, UK, 2018; pp. 349–366. ISBN 978-1119-52772-5. [Google Scholar]
- Quak, H. Sustainability of Urban Freight Transport—Retail Distribution and Local Regulations in Cities. Ph.D. Thesis, Erasmus University, Rotterdam, The Netherlands, 2007. [Google Scholar]
- Aljohani, K.; Thompson, R.G. Impacts of logistics sprawl on the urban environment and logistics: Taxonomy and review of literature. J. Transp. Geogr. 2016, 57, 255–263. [Google Scholar] [CrossRef]
- Aljohani, K.; Thompson, R.G. Optimising the Establishment of Inner-city Transshipment Facility to Ameliorate Last Mile Delivery: A Case Study in Melbourne CBD. In City Logistics 3: Towards Sustainable and Liveable Cities; Taniguchi, E., Thompson, R., Eds.; Wiley-ISTE: London, UK, 2018; pp. 349–366. ISBN 978-1119-52772-5. [Google Scholar]
- Browne, M.; Allen, J.; Nemoto, T.; Patier, D.; Visser, J. Reducing social and environmental impacts of urban freight transport: A review of some major cities. Procedia-Soc. Behav. Sci. 2012, 39, 19–33. [Google Scholar] [CrossRef]
- Allen, J.; Piecyk, M.; Piotrowska, M.; McLeod, F.; Cherrett, T.; Ghali, K.; Nguyen, T.; Bektas, T.; Bates, O.; Friday, A.; et al. Understanding the impact of e-commerce on last-mile light goods vehicle activity in urban areas: The case of London. Transp. Res. Part D Transp. Environ. 2017, 61, 325–338. [Google Scholar] [CrossRef]
- United Nations Human Settlements Programme (UN-Habitat). Planning and Design for Sustainable Urban Mobility: Global Report on Human Settlements; Routledge: New York, NY, USA, 2013; pp. 57–73. [Google Scholar]
- Arvidsson, N.; Pazirandeh, A. An ex ante evaluation of mobile depots in cities: A sustainability perspective. Int. J. Sustain. Transp. 2017, 11, 623–632. [Google Scholar] [CrossRef]
- Zanni, A.M.; Bristow, A.L. Emissions of CO2 from road freight transport in London: Trends and policies for long run reductions. Energy Policy 2010, 38, 1774–1786. [Google Scholar] [CrossRef]
- Edwards, J.B.; McKinnon, A.C.; Cullinane, S.L. Comparative analysis of the carbon footprints of conventional and online retailing: A “last mile” perspective. Int. J. Phys. Distrib. Logist. Manag. 2010, 40, 103–123. [Google Scholar] [CrossRef]
- Janjevic, M.; Ndiaye, A. Investigating the financial viability of urban consolidation centre projects. Res. Transp. Bus. Manag. 2017, 24, 101–113. [Google Scholar] [CrossRef]
- Browne, M.; Sweet, M.; Woodburn, A.; Allen, J. Urban Freight Consolidation Centres Final Report. Transport Studies Group, University of Westminster, Report for Department for Transport (Dft) 2005. Available online: http://ukerc.rl.ac.uk/pdf/RR3_Urban_Freight_Consolidation_Centre_Report.pdf (accessed on 10 January 2018).
- Allen, J.; Browne, M.; Woodburn, A.; Leonardi, J. A review of urban consolidation centres in the supply chain based on a case study approach. Supply Chain Forum 2014, 15, 100–112. [Google Scholar] [CrossRef]
- Kin, B.; Verlinde, S.; van Lier, T.; Macharis, C. Is there life after subsidy for an urban consolidation centre? An investigation of the total costs and benefits of a privately-initiated concept. Transp. Res. Procedia 2016, 12, 357–369. [Google Scholar] [CrossRef]
- Van Duin, J.H.R.; van Dam, T.; Wiegmans, B.; Tavasszy, L.A. Understanding financial viability of urban consolidation centres: Regent street (London), Bristol/Bath & Nijmegen. Transp. Res. Procedia 2016, 16, 61–80. [Google Scholar] [CrossRef]
- Lagorio, A.; Pinto, R.; Golini, R. Urban Distribution Centers: Doomed to fail or optimal solutions for last mile deliveries? In Proceedings of the 21st Summer School Francesco Turco, Naples, Italy, 13–15 September 2016; pp. 220–224. [Google Scholar]
- Simoni, M.D.; Bujanovic, P.; Boyles, S.D.; Kutanoglu, E. Urban consolidation solutions for parcel delivery considering location, fleet and route choice. Case Stud. Transp. Policy 2018, 6, 112–124. [Google Scholar] [CrossRef]
- Lebeau, P.; De Cauwer, C.; Van Mierlo, J.; Macharis, C.; Verbeke, W.; Coosemans, T. Conventional, hybrid, or electric vehicles: Which technology for an urban distribution centre? Sci. World J. 2015. [Google Scholar] [CrossRef] [PubMed]
- Suksri, J.; Raicu, R. Developing a conceptual framework for the evaluation of urban freight distribution initiatives. Procedia-Soc. Behav. Sci. 2012, 39, 321–332. [Google Scholar] [CrossRef]
- Macharis, C. Multi-criteria Analysis as a Tool to Include Stakeholders in Project Evaluation: The MAMCA Method. In Transport Project Evaluation: Extending the Social Cost–Benefit, Approach; Haezendonck, E., Ed.; Edward Elgar: Cheltenham, UK, 2007; pp. 115–131. ISBN 978-1-84720-379-3. [Google Scholar]
- Giorgi, L.; Pearman, A.; Tandon, A.; Tsamboulas, D. Project and Policy Evaluation in Transport, 1st ed.; Routledge: New York, NY, USA, 2017; pp. 35–43. ISBN 9781351748483. [Google Scholar]
- Macharis, C.; De Witte, A.; Ampe, J. The multi-actor, multi-criteria analysis methodology (MAMCA) for the evaluation of transport projects: Theory and practice. J. Adv. Transp. 2009, 43, 183–202. [Google Scholar] [CrossRef]
- Macharis, C.; Bernardini, A. Reviewing the use of Multi-Criteria Decision Analysis for the evaluation of transport projects: Time for a multi-actor approach. Transp. Policy 2015, 37, 177–186. [Google Scholar] [CrossRef]
- Roukouni, A.; Macharis, C.; Basbas, S.; Stephanis, B.; Mintsis, G. Financing urban transportation infrastructure in a multi-actors environment: The role of value capture. Eur. Transp. Res. Rev. 2018, 10, 14. [Google Scholar] [CrossRef]
- Bjerkan, K.Y.; Sund, A.B.; Nordtømme, M.E. Stakeholder responses to measures green and efficient urban freight. Res. Transp. Bus. Manag. 2014, 11, 32–42. [Google Scholar] [CrossRef]
- Verlinde, S.; Macharis, C.; Milan, L.; Kin, B. Does a mobile depot make urban deliveries faster, more sustainable and more economically viable: Results of a pilot test in Brussels. Transp. Res. Procedia 2014, 4, 361–373. [Google Scholar] [CrossRef]
- Aljohani, K.; Thompson, R.G. The impacts of relocating a logistics facility on last food miles—The case of Melbourne’s fruit & vegetable wholesale market. Case Stud. Transp. Policy 2018, 6, 279–288. [Google Scholar] [CrossRef]
- Macharis, C.; Milan, L.; Verlinde, S. A stakeholder-based multicriteria evaluation framework for city distribution. Res. Transp. Bus. Manag. 2014, 11, 75–84. [Google Scholar] [CrossRef]
- Saaty, T.L. The Analytic Hierarchy Process: Planning, Priority Setting, Resource Allocation, 1st ed.; McGraw-Hill: New York, NY, USA, 1980; ISBN 978-0070543713. [Google Scholar]
- Kabir, G.; Hasin, M.A.A. Comparative analysis of AHP and fuzzy AHP models for multicriteria inventory classification. Int. J. Fuzzy Logic Syst. 2011, 1, 1–16. [Google Scholar]
- Bouyssou, D.; Marchant, T.; Pirlot, M.; Perny, P.; Tsoukias, A.; Vincke, P. Evaluation and Decision Models: A Critical Perspective; Springer Science & Business Media: Berlin, Germany, 2012; Volume 32, ISBN 9781461515937. [Google Scholar]
- Chen, Y.H.; Wang, T.C.; Wu, C.Y. Multi-criteria decision making with fuzzy linguistic preference relations. Appl. Math. Modell. 2011, 35, 1322–1330. [Google Scholar] [CrossRef]
- Zadeh, L.A. Fuzzy sets. Inf. Control 1965, 8, 338–353. [Google Scholar] [CrossRef] [Green Version]
- Beskese, A.; Kahraman, C.; Irani, Z. Quantification of flexibility in advanced manufacturing systems using fuzzy concept. Int. J. Prod. Econ. 2004, 89, 45–56. [Google Scholar] [CrossRef]
- Bellman, R.E.; Zadeh, L.A. Decision-making in a fuzzy environment. Manag. Sci. 1970, 17, 141–164. [Google Scholar] [CrossRef]
- Zamani-Sabzi, H.; King, J.P.; Gard, C.C.; Abudu, S. Statistical and analytical comparison of multi-criteria decision-making techniques under fuzzy environment. Oper. Res. Perspect. 2016, 3, 92–117. [Google Scholar] [CrossRef]
- Van Laarhoven, P.J.; Pedrycz, W. A fuzzy extension of Saaty’s priority theory. Fuzzy Sets Syst. 1983, 11, 229–241. [Google Scholar] [CrossRef]
- Beskese, A.; Demir, H.H.; Ozcan, H.K.; Okten, H.E. Landfill site selection using fuzzy AHP and fuzzy TOPSIS: A case study for Istanbul. Environ. Earth Sci. 2015, 73, 3513–3521. [Google Scholar] [CrossRef]
- Özdağoğlu, A.; Özdağoğlu, G. Comparison of AHP and fuzzy AHP for the multi-criteria decision making processes with linguistic evaluation. Ýstanbul Ticaret Üniversitesi Fen Bilimleri Dergisi 2007, 6, 65–85. [Google Scholar]
- Bozbura, F.T.; Beskese, A.; Kahraman, C. Prioritization of human capital measurement indicators using fuzzy AHP. Expert Syst. Appl. 2007, 32, 1100–1112. [Google Scholar] [CrossRef]
- Buckley, J.J. Ranking alternatives using fuzzy numbers. Fuzzy Sets Syst. 1985, 15, 21–31. [Google Scholar] [CrossRef]
- Chang, D.Y. Extent analysis and synthetic decision. Optim. Tech. Appl. 1992, 1, 352–355. [Google Scholar]
- Chang, D.Y. Applications of the extent analysis method on fuzzy AHP. Eur. J. Oper. Res. 1996, 95, 649–655. [Google Scholar] [CrossRef]
- Brans, J.P.; Vincke, P. Note-A preference ranking organisation method: The PROMETHEE method for multiple criteria decision-making. Manag. Sci. 1985, 31, 647–656. [Google Scholar] [CrossRef]
- Macharis, C.; Brans, J.-P.; Mareschal, B. The GDSS promethee procedure. J. Decis. Syst. 1998, 7, 283–307. [Google Scholar]
- Brans, J.; De Smet, Y. PROMETHEE Methods. In Multiple Criteria Decision Analysis-State of the Art Surveys, 2nd ed.; Greco, S., Ehrgott, M., Figueira, J., Eds.; Springer: New York, NY, USA, 2016; Volume 233, pp. 187–219. ISBN 978-1-4939-3093-7. [Google Scholar]
- Behzadian, M.; Kazemzadeh, R.B.; Albadvi, A.; Aghdasi, M. PROMETHEE: A comprehensive literature review on methodologies and applications. Eur. J. Oper. Res. 2010, 200, 198–215. [Google Scholar] [CrossRef]
- Vermote, L.; Macharis, C.; Putman, K. A road network for freight transport in flanders: Multi-actor multi-criteria assessment of alternative ring ways. Sustainability 2013, 5, 4222–4246. [Google Scholar] [CrossRef]
- Verlinde, S.; Macharis, C. Who is in favor of off-hour deliveries to Brussels supermarkets? Applying Multi Actor Multi Criteria analysis (MAMCA) to measure stakeholder support. Transp. Res. Procedia 2016, 12, 522–532. [Google Scholar] [CrossRef]
- Macharis, C.; Kin, B.; Balm, S.; Ploos van Amstel, W. Multiactor Participatory Decision Making in Urban Construction Logistics. Transp. Res. Rec. 2016, 2547, 83–90. [Google Scholar] [CrossRef] [Green Version]
- Saskia, S.; Marei, N.; Blanquart, C. Innovations in e-Grocery and Logistics Solutions for Cities. Transp. Res. Procedia 2016, 12, 825–835. [Google Scholar] [CrossRef]
- Savelsberg, M.; Van Woensel, T. 50th Anniversary Invited Article—City logistics: Challenges and Opportunities. Transp. Sci. 2016, 50, 579–590. [Google Scholar] [CrossRef]
- Kin, B.; Spoor, J.; Verlinde, S.; Macharis, C.; Van Woensel, T. Modelling alternative distribution set-ups for fragmented last mile transport: Towards more efficient and sustainable urban freight transport. Case Stud. Transp. Policy 2018, 6, 125–132. [Google Scholar] [CrossRef]
- Björklund, M.; Abrahamsson, M.; Johansson, H. Critical factors for viable business models for urban consolidation centres. Res. Transp. Econ. 2017, 64, 36–47. [Google Scholar] [CrossRef]
- Van Rooijen, T.; Quak, H. Local impacts of a new urban consolidation centre–the case of Binnenstadservice.nl. Procedia-Soc. Behav. Sci. 2010, 2, 5967–5979. [Google Scholar] [CrossRef]
- Leonardi, J.; Browne, M.; Allen, J. Before-after assessment of a logistics trial with clean urban freight vehicles: A case study in London. Procedia-Soc. Behav. Sci. 2012, 39, 146–157. [Google Scholar] [CrossRef]
- Browne, M.; Allen, J.; Leonardi, J. Evaluating the use of an urban consolidation centre and electric vehicles in central London. IATSS Res. 2011, 35, 1–6. [Google Scholar] [CrossRef]
- De Oliveira, L.K.; Oliveira, B.R.P.; de Assis Correia, V. Simulation of an Urban Logistic Space for the Distribution of Goods in Belo Horizonte, Brazil. Procedia-Soc. Behav. Sci. 2014, 125, 496–505. [Google Scholar] [CrossRef]
- Janjevic, M.; Lebeau, P.; Ndiaye, A.B.; Macharis, C.; Van Mierlo, J.; Nsamzinshuti, A. Strategic scenarios for sustainable urban distribution in the Brussels-capital region using urban consolidation centres. Transp. Res. Procedia 2016, 12, 598–612. [Google Scholar] [CrossRef]
- Lin, J.; Chen, Q.; Kawamura, K. Sustainability SI: Logistics cost and environmental impact analyses of urban delivery consolidation strategies. Netw. Spat. Econ. 2016, 16, 227–253. [Google Scholar] [CrossRef]
- Quak, H.; Tavasszy, L. Customized Solutions for Sustainable City Logistics: The Viability of Urban Freight Consolidation Centres. In Transitions Towards Sustainable Mobility; van Nunen, J., Huijbregts, P., Rietveld, P., Eds.; Springer: Berlin/Heidelberg, Germany, 2011; ISBN 978-3-642-21192-8. [Google Scholar]
- Lebeau, P.; Verlinde, S.; Macharis, C.; Van Mierlo, J. How can authorities support urban consolidation centres? A review of the accompanying measures. J. Urban. 2017, 10, 468–486. [Google Scholar] [CrossRef]
- Paddeu, D. Sustainable Solutions for Urban Freight Transport and Logistics: An Analysis of Urban Consolidation Centers. In Sustainable Freight Transport; Zeimpekis, V., Aktas, E., Bourlakis, M., Minis, I., Eds.; Springer: Cham, Switzerland, 2018. [Google Scholar]
- Estrada, M.; Roca-Riu, M. Stakeholder’s profitability of carrier-led consolidation strategies in urban goods distribution. Transp. Res. Part E Logist. Transp. Rev. 2017, 104, 165–188. [Google Scholar] [CrossRef]
- Holguín-Veras, J.; Silas, M.; Polimeni, J.; Taniguchi, E.; Thomson, R. An investigation on the attitudinal factors determining participation in cooperative multi-carrier delivery systems. In Innovations in City Logistics; Taniguchi, E., Thomson, R., Eds.; Nova Science Publishers: New York, NY, USA, 2008; pp. 55–68. ISBN 978-1604567250. [Google Scholar]
- Danielis, R.; Rotaris, L.; Marcucci, E. Urban freight policies and distribution channels. Eur. Transp. 2010, 46, 114–146. [Google Scholar]
- Quak, H.; Nesterova, N.; van Rooijen, T.; Dong, Y. Zero emission city logistics: Current practices in freight electromobility and feasibility in the near future. Transp. Res. Procedia 2016, 14, 1506–1515. [Google Scholar] [CrossRef]
- Juan, A.A.; Mendez, C.A.; Faulin, J.; de Armas, J.; Grasman, S.E. Electric vehicles in logistics and transportation: A survey on emerging environmental, strategic, and operational challenges. Energies 2016, 9, 86. [Google Scholar] [CrossRef]
- Cagliano, A.C.; Carlin, A.; Mangano, G.; Rafele, C. Analyzing the diffusion of eco-friendly vans for urban freight distribution. Int. J. Logist. Manag. 2017, 28, 1218–1242. [Google Scholar] [CrossRef]
- Melo, S.; Baptista, P. Evaluating the impacts of using cargo cycles on urban logistics: Integrating traffic, environmental and operational boundaries. Eur. Transp. Res. Rev. 2017, 9, 30. [Google Scholar] [CrossRef]
- Bányai, T. Real-time decision making in first mile and last mile logistics: How smart scheduling affects energy efficiency of hyperconnected supply chain solutions. Energies 2018, 11, 1833. [Google Scholar] [CrossRef]
- Pelletier, S.; Jabali, O.; Laporte, G. 50th anniversary invited article—Goods distribution with electric vehicles: Review and research perspectives. Transp. Sci. 2016, 50, 3–22. [Google Scholar] [CrossRef]
- Wątróbski, J.; Małecki, K.; Kijewska, K.; Iwan, S.; Karczmarczyk, A.; Thompson, R.G. Multi-criteria analysis of electric vans for city logistics. Sustainability 2017, 9, 1453. [Google Scholar] [CrossRef]
- Fikar, C.; Hirsch, P.; Gronalt, M. A decision support system to investigate dynamic last-mile distribution facilitating cargo-bikes. Int. J. Logist. Res. Appl. 2018, 21, 300–317. [Google Scholar] [CrossRef]
- Giordano, A.; Fischbeck, P.; Matthews, H.S. Environmental and economic comparison of diesel and battery electric delivery vans to inform city logistics fleet replacement strategies. Transp. Res. Part D Transp. Environ. 2017, 64, 216–229. [Google Scholar] [CrossRef]
- Anderluh, A.; Hemmelmayr, V.C.; Nolz, P.C. Synchronizing vans and cargo bikes in a city distribution network. Centr. Eur. J. Oper. Res. 2017, 25, 345–376. [Google Scholar] [CrossRef]
- Schliwa, G.; Armitage, R.; Aziz, S.; Evans, J.; Rhoades, J. Sustainable city logistics—Making cargo cycles viable for urban freight transport. Res. Transp. Bus. Manag. 2015, 15, 50–57. [Google Scholar] [CrossRef]
- Van Leekwijck, W.; Kerre, E.E. Defuzzification: Criteria and classification. Fuzzy Sets Syst. 1999, 108, 159–178. [Google Scholar] [CrossRef]
- Hadavi, S.; Macharis, C.; Van Raemdonck, K. The Multi-Actor Multi-Criteria Analysis (MAMCA) Tool: Methodological Adaptations and Visualizations. In Advanced Concepts, Methodologies and Technologies for Transportation and Logistics; Żak, J., Hadas, Y., Rossi, R., Eds.; Springer: Cham, Switzerland, 2018; Volume 572, ISBN 978-3-319-57105-8. [Google Scholar]
- MAMCA Software. 2018. Available online: www.MAMCA.be (accessed on 12 May 2018).
Figure 1.
Linguistic variables of criteria weights and values.

Figure 2.
Results of the multi-actor analysis of alternative configurations for delivery fleet for the consolidated delivery.
Figure 2.
Results of the multi-actor analysis of alternative configurations for delivery fleet for the consolidated delivery.

Figure 3.
Results of the mono-actor analysis for the logistics services providers stakeholder group.
Figure 3.
Results of the mono-actor analysis for the logistics services providers stakeholder group.

Figure 4.
Results of the mono-actor analysis for the receivers stakeholder group.

Figure 5.
Results of the mono-actor analysis for shippers stakeholder group.

Figure 6.
Results of the mono-actor analysis for the logistics property providers stakeholder group.
Figure 6.
Results of the mono-actor analysis for the logistics property providers stakeholder group.

Figure 7.
Results of the mono-actor analysis for the local authorities stakeholder group.

Figure 8.
Results of the mono-actor analysis for the citizens stakeholder group.

Figure 9.
Schematic of the proposed layout of the consolidation facility.


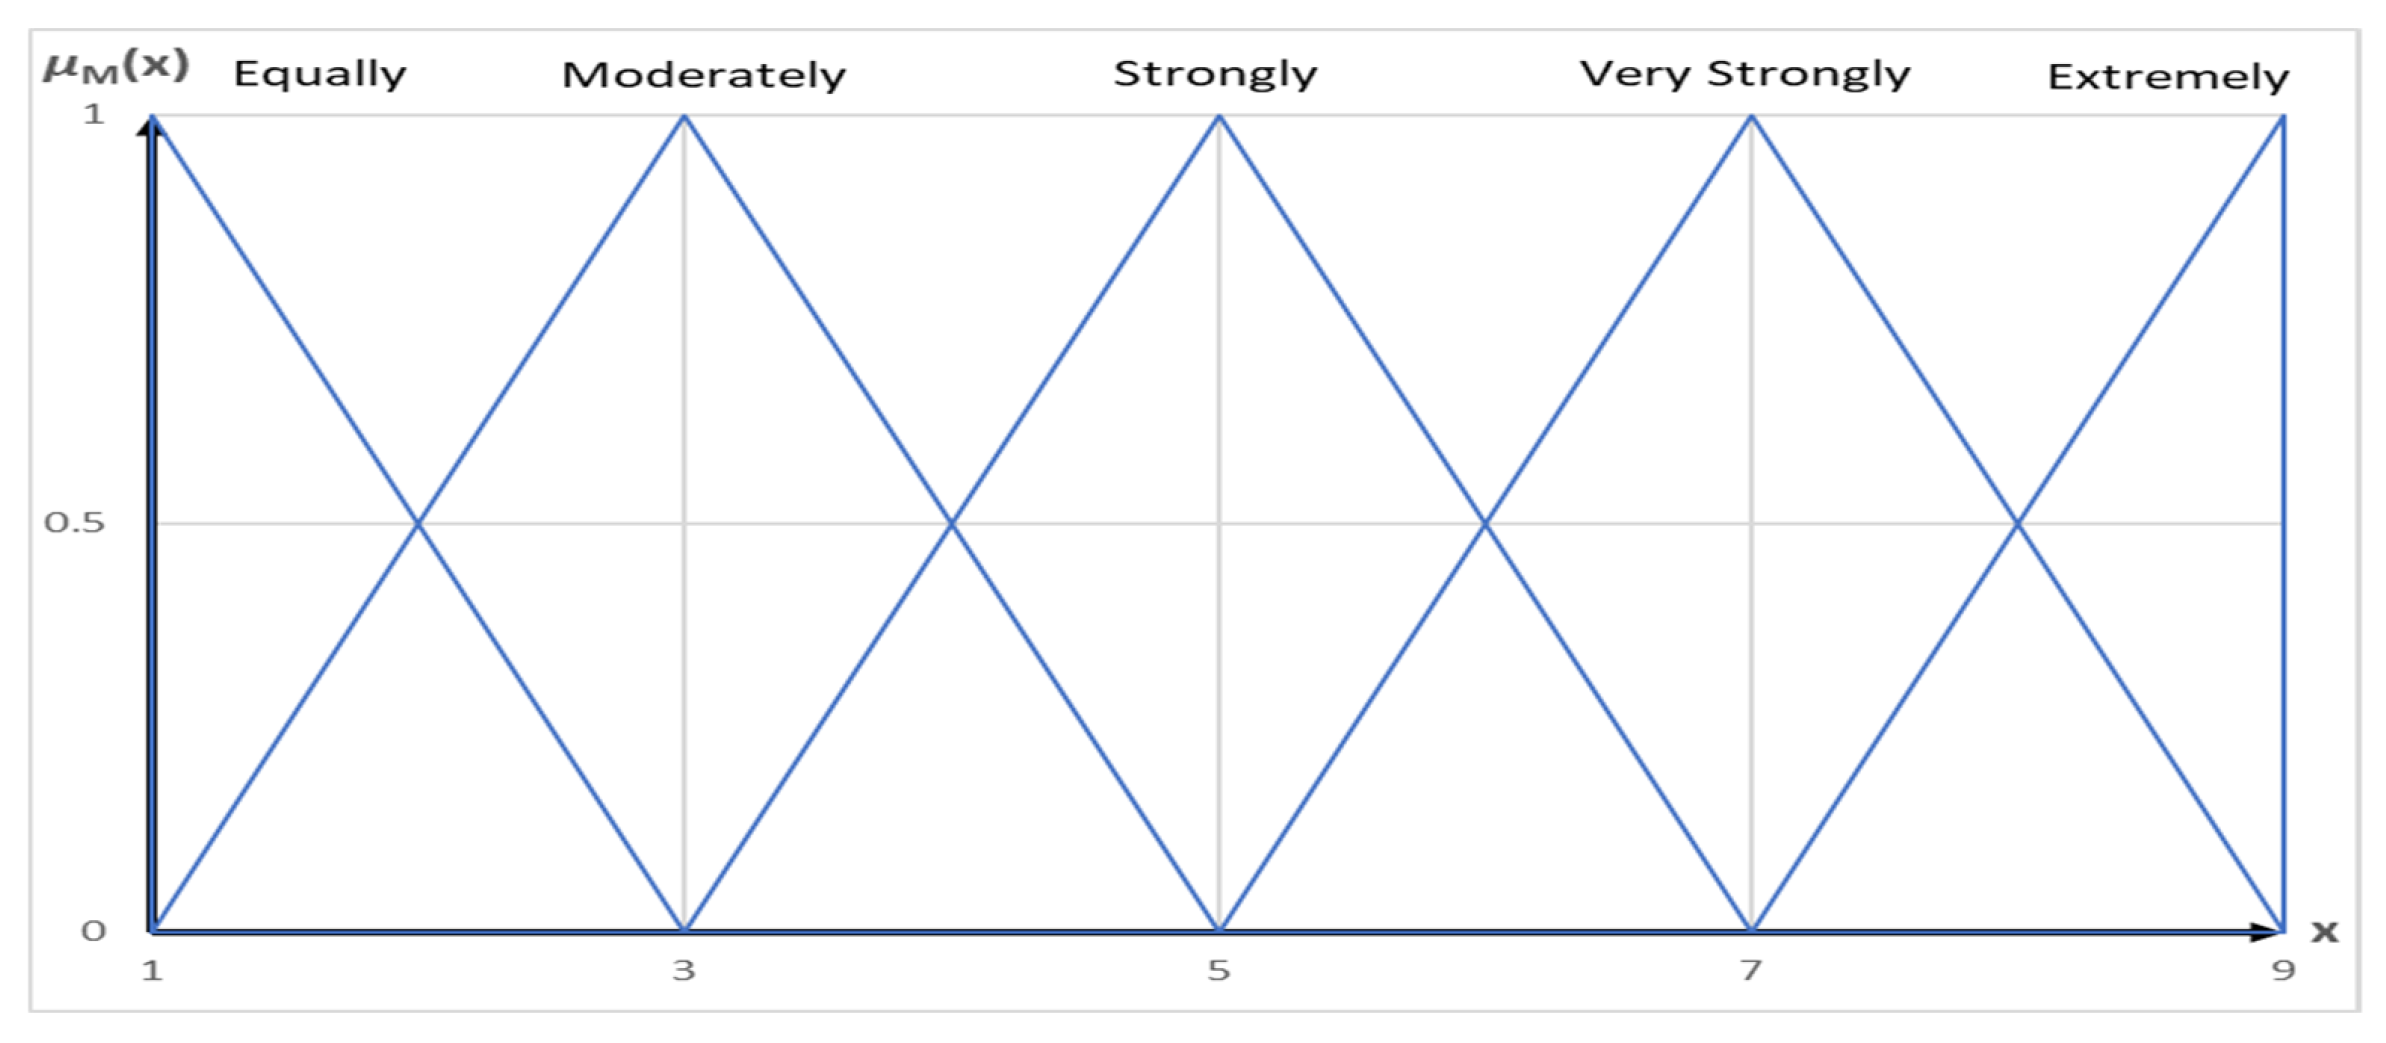
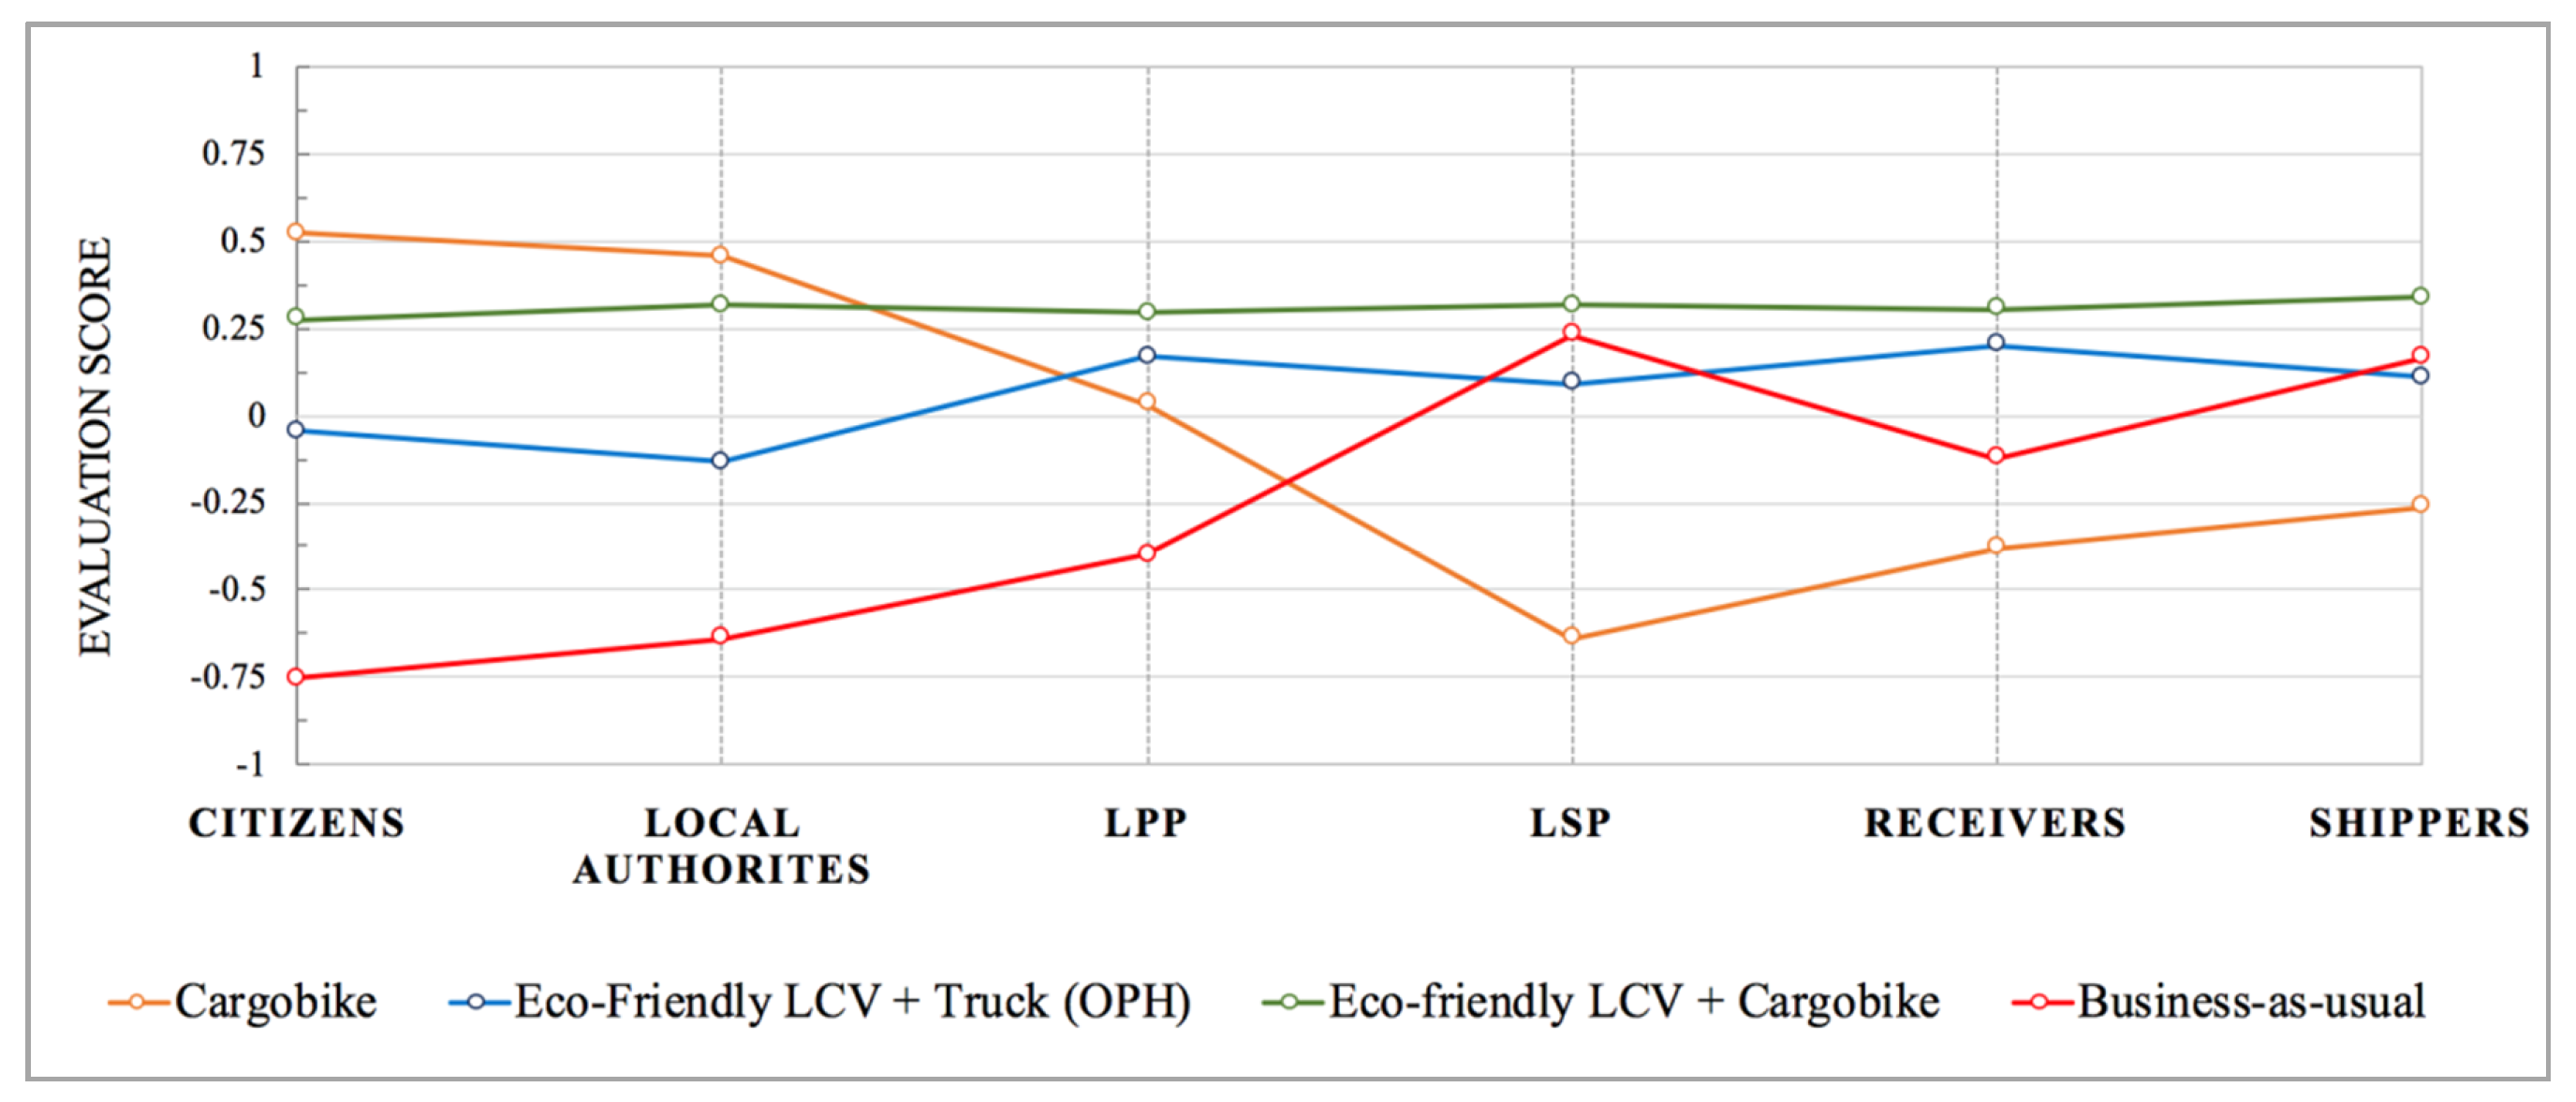
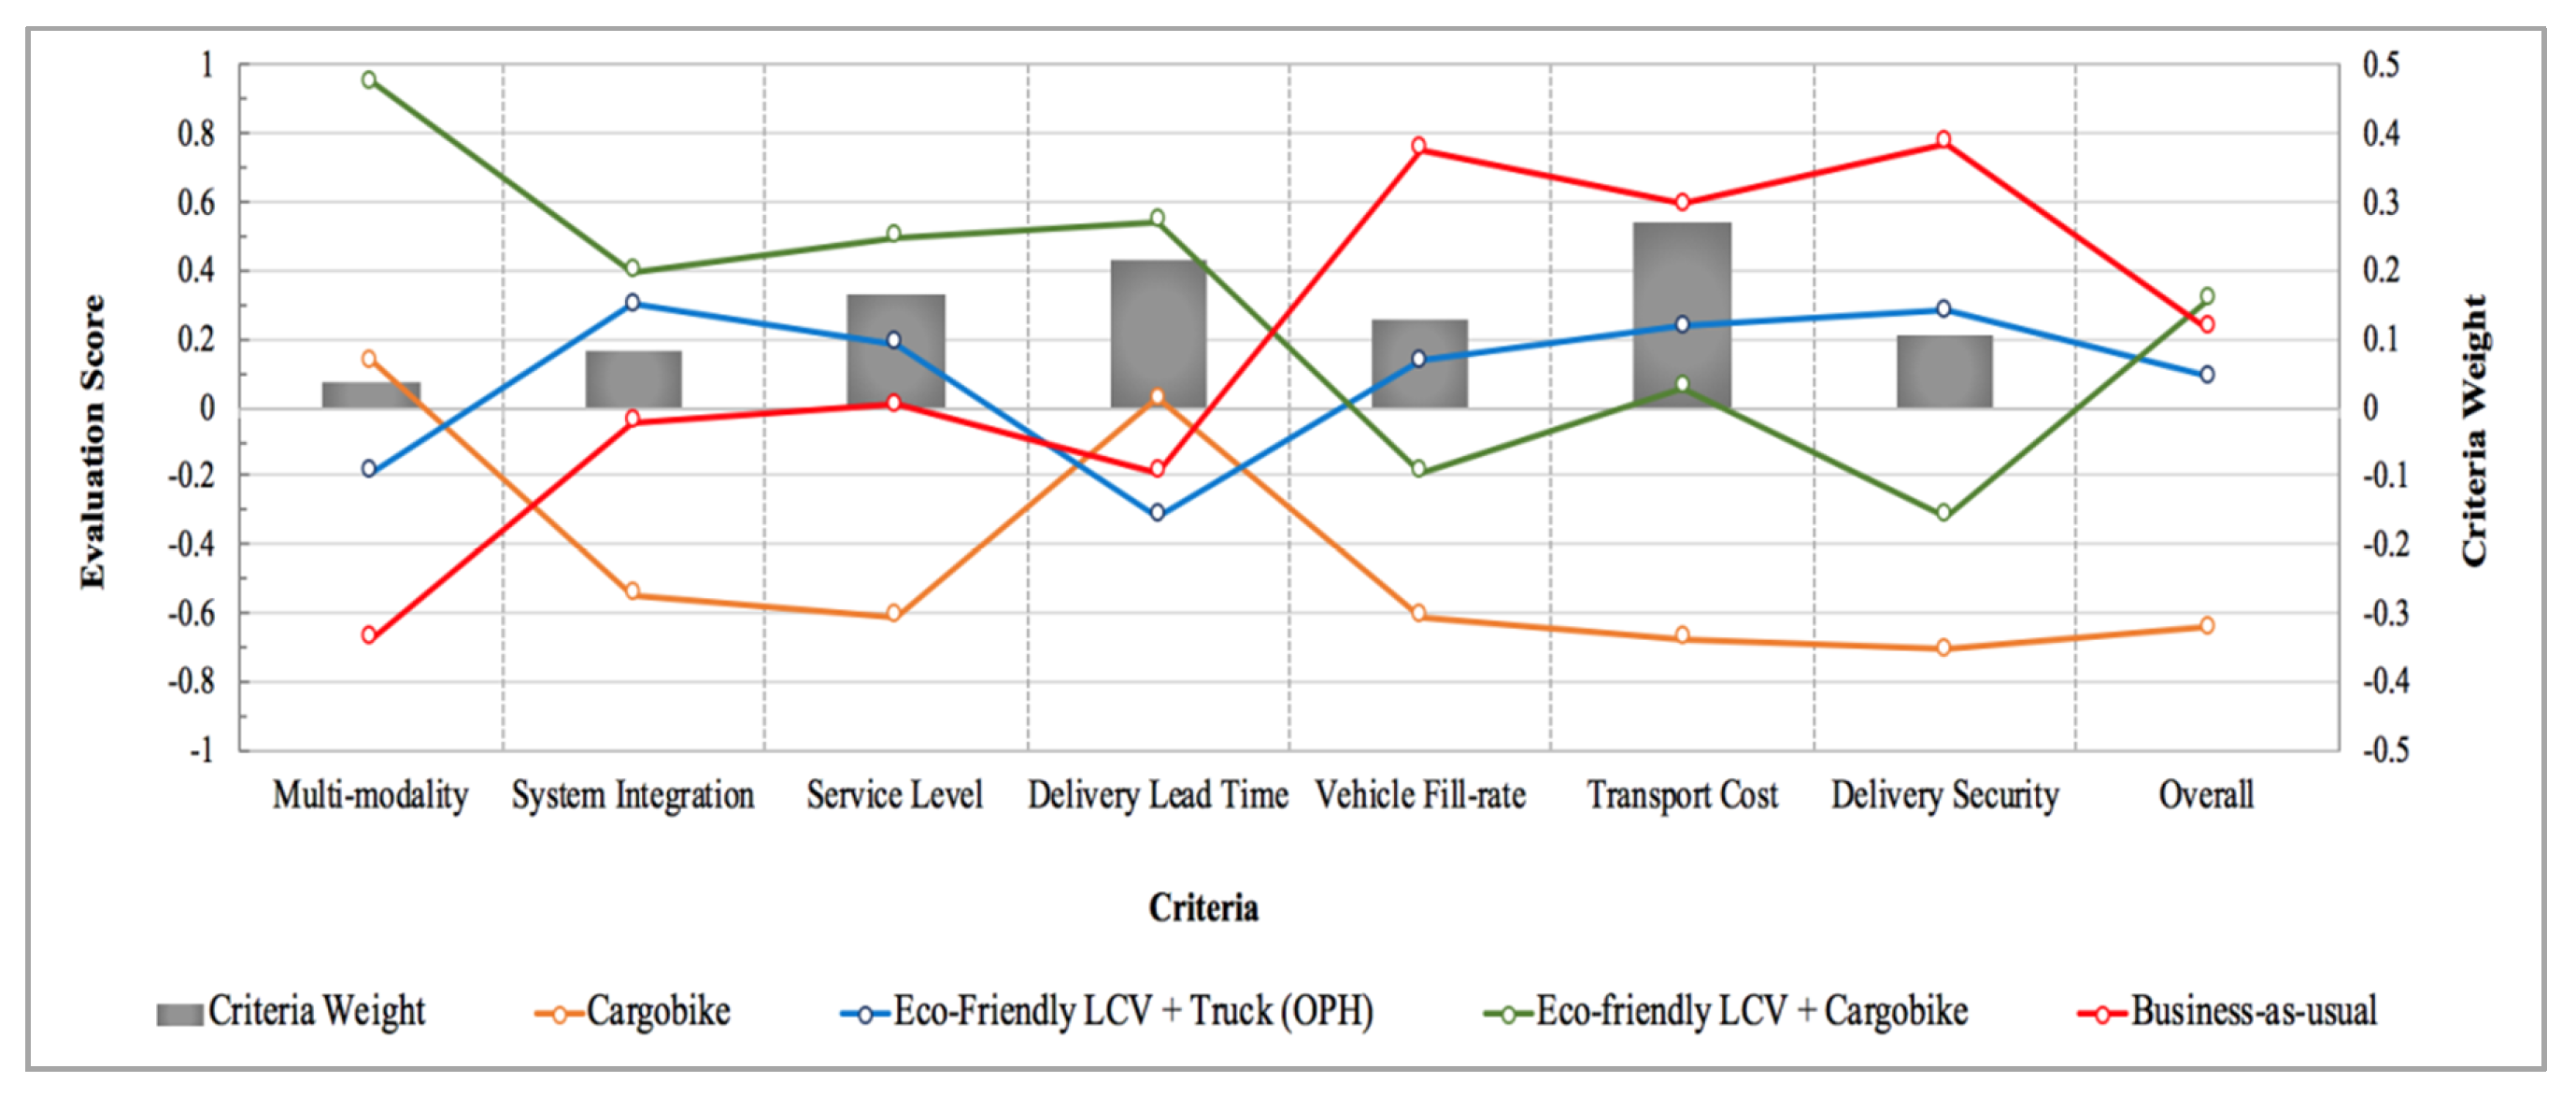
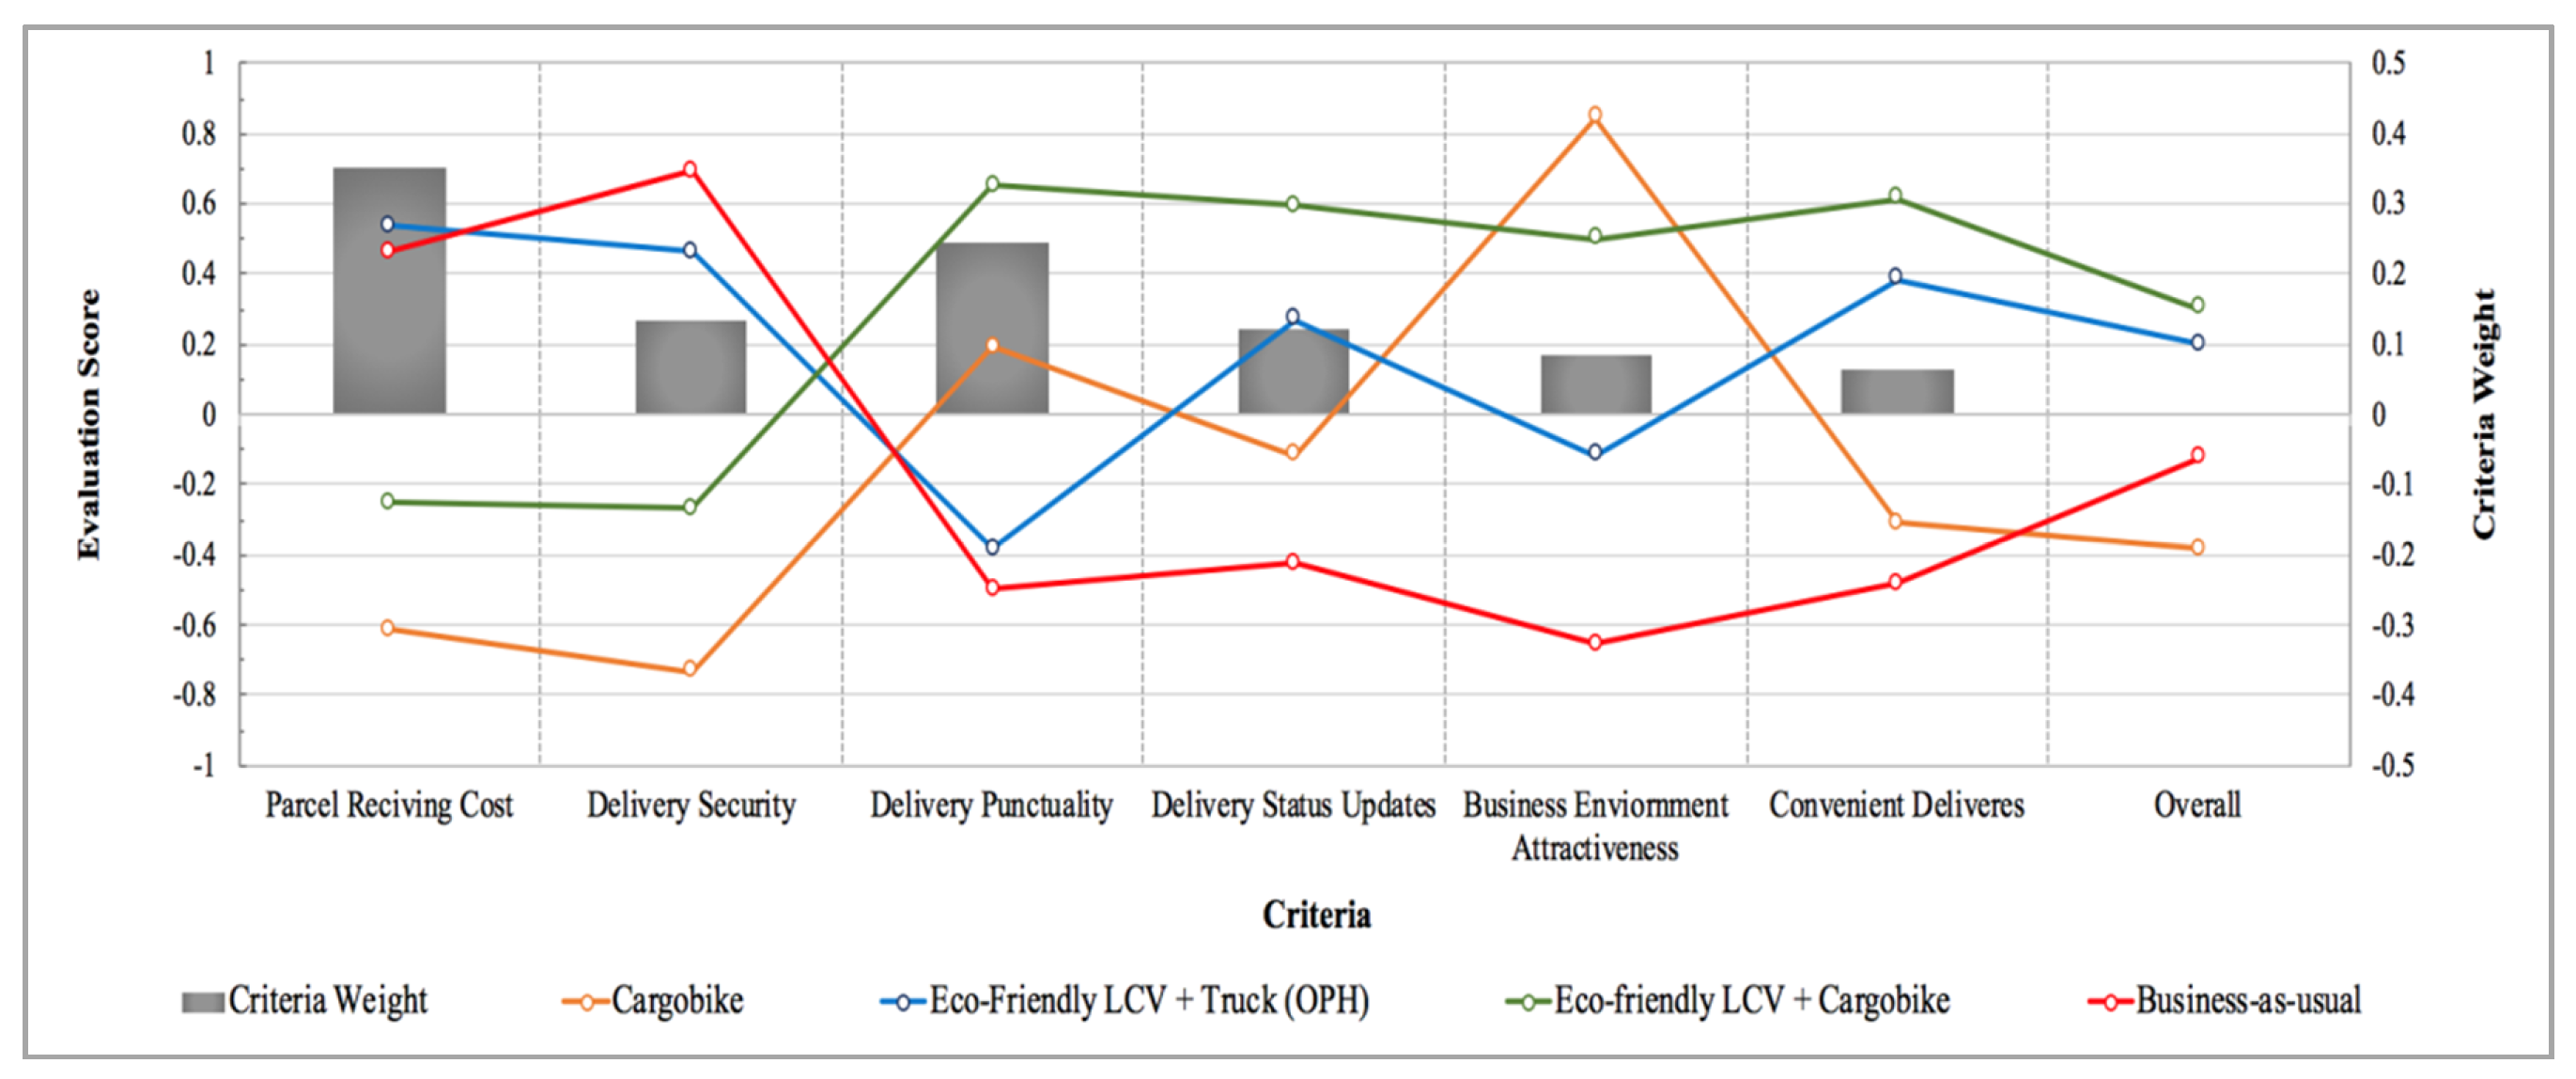
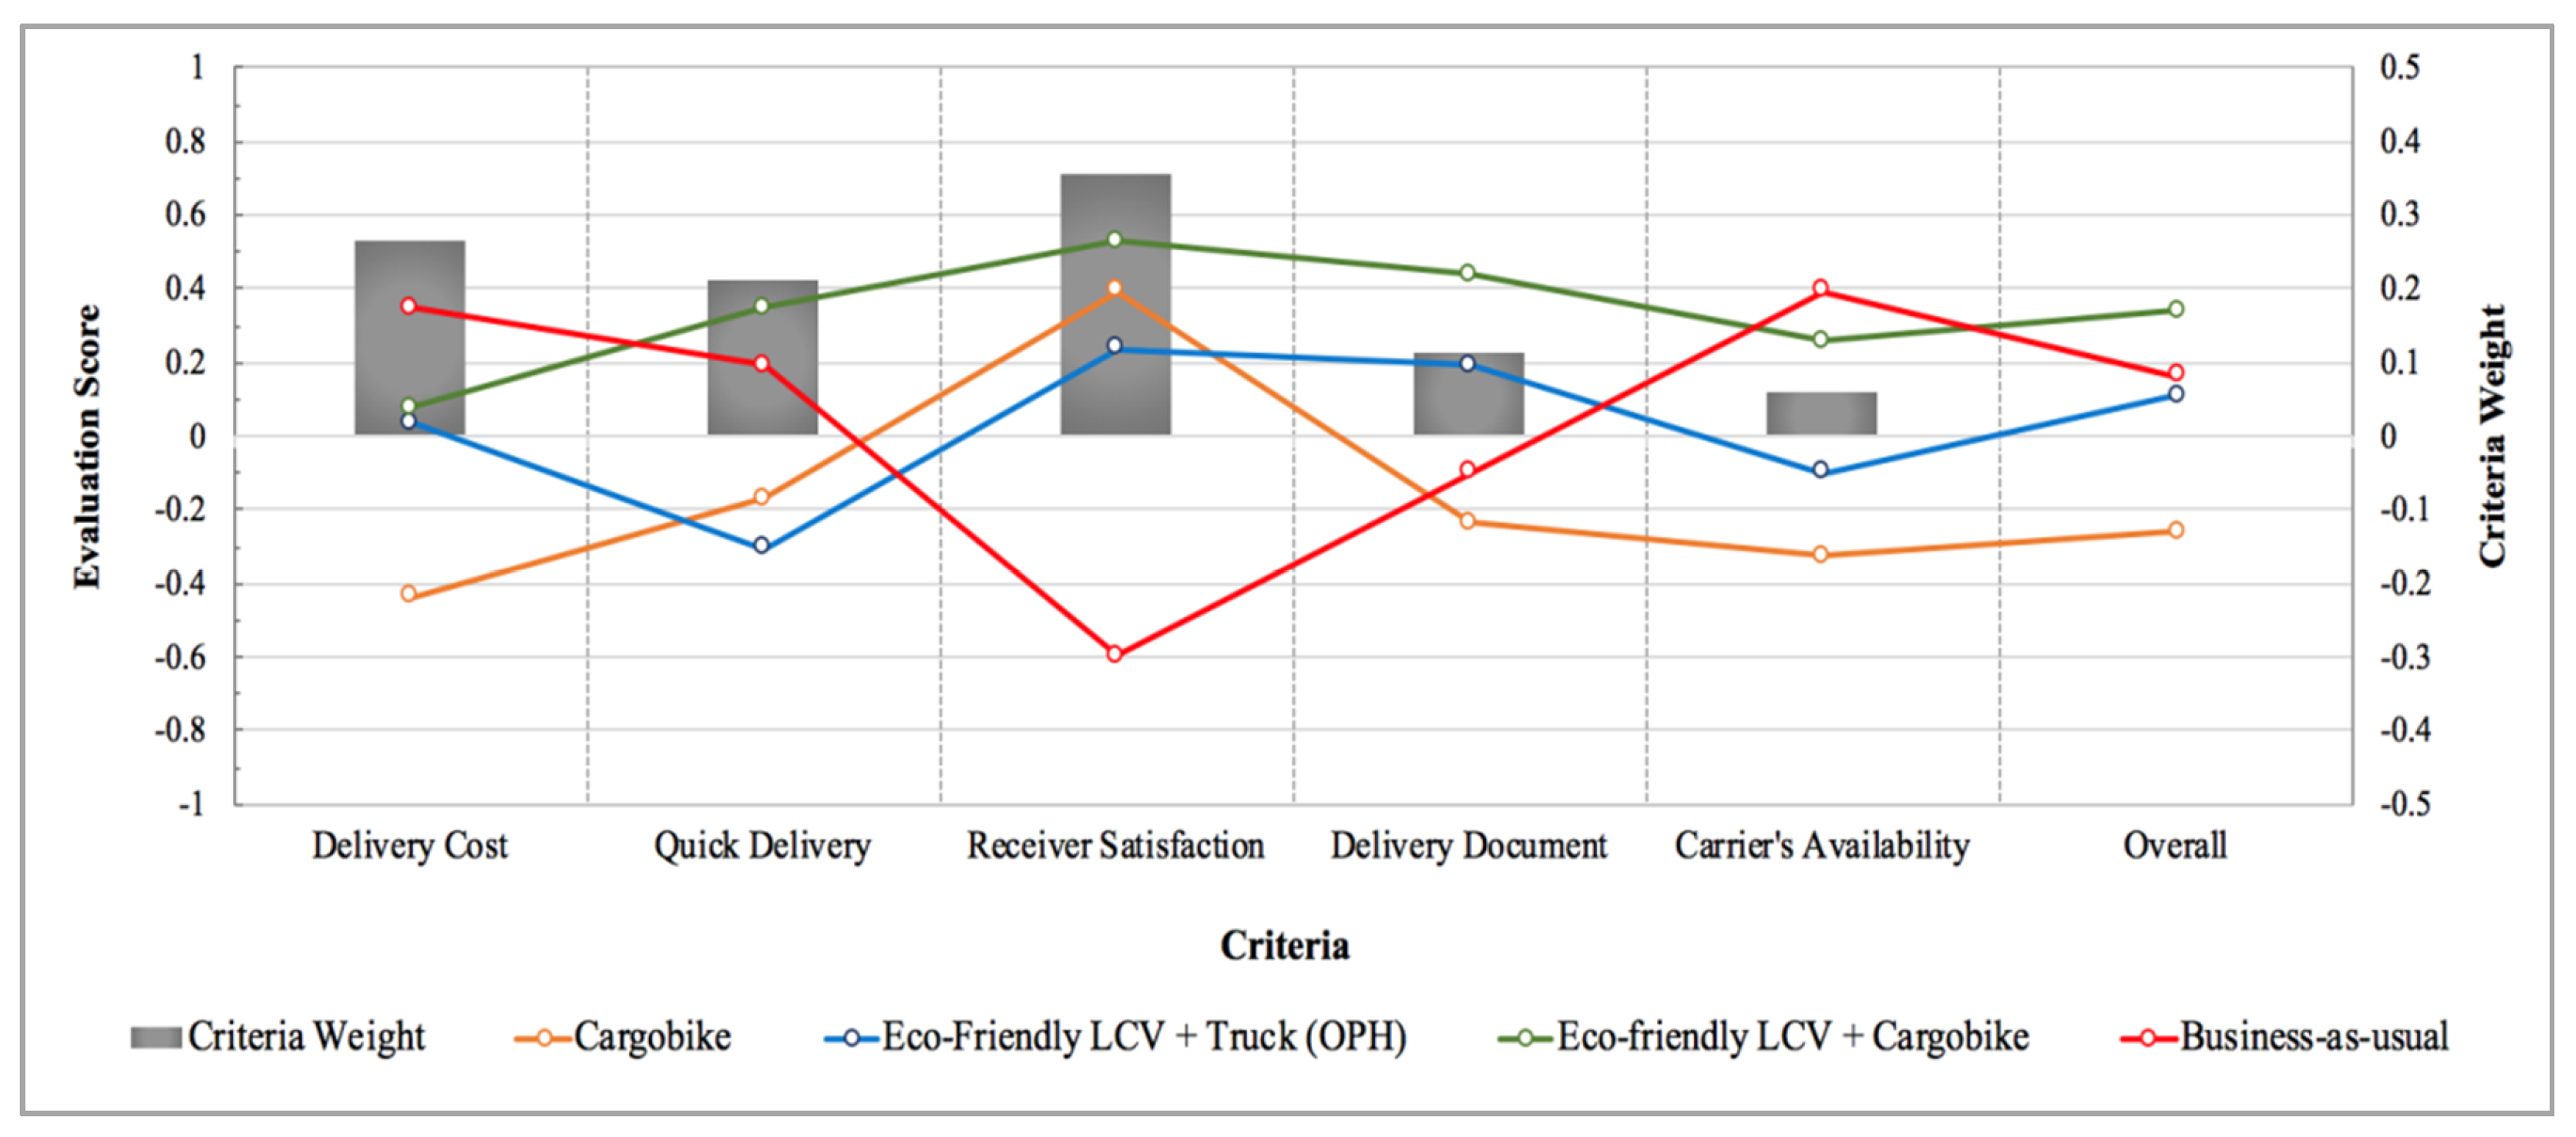
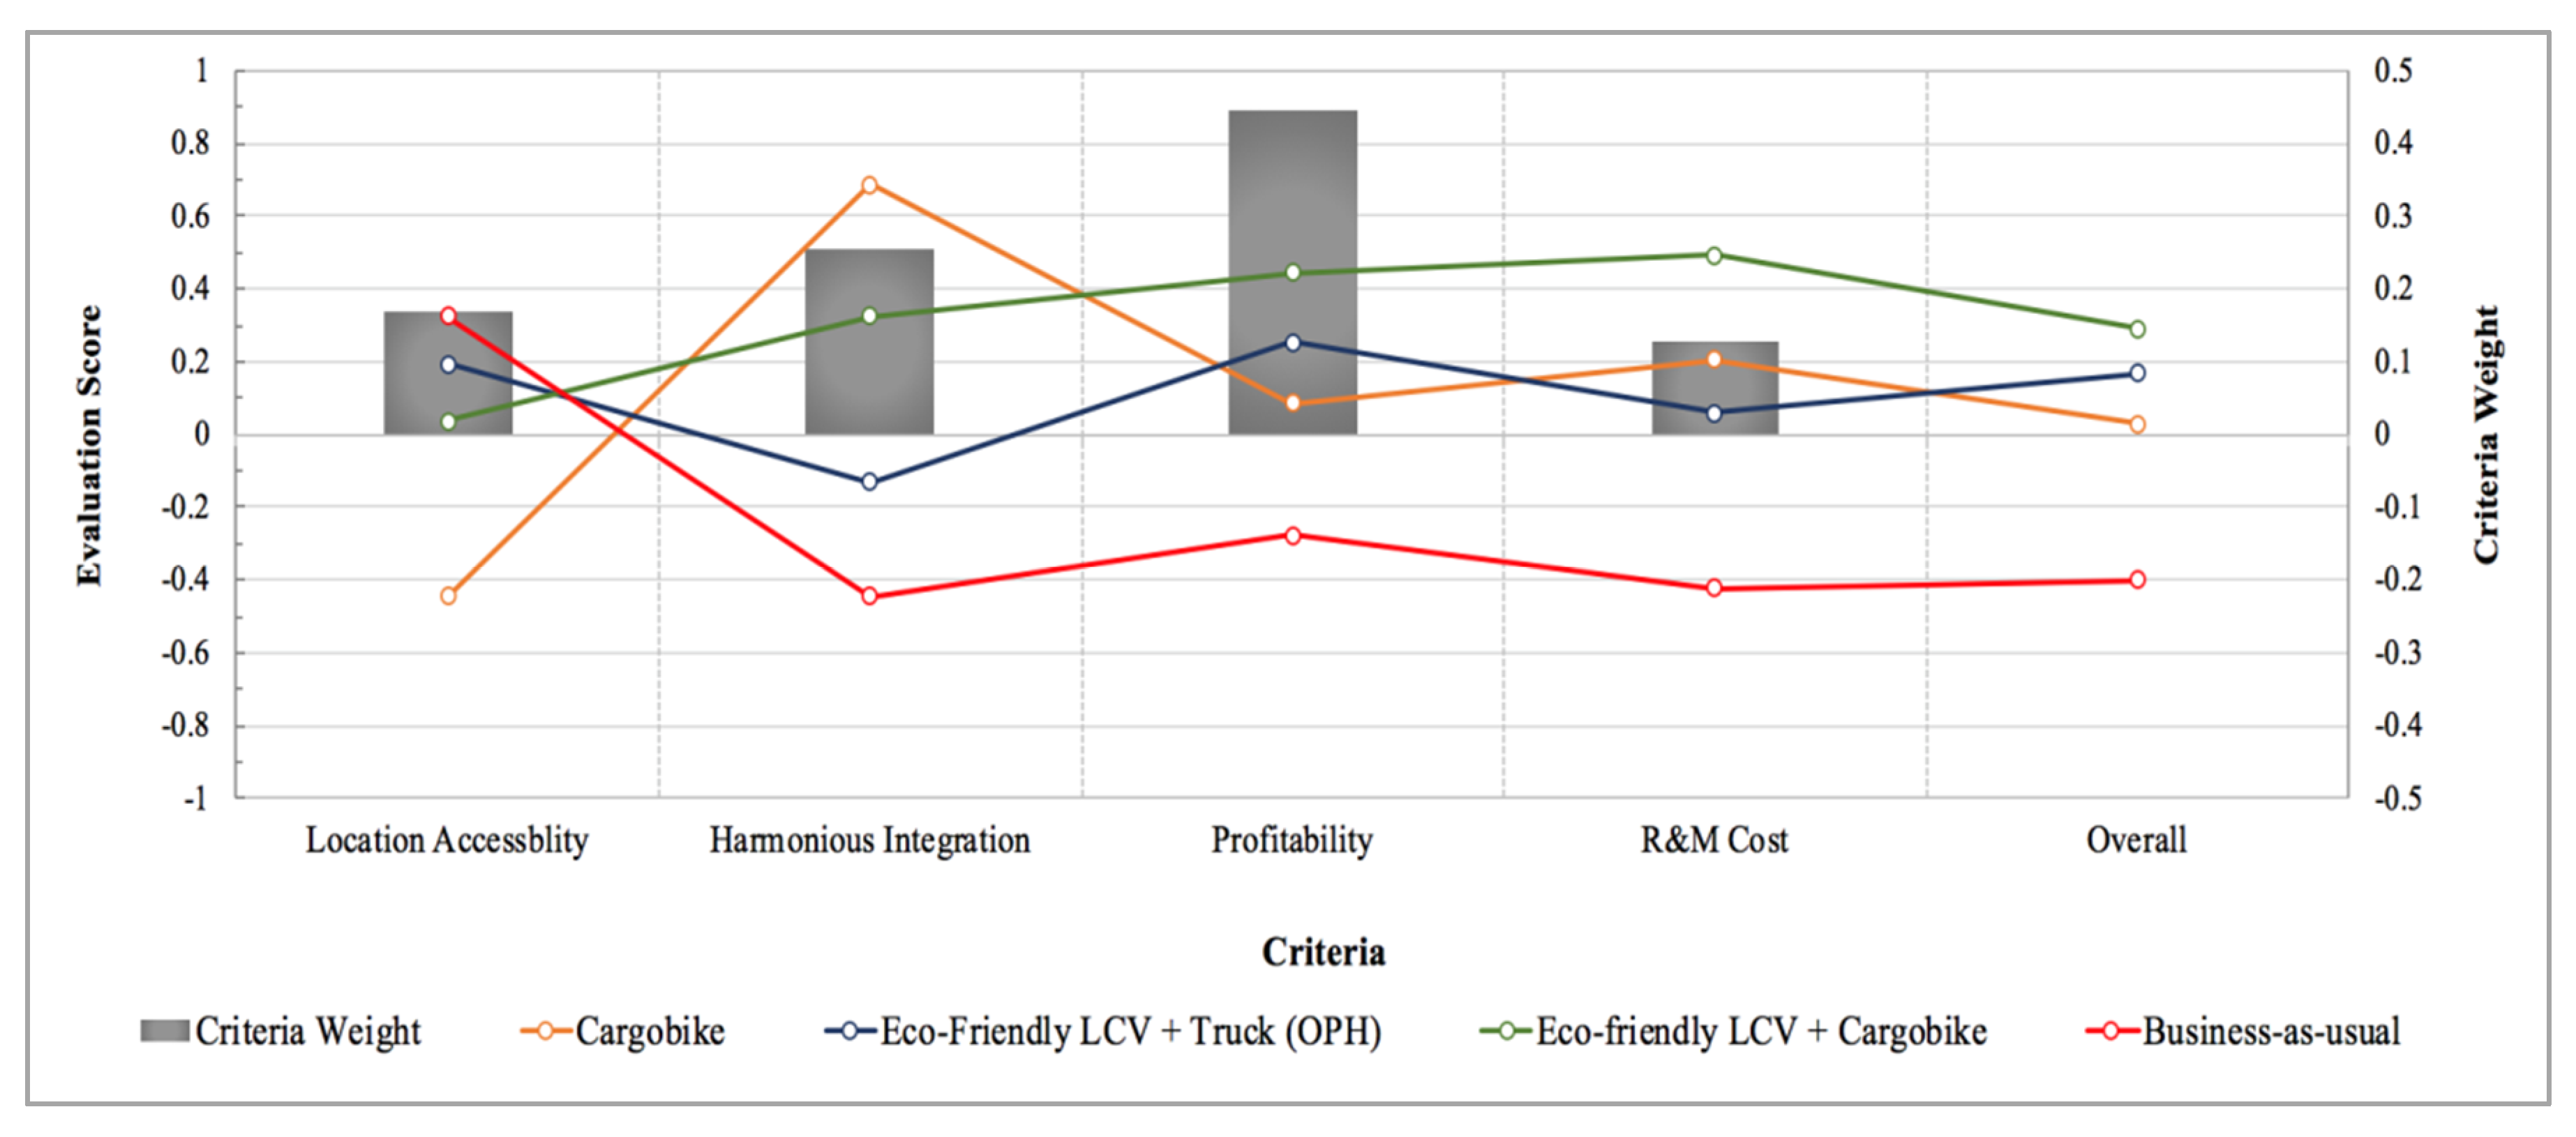
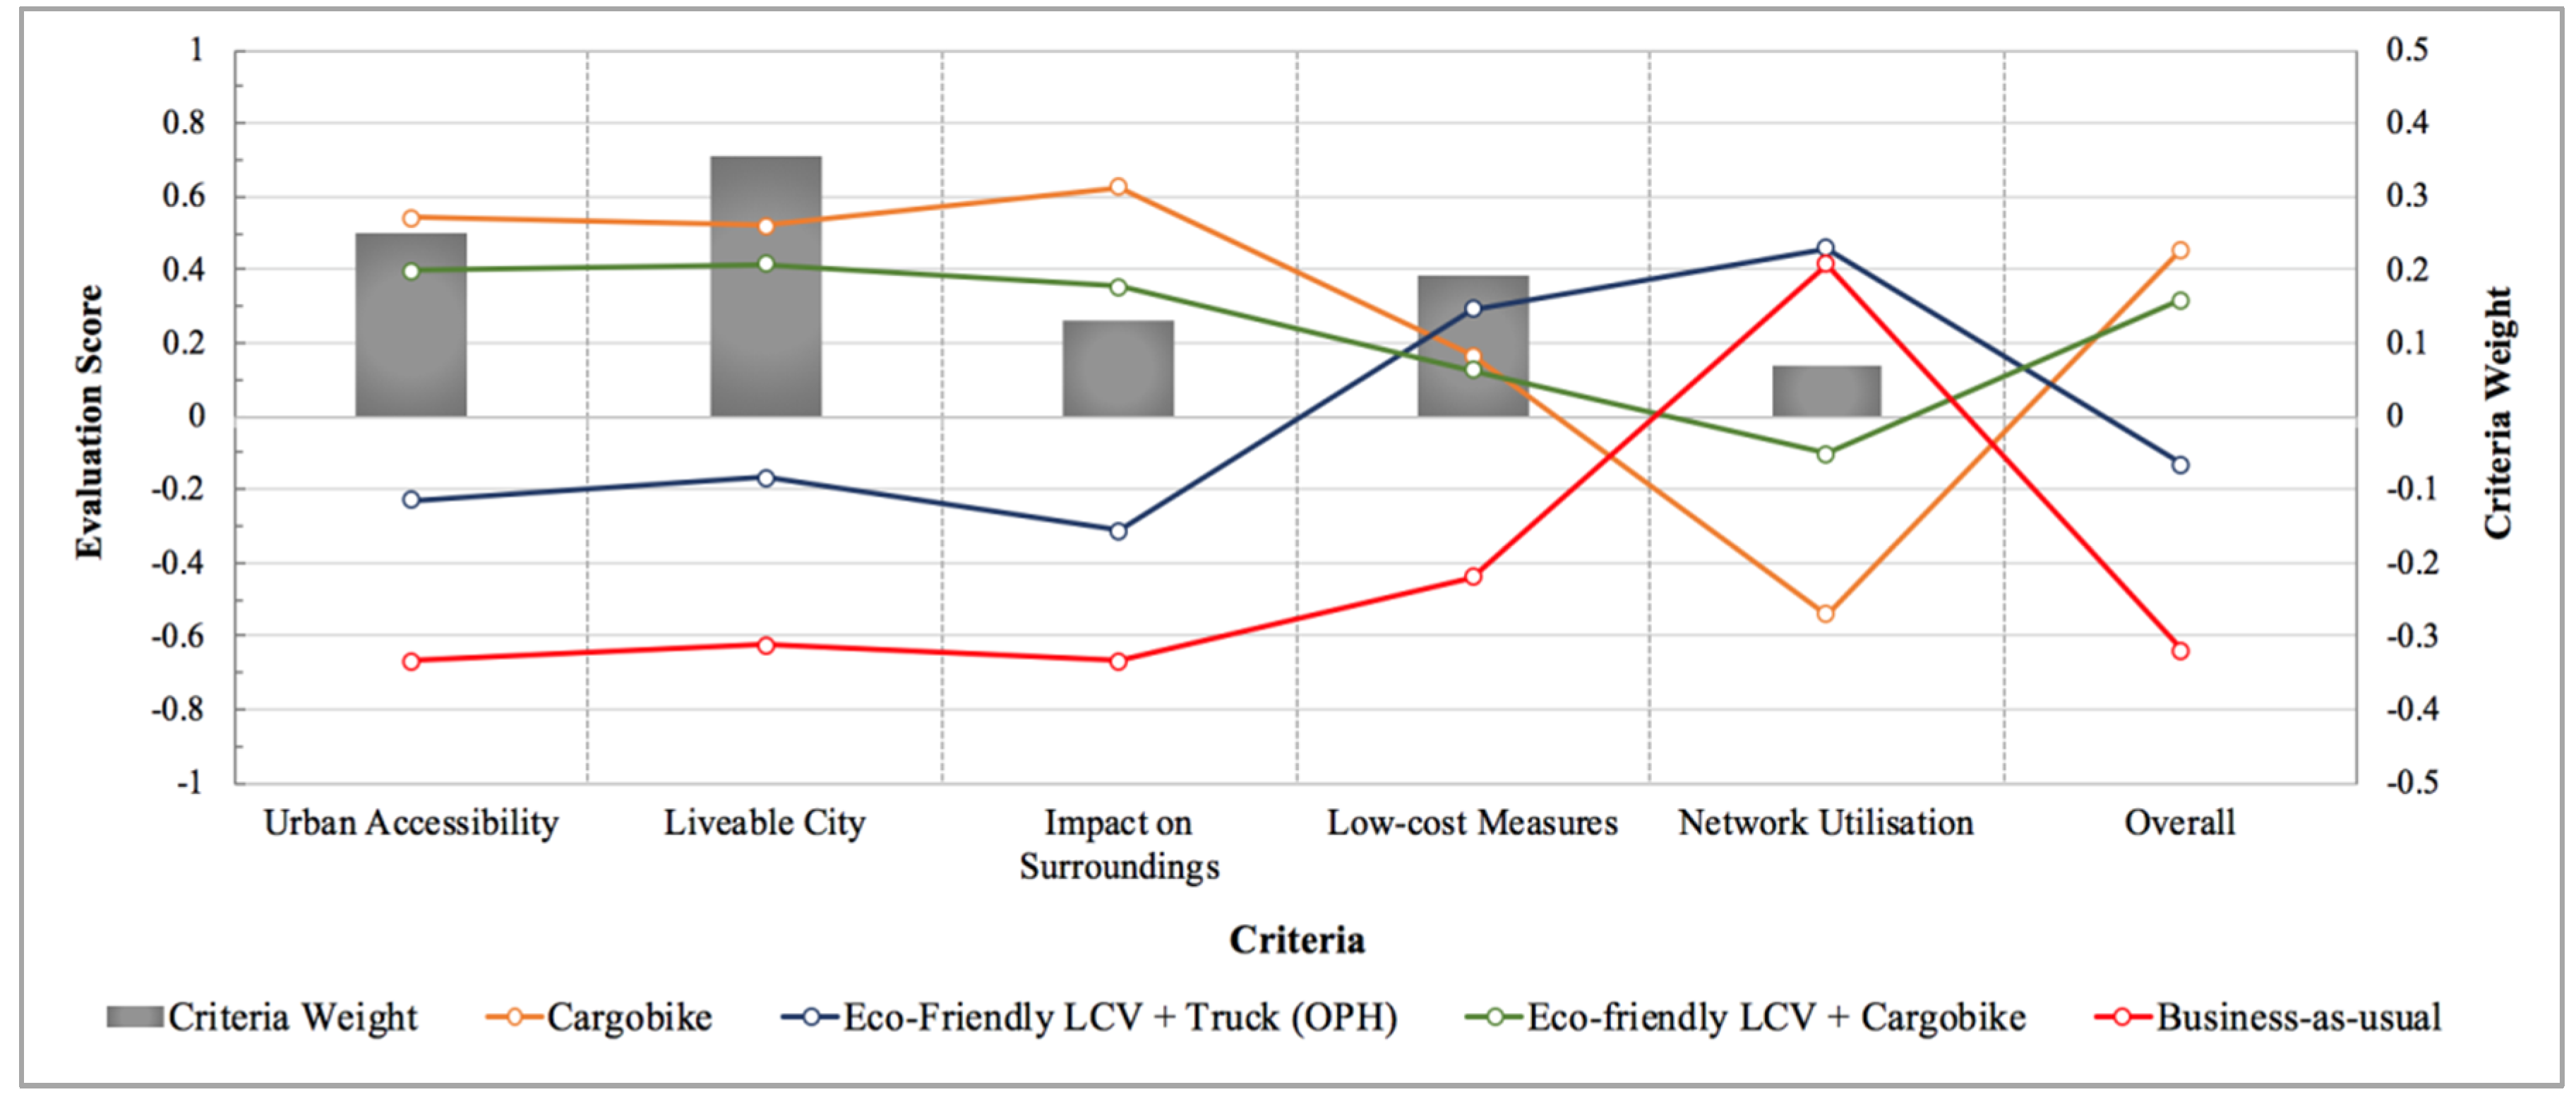
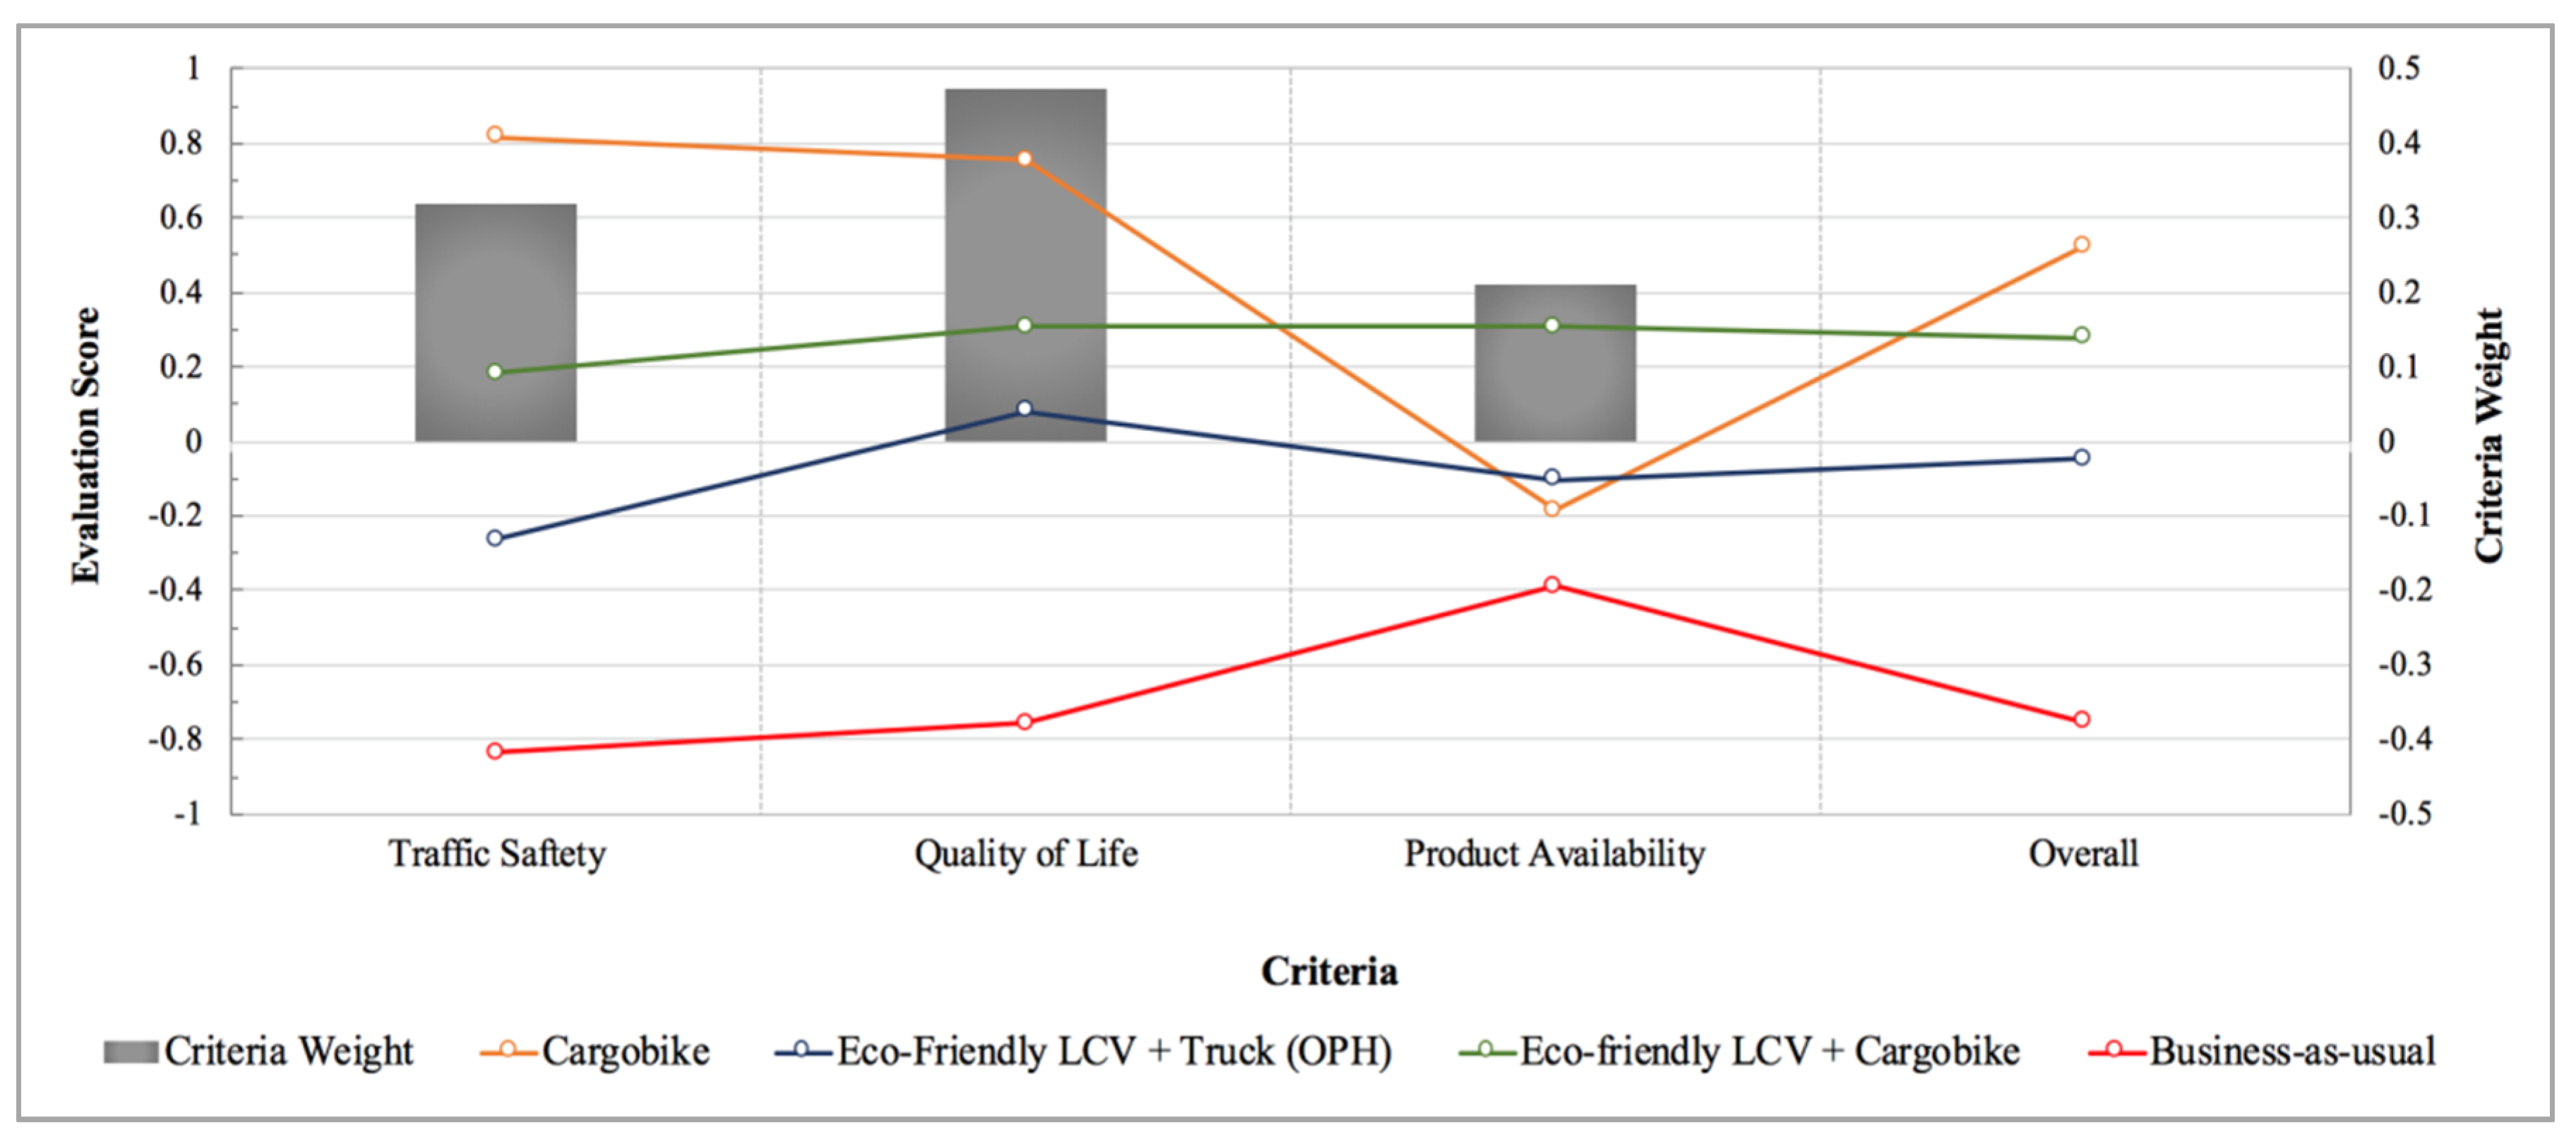
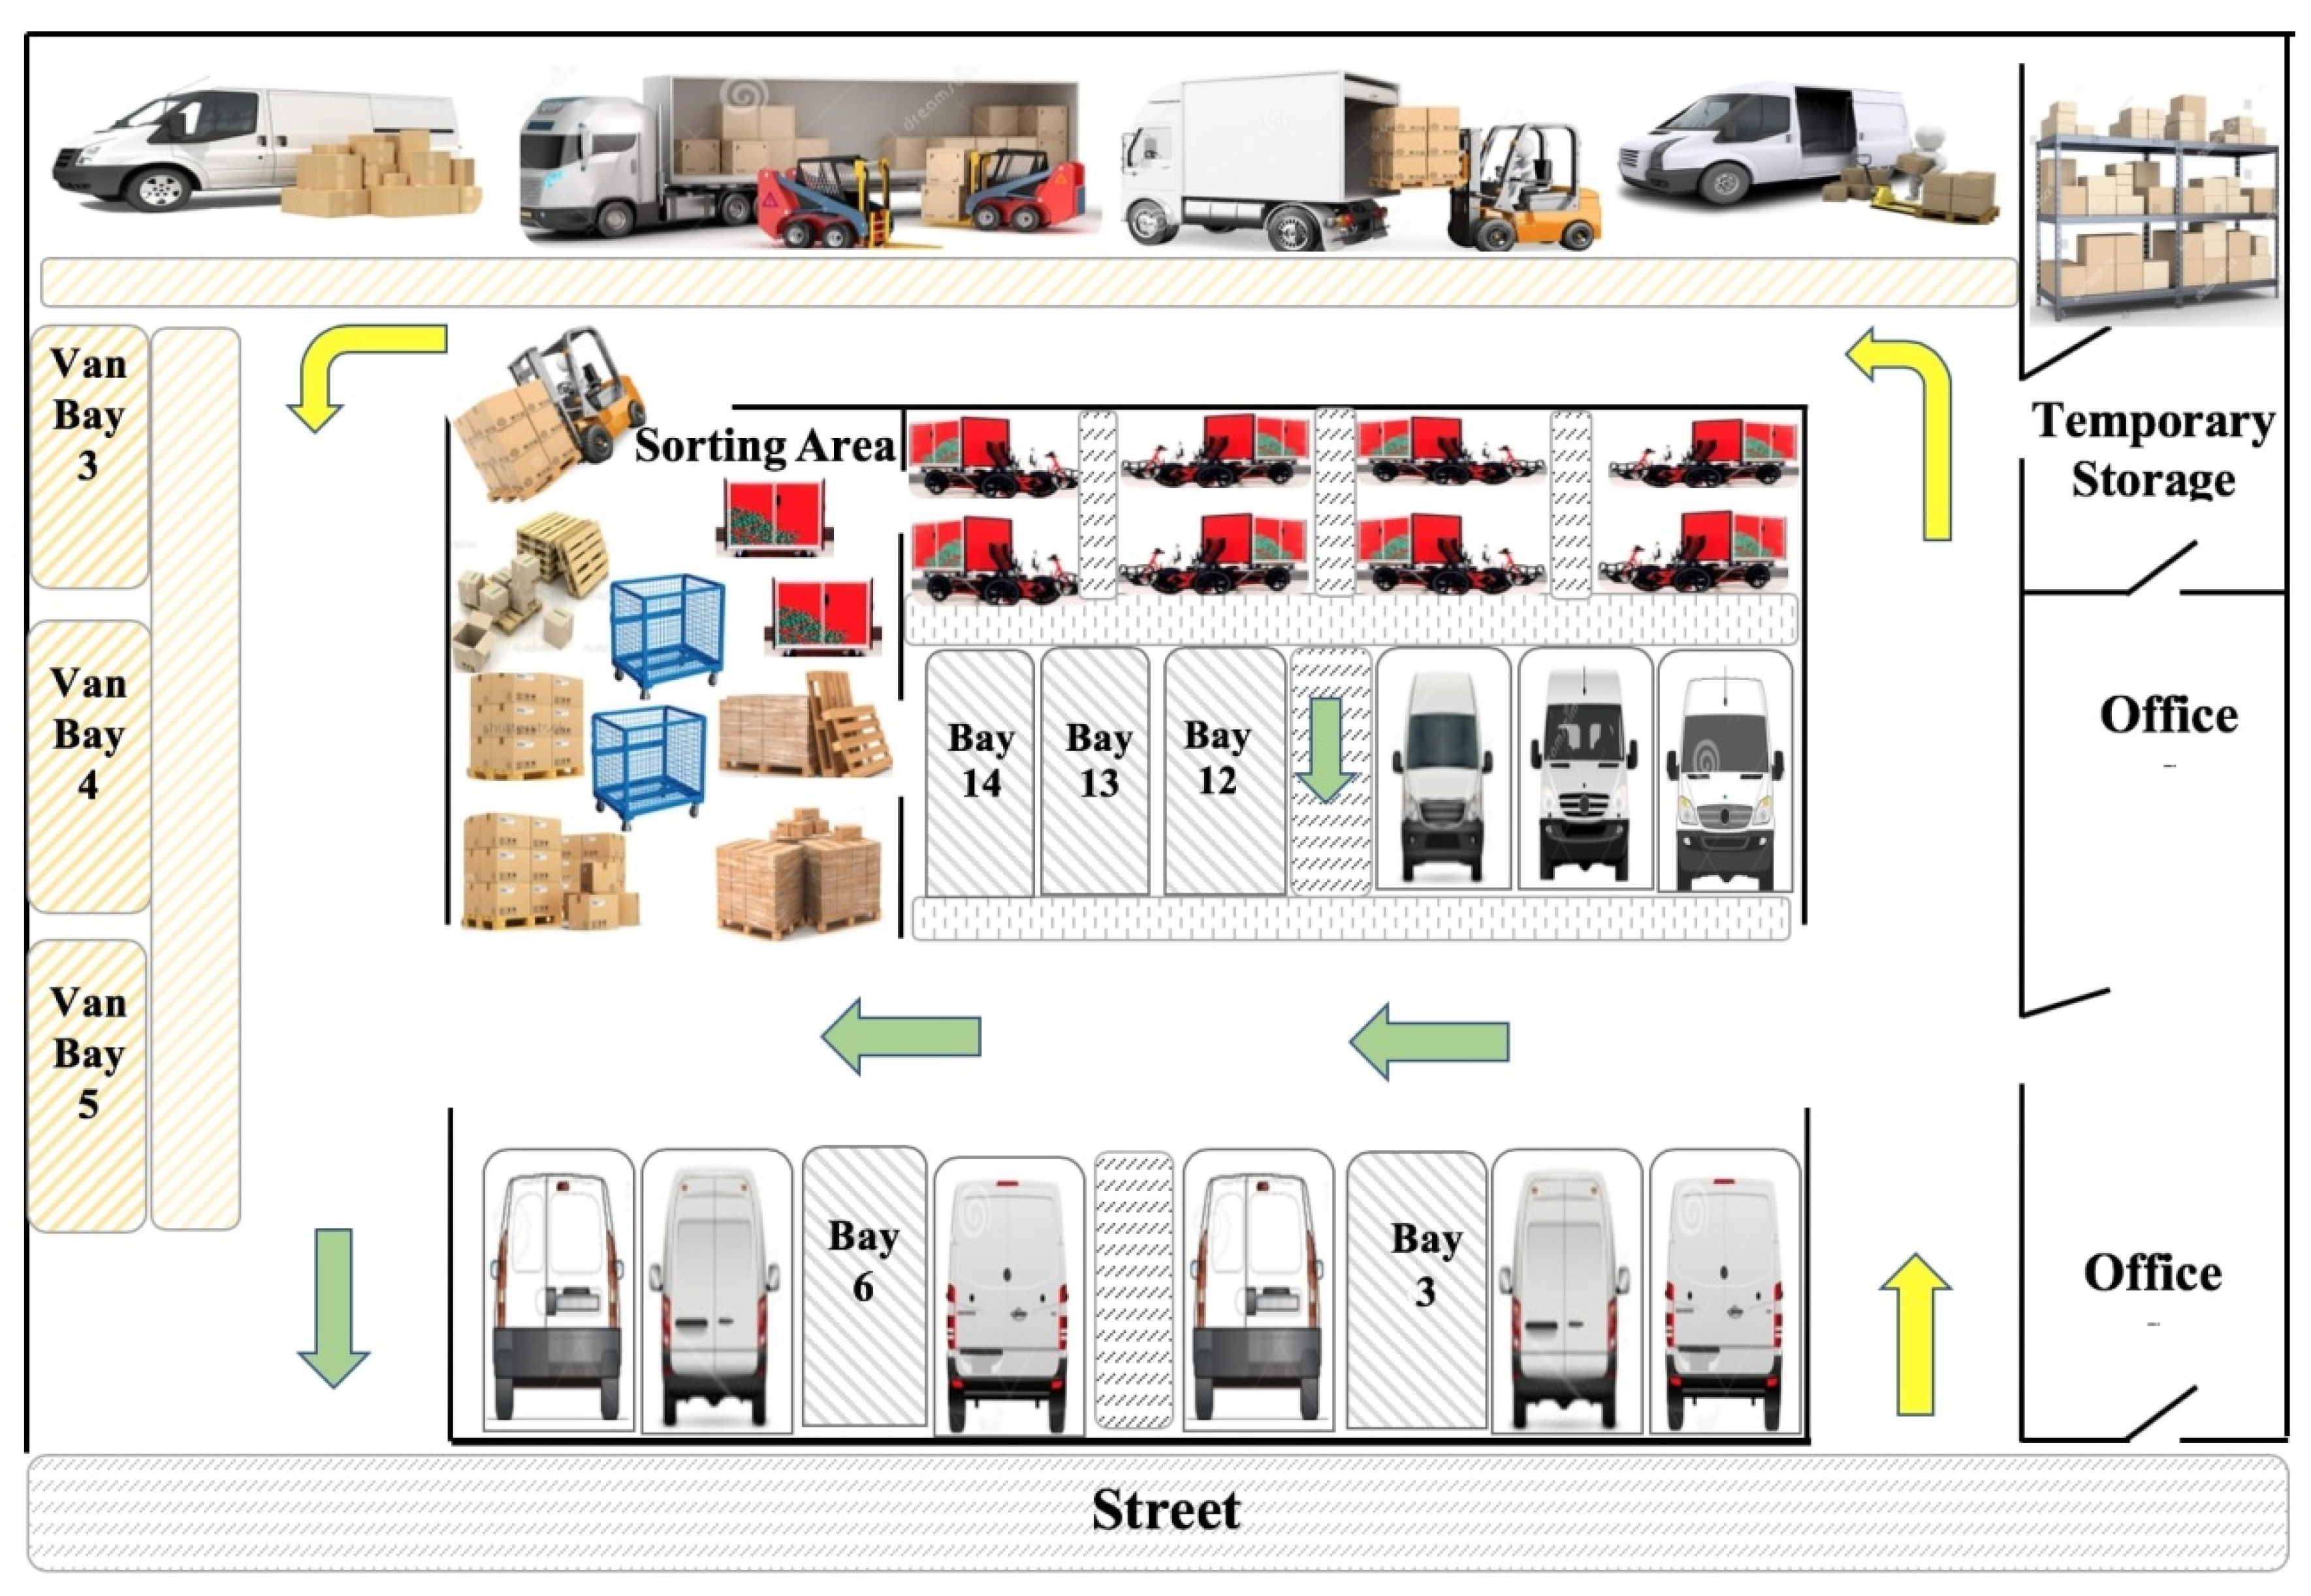
Table 1.
Linguistic variables used to describe criteria weights and rating values.
| Linguistic Scale for Importance | Fuzzy Numbers | Membership Function | Domain | Triangular Fuzzy Scale (l,m,u) |
|---|---|---|---|---|
| Just Equal | (1,1,1) | |||
| Equally important | (1,1,3) | |||
| Moderately important | (1,3,5) | |||
| Strongly important | (3,5,7) | |||
| Very strongly important | (5,7,9) | |||
| Extremely important | (7,9,9) | |||
| If factor i has one of the above numbers assigned to it when compared to factor j, then j has the reciprocal value when compared to i | Reciprocals of above | |||
Table 2.
Key criteria for all stakeholder groups for the MAMCA framework.
| Stakeholder | Objective | Criteria | F-AHP Weights |
|---|---|---|---|
| Logistics Services Providers | Provide high-level service to shippers and receivers | Service Level | 0.1648 |
| Minimise total duration between picking and delivering products | Delivery Lead Time | 0.2148 | |
| Utilise other freight transport modes | Multi-Modality | 0.0351 | |
| Reduce cost of collecting and delivering products | Transport Cost | 0.2703 | |
| Optimise vehicle capacity to utilise vehicles properly | Vehicle Fill-Rate | 0.1270 | |
| Realise efficient integration between information system of consolidated delivery’s carrier and other carriers to provide delivery updates | System Integration | 0.0814 | |
| Reduce damage and theft of delivered products | Delivery Security | 0.1066 | |
| Receivers | Maintain receiving frequent deliveries on time | Delivery Punctuality | 0.2462 |
| Reduce the cost of receiving parcels | Parcel Receiving Cost | 0.3517 | |
| Receive continuous delivery status updates | Delivery Status Updates | 0.1214 | |
| Deliver products during non-busy operating hours to avoid disrupting staff activities | Convenient Deliveries | 0.0634 | |
| Build attractive Shopping environment with minimum freight vehicles | Business Environment Attractiveness | 0.0841 | |
| Ensure the safety and security of delivered products | Delivery Security | 0.1332 | |
| Shippers | Maintain low cost of delivering products to receivers | Delivery Cost | 0.2648 |
| Quickly pick up of products upon request and expedite delivery to receiver | Quick Delivery | 0.2104 | |
| Achieve updated exchange of delivery documents (parcel pick-up and delivery window, waybill and proof of delivery) | Delivery Documentation | 0.1130 | |
| Ensure successful and on-time delivery to receiver | Receiver Satisfaction | 0.3539 | |
| Realise carrier’s accessibility and readiness for delivery | Carrier’s Availability | 0.0579 | |
| Local Authorities | Establish a liveable city for citizens with limited nuisance (less noise, emissions and accidents) | Liveable City | 0.3552 |
| Implement low-cost measures to enhance the freight transport network and urban environment. | Low-Cost Measures | 0.1910 | |
| Enhance the utilisation of existing infrastructure | Network Utilisation | 0.0701 | |
| Reduce the number of freight vehicles and reduce congestion near homes and shopping areas | Urban Accessibility | 0.2515 | |
| Reduce the negative impacts of the facility on sensitive surrounding uses | Impact on Surroundings | 0.1322 | |
| Citizens | Prevent accidents near homes and shopping areas and reduce the number of freight vehicles | Traffic Safety | 0.3191 |
| Build attractive environment for residents and shoppers with limited nuisances (noise, emission and congestion) | Quality of Life | 0.4719 | |
| Continuously supply products and services in shops | Product Availability | 0.2090 | |
| Logistics Property Providers | Achieve high return on investment and lease facility to LSPs at a competitive price. | Profitability | 0.4474 |
| Reduce the repair and maintenance cost of the facility and minimise damage and deterioration to the facility | Repair and Maintenance Cost | 0.1273 | |
| Integrate the facility to coexist with other surrounding uses | Harmonious Integration | 0.2563 | |
| Be close to major freight corridors and receivers. | Location Accessibility | 0.1690 |
Table 3.
Summary of the changes in criteria weights for the sensitivity analysis.
| Stakeholder | Criteria | Original Weight | Modified Weight | Changes on the Ranking or Evaluation Score |
|---|---|---|---|---|
| LSPs | Transport Cost | 27.03% | 34% | No change |
| Delivery Lead Time | 21.48% | 26% | ||
| Receivers | Delivery Punctuality | 24.62% | 30% | No change |
| Convenient Deliveries | 6.34% | 12% | ||
| Shippers | Delivery Cost | 26.48% | 30% | No change |
| Receiver Satisfaction | 35.39% | 28% | ||
| LPP | R&M Cost | 12.73% | 20% | Slight drop in the evaluation score of “Cargobike” scenario |
| Location Accessibility | 16.9% | 20% | ||
| Harmonious Integration | 25.63% | 15% | ||
| Local Authorities | Low-Cost Measure | 19.10% | 28% | No Change |
| Network Utilisation | 7.01% | 18% | ||
| Citizens | Product Availability | 20.90% | 30% | Slight drop in the evaluation score of “Cargobike” scenario |
Table 4.
Operational characteristics of the leading electric and hybrid LCVs in the global market.
| Vehicle | Uses | Driving Range (km) | Battery Capacity (kWh) | Battery Charging Time at 100% (hour) | Battery Charging Time at 80% (min) | Load Capacity | Price ($USD) |
|---|---|---|---|---|---|---|---|
| Battery Electric LCV (BEV) | |||||||
| Nissan e-NV200 | Harrods (UK), FedEx (UK), Coca-Cola (Japan) | 170 | 40 | 7.5 | 40 | 770 kg, 4.2 m3 | 26,000 |
| Renault Kangoo ZE | La Poste (France), Gnewt Cargo (UK), Australia Post | 190 | 33 | 6 | 60 | 650 kg, 4.0 m3 | 27,000 |
| Citroen E-Berlingo | La Poste (France) | 170 | 22.5 | 8 | 30 | 695 kg, 4.1 m3 | 29,000 |
| Peugeot Partner Electric | 165 | 45 | 7.5 | 30 | 636 kg, 4.1 m3 | 26,000 | |
| Voltia eNV200 Maxi | Gnewt Cargo (UK), TNT (Czech Republic), DPD (Slovakia) | 170 | 40 | 6 | 30 | 600 kg, 8.0 m3 | 39,000 |
| StreetScooter Work L | DHL (Europe) | 118 | 60 | 8 | 60 | 960 kg, 8.0 m3 | 64,000 |
| Mercedes eVito | Released 2018 | 150 | 41 | 6 | 45 | 1073 kg, 6.6 m3 | 49,000 |
| Renault Master ZE | Released 2018 | 120 | 33 | 6 | 60 | 1110 kg, 11 m3 | 60,000 |
| Mercedes eSprinter | Available Mid-2018 | 150 | 41 | 6 | 45 | 1040 kg, 10.5 m3 | - |
| Volkswagen e-Crafter | Available Mid-2018 | 160 | 35.8 | 5.5 | 45 | 1709 kg, 10.7 m3 | - |
| Hybrid Electric LCV | |||||||
| Workhorse E-GEN | UPS (USA) | 90 km (Battery) | 60 kWh battery | 1370 kg, 14 m3 | 25,000 | ||
| Ford Transit Custom PHEV | Available Late 2018 | 50 km (Battery) | 1000 kg, 8.3 m3 | ||||
© 2018 by the authors. Licensee MDPI, Basel, Switzerland. This article is an open access article distributed under the terms and conditions of the Creative Commons Attribution (CC BY) license (http://creativecommons.org/licenses/by/4.0/).
Share and Cite
MDPI and ACS Style
Aljohani, K.; Thompson, R.G. A Stakeholder-Based Evaluation of the Most Suitable and Sustainable Delivery Fleet for Freight Consolidation Policies in the Inner-City Area. Sustainability 2019, 11, 124. https://doi.org/10.3390/su11010124
AMA Style
Aljohani K, Thompson RG. A Stakeholder-Based Evaluation of the Most Suitable and Sustainable Delivery Fleet for Freight Consolidation Policies in the Inner-City Area. Sustainability. 2019; 11(1):124. https://doi.org/10.3390/su11010124
Chicago/Turabian StyleAljohani, Khalid, and Russell G. Thompson. 2019. "A Stakeholder-Based Evaluation of the Most Suitable and Sustainable Delivery Fleet for Freight Consolidation Policies in the Inner-City Area" Sustainability 11, no. 1: 124. https://doi.org/10.3390/su11010124
Note that from the first issue of 2016, this journal uses article numbers instead of page numbers. See further details here.