Article

Impact of Environmental, Social, and Governance Information on Economic Performance: Evidence of a Corporate ‘Sustainability Advantage’ from Europe

Department of Economics, University of Foggia, 71121 Foggia, Italy
*
Author to whom correspondence should be addressed.
Sustainability 2019, 11(6), 1738; https://doi.org/10.3390/su11061738
Submission received: 27 February 2019 / Revised: 15 March 2019 / Accepted: 15 March 2019 / Published: 22 March 2019
(This article belongs to the Section Economic and Business Aspects of Sustainability)

Abstract

:
Both UN Agenda 2030 and the Directive n. 2014/95/EU have recently promoted a marked improvement in sustainability disclosure, especially for larger companies or groups. Starting from this premise, we carried out an original study on the financial materiality of the E-S-G (environmental, social and governance) information of primary companies listed on major European indices in Belgium, France, Germany, Italy and Spain (BEL, CAC, DAX, FTSE-MIB, IBEX). Within the Stakeholder Theory and the Corporate Social Responsibility (CSR)–Corporate Social Perfomance (CSP) framework, our empirical analysis examined the impact of non-financial results (assessed through sustainability indicators) on economic (financial and market) performance in the timespan 2014–2017. We propose a different approach from previous studies, based on a PLS (Partial least squares)/SEM (Structural equation modeling) methodology together with the unprecedented consideration of “ESG” measures (Environmental, Social and Governance), either absolute (scores) or relative (extra-performance over industry sector). We find that, despite the absolute level of the individual ESG scores not being impactful, the “distance” from the industry average–normal figures (excess or abnormal ESG performance) is positively relevant, collaterally revisiting the notion of competitive advantage in sustainability terms. Corporate size is shown to be a significant background factor (as slack resources proxy). Social, environmental and governance responsibility (to all stakeholders) appear to be important as a competitive factor of the modern firm.

1. Introduction

The present article offers an analysis of the socio-environmental and governance dimensions of the firm system in order to verify in holistic terms the possible impact of the sustainability indicators [1,2] on the economic performance [3,4]. This relates to the CSR-CSP (Corporate Social Responsibility–Performance) strand [5,6,7,8] in consideration of the Stakeholder Theory framework [9,10,11], as well as being consistent with the Shared Value Theory [12] (as an evolution of the Shareholder View [13]).
With regard to Europe, in addition to the recent best practice on Integrated Reporting (IR) [14,15,16,17,18], the new corporate law itself (Directive No. 2014/95/EU) requires a new valuable information deliverable (sustainability disclosure).
In this context, larger companies or groups (corporate size) are involved with a dissemination of their Non-Financial Information (NFI) by means of a suitable report focusing on the business model, policies, sustainability risks and Key Performance Indicators (KPIs). Such reporting has to highlight firms’ “commitment” to the environment and social responsiveness, even covering the respect for human rights, anti-corruption and bribery issues, and diversity on the boards of directors. This commitment is profitably implementable, in our opinion, with a reliable quality of governance (thanks to sound administration and control procedures and rules, effective role of the ownership and monitoring functions of the board, internal conflict mitigation, etc.). The promotion of real initiatives and events, and the achieving of an innovative performance and reporting system characterised by a ‘multidimensional’ bottom line [19] becomes vital, along with the communication of accredited metrics and reputational parameters usually built on hundreds of individual indicator assessments.
These advances and transformations are indeed nowadays favored in and by the business community, in part thanks to a growing diffusion of authoritative guiding principles and prestigious standards (as EMAS, Global Compact, Guiding Principles on Business and Human Rights, ISO 26000, GRI—Global Reporting Initiative, PRI—Principles for Responsible Investment), together with the proliferation of company ethical codes and a new culture with respect to ecological footprint related to goods and services; in short, combining competitive advantage and welfare.
External recognition of the corporate responsibilities, social commitment and consequent activities undertaken in terms of sustainability—with a financial and market impact—is often reflected by the inclusion of their equity (or equivalent financial instruments) in specific stock indices or thematic funds (Dow Jones Sustainability World Index, Ethical Index Euro, Ftse4Good, MSCI, UNGC 100, Vigeo, ECPI, STOXX, D&I, etc.).
Above all, a new special emphasis has recently been placed on the ‘triad’ Environmental-Social-Governance (see infra for the academic background), providing listed companies with valid guidelines for the voluntary integration of ESG considerations into investor relations. For example, in 2017, the London Stock Exchange Group—which also includes Borsa Italiana—approved specific indications for ESG reporting, with the substantial effect of enabling easier identification of sustainable investments and Socially Responsible Investing (SRI) [20].
In this framework, the objective of the present study is to perform an empirical test of the economic reverberation of the aforementioned non-financial dimensions—here specifically assessed through appropriate ESG consideration and metrics—on business results, also advancing an innovative methodology.
Given that European companies excel at EGS attention, a representative sample of prominent companies listed on main and homogeneous stock indices in Belgium, France, Germany, Italy and Spain (BEL, CAC, DAX, FTSE-MIB, IBEX) with good sustainability indicators was selected in order to investigate—for the period 2014–2017—the existence of “relevance” of non-financial disclosure (specifically ESG indicators) to economic performance. Thus, the research question is: can firms’ ESG engagement represent a (market & accounting) value relevant condition associated with the production of greater economic-financial returns?
The work is organised as follows: Section 2 analyses the literature background on CSR, CSP and ESG within the Stakeholder Theory framework; Section 3 defines the assumptions (HPa, HPb e HPc); Section 4 sets out the methods and illustrates the execution of the empirical analysis with regard to: (i) sample characteristics; (ii) descriptive and correlative statistics (univariate and bivariate); and (iii) inferential models (linear regressions/structural equations); Section 5 sets out the discussion of findings and concluding remarks.
In contrast to other works (literature gap), this study proposes an innovative stastistical approach based on the Structural Equations Model applied in consideration of ESG indicators (as antecedent variables), both in absolute and relative terms. The empirical findings show that while absolute levels of the ESG scores did not impact the company performance, a positive effect was exerted by the extra-performance over industry sector (namely, excess or abnormal ESG). In the examined context, corporate size was a significant background factor (slack resources source). The “extra-ESG advantage” variable, being relevant, was shown to be a novelty, making it possible to reinterpret the fundamental competitive advantage in the sustainability key. In a nutshell, social, environmental and governance responsibility (to all stakeholders) represent a relevant competitive advantage for companies investing in ESG factors more than other competitors.

2. Literature Review

2.1. Theoretical Framework

In recent years, the debate surrounding the socially responsible behaviour of companies and the role it plays in the value creation process has been gaining an increasing relevance in management and business ethics studies.
The concept of social responsibility, however, has achieved no univocal definition, as it has been discussed in different ways.
The Stakeholder Theory argues that companies must consider the interests of all parties that, directly or indirectly, are involved in the business activities to create sustainable value over time. In other words, companies have a responsibility to operate in the interest of all their stakeholders [21], and dissatisfaction in any stakeholder groups may potentially have a negative impact on financial results and even put the firm’s survival at risk [5]. If the Stakeholder Theory focuses on the relationship between the company and its stakeholders, all of whom (equally) need to be considered and satisfied to create sustainaible value in the long term [22], the Corporate Social Responsibility (CSR) model looks at the company from another perspective.
CSR, essentially, can be defined as the responsibilities towards communities, or ‘society at large’ (in terms of promoting education, health care, environmental conditions, charity, ethical labour practices and more) or, in other words, the company’s commitment to a fair behaviour that takes into account the economic, social and environmental consequences of its work [23].
It is without doubt that corporate responsibility towards stakeholders is connected to corporate value and value creation. In this light, recently, Porter and Kramer theorized a new way of creating value that focuses on the connections between societal and economic progress, called Corporate Share Value (CSV). This can be defined as a management strategy in which companies create economic value through societal benefits.
In other words, Shared Value is the set of policies and operating practices that increase the competitiveness of a company and improve the economic and social conditions in the communities in which it operates. It represents, in short, a different way of spreading economic wealth through the creation of social benefits, where competitiveness and profit are driven by the satisfaction of the needs of the community [12]. In this study, we focus on a current, more specific, line of research connected to the stakeholder theory that is known as ESG (Environmental, Social and Governance).
The concept of ESG is used in different contexts and has no univocal definition [2]; it is typically used in corporate procedures to denote a set of relevant environmental, social and governance-related elements that allow the assessment of long-term sustainability of investment [24,25] by integrating the traditional economic-financial parameters. It is important to underline that in the United Nations Principles for Responsible Investment, ‘Environmental, Social and Governance factors’ refer to three different though related fields within ‘social awareness’. The first field is related to the environment and includes climate change, greenhouse gas emissions, exploitation of resources, waste, pollution and deforestation. The second topic deals with working conditions, health and safety, relationships with employees, and diversity. The third subject, finally, involves corporate governance practices, including managerial compensation, the composition of the Board of Directors, audit procedures and Senior and Corporate Executives’ behaviours in terms of compliance with the law as well as ethical principles and code of conduct. Usually, Governance implies the highest level of transparency, while Environment has the lowest [26].

2.2. Prior Research Discussion on the Relationship between Corporate Responsibility (CSR, CSP and ESG) and Performance

Several studies have analysed the impact of corporate responsible behaviours and non-financial information (sustainability disclosure) on business performance, with contrasting results.
According to a significant study, socially responsible policies generate a positive impact on corporate performance [27,28,29], thus providing several benefits such as reduced operating costs and financial risks, and enhanced efficiency and competitiveness, as well as increased corporate reputation and consumer confidence [30,31,32,33,34,35,36,37,38]. From the same perspective, [39] highlighted that companies engaging in irresponsible or illegal behaviours cause inconvenience to shareholders. To enhance corporate value [40], socially responsible behaviours that are compliant with the law are needed.
Conversely, other research has emphasized the presence of a negative correlation between the aforementioned variables, claiming that socially responsible policies only lead to increased costs and a resulting decrease in corporate return [41,42]. However, this scenario does not imply that companies should not adopt socially responsible policies; some managers, in fact, believe that fostering this kind of behaviour is necessary in order to maintain stable relationships with stakeholders [43], and also because shareholders call for CSR policies for ethical or moral reasons, even if this may involve reduced profits [44]. Some scholars claim that some companies bear higher costs of socially responsible policies only for commercial purposes, and not for altruistic reasons [45], or—in some cases—to conceal fraudulent activities in order to preserve a clean-cut external image [46].
It is important to underline that not all studies agree upon the kind of relation existing between social responsibility policies and corporate performance.
For instance, some research argues that ‘U-shaped’ relations between the two variables can be identified in place of the standard linear dependence. Some doctrinal evidence shows that the effect of CSR on CFP (Corporate Financial Performance) might be negative in the short term and positive in the long term. Therefore, long-term planning is necessary, so that any investments in socially responsible behaviours result in beneficial outcomes to shareholders [47,48]. Other analyses identify inverse curvilinear relations for positive CSR effects in the short term and negative impacts in the medium to long term [49].
Moreover, in the analysis of relations between CSR and performance, corporate size also represents a significant variable to be considered. Actually, some scholars argue that firm size has no relevant influence on this field of study [50], but other studies suggest that the effects of CSR policies carried out by stock-listed (and therefore bigger) companies show more relevant consequences than non-stock-listed ones [51].
These results proved by doctrinal frameworks notwithstanding, it is necessary—also for the purpose of our study and taking into consideration the outcome of some significant meta-analyses—to point out that research demonstrating positive relations is more relevant in terms of numerical incidence [52,53,54].
More specifically, several scholars have tried to find an existing direct causal relation between ESG and financial performances [55,56,57,58,59]; yet further studies were not able to univocally demonstrate whether ESG factors might affect corporate results, either positively or negatively [28,60,61,62,63].
In this regard, the recent thorough review in [64] of the accounting and finance literature focused on the effects of environmental, social and governance disclosures and performance on firm value is remarkable.
Relevant research has proved that the assessment of ESG factors allows an enhanced identification of the risks and opportunities that companies have to cope with, thus favoring advanced risk-management processes [2], and the conditions where corporate results are formed, although through indirect ‘dynamics’. In this regard, Murphy and McGrath [65] addressed a conceptual exploration of the motivation for corporations to provide ESG reports, proposing deterrence theory as a complementary explanatory reason for such reports (part of the motivation for some corporations to increase ESG disclosures would be to avoid, or mitigate, the risk of class actions and the associated financial penalties).
Furthermore, ESG performance can be interpreted as a management quality measurement, representing the company’s ability to face long-term trends while having a competitive edge [66]. From this perspective, companies cannot overlook all environmental, social and governance information if their purpose is to implement suitable strategic policies that can deal with future scenarios and achieve enduring economic results that can be ‘shared’ with all stakeholders [67]. Therefore, Du Rietz [68] emphasised the relationship between information and knowledge in corporate accountability in environmental, social, and governance settings, investigating (Nordic) investors’ engagement with companies addressing ESG issues (considering the information’s origin, convergence with other accounts, and use in contradicting and disproving executives’ information).
From a managerial perspective, recent research has explored the role of the main decision maker of large corporations (the CEO) in the interplay between ESG and firm performance. Li et al. [69] used a cross-sectional dataset consisting of FTSE 350-listed firms to investigate whether ESG disclosure affects firm value. They found a positive association, suggesting that improved transparency and accountability and enhanced stakeholder trust play a boosting role. It was reported that greater CEO power enhances the ESG effect (with reference to firms with greater CEO power, stakeholders associate the ESG disclosure with a greater commitment to ESG practice). Finally, Bouslah et al. [70] dealt with CEO risk-taking incentives and socially irresponsible activities, finding that, for the period before the 2007 financial crisis, CEO risk-taking incentives were positively related to socially irresponsible activities; whereas after the crisis, no significant relationship was detected (probably due to increased scrutiny regarding compensation packages and the increased role of reputational issues in the aftermath of the financial crisis). Rather, there is controversy surrounding the relationship between ESG performance and the presence of women on board of directors; despite Velte [71]’s positive relation, Manita et al. [72] found no significant relationship between management gender diversity and ESG disclosure.
To conclude the present section, since our empirical analysis of ESG and performance concerns a European context, it is worth underlining the relevance of the new corporate law (Directive No. 2014/95/EU) and the related guidelines (EUG), in addition to the growing spread of the IR practice, in improving the sustainability disclosure (non-financial disclosure, essentially social and environmental information). In fact, such a context favors the conditions for generating non-financial information of firms in general and ESG in particular (as a subset that does not coincide with the whole non-financial dimension).
In this regard, by performing a content analysis on a sample of annual reports and integrated reports (IR) drafted by the 50 biggest European companies, Manes-Rossi et al. [73] find that there is already a high level of compliance by large European companies with the EUG. We believe that the inclusion of the ‘governance performance’ information (within ESG indicators, alongside the typical social and environmental dimensions) can give the stakeholders (especially the investors, as the primary recipients of reports) a better chance to understand and assess how firms improve their legitimacy and are capable of creating value. As references [3,74] stated, “The Public Interest Entities’ pathway towards ESG reporting needs action in the field of governance, specifically policy, risk assessment, and diversity, and in the field of social and environmental accounting, notably KPIs. These actions need to be combined with best practices in CSR”. Therefore, firms (especially the larger entities) are somehow persuaded to embed ESG in their IR/NFI.
This ESG-oriented field of study then deserves further analysis, in order to assess the possible impact (and degree) of ESG performances on business results.
Section 3 provides further analysis of this perspective, formulating the research hypotheses, which are tested in Section 4.

3. Hypotheses

In accordance with the findings emerging from the scientific literature and practice described in Section 1 and Section 2, we outline the following assumptions to be tested empirically in a uniform and up-to-date context.
First of all, a general research assumption is that of the existence of a significant correlation between the following variables with reference to stock-listed companies: CS (Corporate Size), ESG (Environmental-Social-Governance), and FMP (Financial/Market Performance). In particular, in line with the Stakeholder Theory, and consistently with the previous prevailing analytical and meta-analytical evidence reported above, the expected correlation coefficient between ESG and FMP variables is positive (as well as the correlation between CS and ESG): the higher (lower) the former, the higher (lower) the latter.
By means of a holistic framework concerning corporate dynamics and relations (actions and reactions), we expect that sustainability indicators—whose performance may meet better conditions and growth opportunities in bigger companies, due to the availability of more resources and the existence of a higher investment capacity—can predict or support enhanced financial/market performance. In particular, Mervelskemper and Streit [75] indicated that ESG performance is a ‘value relevant’ issue [76] and it works more strongly in the positive direction when an ESG report is published, irrespective of its type (stand-alone or integrated report).
Nevertheless, Eccles et al. [77] concluded that only companies with high degrees of innovation—and who are therefore more likely to integrate innovation into their business models and into ESG measures—can really experience virtuous development stages, thus achieving higher financial performances too. Conversely, the recent econometric analysis carried out on a sample of three thousand companies (in the timespan 2002–2011) at the Harvard Business School highlighted that, without significant innovation, corporate financial performance can even get worse in conjunction with enhanced ESG performance levels (and vice versa).
From the above, we learn that an economically sustainable strategy in order to be enduring should satisfy the interests of all stakeholders: investors, employees, clients, governments, non-governmental organization (NGOs), and society. Therefore, the positive effect (represented by a growing indicator of complex performance in a two-dimensional graph) can be affected by the degree of innovation in terms of new products, processes and business models. That is, although minor innovations such as those associated with efficiency recovery programs might slightly enhance performance, only major innovation of products, processes or business models can reverse the downward curve (financial/non-financial performance frontier) into an upward one.
That said, we assume that major stock-listed companies denoting high capitalisation (such as the firms of our sample) are more likely to invest in innovation. Hence, we expect a significant and positive correlation between their economic (financial/market) performance and non-financial (ESG) indicators. The improved accountability and the enhanced stakeholder trust, as a consequence of the higher management quality, strategies and policies of such firms, should play a boosting role in impacting the economic results. In fact, the ESG culture improves the conditions under which the business processes themselves take place and corporate results are formed by means of the market and financial investors appreciation, as well as customer/stakeholder approval and trust (social reputation), thereby supporting incomes. This makes it possible for firms to face new challenges and seize economic opportunities.
As a consequence, in developed European stock markets, the following set of assumptions is hypothesized.
HPa: 
Companies’ FMP (Financial/market performance) has a positive correlation with the non-financial indicators, in particular with the ESG performance.
It follows that the higher the ESG indicators, the higher the economic performance.
In addition, Endrikat et al. [78] indicated that the firm size functions as an indirect determinant (acting as a proxy for other corporate values that may affect performance) for both sustainability performance and corporate financial performance. As an example, bigger companies are more likely to have ‘slack resources’ [79] that allow for higher investment in environmental and social activities (compliant to slack resource theory plus natural resource-based theory [27,32]). At the same time, they are more likely to be exposed to publicity, pressure, and stakeholder scrutiny [5,7,80]. The expected positive correlation between the entity size and corporate performances (both non-financial and financial) could be due to reasons such as economies of scale, greater availability of resources to invest and manage in responsible manner or greater control on stakeholders [81,82]. Following a vast ‘path meta-analysis’, the latter scholar claimed that firm size should not to be perceived as an inconvenience that could ‘mix up’ or bias the relation between social and financial performance (its impact would have a positive effect on both performances but with no significance).
Moreover, bigger entities are required by norms, best practice, and even by stakeholders’ attention to invest in and report more with respect to responsibility issues related to environmental, social and welfare protection, as well as to corporate governance policies and practice. Therefore, corporate size denotes an important background factor. The expected result is that corporate size (CS) should have a positive incidence with ESG performance due to higher available resources and greater visibility in society.
This leads to the second hypothesis:
HPb: 
The CS (Corporate Size) shows a positive correlation with the non-financial indicators, in particular with the ESG performance.
This means that the higher the CS level, the higher the ESG performance.
A significant correlation between the firm size and the financial results is expected, too, even if the current context under examination does not seem to meet the conditions for predicting univocal conclusions (and also not with regard to the algebraic sign) between size and results. In fact, within the troubled period analysed, the expected result concerning the relation between CS and FMP seems uncertain.
This (more uncertain) relation can be stated by the following hypothesis:
HPc: 
CS (Corporate Size) has a significant correlation with the FMP (Financial/market performance).
Nonetheless, in such contexts, we might certainly expect that larger companies are more likely to struggle harder than smaller companies to achieve high results, because during turbulent times, a capital rigidity could cause lower returns (due to higher fixed costs).
This suggests to us to control for a possible moderation effect resulting from corporate size, or ‘confusion’ or ‘suppressing’ effects, when compared with the CSP-ESG relation.

4. Methods

4.1. Sample Collection

While previous research in the field has most often considered the equity securities of firms as encapsulated into ad hoc sustainable indices, this study focuses mainly on the analysis of corporate sustainability scores (ESG). Indeed, it essentially searches for the ESG effect on a firm’s performance.
It is known that the major international companies are usually assessed on the basis of their ESG performances by third-party organisations that provide reports and ratings. Such information is increasingly used by institutional investors, asset managers, financial institutions and other stakeholders for their investment operations [83,84].
A non-comprehensive list of third-party providers includes: Bloomberg ESG data; Corporate Knights Global 100; DowJones Sustainability Index (DJSI); Institutional Shareholder Services (ISS); MSCI ESG Research; RepRisk; Sustainalytics’ ESG financial reports; Thomson Reuters’ ESG data.
Form such a perspective, Lefkovitz [85]’s Sustainability Atlas offered an outlook on international ESG (Morningstar) assessment using a bottom-up approach, in which the leading performance of businesses in the European context is noticeable (especially the Nordics and the Eurozone, with excellent and good performance, respectively, whereas controversies plague the UK and US).
In particular, in order to test the research hypotheses stated above, our study considers a representative sample of European companies stock-listed on major similar European indices in Belgium, France, Germany, Italy and Spain (showing similar ‘environmental factors’ and accounting traditions in the sense of [86], and belonging to the same cluster identified by Morningstar as having a ‘good’ performance for ESG), such as BEL, CAC, DAX, FTSE-MIB, IBEX. The purpose is to assess the supposed value/performance ‘relevance’ of non-financial factors/performances for the recent timespan 2014–2017.
The sample is made up of primary stock-listed companies with higher market capitalisation, size and liquidity. It includes 150 companies (30 for each index), 91 of them (61%) possessing the above-mentioned ESG rating due to the external relevance of responsible actions, initiatives and communications put in place.
The ESG dummy criterion is met when the relevant score analytics addressed to stakeholders (investors in particular) are publicly shown.
The results indicate that ESG culture was more likely to be deeper in France (90% of the panel analysed) and Germany (97%), followed by Spain (63%), Belgium (37%), and Italy (17%).

4.2. Variable Measurements

It is worth underlining that we use the above-mentioned ESG ratings adopted by Sustainalytics (provided by Morningstar and issued by Bloomberg) as a second-level integrated CSP.
The relation scores indicate the corporate ESG ratings gathered by Sustainalytics for each parameter (E, S, and G).
Companies get a score in a 1–100 range for Environment, Social and Governance results, while the overall rating (ESG_Tot) is the weighted mean score of the three parameters (following the adaptation of each factor in each branch of activity).
As for the rating scale (sector/industry-based comparison) and the inherent methodology, each industry considers at least 70 indicators in 3 clusters: preparedness, disclosure, and performance. Company involvement (elicited by a draft to the examined company) makes it possible to gather feedback and up-to-date/additional information before the issuing of the annual ESG Rating Report.
It is important to note that recently (2017), many socially oriented incidental events have affected the ESG sustainability of firms (specifically, 59% of controversies analysed internationally out of more than 29,000 cases in the timespan 2014–2016). These have been connected with product and service quality, but there is a significant incidence related to working standards, gender and inclusion policies, human rights, relationships with local communities, supply chain, data protection, security, etc., while the banking and food & beverage industries, particularly, are considered ‘risky’ fields (the automotive sector stands out in terms of recalls of defective products or services).
Thus, a complementary variable, defined as “Controversy” is also to be taken into consideration (C; that is, any incidental event posing a threat to the ecosystem, local communities and the business itself). This (ESG) Controversy variable has a 1–5 range. Specifically, Category 1 (min) is defined as having a “low impact on environment and society, negligible risks to company”, while Category 5 (max) indicates a “severe environmental or social impact, serious risk to company”. Controversy topics included the evaluation of business ethics, society and community, environmental operations, environmental supply chain, product and service, employees, social supply chain, customer, governance, public policy.
Based on this premise, the key variables taken into consideration with regard to our hypotheses (ESG, FMP, and CS) have been divided into suitably grouped sub-variables/indicators.
Obviously, the core variable ESG considers indicators of environmental performance, social performance, and corporate governance results. Then, accordingly, a single latent factor (compund) variable of ESG performance is developed here.
Similarly, the FMP variable is synthesised as a latent factor variable representing both the income profitability (accounting performance) and the market value.
Corporate size is the unitary result obtained by gathering the typical drivers considered by the business science/doctrine (investments, employees, and turnover).
Hence, the key variables involved in this study—CS, ESG, and FMP—are divided into several sub-variables/indicators, showing the following descriptive statistics based on 450 firm-year observations (source: Thomson Reuters and Edgar Online for financial measures—FMP and CS; Morningstar, and Sustainalytics for ESG measures—ESG and C).
More specifically, the ESG metrics reported are based on the evaluation of the following elements for each company: E—carbon footprint, energy conversion efficiency, biodiversity and land use, waste and toxic emissions, clean technology and renewable energy; S—treatment of stakeholders, supply chain, employee training, talent retention, occupational safety and health, product safety, privacy and data security; G—company ownership, Board of Directors structure and independence, manager compensation, business ethics and corporate culture.
ESG ‘controversies’, instead, refer to “corporate environmental, social, and governance […] news stories such as suspicious social behaviour and product-harm scandals that place a firm under the media spotlight and, by extension, grab investors’ attention […]. This kind of news raises doubts about the firm’s future prospects, constitutes a risk for firm reputation, and may have an impact on firm value” [87]. It is important to remark that the latter study reveals that controversies do not exert a direct effect on a firm’s performance, but an indirect one via its interaction with ESG indicators.
To measure the FMP (financial/market performance) variable, the typical performance indicators (both operational and net indicators, such as ROI, ROA, CFOI—cash flow return on investment, ROS, and ROE) and unitary market values (price-to-book value) have been properly taken into account.
The CS (Corporate size), as stated, has been measured—at the same time—based on turnover, total investment, and number of employees.
The above-mentioned variables are completed by financial leverage (as a control variable), as a measure of mixed sources of financing, along with analysts’ stock recommendation (1–5 rating, where 1 denotes strong buy and 5 strong sell). We expect that the leverage during turbulent periods is more likely to reduce the performance of firms, whereas the analysts’ recommendation is more likely to tend towards ‘buy’ (‘sell’) when the performance grows (declines).
Moreover, in order to corroborate the empirical analysis, in addition to the ESG absolute measurements (1–100 score), the new ESG-surplus advantage ratios have been assessed based on the quotient between the individual parameters (E, S, and G) and the related applicable benchmark recorded for the whole Stock Market (these ratios have these symbols: dE, dS, and dG), also considering the similar measure for the complementary variables “C” (range 1–5; where dC is the ratio between corporate incidental significance and the competitors’ controversies).

4.3. Models: Regression Analysis and ESG-Based Structural Equation Pattern to Test the Hypotheses

The methodology used to test the hypotheses of our work implied first the evaluation of the descriptive (univariate) and correlation (bivariate) statistics, involving the variables of the selected sample representing European stock-listed companies. This analysis provides a factual framework within which to perform the following predictive inference (expressing the research objective). In detail, the following set of advanced methods was taken into account:
  • MLR (Multiple Linear Regression) for the sample of European corporations (450 firm-year observations for the ‘post-crisis’ period 2014–2017), including the above-mentioned dummy and control variables (fixed-effects panel data model, after executing preliminary Breusch-Pagan, Lagrange-multiplier and Hausman tests to control for pooled and/or random effects);
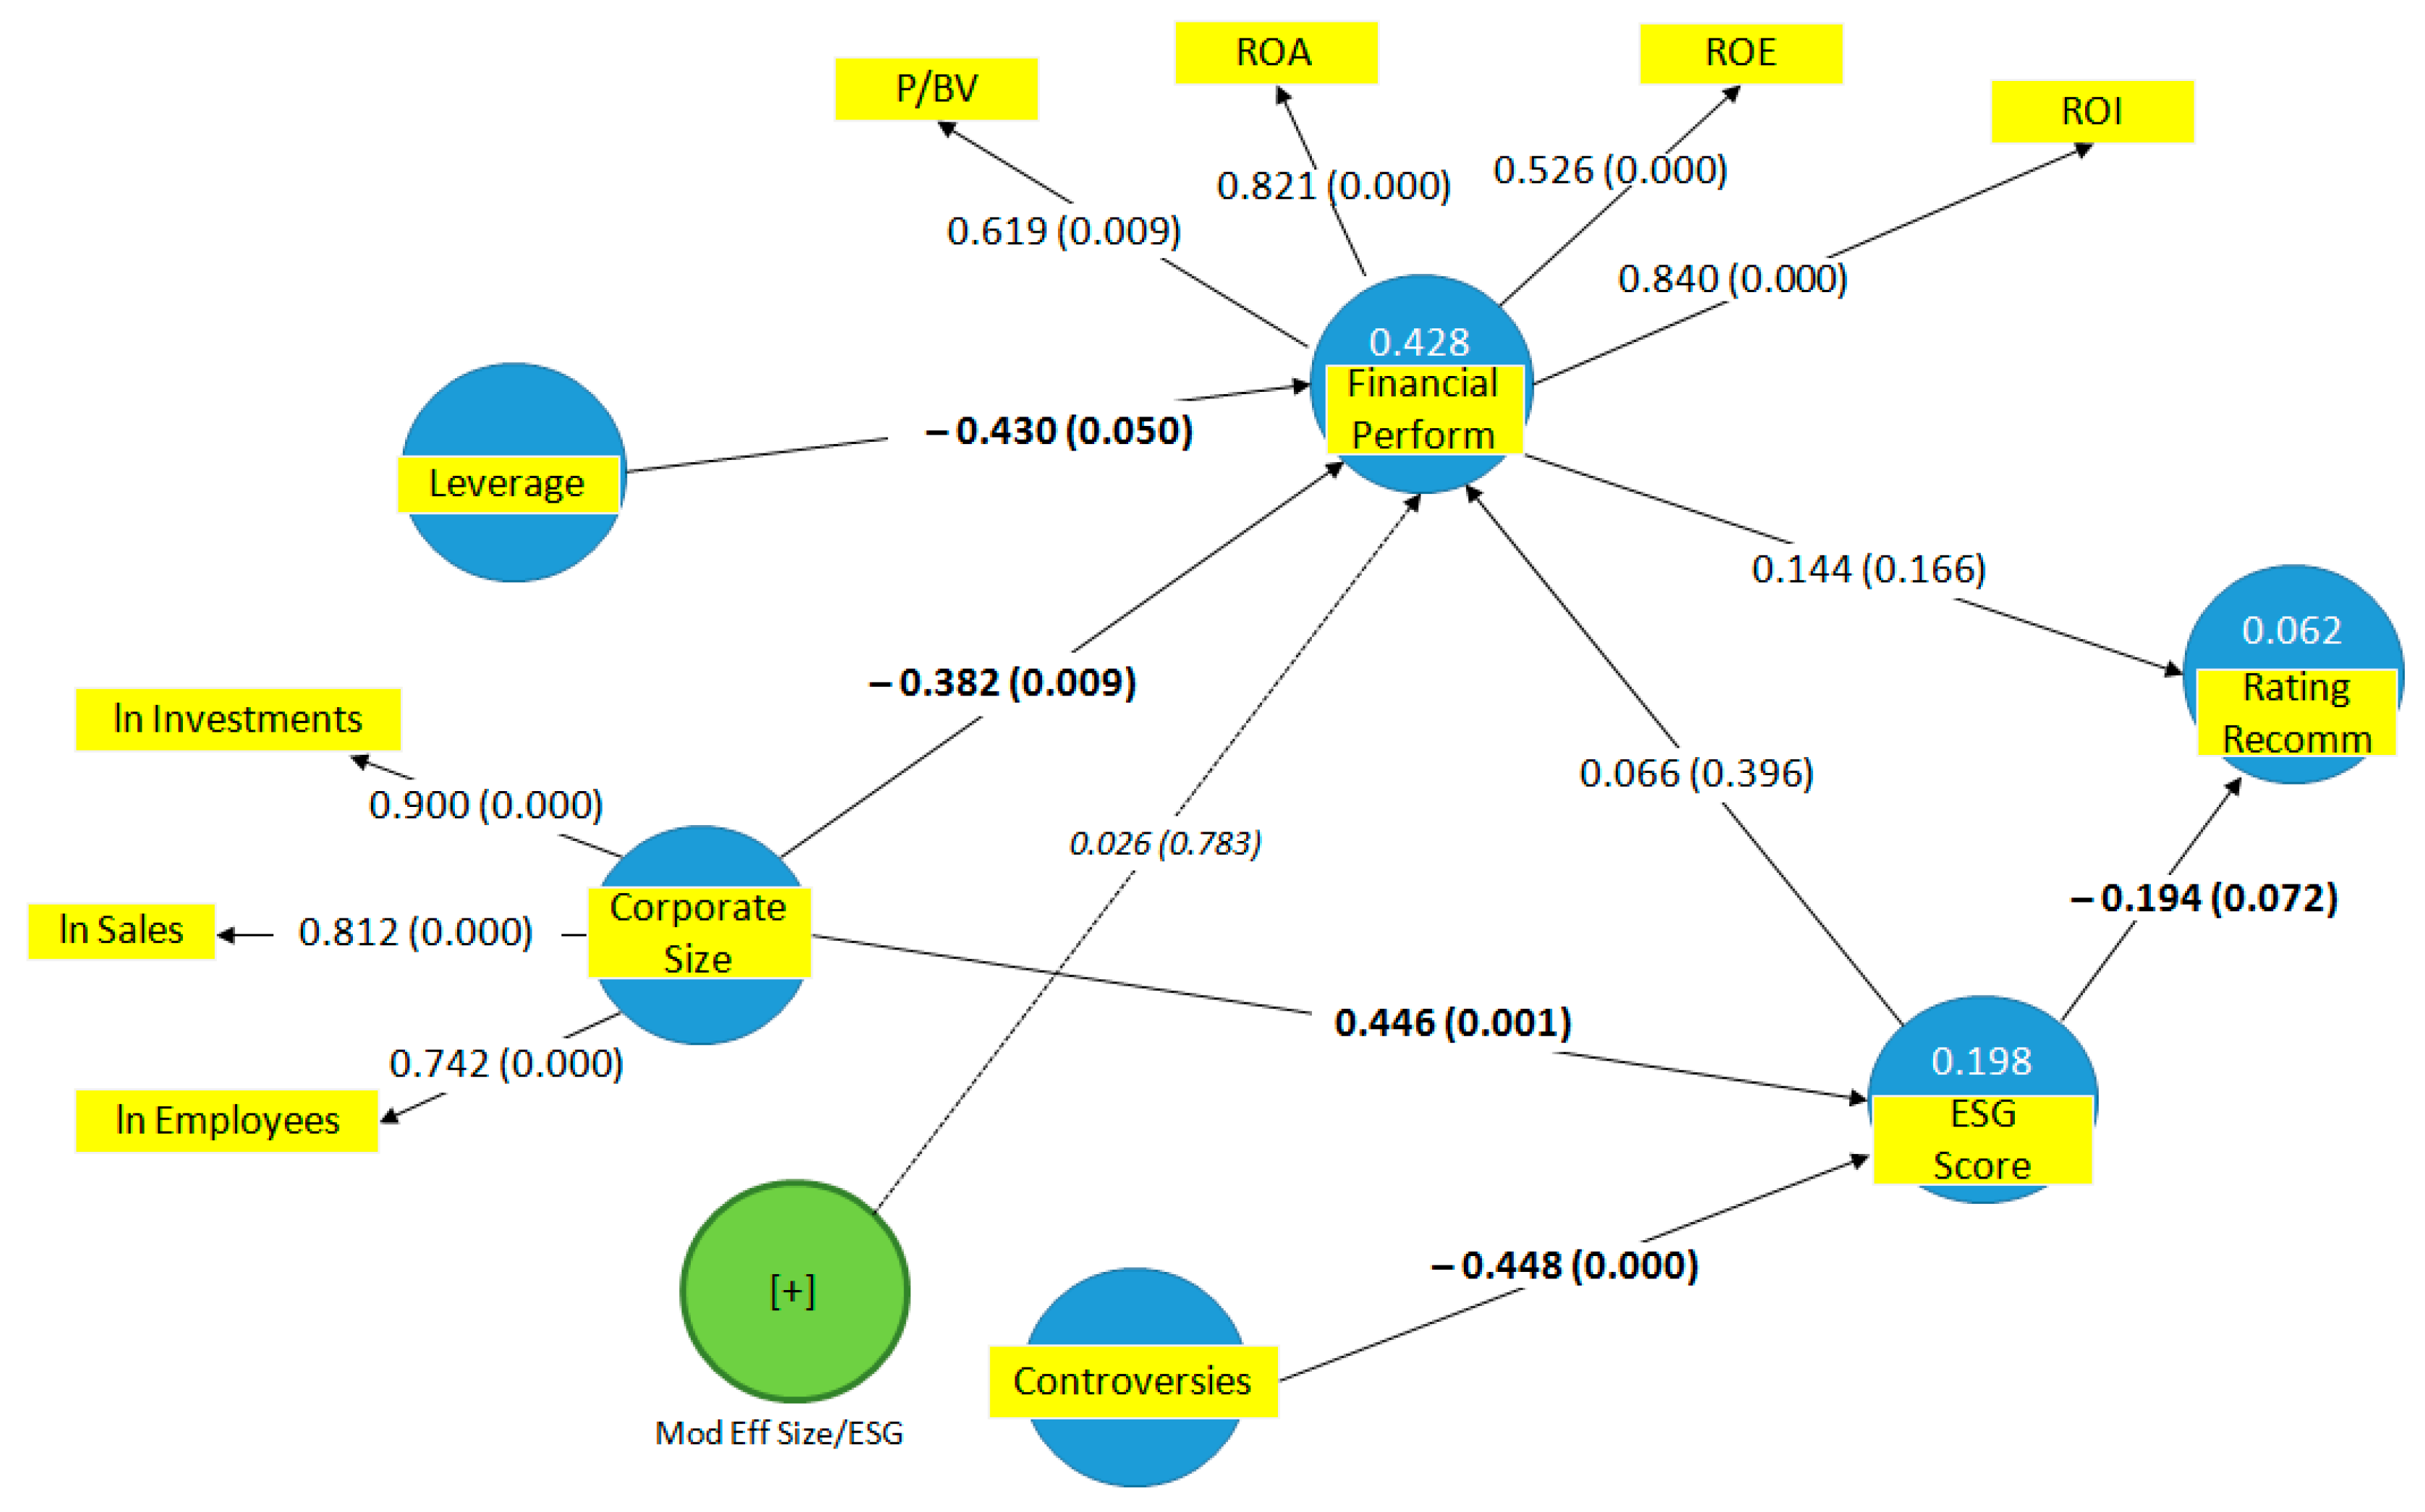
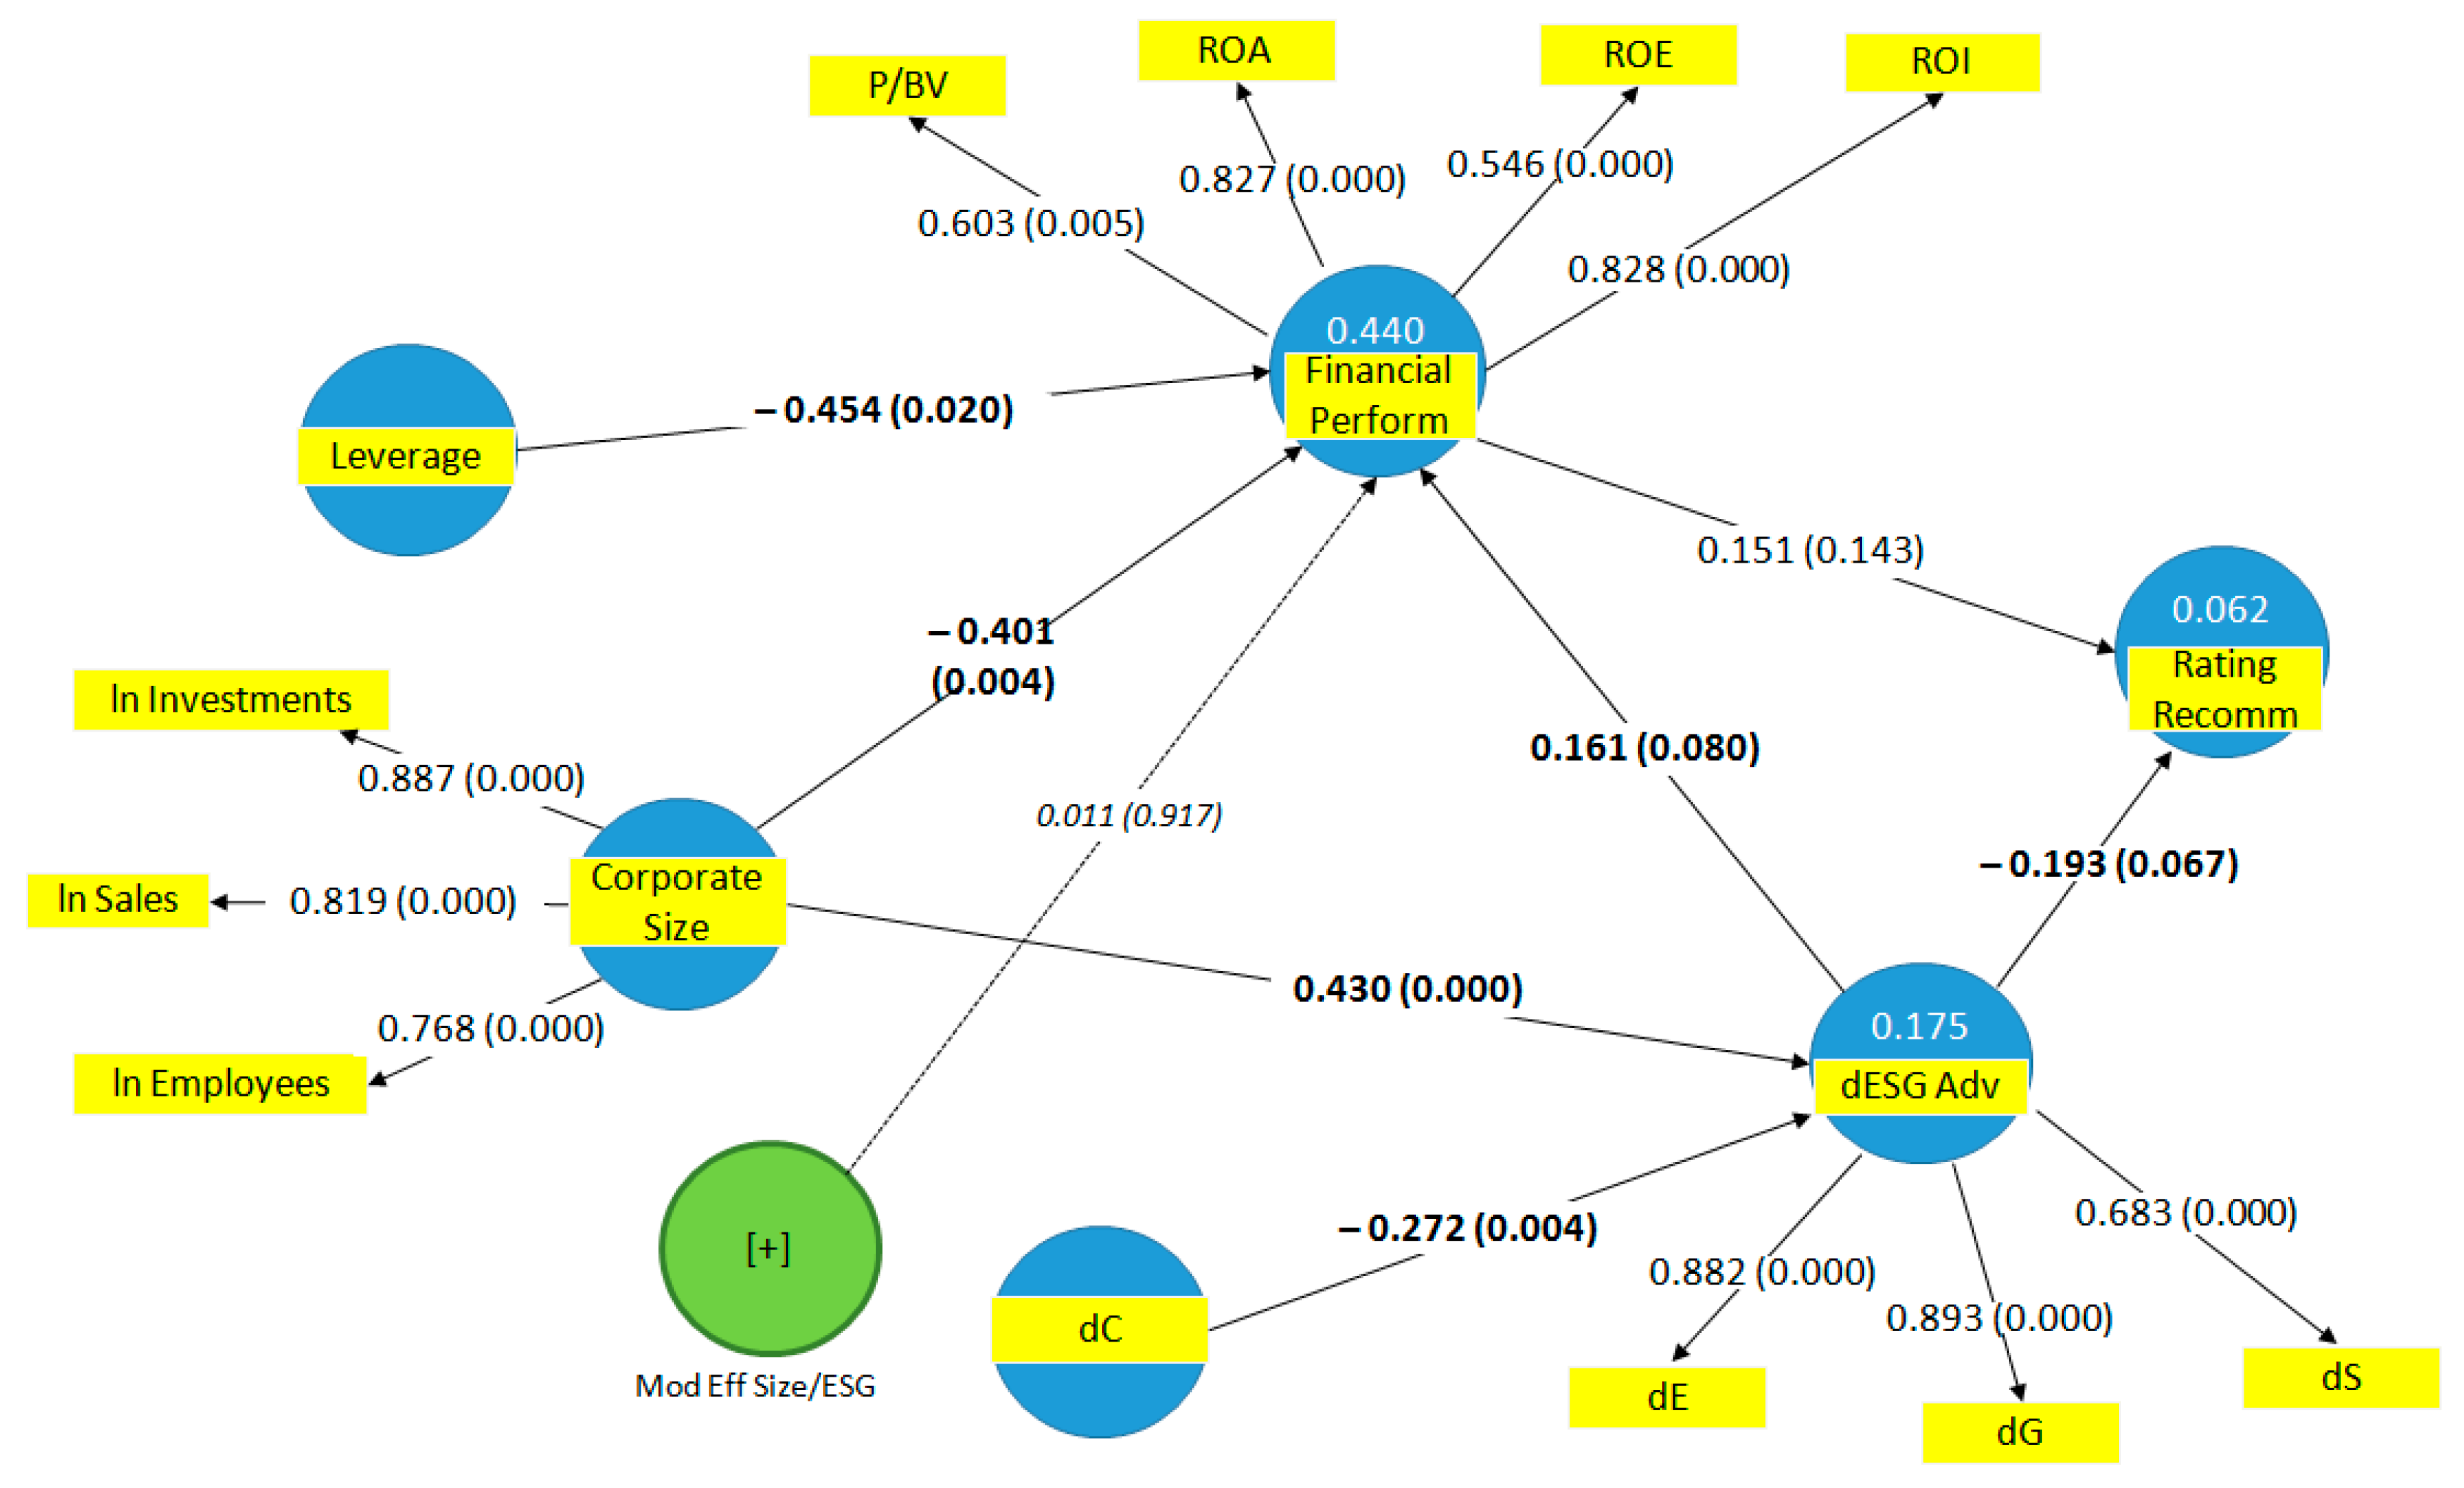
  • SEM (Structural Equations Model) performed by Partial Least Squares Path Modeling on the specific ESG sub-sample (analysed with regard to the 2016–2017 period due to the new regulatory framework set out at a European scale and the spread of ESG metrics, which would entail enhanced firm performance and evaluations [88]), in order to implement the analysed sub-variables with suitable vector clusters (latent variables: CS, ESG, and FMP, extracted from statistical projections and grouped by OLS). It is worth underlining that the SEM-PLS is a procedure increasingly being adopted in business and social sciences [89,90].
Relevant research fields have aimed to solve environmental/sustainability problems via SEM techniques, as shown by a comprehensive meta-analysis review, reported in [91] after reviewing all studies issued by Web of Science and Scopus in the timespan 2005–2016. PLS is used in 61% of SEM analyses, mainly at a corporate level (78%), and more often in lines of research like Resource Based View (RBV), Stakeholder Theory and Institutional Theory, as suggested by several US, Taiwanese and Chinese scholars. In particular, only a few studies have used SEM analysis in CSR, and there are no studies focusing specifically on ESG [92,93].
As a result, we also provided a ‘structural’ analysis with multiple variables or connections in order to fill this methodological gap.
The methodologies employed are consistent; in fact, while MLR (Multiple Linear Regression) extensively fits n simple regressions for each dependent variable identified within the panel of a given set of m independent variables, SEM synthesises a complex construct by means of multiple coincidental algorithms, thus ‘balancing’ all variables involved (dependent and independent), even when potential causal/endogenous connections cannot be excluded.
In other words, PLS is a path analysis technique developed in order to deconstruct correlation in different components to assess the resulting effects. The path analysis is associated with the MLR, the latter representing a proper special case of the former. The path coefficients show the range of causal connection or the association among ‘connected’ variables (actually, they are ‘partial regression coefficients’, where the total equals the total correlation). Moreover, the MLR represents a special case with regard to PCR (Principal Component Regression), which, in turn, effects a data deconstruction simpler than the PLS model (though both aim at the same purpose).
SEM/PLS implies two stages: (1) an iterative process assesses values of latent variables; (2) the subsequent inclusion of these values in multiple OLS regressions (our first methodology) as independent or dependent variables, according to the position in the path diagram.
As stated above, our study uses both absolute and relative sustainability measurements for each company, finally showing an “ESG-surplus advantage ratio” synthesised by means of the quotient between the single firm parameters (E, S, and G—and finally ESG) and the related applicable industry benchmark (industry E, S, and G—then ESG), along the lines of the “competitive advantage“ concept, which, as is well known, refers to the relatively higher performance of firms over their competitors’ results. Since the complementary variable “Controversy” was also taken into accurate consideration, the relative dC score (the ratio between corporate and industry incidental significance) is included in the patterns.
In conclusion, our hypotheses are tested by means of an analytical-atomistic approach (MLR), and then by means of a unitary-synthetic approach (SEM).

4.4. Results

The following tables report the results concerning our ESG sample.
First of all, the basic statistics are shown. The first table, indeed, concerns the descriptive statistics (Table 1).
The ESG scores are shown to be moderate, while the relative ratios (scores over industry) suggest that the companies included in this panel are, on average, better-performing in terms of sustainability activities when compared with their specific sector (a similar result is observed for ‘incidental events’). The variable Analysts’ stock recommendation suggests a neutral hold-based sentiment (more inclined to ‘buy’ than ‘sell’). Financial performance indicators are positive, while the size and leverage indices appear to be higher in the ESG sample (compared with when considering the indices for the whole Stock Market).
Table 2 shows the Pearson correlation coefficients for two-tailed variables.
A preliminary analysis conducted on the whole sample of firms showed a positive correlation between the Dummy ESG (on the one hand), and both the corporate size and the leverage indicators (on the other hand). Size-based indicators show a mutual positive correlation and a negative correlation with operational performance. The Dummy ESG shows a positive correlation with sale profitability and a negative correlation with the Tobin Q (the latter reveals a negative correlation with the corporate size and a positive correlation with the operational performance).
Focusing closer on the sub-sample of companies that were assigned ESG scores, we observe a positive correlation between ESG and firm size; there is no statistical significance with reference to FMP, while a correlation is found with “buy recommendations”. A confirmation of this result is provided by the individual parameters E, G, and S (and by their related spread-ratios—“d”), while there is a negative correlation between dE, dG and the operational performance, suggesting that responsible efforts do not enhance accounting performance, at least in the short term. Controversy level shows a positive correlation with business size and a negative correlation with performance.
We also observe that the indicators S, dE, and dG show a negative correlation with the operating performance. It is interesting to note that operational performance shows a positive correlation with market performance, but a negative correlation with the social parameter “S”.
However, these interactions seem to have only a modest extent.
After the execution and reporting of the basic statistics, an inferential analysis was carried out by using a set of consistent econometric models which associate the financial performances with the non-financial dimensions by means of the MLR (via OLS) and SEM (via PLS) methodologies.
As stated, the MLR (via OLS) was carried out as a preliminary step by using 450 observations (the overall sample was made up of all stock-listed companies, whether or not the ESG performance/disclosure had been assigned).
We opted for a fixed-effects panel data model (although the Pooled OLS gave similar results). This technique is commonly used in this kind of research.
The presence of physiological heteroskedasticity detected by the White’s test suggested to us that heteroskedasticity robust standard errors should be performed in all cases.
Hence, a first extensive regression model was carried out (see Table 3), in which the dependent variable is represented by the fundamental Market/Book Value ratio. The latter indicates the market value of all the firms (whole sample), and it is placed as a linear function of firm size (also controlling for leverage) and of the dummy ESG (namely DESG).
Calculating the total-coefficients of the firm size sub-variables (lnEMPLOYEES, lnSALES, lnINVESTMENTS at once), the overall result shows a significant negative value (−0.6827; p-value 0.0041), proving a negative association between market performance and firm size. Another significant result lies in the negative coefficient of the size-related quadratic effect; this implies that higher size would result in lower decrease in market value. Also, a positive financial leverage effect occurs.
By contrast, the accounting profitability indicators placed as dependent variables of the extensive model showed no statistical significance in relation to the ESG dummy variable. Both the presence or the absence of the score assignment appeared uncorrelated with the accounting results.
Focusing on the influence exerted by the ESG dimension, the analysis was executed on the sub-sample of firms assigned an ESG score in order to test the variables’ relations, also in light of the possible effect of the recent European regulatory reform involving non-financial disclosure (and considering the more recent need for ESG information requirements as well).
Such relations were analysed in terms of several areas of observation by means of an analytic-atomistic approach (Multiple Linear Regression—MLR), and then on a single ‘playing field’ by means of a unitary-synthetic approach (Structural Equation Modeling—SEM).
On the basis of the observations that meet the DESG dummy (only firms with ESG scores), the OLS method tries to associate the market performance with the corporate size (alongside the leverage control), as well as with the ESG indicators (Table 4), giving a particular focus on the relative indicators (with the absolute ones showing collinearity, and therefore being grouped):
The Market Performance shows a positive correlation with the environmental performance, even if it is below the 10% significance level. The impact of the ESG measurement is negative, although not significant.
Computing the total-coefficients of the firm size sub-variables, the overall result shows a significant negative value (−0.8316; p-value 0.0000), thus proving a negative correlation between market performance and firm size. As for the other firms that do not satisfy the dummy variable, a positive leverage effect occurs.
The following table (Table 5) denotes the accounting returns (both unlevered and levered) as response values.
The accounting performance of equity shows a positive correlation with the governance relative evaluation (at the 10% significance threshold), while the ESG value has a minor-significance impact (within the 1–5% level). A clearly positive correlation is found with regard to the relative environmental performance of the firms. The higher the latter evaluation, the higher the accounting performance.
Gathering the coefficient totals of extra-ESG ratios—that is, dE, dS and dG grouped as one—the overall result indicates a significant positive amount (1.7329; p-value 0.0577), representing a meaningful correlation between size and performance. A negative (though very small) leverage impact occurs.
Although the Accounting operating return (including CFOI as well, with consistent results) shows a positive correlation with relative performance pertaining both to the environmental and (partially) the governance evaluation, it denotes a negative correlation with the social element. In general, the ESG impact is irrelevant.
Calculating the total coefficients of the firm-size sub-variables, the overall result demonstrates a significant negative impact on the accounting performance. This time, a negative leverage effect occurs.
Overall, the coefficients of determination, the F-tests and the t-statistics, show acceptable results. Considering their poor significance and specific correlativity, ROS and P/E were ultimately omitted as response variables.
To overcome the fragmentary nature of the above-described regression model with multiple response variables (MLR), an SEM approach was then performed to provide and test a unitary model of convergence.
As is known, by means of several interdependent equations based on linear and/or multiple regression, PLS can assess the network of relations between manifest and latent variables (the so-called “outer model”), as well as between the identified latent variables (the so-called “inner model”).
The primary latent variables of our empirical test are Financial/Market Performance (FMP) and Non-Financial Score-Performance (ESG), which are consistently developed (subject to a Principal Component Analysis; eigenvalue >1). The same approach was adopted to identify the Corporate size (CS) latent variable (the leverage variable has a limited eigenvector; therefore, it was considered as an independent control component). In the first case (FMP), the explicit variables observed were Tobin Q, ROE, ROI, and ROA; in the second case (ESG), they were the E, S, and G evaluation variables; in the third case (CS), they were turnover, investments, and employees, previously equalised on a logarithmic scale.
The following path diagrams synoptically show the PLS structural model, highlighting the assessment parameters: factor loadings (lambdas, outer model) and path loadings (betas, inner model). These values range either from 0 to 1 (lambdas) or from −1 to +1 (betas), with all manifest variables being standardised. There are two models. While model “i” (Figure 1) analyses the impact of overall ESG scores, model “ii” (Figure 2) focuses more effectively on the predictability of the relative ratios (dE, dS and dG), gathered in the resulting latent variable called extra-ESG advantage (symbol: dESG) and assessed for each company included in the structural sample.
For the absolute ESG model test we have:
The relative ESG model test is the following:
The reflexive vectors between the corresponding latent and manifest variables are accounted for as the loading coefficients (outer model). The impact of the corporate size and the ESG on the financial and market performance of firms was assessed by means of regressive vectors (inner model). All values in brackets represent individual significance indicators (p-values, based on t-statistics assessed by means of reiterative bootstrapping calculation as a resampling technique, and carried out via electronic elaboration, including 500,000 repetitions in both cases).
As for the composite latent variables, the overall path reliability (specifically, that referring to ‘model ii’, which appears more adequate than the absolute model) can be expressed by the Composite Reliability (CR: 0.865 for CS; 0.800 for FMP and 0.863 for dESG, with all values being >0.59, which is the threshold in similar research). No different results were observed when considering the Cronbach’s Alpha [94,95]. These results were also confirmed by plausible Average Variance Extracted measures (AVEs, being 0.70—CS, 0.55—FMP, and 0.70—dESG, which were always >0.50, and therefore satisfactory [96]), even considering the Convergent Validity Test (construct communality), as well as the suitable rho-A values (ranging from 0.7 to 0.97). All parameters were above critical values. Furthermore, as reported within the latent performance figures, the R-squared value represents the variance reasonably explained by the structural model (outliers are absent).
VIF statistics are acceptable, showing no collinearity (<5): Lev (1); Market/BV (1,8); ROA (1,6); ROE (1,3); ROI (2); StockM recomm. (1); dC (1); dE (1,7); dG (1,7); dS (1,4); dESGxC.Size (1); ln Inv. Cap. (1,3); ln Turnov. (2,4); ln Empl. (2,2).
As for robustness, similar results were also obtained when CFOI was used to replace ROI (although the p-values slightly decreased). Moreover, the sample of firms was increased to 100 entities by the including Finland market (OMXH index, Euro currency); the main results remained consistent (only some p-values got worse, likely due to the different ESG cluster to which this market belongs), the loss of significance of the negative effect attributable to leverage notwithstanding.
Finally, the structural model was separately performed for quadratic effects (which seemed not to require the implementation of curvilinear correlations); furthermore, the analysis was implemented with a DF dummy for the financial-banking sector, although this bore no particular significant consequence for the results.

5. Discussion of Findings and Conclusions

The Directive n. 2014/95/EU, the subsequent norms, and the guidelines (EUG) have recently promoted a marked improvement in sustainability disclosure, especially for larger companies or groups, making it mandatory to properly report non-financial information [74,97,98]. As is well known, a greater firm size implies an obligation to report non-financial results, which, in turn, implies an incentive (especially to prominent companies) to operate better on a responsible basis [99]. Such aspects are subject to an innovative disclosure and attention that is increasingly addressed to financial investors and other stakeholders as well. Hence, companies are motivated to responsibly invest even more to gain legitimacy and reputation.
At the same time, the UN Agenda 2030 on sustainable development—approved in 2015—represents a formidable opportunity for global companies (see SDG n. 8 and n. 10, suggesting a more balanced economic development characterised by adequate jobs, and lower inequality, as well). In fact, such firms are motivated to propose solutions to meet sustainability challenges, rather than acting as problem makers. In this regard, to understand the general orientation of the business community, the related Accenture-UN Global Compact survey (2016 “Agenda 2030: A Window of Opportunity”) recently involved one thousand CEOs of companies from 100 different countries (from 25 sectors). For our purposes, it is worth highlighting that: (i) one in two CEOs maintains that the business system is the main actor for the implementation of SDGs; (ii) an orientation towards partnerships and collective actions is emerging, in addition to collaboration with the institutions; (iii) the ability to document sustainability results and to inform the financial community is considered a must. Therefore, it is important to develop new standardised measures and indicators to communicate the contribution of companies towards achieving the sustainability objectives [100].
The sustainability disclosure and performance of firms can be boosted by the consideration of ESG (Environmental-Social-Governance) results. In this vein, our study carried out an original investigation into the ‘financial significance’ of the ESG dimension—in terms of value/performance relevance—for primary companies listed on major European indices, also controlling for the specific role of their firm size. More precisely, we examined the financial materiality of the ESG (environmental, social and governance) information that concerns primary companies listed in Belgium, France, Germany, Italy and Spain (on BEL, CAC, DAX, FTSE-MIB, IBEX indices), searching for the impact of non-financial performance (assessed through sustainability indicators namely ESG) on economic performance (financial and market), as reported in the timespan 2014–2017.
After the statement of the assumptions of the research (HPa, HPb e HPc) and the initial univariate and bivariate analysis, we firstly used—to test the investigated effects—the classic multivariate MLR (a), then the more innovative and holistic SEM methodology (b), by gathering reliable ESG metrics (provided by Sustainalytics—Morningstar—Bloomberg).
(a) MLR: the traditional regression model, launched for multiple market/accounting performance variables in order to ascertain the predictive effect of the ESG, showed it to be a contributing factor with reference to both the R-squared and the overall F-test significance index. However, there is evidence of incidence that only partially and not always uniquely met the research questions. Above all, we did not detect any significant association between the absolute EGS scores and the economic-financial performances of firms (absent correlation).
(b) SEM: designed to render a comprehensive and up-to-date framework of real relationships, the structural model confirms such non-predictability when the absolute scores are considered (at least in the context examined); on the other hand, it shows interesting results (positive impact) when the analysis is applied to the effect of the ESG relative measures (extra or excess E, S and G scores over industry) on business performance, also in light of the firm size indicators.
In short, since MLR is a poorer and ‘pooled’ system, we outlined a more realistic set of causal links between the variables formalised ‘as a whole’, i.e., within a system of algebraic equations able to provide a representation of the ‘real processes’.
Our findings are substantially congruent with the results obtained by the still-limited cases of SEM application to CSR/performance, albeit with a different focus (in our case, in fact, the focus is aimed specifically at ESG, rather than at corporare social responsibility/performance). For instance, [93] recently analysed the relationship between CSR and organizational performance through the impact of innovation in 133 companies based on the Theory of Resources and Capabilities; the results depict a significant and positive correlation. Furthermore, through SEM, Ağan et al. [92] examined the relationship between CSR, firm performance and environmental supplier development, showing that the former (to which the major companies, except heavy industry, would seem slightly more sensitive) is positively connected as antecedent to the environmental supplier development, which, in turn, has a positive influence on competitive advantage and financial performance. Instead, Kang et al. [101] investigated the relationship between CSR and business performance through an ad hoc sustainability balanced scorecard tested on 200 companies (hospitality sector), showing a positive relationship between corporate responsibility and economic performance.
More specifically, an original aspect of our analysis compared to previous CSR-CSP studies consists of the use of the PLS/SEM methodology together with the unprecedented consideration of “ESG” measures, both absolute and relative (although the latter were shown to be more interesting, with the relative ‘extra-ESG advantage’ expressing a sort of economic advantage gained from sustainability or, better, a ‘goodwill’ derived from environmental, social and governance extra-performance). Even the G inclusion (governance dimension, in addition to the previous limited focus on the E & S hendiadys performance) appears important, since the recent spread of the ESG triad has raised the attention and interest of investors/stakeholders (as it is known that when the governance valuation (G) is not considered, it indirectly tends to fall into the error estimation of the predictive models, producing bias [92]). Moreover, it is known that the characteristics of G (governance dimension) constitute the administrative micro-environment in which E (environmental) and S (social) policies are formed and proliferate, ultimately being implemented by directors and managers. Nonetheless, our analyses did not omit a separate control for the three dimensions E-S-G (in order to avoid any confounding-effect between them).
The specific PLS approach (Partial Least Squares, also known as Projection to Latent Structures by virtue of its ‘general strategy’ scope) has allowed the interpretative study of the ESG valuation (Non-Financial ratings) impact on the compound latent FMP variable (market/financial performance of firms). The fitting of the model is adequate; in fact, the R-squared (equal to 0.44 for the relative construct), the adjusted R-squared (=0.41) and the SRMR (Standardised Root Mean Square Residual = 9%–10%) are acceptable at the exploratory level (Goodness of Fit), given the sample size (a good cutoff is indicated in the conventional measurement of 8% [102]; in general, the practice considers a value within 10%, falling within 90% of the confidence interval, to be adequate).
Indeed, the outlined path diagrams reported above clearly indicate the greater usefulness of the relative model (‘ii’) compared to the absolute model (‘i’). The latter merely reveals the negative impact of both corporate size and financial leverage on company FMP, and the substantial irrelevance of the total/absolute ESG (which is in line with several other studies; see Section 2 and Section 3). On the other hand, the former (relative performances model) has significantly shown:
A negative path coefficient (equal to −0.401) from “Corporate Size” to “Financial/Market Performance” (and similarly between financial leverage and performance);
A positive path coefficient (equal to +0.161) from “extra-ESG” to “Financial/Market Performance” (in contrast to the cost-concerned school which hypothesises that investing in ESG activities, in entailing time- and resource-consuming efforts, increases occur at the cost of putting businesses in a situation of economic disadvantage).
At the same time, the “extra-ESG advantage” (compared to sector’s score) is associated: (i) negatively (coefficient: −0.272) with the Controversies indicator (where lower C signals minor controversies, thus influencing higher ESG ratings as expected); (ii) positively with the firm size indicator (coefficient: +0.430, according to the slack resources theory); (iii) positively with analysts’ recommendation to ‘buy’.
In the investigated context, we learn that while the entity size negatively impacts financial and market performances (direct effect), in one sense rewarding company downsizings, given the persistent turbulence of markets, it also exerts an opposite (positive, though indirect) effect on corporate results through the ESG variable (through a resulting coefficient equal to 0.430 × 0.161 = +0.069), which only partially tempers such tendencies. In fact, the negative effect of the larger sizes of firms on economic performance prevails (net effect = −0.401 + 0.069 = −0.332). Therefore, the extra-ESG advantage ends in determining a mild ‘suppression’ applicable in the aforementioned relations framework (in our case, eliminating from the model the dEGS variable and/or its connections with the CS, the negative effect of the latter on the FMP would be a little more negative). Finally, the additional control for a hypothetical interaction-moderation effect with regard to the impact coefficient of ESG on performance by means of Corporate Size (assuming its direct relation to ESG to be null or non-significant) reveals, in line with [103]’s evidence, that the firm size is rather a significant background factor that grants visibility, and it is capable of influencing the corporate results.
These findings, which are valid for the analysed European sample, show that the ESG dimension is moderately yet significantly impactful not so much because of the absolute height of their individual scores (attributed to companies on the basis of their political and operational responsibility/sustainability profile), but because of their respective “positioning”, i.e., in consideration of their “spread” over or “distance” from the industry sector average-normal score (revealing a sort of “ESG moment” or ESG variances, intended as ‘excess or abnormal ESG results’, as deviating from the sector mean score or benchmark determined in the whole stock exchange: in short, a relative ESG performance). In this regard, it is relevant that our empirical path coefficient (from extra-ESG to FMP, equal to 0.161) is remarkably similar to Orlitzky et al. [82]’s corrected average correlation coefficient between corporate social performance and financial performance (equal to 0.150), as well as to Margolis [54]’s reported coefficient (approximately 0.13) and also, most recently, to Friede et al. [56]’s weighted correlation (of almost 0.120). This coefficient alignment seems to confirm the validity and reasonableness of our results and predictability, conforming to other similar studies.
Essentially, our results conform to the Stakeholder (and Shared Value) Theory, collaterally supporting the “competitive advantage” notion through which we termed “extra-ESG advantage” (our latent structural variable deriving from the factorial re-composition of several sub-scores). As a consequence, in the European context here scrutinised, a performing ESG engagement (considered comparatively in line with the competitors’ commitment) confirms the research question, showing it to be a (market & accounting) value relevant condition associated with the production of greater economic-financial returns. On the one hand, such an effect can be achieved on the basis of the recognition, judgement, appreciation and support of the market and financial investors, and, on the other hand, the greater investments and costs necessary to ensure the intensity, proficiency and efficacy of the company’s responsibility policy and behaviour can be recovered by incremental incomes from revenues and sales.
In detail, we learned that a general or generic commitment in ESG is not enough. Instead, an improvement effect on corporate profitability can spring from a comparative extra-ESG performance with respect to the industry sector.
In this regard, it is hardly necessary to recall that the competitive advantage is meant by the doctrine to be a condition for building and sustaining superior performance compared to the average results of direct competitors operating in the market or industry sector [104]; similarly, Grant [105] refers to the ability to stably perform at a higher level than others achieving the primary goal—that is, profitability. Since such a classical concept (competitive advantage) is based on the existence of differentials of economic performance, as a consequence, our ESG differential ratios corroborate the competitive advantage notion within a wider condition of sustainability advantage. Moreover, as the economic profit comes from earnings in excess of the normal returns within the industry, so the relative ESG performance will express an extra-ESG score over the benchmark (identifying a sort of “advantage extracted from sustainability”). Then, the extra-ESG possesses the important characteristic of a possible “economic performance relevance” compatible with the Porter’s new ‘Shared Value’ view [12,106,107].
In line with several previous findings [27,108,109], we also conclude that the market value and operating return (ROA and ROI) are more affected by ESG valuation than stock prices (nonetheless, we underline how [110] found that firms newly included in Business Ethics America’s Best 100 Corporate Citizens provided significantly positive abnormal returns to financial investors).
In conclusion, our study confirms that paying attention to the social and the defense of the environment, coupled with both a sound corporate governance structure and functioning, may represent—together with the apparent incidence of corporate size [50] and the underlying (slack) resources availability to be managed in responsible manner for the greater control of stakeholders—a concrete condition able to facilitate “value creation “in a comprehensive sense. That is, while internal or external growths of firms may not increase the overall performance in the short term, the (market and financial) performances of companies are shown to be improvable through a positive correction ascribable to ESG commitment. The same effect, although weaker (due to fewer slack resources available), can be expected in smaller companies that decide to grow. More generally, the positive effects would be likely to be even higher by encapsulating the ESG in IR (Integrated Reporting; [75,111]).
This paper contributes a new ‘piece of the puzzle’ to a field in fieri, where the literature findings still appear fragmentary and sometimes ambiguous; in this context, nonetheless, practitioners and entrepreneurs feel that ignoring ESG factors and performance entails neglecting a range of opportunities and risks for the company and stakeholders that the ESG itself is instead able to adequately intercept.
Ultimately, the ESG dimension (influencing how and how much organizations create value) aspires to become more and more—along a path from niche to norm—an indispensable asset of the modern enterprise, provided that it is managed in an innovative and responsible way. Once defined a materiality map [112,113,114,115,116], the modern firm can also pursue the objective of raising its efficient frontier of financial/non-financial performances, triggering a positive and growing spiral between them.
Additionally, compared to previous studies, the present research advances a robust “structural” methodology never implemented in the specific field (PLS), which is able to simultaneously portray a unitary picture of standardised variables and annexed relationships. It represents updated and different evidence of the binomial “sustainability” and “business performance”. Indeed, the application of the “Structural Equations Model” to ESG metrics, together with the identification of the (new) extra-ESG advantage variable, expresses the novelty of the research, collaterally supporting and revisiting the typical notion of competitive advantage in the sustainability key. To recap, despite the absolute level of the individual ESG scores of the European companies analysed not being impactful, the “distance” from the industry average-normal figures (excess or abnormal ESG performance) is positively relevant to the economic performance of firms, while the corporate size is shown to always be a significant background factor. Finally, the extra-ESG reflects a better attitude to competitiveness with respect to the industry or to competitors, due to increased efficiency along with higher corporate reputation, consumer confidence, and stability of relationships. It may also reflect greater confidence in human capital, boosting labor productivity. As a consequence, this will attract the sector’s stakeholders, resulting in their having a greater propensity to purchase goods or services and to make financial investments, supporting the growth of the economic performance.
In other words, the social, environmental and governance responsibilities (to all stakeholders) act as a set of dynamic capabilities that consitute a new competitive factor of the modern corporation. The fact that companies are stipulating such growing responsibilities next to the core business responsibilities means that they also act in the interest of the stakeholders who are mainly involved and conditioned by the corporate choices (employees, customers, communities, suppliers, and financiers, remained equally important). As a result, ensuring good economic performance and serving society can involve moving in the same direction when a firm incorporates the societal or welfare interests into its business purpose, strategy and operations (within the ethical domain).
That said, there remain inherent limitations regarding the preliminary heterogeneous construction of the reported scores or ratings (whose methodology, scope and coverage may vary considerably), the risk of self-referencing (also due to the non-objectivity and greater alterability, accidental or voluntary, of qualitative results and consequent ESG information/communications, compared to the traditional economic-accounting ones), as well as the limited extensibility of the findings (outside of the specific context scrutinised). Future research should validate and enlarge the findings; it is invited to broaden the analysis with respect to different markets, periods and alternative ESG measures, and also in light of different theories (as the institutional/legitimacy theory [117]), verifying the incidence of investments for innovation [77] to “raise the bar” of the Performance Frontier (Financial vs ESG).

Author Contributions

Conceptualization and methodology, M.T.; validation and formal analysis, M.T. and C.F.; investigation, M.T.; resources and data curation, A.N. and C.F.; writing—original draft preparation, M.T.; writing—review and editing, A.N. and C.F.; visualization, C.F. and A.N.; supervision and project administration, M.T.

Funding

The authors received no specific funding for this work.

Conflicts of Interest

The authors declare no conflict of interest.

References

  1. Deegan, C. Introduction: The legitimising effect of social and environmental disclosures—A theoretical foundation. Account. Audit. Account. J. 2002, 15, 282–311. [Google Scholar] [CrossRef]
  2. Bassen, A.; Kovács, A.M. Environmental, Social and Governance Key Performance-Indicators from a Capital Market Perspective. Z. für Wirtsch.-und Unternehm.—J. Bus. Econ. Ethics 2008, 9, 182–192. [Google Scholar]
  3. Zanda, G. Fondamenti di Economia Aziendale; Giappichelli: Turin, Italy, 2015. [Google Scholar]
  4. Hummel, K.; Schlick, C. The relationship between sustainability performance and sustainability disclosure—Reconciling voluntary disclosure theory and legitimacy theory. J. Account. Public Policy 2016, 35, 455–476. [Google Scholar] [CrossRef]
  5. Clarkson, M.E. A stakeholder framework for analyzing and evaluating corporate social performance. Acad. Manag. Rev. 1995, 20, 92–117. [Google Scholar] [CrossRef]
  6. Griffin, J.J. Corporate social performance: Research directions for the 21st century. Bus. Soc. 2000, 39, 479–491. [Google Scholar] [CrossRef]
  7. Muller, A.; Kolk, A. Extrinsic and intrinsic drivers of corporate social performance: Evidence from foreign and domestic firms in Mexico. J. Manag. Stud. 2010, 47, 1–26. [Google Scholar] [CrossRef]
  8. Cooper, S. Corporate Social Performance: A Stakeholder Approach; Routledge: London, UK, 2017. [Google Scholar]
  9. Jones, T.M. Instrumental stakeholder theory: A synthesis of ethics and economics. Acad. Manag. Rev. 1995, 20, 404–437. [Google Scholar] [CrossRef]
  10. Mitchell, R.K.; Agle, B.R.; Wood, D.J. Toward a theory of stakeholder identification and salience: Defining the principle of who and what really counts. Acad. Manag. Rev. 1997, 22, 853–886. [Google Scholar] [CrossRef]
  11. Freeman, R.E. Strategic Management: A Stakeholder Approach; Cambridge University Press: Cambridge, UK, 2002. [Google Scholar]
  12. Porter, M.E.; Kramer, M.R. The Big Idea: Creating Shared Value. How to reinvent capitalism—And unleash a wave of innovation and growth. Harv. Bus. Rev. 2011, 89, 2–17. [Google Scholar]
  13. Godfrey, P.C.; Merrill, C.B.; Hansen, J.M. The relationship between corporate social responsibility and shareholder value: An empirical test of the risk management hypothesis. Strateg. Manag. J. 2009, 30, 425–445. [Google Scholar] [CrossRef]
  14. Jensen, J.C.; Berg, N. Determinants of traditional sustainability reporting versus integrated reporting. An institutionalist approach. Bus. Strategy Environ. 2012, 21, 299–316. [Google Scholar] [CrossRef]
  15. Adams, C.A. The international integrated reporting council: A call to action. Crit. Perspect. Account. 2015, 27, 23–28. [Google Scholar] [CrossRef]
  16. Sierra-García, L.; Zorio-Grima, A.; García-Benau, M.A. Stakeholder engagement, corporate social responsibility and integrated reporting: An exploratory study. Corp. Soc. Responsib. Environ. Manag. 2015, 22, 286–304. [Google Scholar] [CrossRef]
  17. Simnett, R.; Huggins, A.L. Integrated reporting and assurance: Where can research add value? Sustain. Account. Manag. Policy J. 2015, 6, 29–53. [Google Scholar] [CrossRef]
  18. Maas, K.; Schalteggerand, S.; Crutzen, N. Integrating corporate sustainability assessment, management accounting, control, and reporting. J. Clean. Prod. 2016, 136, 237–248. [Google Scholar] [CrossRef] [Green Version]
  19. Elkington, J. Partnerships from cannibals with forks: The triple bottom line of 21st-century business. Environ. Qual. Manag. 1998, 8, 37–51. [Google Scholar] [CrossRef]
  20. Barman, E. Doing Well by Doing Good: A Comparative Analysis of ESG Standards for Responsible Investment. In Sustainability, Stakeholder Governance, and Corporate Social Responsibility; Emerald: Bingley, UK, 2018; Volume 38, pp. 289–311. [Google Scholar]
  21. Freeman, R.E. Strategic Management: A Stakeholder Perspective; Pitman: Boston, MA, USA, 1984. [Google Scholar]
  22. Freeman, R.E.; Harrison, J.S.; Wicks, A.C.; Parmar, B.; de Colle, S. Stakeholder Theory: The State of the Art; Cambridge University Press: Cambridge, UK, 2010. [Google Scholar]
  23. Freeman, R.E.; Dmytriyev, S. Corporate Social Responsibility and Stakeholder Theory: Learning from Each Other. Symphonya. Emerg. Issues Manag. 2017, 2, 7–15. [Google Scholar]
  24. Bourghelle, D.; Hager, J.; Louche, C. The Integration of ESG Information into Investment Processes: Toward an Emerging Collective Belief? Working Paper; Vlerick Leuven Gent Management School: Ghent, Belgium, 2009. [Google Scholar]
  25. Van Duuren, E.; Plantinga, A.; Scholtens, B. ESG integration and the investment management process: Fundamental investing reinvented. J. Bus. Ethics 2016, 138, 525–533. [Google Scholar] [CrossRef]
  26. Tamimi, N.; Sebastianelli, R. Transparency among S&P 500 companies: An analysis of ESG disclosure scores. Manag. Decis. 2017, 55, 1660–1680. [Google Scholar]
  27. Waddock, S.A.; Graves, S.B. The corporate social performance-financial performance link. Strateg. Manag. J. 1997, 18, 303–319. [Google Scholar] [CrossRef]
  28. Van Beurden, P.; Gössling, T. The worth of values—A literature review on the relation between corporate social and financial performance. J. Bus. Ethics 2008, 82, 407. [Google Scholar] [CrossRef]
  29. Kim, M.; Kim, Y. Corporate social responsibility and shareholder value of restaurant firms. Int. J. Hosp. Manag. 2014, 40, 120–129. [Google Scholar] [CrossRef]
  30. Barney, J. Firm resources and sustained competitive advantage. J. Manag. 1991, 17, 99–120. [Google Scholar] [CrossRef]
  31. Porter, M.E. Towards a dynamic theory of strategy. Strateg. Manag. J. 1991, 12, 95–117. [Google Scholar] [CrossRef] [Green Version]
  32. Hart, S.L. A natural-resource-based view of the firm. Acad. Manag. Rev. 1995, 20, 986–1014. [Google Scholar] [CrossRef]
  33. Hammond, S.A.; Slocum, J.W. The impact of prior firm financial performance on subsequent corporate reputation. J. Bus. Ethics 1996, 15, 159–165. [Google Scholar] [CrossRef] [Green Version]
  34. Neville, B.A.; Bell, S.J.; Mengüç, B. Corporate reputation, stakeholders and the social performance-financial performance relationship. Eur. J. Mark. 2005, 39, 1184–1198. [Google Scholar] [CrossRef]
  35. Porter, M.E.; Kramer, M.R. The link between competitive advantage and corporate social responsibility. Harv. Bus. Rev. 2006, 84, 78–92. [Google Scholar]
  36. Bird, R.; Hall, A.D.; Momentè, F.; Reggiani, F. What corporate social responsibility activities are valued by the market? J. Bus. Ethics 2007, 76, 189–206. [Google Scholar] [CrossRef]
  37. Weber, M. The business case for corporate social responsibility: A company-level measurement approach for CSR. Eur. Manag. J. 2008, 26, 247–261. [Google Scholar] [CrossRef]
  38. Flammer, C. Does corporate social responsibility lead to superior financial performance? A regression discontinuity approach. Manag. Sci. 2015, 61, 2549–2568. [Google Scholar] [CrossRef]
  39. Frooman, J. Socially irresponsible and illegal behavior and shareholder wealth: A meta-analysis of event studies. Bus. Soc. 1997, 36, 221–249. [Google Scholar] [CrossRef]
  40. Damodaran, A. Damodaran on Valuation: Security Analysis for Investment and Corporate Finance; John Wiley & Sons: Hoboken, NJ, USA, 2016; Volume 324. [Google Scholar]
  41. Friedman, M. Capitalism and Freedom: With the Assistance of Rose D. Friedman; University of Chicago Press: Chicago, IL, USA, 1962. [Google Scholar]
  42. Friedman, M. The social responsibility of the corporation is to increase its profits. N. Y. Times Mag. 1970, 13, 122–126. [Google Scholar]
  43. Moser, D.V.; Martin, P.R. A broader perspective on corporate social responsibility research in accounting. Account. Rev. 2012, 87, 797–806. [Google Scholar] [CrossRef]
  44. Mackey, A.; Mackey, T.B.; Barney, J.B. Corporate social responsibility and firm performance: Investor preferences and corporate strategies. Acad. Manag. Rev. 2007, 32, 817–835. [Google Scholar] [CrossRef]
  45. Moon, J. The Social Responsibility of Business and New Governance. Gov. Oppos. 2002, 37, 385–408. [Google Scholar] [CrossRef]
  46. Caulkin, S. Good thinking, bad practice. The Observer, 7 April 2002. [Google Scholar]
  47. McGuire, J.B.; Sundgren, A.; Schneeweis, T. Corporate social responsibility and firm financial performance. Acad. Manag. J. 1988, 31, 854–872. [Google Scholar]
  48. Barnett, M.L.; Salomon, R.M. Beyond dichotomy: The curvilinear relationship between social responsibility and financial performance. Strateg. Manag. J. 2006, 27, 1101–1122. [Google Scholar] [CrossRef]
  49. Wang, H.; Choi, J.; Li, J. Too little or too much? Untangling the relationship between corporate philanthropy and firm financial performance. Organ. Sci. 2008, 19, 143–159. [Google Scholar] [CrossRef]
  50. Wu, M.L. Corporate social performance, corporate financial performance, and firm size: A meta-analysis. J. Am. Acad. Bus. 2006, 8, 163–171. [Google Scholar]
  51. Mishra, S.; Suar, D. Does corporate social responsibility influence firm performance of Indian companies? J. Bus. Ethics 2010, 95, 571–601. [Google Scholar] [CrossRef]
  52. Orlitzky, M. Does firm size confound the relationship between corporate social performance and firm financial performance? J. Bus. Ethics 2001, 33, 167–180. [Google Scholar] [CrossRef]
  53. Allouche, J.; Laroche, P. A meta-analytical investigation of the relationship between corporate social and financial performance. Revue de Gestion des Ressources Humaines 2005, 57, 18–41. [Google Scholar]
  54. Margolis, J.D.; Elfenbein, H.A.; Walsh, J.P. Does it pay to be good... and does it matter? A meta-analysis of the relationship between corporate social and financial performance. SSRN Electron. J. 2009. [Google Scholar] [CrossRef]
  55. Peiró-Signes, A.; Segarra-Oña, M.; Mondéjar-Jiménez, J.; Vargas-Vargas, M. Influence of the environmental, social and corporate governance ratings on the economic performance of companies: An overview. Int. J. Environ. Res. 2013, 7, 105–112. [Google Scholar]
  56. Friede, G.; Busch, T.; Bassen, A. ESG and financial performance: Aggregated evidence from more than 2000 empirical studies. J. Sustain. Finance Invest. 2015, 5, 210–233. [Google Scholar] [CrossRef]
  57. Shaukat, A.; Qiu, Y.; Trojanowski, G. Board attributes, corporate social responsibility strategy, and corporate environmental and social performance. J. Bus. Ethics 2016, 135, 569–585. [Google Scholar] [CrossRef]
  58. Velte, P. Does ESG performance have an impact on financial performance? Evidence from Germany. J. Glob. Responsib. 2017, 8, 169–178. [Google Scholar] [CrossRef]
  59. Garcia, A.S.; Mendes-Da-Silva, W.; Orsato, R.J. Corporate Sustainability, Capital Markets, and ESG Performance. In Individual Behaviors and Technologies for Financial Innovations; Springer International Publishing AG: Cham, Switzerland, 2006; pp. 287–309. [Google Scholar]
  60. Hoepner, A.G.F.; McMillan, D.G. Research on ‘Responsible Investment’: An Influential Literature Analysis Comprising a Rating, Characterisation, Categorisation and Investigation; University of St. Andrews: St. Andrews, UK, 2009. [Google Scholar]
  61. Galbreath, J. ESG in focus: The Australian evidence. J. Bus. Ethics 2013, 118, 529–541. [Google Scholar] [CrossRef]
  62. Lokuwaduge, C.S.D.S.; Heenetigala, K. Integrating environmental, social and governance (ESG) disclosure for a sustainable development: An Australian study. Bus. Strategy Environ. 2017, 26, 438–450. [Google Scholar] [CrossRef]
  63. Landi, G.; Sciarelli, M. Towards a more ethical market: The impact of ESG rating on corporate financial performance. Soc. Responsib. J. 2018. [Google Scholar] [CrossRef]
  64. Brooks, C.; Oikonomou, I. The effects of environmental, social and governance disclosures and performance on firm value: A review of the literature in accounting and finance. Br. Account. Rev. 2018, 50, 1–15. [Google Scholar] [CrossRef]
  65. Murphy, D.; McGrath, D. ESG reporting–class actions, deterrence, and avoidance. Sustain. Account. Manag. Policy J. 2013, 4, 216–235. [Google Scholar] [CrossRef]
  66. Ling, A.; Forrest, S.; Lynch, M.; Fox, M. Global Food & Beverages: Integrating ESG; Goldman Sachs: New York, NY, USA, 2007. [Google Scholar]
  67. Melnyk, S.A.; Sroufe, R.P.; Calantone, R. Assessing the impact of environmental management systems on corporate and environmental performance. J. Oper. Manag. 2003, 21, 329–351. [Google Scholar] [CrossRef]
  68. Du Rietz, S. Information vs knowledge: Corporate accountability in environmental, social, and governance issues. Account. Audit. Account. J. 2018, 31, 586–607. [Google Scholar] [CrossRef]
  69. Li, Y.; Gong, M.; Zhang, X.Y.; Koh, L. The impact of environmental, social, and governance disclosure on firm value: The role of CEO power. Br. Account. Rev. 2018, 50, 60–75. [Google Scholar] [CrossRef]
  70. Bouslah, K.; Linares-Zegarra, J.; M’Zali, B.; Scholtens, B. CEO risk-taking incentives and socially irresponsible activities. Br. Account. Rev. 2018, 50, 76–92. [Google Scholar] [CrossRef]
  71. Velte, P. Women on management board and ESG performance. J. Glob. Responsib. 2016, 7, 98–109. [Google Scholar] [CrossRef]
  72. Manita, R.; Bruna, M.G.; Dang, R.; Houanti, L.H. Board gender diversity and ESG disclosure: Evidence from the USA. J. Appl. Account. Res. 2018, 19, 206–224. [Google Scholar] [CrossRef]
  73. Manes-Rossi, F.; Tiron-Tudor, A.; Nicolò, G.; Zanellato, G. Ensuring More Sustainable Reporting in Europe Using Non-Financial Disclosure—De Facto and De Jure Evidence. Sustainability 2018, 10, 1162. [Google Scholar] [CrossRef]
  74. Global Reporting Initiative (GRI) Global Sustainability Standards Board (GSSB) “Linking the GRI Standards and the European Directive on Non-Financial and Diversity Disclosure”. 2017. Available online: http://asvis.it/public/asvis/files/linkingGRI.pdf (accessed on 27 February 2019).
  75. Mervelskemper, L.; Streit, D. Enhancing Market Valuation of ESG Performance: Is Integrated Reporting Keeping its Promise? Bus. Strategy Environ. 2017, 26, 536–549. [Google Scholar] [CrossRef]
  76. Ohlson, J.A. Earnings, book values, and dividends in equity valuation. Contemp. Account. Res. 1995, 11, 661–687. [Google Scholar] [CrossRef]
  77. Eccles, R.G.; Serafeim, G.; Seth, D.; Ming, C.C.Y. The Performance Frontier: Innovating for a Sustainable Strategy: Interaction. Harv. Bus. Rev. 2013, 91, 17–18. [Google Scholar]
  78. Endrikat, J.; Guenther, E.; Hoppe, H. Making sense of conflicting empirical findings: A meta-analytic review of the relationship between corporate environmental and financial performance. Eur. Manag. J. 2014, 32, 735–751. [Google Scholar] [CrossRef]
  79. Pfeffer, J.; Salancik, G.R. The External Control of Organisations: A Resource Dependence Perspective; Harper & Row: New York, NY, USA, 1978. [Google Scholar]
  80. Chang, Y.K.; Oh, W.Y.; Jung, J.C.; Lee, J.Y. Firm size and corporate social performance: The mediating role of outside director representation. J. Leadersh. Organ. Stud. 2012, 19, 486–500. [Google Scholar] [CrossRef]
  81. Gooding, R.Z.; Wagner, J.A., III. A meta-analytic review of the relationship between size and performance: The productivity and efficiency of organizations and their subunits. Adm. Sci. Q. 1985, 30, 462–481. [Google Scholar] [CrossRef]
  82. Orlitzky, M.; Schmidt, F.L.; Rynes, S.L. Corporate social and financial performance: A meta-analysis. Organ. Stud. 2001, 24, 403–441. [Google Scholar] [CrossRef]
  83. Wisebrod, J.M. Social impact ratings: How to make responsible investment appealing. Finance Bien Commun. 2007, 27, 29–40. [Google Scholar] [CrossRef]
  84. Cohen, J.R.; Holder-Webb, L.; Zamora, V.L. Nonfinancial information preferences of professional investors. Behav. Res. Account. 2015, 27, 127–153. [Google Scholar] [CrossRef]
  85. Lefkovitz, D. Sustainability Atlas; Morningstar: Chicago, IL, USA, 2017. [Google Scholar]
  86. Onesti, T. ‘Fattori Ambientali’ e Comportamenti Contabili. Analisi Comparata dei Sistemi Contabili di Alcuni Paesi Industrializzati; Giappichelli: Turin, Italy, 1995. [Google Scholar]
  87. Aouadi, A.; Marsat, S. Do ESG controversies matter for firm value? Evidence from international data. J. Bus. Ethics 2016, 1, 1–21. [Google Scholar] [CrossRef]
  88. Ioannou, I.; Serafeim, G. The Consequences of Mandatory Corporate Sustainability Reporting. SSRN Electron. J. 2017. [Google Scholar] [CrossRef]
  89. Henseler, J.; Hubona, G.; Ray, P.A. Using PLS path modeling in new technology research: Updated guidelines. Ind. Manag. Data Syst. 2016, 116, 2–20. [Google Scholar] [CrossRef]
  90. Gelhard, C.; von Delft, S. The role of organizational capabilities in achieving superior sustainability performance. J. Bus. Res. 2016, 69, 4632–4642. [Google Scholar] [CrossRef]
  91. Mardani, A.; Streimikiene, D.; Zavadskas, E.K.; Cavalaro, F.; Nilashi, M.; Jusoh, A.; Zare, H. Application of Structural Equation Modeling (SEM) to Solve Environmental Sustainability Problems: A Comprehensive Review and Meta-Analysis. Sustainability 2017, 9, 1814. [Google Scholar] [CrossRef]
  92. Ağan, Y.; Kuzey, C.; Acar, M.F.; Açıkgöz, A. The relationships between corporate social responsibility, environmental supplier development, and firm performance. J. Clean. Prod. 2016, 112, 1872–1881. [Google Scholar] [CrossRef]
  93. Reverte, C.; Gómez-Melero, E.; Cegarra-Navarro, J.G. The influence of corporate social responsibility practices on organizational performance: Evidence from Eco-Responsible Spanish firms. J. Clean. Prod. 2016, 112, 2870–2884. [Google Scholar] [CrossRef]
  94. Bagozzi, R.P.; Yi, Y.; Nassen, K.D. Representation of measurement error in marketing variables: Review of approaches and extension to three-facet designs. J. Econ. 1998, 89, 393–421. [Google Scholar] [CrossRef]
  95. Tseng, M.L.; Wu, W.W.; Lin, Y.H.; Liao, C.H. An exploration of relationships between environmental practice and manufacturing performance using the PLS path modeling. WSEAS Trans. Environ. Dev. 2008, 4, 487–502. [Google Scholar]
  96. Götz, O.; Liehr-Gobbers, K.; Krafft, M. Evaluation of structural equation models using the partial least squares (PLS) approach. In Handbook of Partial Least Squares; Springer: Berlin/Heidelberg, Germany, 2010; pp. 691–711. [Google Scholar]
  97. Johansen, T.R. EU Regulation of Corporate Social and Environmental Reporting. Soc. Environ. Account. J. 2016, 36, 1–9. [Google Scholar] [CrossRef]
  98. Venturelli, A.; Caputo, F.; Leopizzi, R.; Pizzi, S. The state of art of Corporate Social Disclosure before the introduction of Non-financial reporting Directive: A cross country analysis. Soc. Responsib. J. 2018. [Google Scholar] [CrossRef]
  99. Muserra, A.L.; Papa, M.; Grimaldi, F. Exploring the legitimacy of EU directive on non-financial and diversity information: Evidence from italian preparers and auditors. In Proceedings of the Annual Congress, European Accounting Association, Milan, Italy, 30 May–1 June 2018. [Google Scholar]
  100. Frey, M. Agenda 2030 e ruolo delle imprese. Impresa Progetto 2018, 2, 1–9. [Google Scholar]
  101. Kang, J.S.; Chiang, C.F.; Huangthanapan, K.; Downing, S. Corporate social responsibility and sustainability balanced scorecard: The case study of family-owned hotels. Int. J. Hosp. Manag. 2015, 48, 124–134. [Google Scholar] [CrossRef]
  102. Gompers, P.; Ishii, J.; Metrick, A. Corporate governance and equity prices. Q. J. Econ. 2003, 118, 107–156. [Google Scholar] [CrossRef]
  103. Chen, K.H.; Metcalf, R.W. The relationship between pollution control record and financial indicators revisited. Account. Rev. 1980, 55, 168–177. [Google Scholar]
  104. Porter, M.E. Competitive advantage: Creating and Sustaining Superior Performance; The Free Press: New York, NY, USA, 1985. [Google Scholar]
  105. Grant, R.M. L’analisi Strategica per le Decisioni Aziendali; Il Mulino: Bologna, Italy, 2011. [Google Scholar]
  106. Sciarelli, S. La produzione del valore allargato quale obiettivo dell’etica nell’impresa. Finanza Marketing e Produzione 2002, 20, 5–17. [Google Scholar]
  107. Busco, C.; Izzo, M.F.; Granà, F. L’evoluzione del sistema di Corporate Rating. Lo Shared Value all’interno del Bilancio Integrato di un gruppo bancario. Rivista Italiana di Ragioneria e di Economia Aziendale 2018, 1–4, 16–36. [Google Scholar]
  108. Kassinis, G.I.; Soteriou, A.C. Greening the service profit chain: The impact of environmental management practices. Prod. Oper. Manag. 2003, 12, 386–403. [Google Scholar] [CrossRef]
  109. Chopra, S.; Wu, P.J. Eco-activities and operating performance in the computer and electronics industry. Eur. J. Oper. Res. 2016, 248, 971–981. [Google Scholar] [CrossRef]
  110. Brammer, S.; Brooks, C.; Pavelin, S. The stock performance of America’s 100 best corporate citizens. Q. Rev. Econ. Finance 2009, 49, 1065–1080. [Google Scholar] [CrossRef]
  111. Hoang, T. The Role of the Integrated Reporting in Raising Awareness of Environmental, Social and Corporate Governance (ESG) Performance. In Stakeholders, Governance and Responsibility; Emerald: Bingley, UK, 2018; pp. 47–69. [Google Scholar]
  112. International Federation of Accountants (IFAC); International Integrated Reporting Council (IIRC). Materiality in IR. Guidance for the Preparation of Integrated Reports, November, 2015. Available online: https://integratedreporting.org/wp-content/uploads/2015/11/1315_MaterialityinIR_Doc_4a_Interactive.pdf (accessed on 27 February 2019).
  113. London Stock Exchange Group. Revealing the Full Picture. Your Guide to ESG Reporting—Guidance for Issuers on the Integration of ESG into Investor Reporting and Communication. February 2017. Available online: https://www.lseg.com/sites/default/files/content/images/Green_Finance/ESG/2018/February/LSEG_ESG_report_January_2018.pdf (accessed on 27 February 2019).
  114. Oekom. Corporate Responsibility Review 2018. The Materiality and Impact of Sustainability Research. 2018. Available online: http://www.oekom-research.com/homepage/english/2018-04%20oekom%20CR%20Review-EN.pdf (accessed on 27 February 2019).
  115. Eccles, R.G.; Krzus, M.P.; Rogers, J.; Serafeim, G. The need for sector-specific materiality and sustainability reporting standards. J. Appl. Corp. Finance 2012, 24, 65–71. [Google Scholar] [CrossRef]
  116. Torelli, R.; Balluchi, F.; Furlotti, K. Il settore industriale come determinante della materialità nell’informativa volontaria: Analisi empirica nel contesto italiano. Rivista Italiana di Ragioneria e di Economia Aziendale 2018. [Google Scholar] [CrossRef]
  117. Baldini, M.; Dal Maso, L.; Liberatore, G.; Mazzi, F.; Terzani, S. Role of country-and firm-level determinants in environmental, social, and governance disclosure. J. Bus. Ethics 2018, 150, 79–98. [Google Scholar] [CrossRef]
Figure 1. Path-diagram (i). Our elaboration of the data (Partial Least Squares; bootstrapping). Symbols refer to variables already specified.
Sustainability 11 01738 g001
Figure 2. Path-diagram (ii). Our elaboration of the data (Partial Least Squares; bootstrapping). Symbols refer to variables already specified.
Sustainability 11 01738 g002
Table 1. Descriptive statistics (ESG sample).
VariableMeanMedianMinMaxStd.Dev.Var. Coeff.
EMPL: employees10.35387,11440625,796108.2531.045
ln_EMPL10.73811.3753.68913.34681.8040.168
SALES3.12e+0072.04e+007255,2032.17e+0083.58e+0071.147
ln_SALES16.63616.83612.45019.1971.2590.076
INV_CAP: Invested Capital1.85e+0084.48e+0071.37e+0062.08e+0093.64e+0081.968
ln_INV_CAP17.84217.61814.13421.4551.5210.085
FIN LEV.: leverage5.6242.3020.00361.9478.0391.429
ROS: Return on Sales0.1630.127−1.2550.6970.1641.003
ROI: Return on Investment0.0560.055−0.0110.2180.0440.771
ROA: Return on Asset0.0400.033−0.1330.3690.0511.275
ROE: Return on Equity0.0830.098−6.5660.5170.4205.034
CFOI: Cash flow to Inv.0.0640.063−0.1920.3700.0570.887
P/BV: Price on Book Value2.7072.0940.35014.7052.2140.818
Analyst stock recomm2.4412.4001.7003.7000.3930.161
E: Environment (score)73.29274.30034.80096.00012.1370.166
S: Social (score)72.16474.00043.10097.20010.9030.151
G: Governance (score)69.24770.00036.90088.00010.0900.146
C: Controversies (score)2.5363.0001.0005.0000.8420.332
ESG _Tot (score)71.34172.00043.00087.0009.4410.132
dE: E score over industry1.2321.2170.6421.7380.2260.183
dS: S score over industry1.1961.1930.8041.6640.1660.139
dG: G score over industry1.1091.1160.6251.4880.1560.141
dC: C score over industry1.3671.4290.4002.5000.4250.309
Table 2. Correlations matrix—pairwise (ESG sample).
ln_Empln_Salln_Inv.LevROIROAROECFOIESGCdEdSdGdCRecomm.P/BVESG_T.
ln_Emp.10.723 **0.444 **0.036−0.111−0.123 *−0.017−0.1180.26 **0.1100.215 **0.402 **0.280 **0.180 **0.287 **0.288 **−0.507 **−0.0870.235 **
ln_Sal 10.519 **−0.046−0.175 **−0.255 **−0.083−0.0800.157 **0.0920.223 **0.425 **0.185 **0.1020.186 **0.289 **−0.494 **−0.262 **0.186 **
ln_Inv 10.543 **−0.667 **−0.409 **−0.099−0.562 **0.228 **0.191 **0.0350.579 **0.412 **−0.0310.257 **0.366 **−0.186 **−0.571 **0.182 **
Lev 1−0.516 **−0.310 **−0.326 **−0.414 **0.136 *0.145 *−0.1190.238 **0.340 **0.0050.1130.131 *0.086−0.1000.069
ROI 10.562 **0.169 **0.759 **0.005−0.169 **0.058−0.331 **−0.178 **0.041−0.098−0.091−0.0140.658 **−0.041
ROA 10.330 **0.398 **0.003−0.1110.030−0.149 *−0.078−0.002−0.046−0.0320.1150.377 **−0.034
ROE 10.0940.015−0.097−0.008−0.0140.006−0.0120.0310.0150.1080.097−0.034
CFOI 1−0.059−0.128 *0.101−0.257 **−0.197 **0.043−0.125 *−0.0550.0140.534 **−0.037
E 10.553 **0.591 **−0.179 **0.868 **0.466 **0.628 **−0.185 **−0.161 **−0.0270.860 **
S 10.563 **−0.243 **0.562 **0.777 **0.521 **−0.241 **−0.049−0.153 *0.839 **
G 1−0.237 **0.482 **0.499 **0.856 **−0.151 *−0.313 **−0.0340.827 **
C 1−0.030−0.119−0.1040.818**−0.232 **−0.287 **−0.275 **
dE 10.498 **0.625 **−0.079−0.072−0.0910.768 **
dS 10.512 **−0.129 *−0.1090.0550.691 **
dG 1−0.129 *−0.260 **−0.0850.774 **
dC 1−0.200 **−0.069−0.244 **
Recom. 1−0.004−0.201 **
P/BV 1−0.080
ESG_Tot 1
Our elaboration of data: ** Pearson Correlation significant at 0.01 level (2-tailed); * Pearson Correlation significant at 0.05 level (2-tailed). N = 273. Symbols refer to variables already specified.
Table 3. Extensive OLS model, dependent variable: Market/BookValue.
CoefficientStd ErrorTp-Value
Const14.98692.00827.4628<0.00001***
ln_EMPLOYEES0.28760.06954.13560.00004***
ln_SALES0.28410.13442.11390.03508**
ln_INVESTMENTS−1.25440.1149−10.9180<0.00001***
LEVERAGE0.12980.02535.1240<0.00001***
DESG1.55650.34714.4844<0.00001***
Regression Statistics
Sum Squared Errors3395.202 S.E.2.765Sum Squared Errors
R-squared0.2257 Adj. R-squared0.217R-squared
F-test37.991 p-value(F)0.000F-test
(***) level of significance 1%; (**) level of significance 5%. White’s Heteroskedasticity robust standard errors. Symbols refer to variables already specified.
Table 4. ESG sample—OLS model, dependent variable: Market/BookValue.
CoefficientStd ErrorTp-Value
Const17.60042.85776.1589<0.0000***
ln_EMPLOYEES0.17380.06032.88040.0051***
ln_SALES0.15230.12311.23710.2196
ln_INVESTMENTS−1.15770.1594−7.2630<0.0000***
LEVERAGE0.08040.01644.8945<0.0000***
ESG_Tot−0.04600.0348−1.32300.1895
dE2.16721.15641.87410.0645*
dS−0.26710.87380.30570.7606
dG0.83681.09030.76710.4452
Regression Statistics
Sum Squared Errors129.9269 S.E.1.2588Sum Squared Errors
R-squared0.5120 Adj. R-squared0.4644R-squared
F-test10.9266 p-value(F)0.0000F-test
(***) level of significance 1%; (*) level of significance 10%. White’s Heteroskedasticity robust standard errors. Symbols refer to variables already specified.
Table 5. ESG sample—OLS model, dependent variable: Accounting Performance.
y = ROIy = ROAy = ROE
Coeffic.p-Value Coeffic.p-Value Coeffic.p-Value
Const0.3888<0.0000***0.45280.0004***0.36540.5316
ln_EMPLOYEES0.00520.0452**0.00680.0423**0.028760.2988
ln_SALES0.00330.4202 −0.01680.0306**−0.21760.0888*
ln_INVESTMENTS−0.0248<0.0000***−0.01100.0062***0.18560.1519
LEVERAGE−0.00100.0351**−0.00190.0122**−0.07210.0620*
ESG_Tot−0.00020.7911 −0.00170.0771*−0.02850.0411**
dE0.05180.0936*0.09230.0154**1.0390.0273**
dS−0.03600.0972*−0.05980.0899*0.10700.7798
dG0.00190.9497 0.07060.0970*0.61520.0999*
Regression Statistics
R-squared0.57570.37440.5103
S.E.0.03030.04180.5198
Adj. R-squared0.53430.31340.4625
p-value(F)0.0000.00000.0938
(***) level of significance 1%; (**) level of significance 5%; (*) level of significance 10%. White’s Heteroskedasticity robust standard errors. Symbols refer to variables already specified.

