Article

How Do Spatial Patterns Impact Regulation of Water-Related Ecosystem Services? Insights from a New Town Development in the Yangtze River Delta, China

1
College of Architecture and Urban Planning, Tongji University, Shanghai 200092, China
2
Faculty of Architecture, Building and Planning, The University of Melbourne, Parkville VIC 3010, Australia
*
Author to whom correspondence should be addressed.
Sustainability 2019, 11(7), 2010; https://doi.org/10.3390/su11072010
Submission received: 28 February 2019 / Revised: 29 March 2019 / Accepted: 1 April 2019 / Published: 4 April 2019
(This article belongs to the Collection Sustainable Built Environment)

Abstract

:
Scientists have made efforts to improve the efficiency and effectiveness of ecosystem service valuation and mapping; yet little actual implementation of new ecosystem service knowledge has been delivered in practice. We explored this gap by developing a spatially explicit and semi-qualitative evaluation approach to clarify how the spatial patterns of new town developments impact three types of water-related regulating ecosystem services, namely water flow regulation, flooding mitigation, and water quality regulation. Based on peer-reviewed publications, we identified key indicators with spatial characteristics that practitioners care about and have control of. We investigated the case of Lingang, a satellite city of Shanghai in the Yangtze River Delta, and found that (1) 85.30% of the pre-urban East Lingang with native marshlands performed better holistically while 93.06% of the post-urban East Lingang using the man-made lakeside model performed poorly; (2) 82.47% of the double grids model at West Lingang performed poorly in pre-urban time, while some major waterways were improved by the Hydrological Planning; and (3) a major weakness in the planning process was the ignorance in conserving pre-urban ecological resources, preventing the provision of ecosystem services. Finally, four urban design principles of both large-scale land use considerations and finer-scale design implications were proposed.

1. Introduction

Environmental degradation as well as the loss of critical ecosystem services (ESs) have been seen as a result of the unparalleled urbanization in post-reform China. One approach to achieve more sustainable urban development is through ‘design for eco-services’ [1], which means that ES performance should be considered initially when making planning and design [1]. ESs are the goods and services that people receive from natural ecosystems [2,3]. While the concept of ESs has been well established and more efforts have been contributed to improving the efficiency and effectiveness of ES mapping and valuation [4,5], little actual implementation of new ES knowledge has been delivered in practice [5,6]. Planning and designing interventions can change the spatial patterns of a city or a region [7]. Thus, the ecological processes and functions provided in urban or regional ecosystems are likely to be altered. An understanding of how ES performance is impacted by urban developments is pivotal for practitioners in the task of maintaining or fostering essential ESs in cities.
As per the Millennium Ecosystem Assessment report, ES can be classified into four categories, including provisioning, regulating, supporting, and cultural servicing [2]. Among these categories, regulating ESs are essential to maintain balance in terrestrial ecosystems; however, they are often ignored in decision-making processes because they are less visible to people [8,9]. Moreover, the water-related ecosystem services (ESw) are highly interrelated with society due to their role in human wellbeing [10,11,12,13]. For example, ESw involves all the four ES categories such as freshwater provision (provisioning service), waterfront areas for recreational activities (cultural service), water cycling (supporting service), and flooding mitigation (regulating service) [14,15]. Therefore, this article focuses on water-related regulating ecosystem services (regulating ESw), which are delivered through a combination of natural landscapes (i.e., retention ponds and wetlands that enable water purification and water flow regulation) and built infrastructure (i.e., pipeline that enables stormwater discharge) in urban developments. The spatial patterns of urban developments are inevitably related to the quality and quantity of regulating ESs produced by water systems in a given territory [16]. Hence, this article focuses on the spatial patterns of new town developments, particularly their impacts on the performance of regulating ESw. The term ‘spatial pattern’ may be understood at different spatial scales. At the broad scale, it includes features relevant to the spatial composition and configuration of a landscape, for instance, the shape and size of a stream or the land use functions of a floodplain [17]. At the finer scale, it deals with the materiality or construction details of a riverbank, a bioretention pond, and even the plant species used for bioswales.
This article relates the spatial patterns of new town developments with ES performance, which is a particular concern for at least three reasons. First, the Yangtze River Delta (YRD) has experienced the most intensive urbanization, coupled with environmentally insensitive planning and design, whose ecological consequences have been widely criticized [18,19,20]. New town development describes the process whereby non-urban areas are converted into urban areas [18]. During the process, the original water system is flattened, resulting in channelized, straightened, chopped, and filled natural streams, coupled with countless removed wetlands and marshlands [18,21]. However, artificial lakes and ponds have been newly built, for example Jiyang Lake in Zhangjiagang, Jinji Lake in Suzhou, and Dishui Lake in Shanghai. Consequently, three regulating ESw’s have been influenced, namely water flow regulation (WF), flooding and stormwater mitigation (FS), and water quality regulation (WQ). Second, the theories of ES have been traditionally studied by the professionals of ecology, biology, environmental science, and engineering; however, most of their research focused on the ecosystems in non-urban areas [9,18]. The prevalent research on ES valuation and mapping, mostly using land uses and land cover data [22,23,24,25], was devoted to pursuing ‘pure basic research for fundamental understanding’ [5]. As has been argued, little effort was made in ‘implementing the new ES knowledge in practice’ [4,5,6]. Third, most existing research into regulating ESw, focusing on experiments or micro-scale findings, is provided by water engineers or hydrologists [26,27]. Limited explicit and effective practical knowledge on regulating ESw’s is available to planners and designers who tend to be more concerned with formal outcomes and their aesthetic influences of urban developments. The scientific data-based ES studies are often found too difficult to be understood by practitioners or too complicated to be directly applied in town and city planning practices [23].
In brief, this article aims to clarify how the spatial patterns of new town developments impact the performance of regulating ESw provisions and what spatial patterns can perform better. In order to answer these questions, this article discusses how applications can be improved by advancing the identification and evaluation of pre-existing eco-resources as well as the planning and design of new developments to maintain and enhance their ecological functioning, not only holistically, but at precinct and site levels. This article is structured as follows: firstly, we present the study area, its regional context, and describe the methods in Section 2. Then we present the results in Section 3. We discuss the results in Section 4, formulating four urban design principles that may be potentially applicable in new town development practices aspiring to integrate spatial patterns with regulating ESw provision for urban sustainability.

2. Materials and Methods

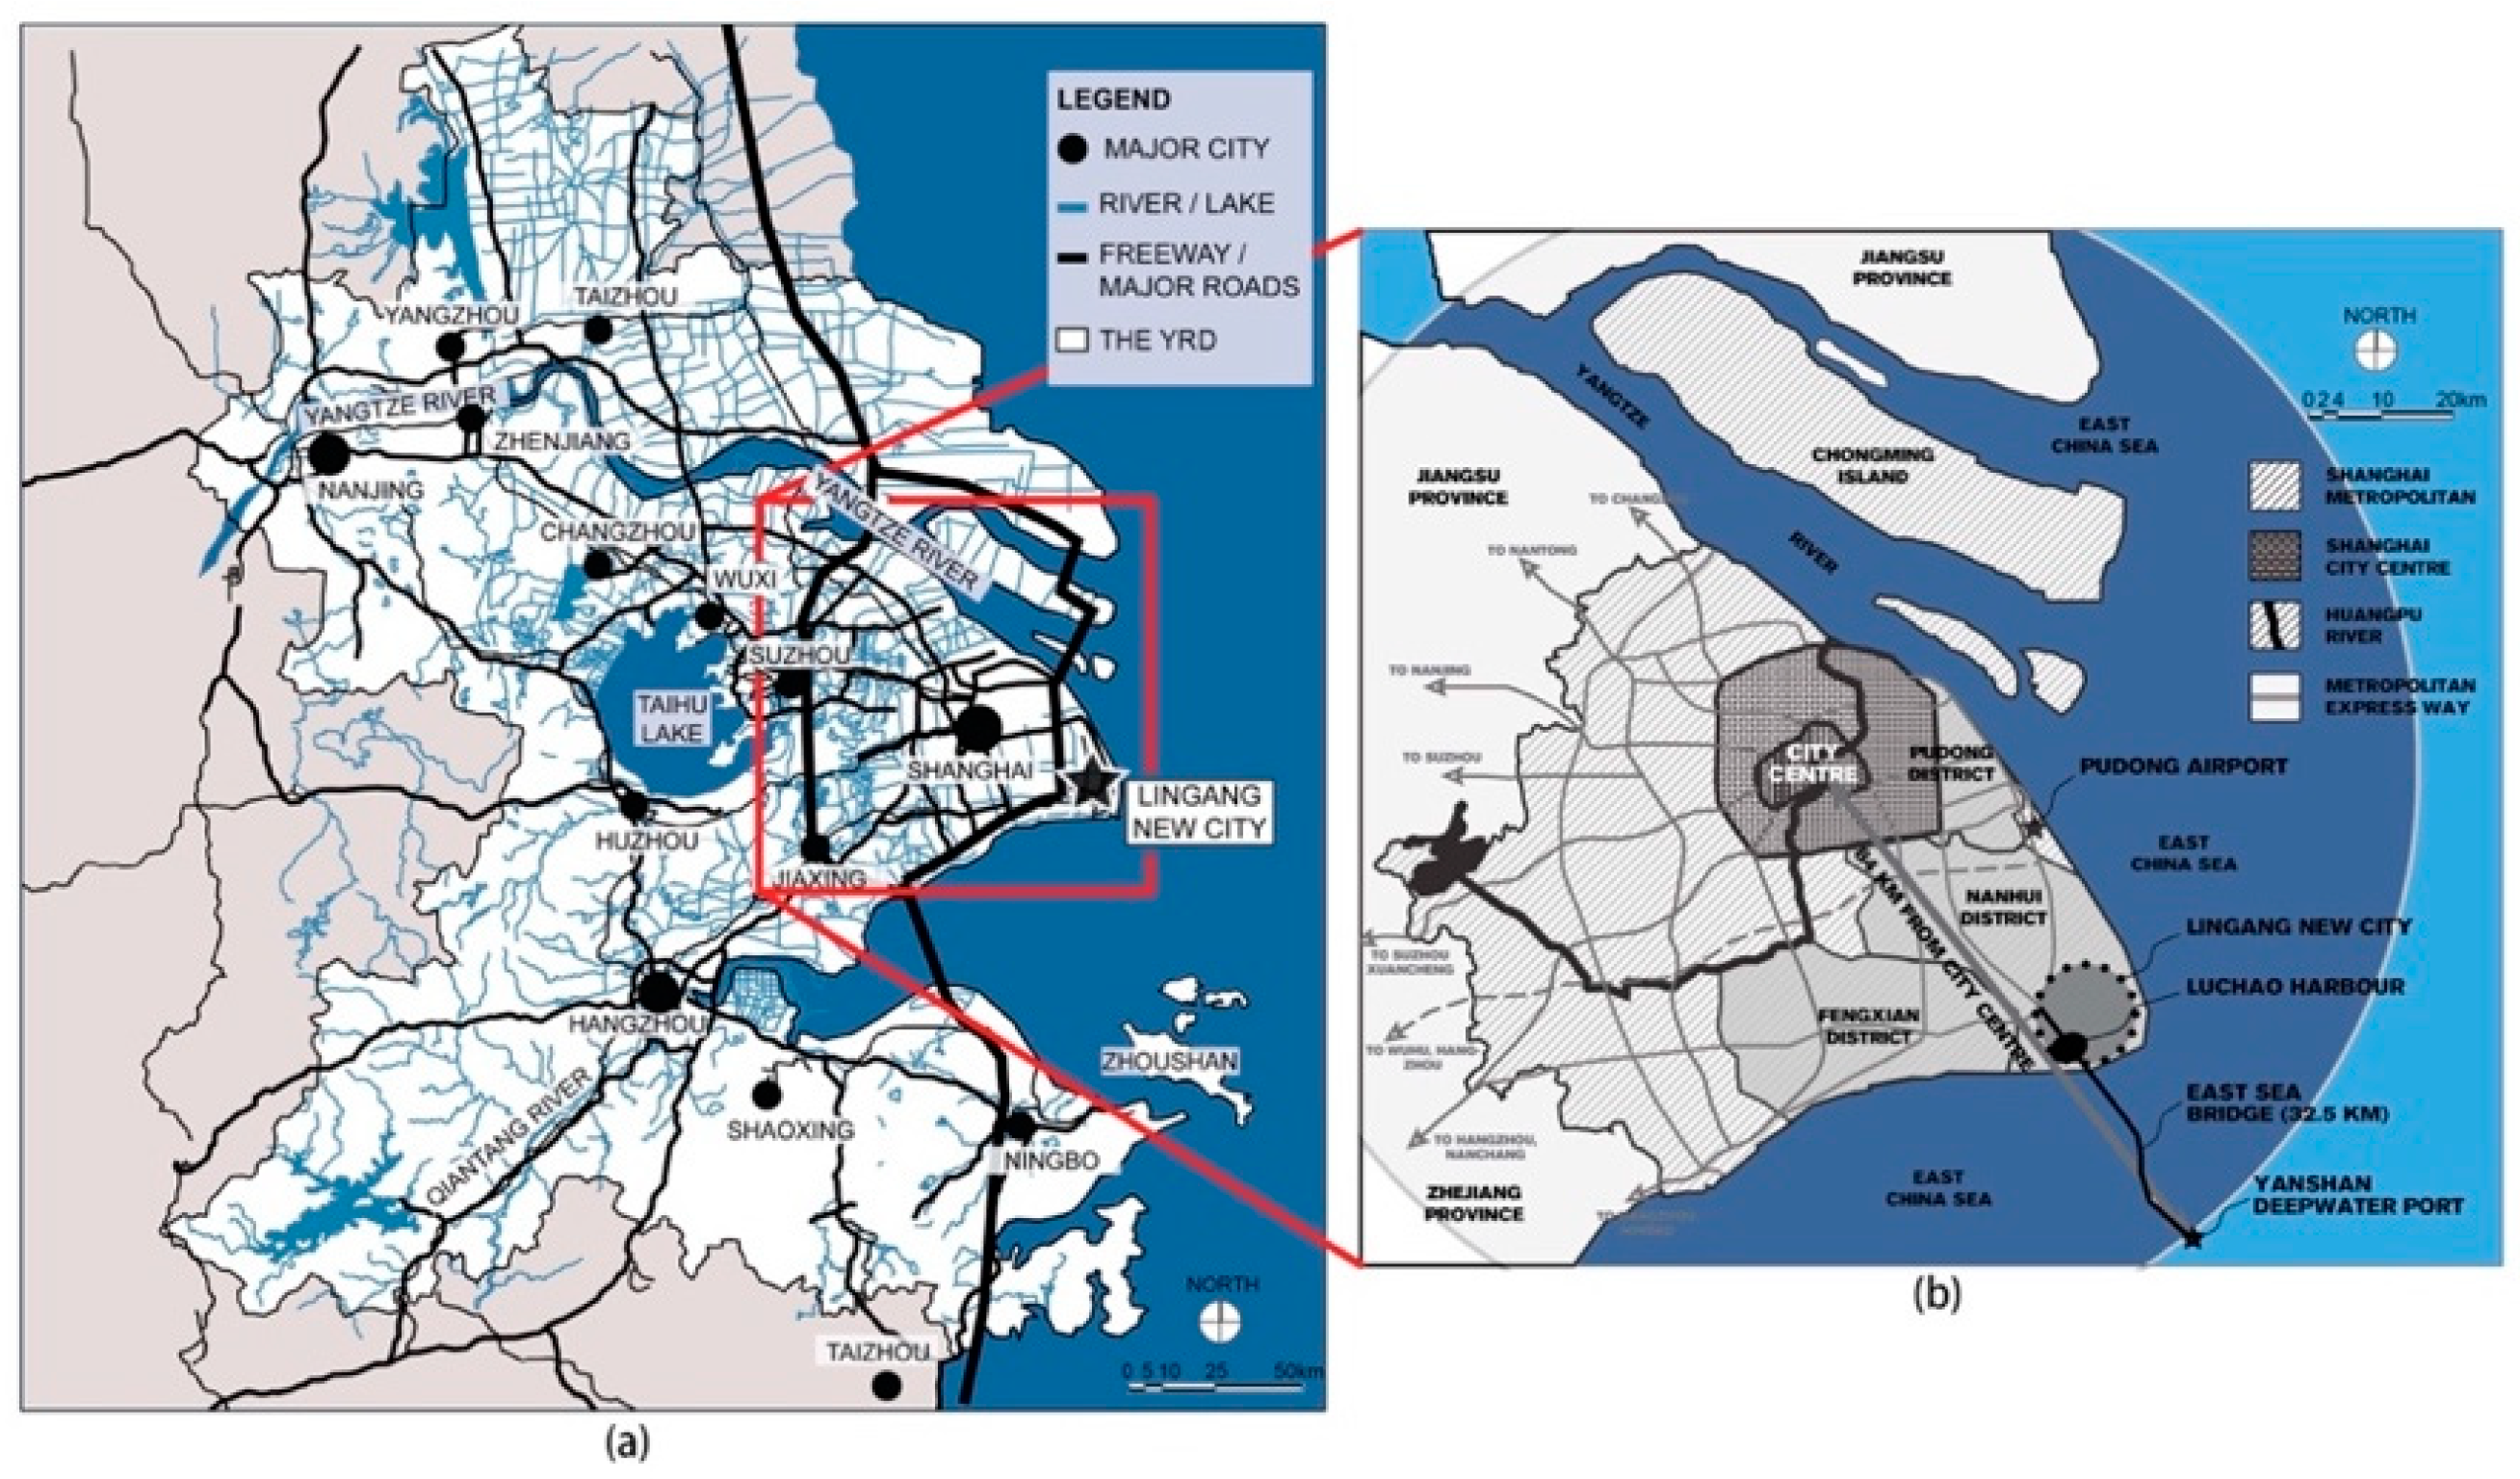
2.1. Study Area and Its Regional Context

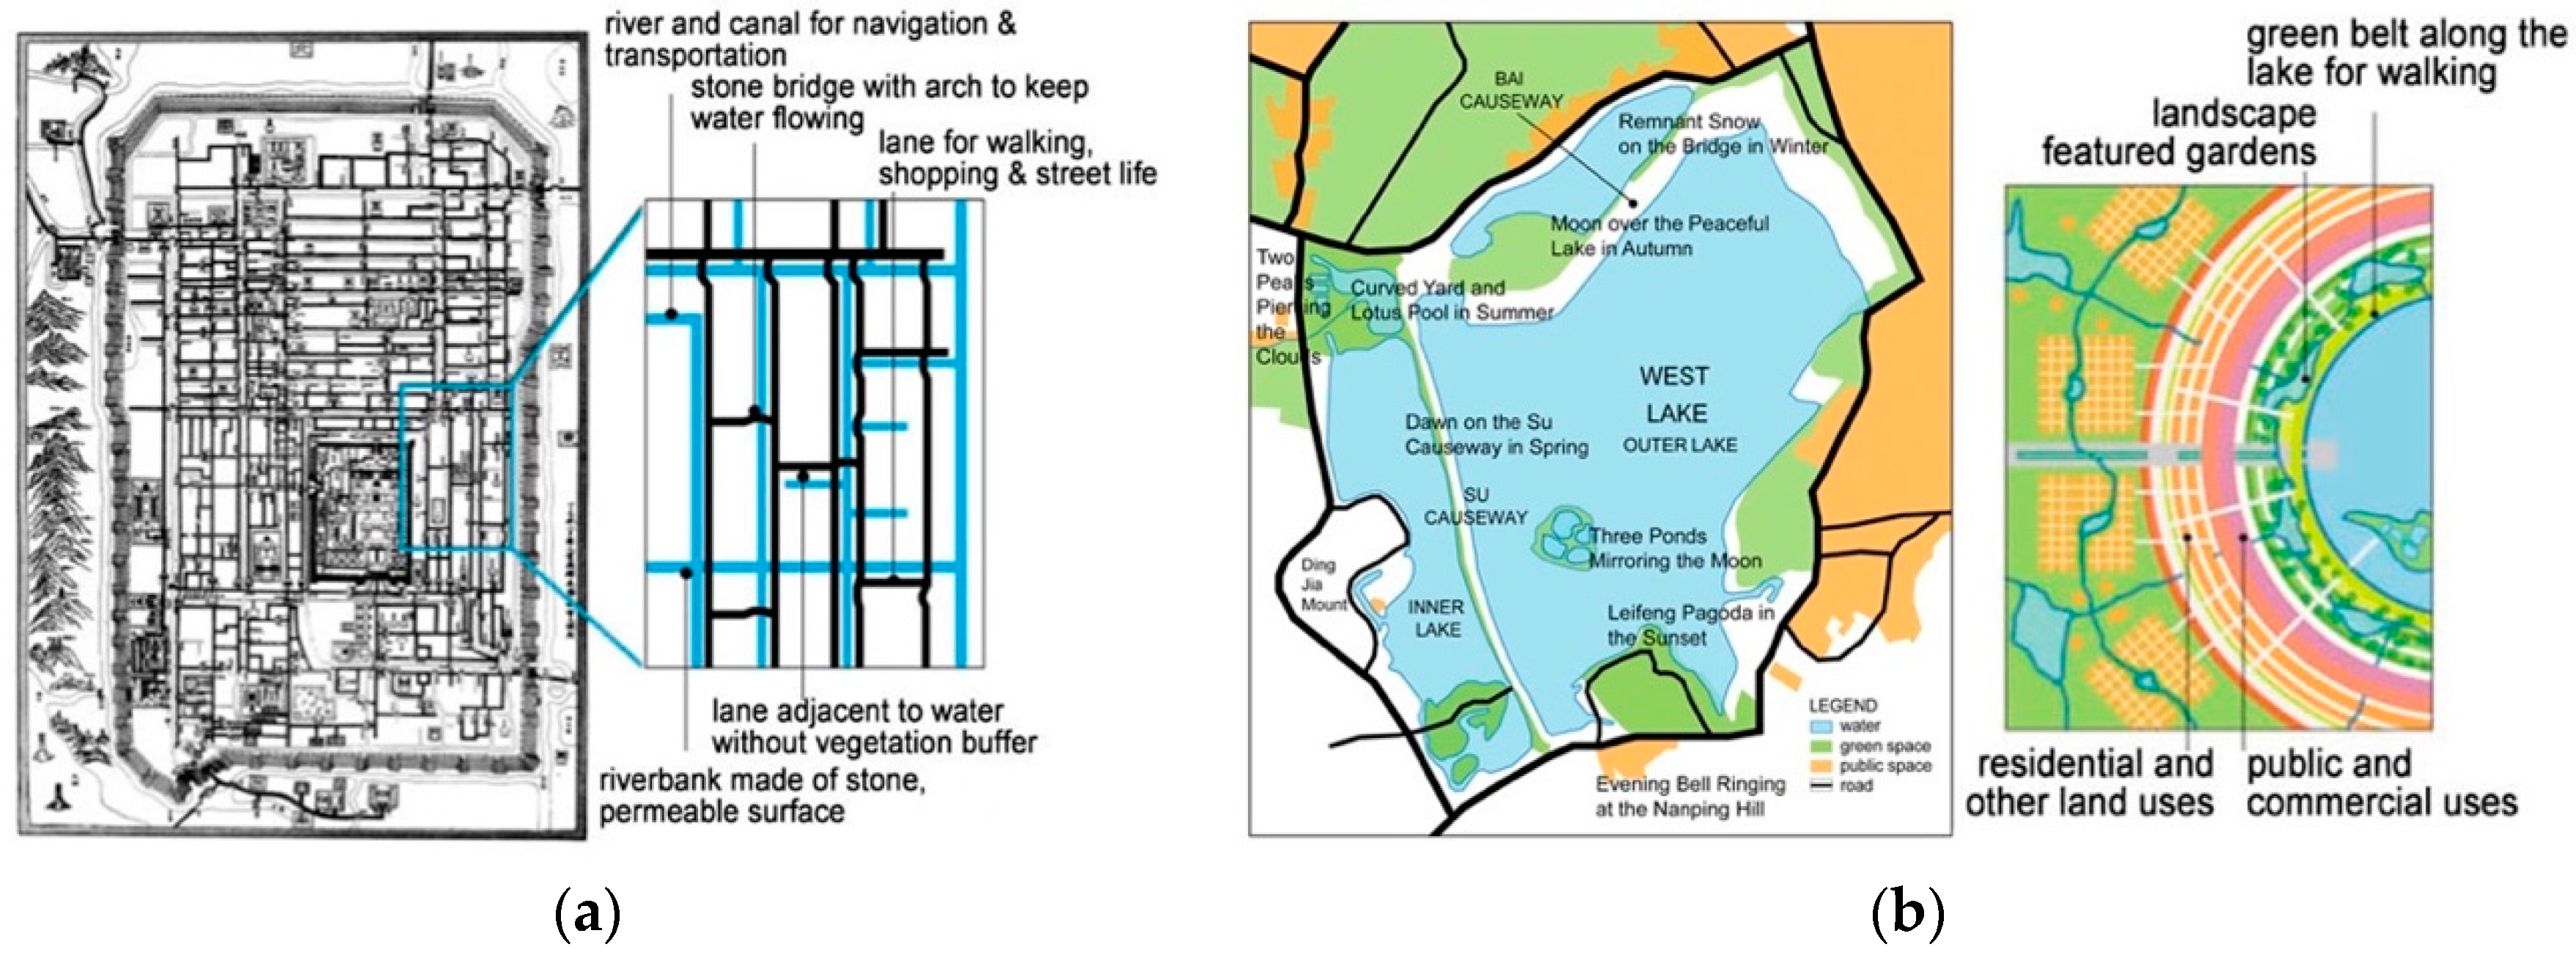
2.1.1. The Yangtze River Delta (YRD) and Two Indigenous Water-Related Spatial Patterns

The Yangtze River Delta (YRD) is situated on the eastern coastline of China where the Yangtze River drains into the East China Sea (Figure 1a). It comprises eastern Shanghai Municipality, southern Jiangsu Province and northern Zhejiang Province. Today, the YRD is one of the most urbanized and industrialized regions in China. It covers only 1.1% of China’s land area but holds 7.3% of China’s population and produces 17.5% of China’s GDP [28]. In the past decades, large amounts of forest and cropland in the region have been converted into built-up areas. The three mega cities Shanghai, Nanjing and Hangzhou, together with the fast-growing prefecture level cities and newly developed greenfield towns in YRD, have formed the center of the largest economic belt in China, leading to one of the largest urban agglomerations or urban regions in the world [29].
Given the influences of the East Asian monsoon, the YRD is well-known in historical times for its productive and agrarian landscapes, particularly water- and agriculture-based productivity. Jiangnan Shui Xiang, literally ‘water-based settlements in the YRD’ [18], has been long considered as the root of the elegant and peaceful water-based lifestyle of the delta. In the traditional YRD, early dwellings were linked together by a network of water [18], including rivers, channels, drainage ditches, and low-lying rice paddies. There were two types of long held and highly valued indigenous spatial patterns of water—the double grids model and the lakeside model.
Firstly, the double grids model (Figure 2a) used rivers and canals as its ‘public’ lifeline and used the ‘private’ streets and lanes for street life, shophouses, and walking [18]. One of the most famous double grids models came from Pingjiang (the name of Suzhou in Nan Song Dynasty), where narrow streets and lanes in grid format were interconnected and parallel with rivers and canals [18]. The connected major rivers and minor canals were used for waterborne transportation. Quiet lanes contrasted with busy and vital waterways. Most of dwellings adjacent to water had their own boat launches. Secondly, the lakeside model illustrated a typical picturesque landscape, supported by a variety of amenities around a lake [18] (Figure 2b). One of the most typical examples of this model was Hangzhou, historically centering on West Lake [18]. The lakeside model, given the advantage of a larger water area, offered additional functions that were missing in the double grids model with generally narrow watercourses. For example, the lakeside model allowed the possibility to create abundant recreational opportunities around the lake. The vibrancy of West Lake in Hangzhou came from the ten lakeside landscape sites, known as ‘Ten Scenes of West Lake’ [18]. These sites distinguished Hangzhou as a lakeside city, with highly valued social and cultural ecosystem services all year around.

2.1.2. Study Area

Lingang New City, a satellite town of Shanghai, was chosen as the study area (Figure 1b). Lingang, a site of 297 km2, was planned to contain both industrial and urban functions and to accommodate a projected population of 0.83 million by 2020 [18,30]. The reasons of selection were: (1) the spatial patterns of Lingang have undergone major changes from the 1990s to its current state, allowing the study to explore the impacts of spatial patterns on regulating ESw performance across a series of time spans associated with different development stages; (2) the aforementioned two indigenous water-related spatial patterns were both adopted at Lingang, allowing the study to measure their performance of regulating ESw; and (3) detailed planning documents including planning and design schemes related to water are generously made available by the local government of Lingang New City. As illustrated in Figure 3, the planning and design schemes related to water of Lingang New City had three incremental phases.

2.2. Methods

2.2.1. A Spatially Explicit and Semi-Qualitative Evaluation Method

As for the evaluation and mapping methods of ES, existing studies provided methods that often required various data sources, advanced analysis methods, and land uses and land cover maps on a broad scale [23]; therefore, they were too difficult to be applied to evaluate the spatial patterns of a new town development, particularly at finer scales. In this article, we proposed a spatially explicit approach in order to examine how the plan-making and form-making of a new town development contributes to a high performance of three regulating ESw’s. To do so and to ensure replicability, we proposed an approach that had the following characteristics: (1) it selected key indicators of evaluation based on peer-reviewed publications (Table 1); (2) it used the key indicators of evaluation that practitioners care about and have control of, and therefore are related to spatial patterns, and can be represented using spatial data; (3) it was driven by data that are published and publicly available; (4) its main processes run in widely used software (ESRI ArcGIS with Spatial Analyst extension in this case); and (5) it used simple, straightforward and semi-quantitative methods based on a scoring system [31]. Scoring is a blunt tool for describing the complex and dynamic ecosystems such as rivers [31]. These features enabled us to study regulating ESw in a ‘real-life’ city and finer scales under different water-related spatial pattern considerations associated with different development stages of a satellite town in the YRD.
The Lingang Administrative Committee provided a MapInfo dataset, which was converted into ArcGIS with vector layers and produced the base maps at the urban scale. Most of raw data were converted from CAD (Computer Aided Design) drawing and planning maps, including (1) the planning schemes from conceptual planning to urban master planning, (2) land use maps of different years, and (3) the technical reports of different disciplines. The water courses and areas in pre-urban and post-urban conditions, as well as the different widths of riparian vegetation buffers, were derived from the Lingang Hydrological Planning Technical Report (Hydrological Planning) made by Shanghai Hydrological Planning and Design Institute [18,32] in 2004. After the CAD data were converted into vector data in GIS, new fields, consistent with identified key indicators, were added into the ‘Attribute Table’ of the map and reclassified with different scores. In order to supplement other finer-scaled details, we also used on-site observation and other documentary evidence, including (1) policy documents of different levels of governments, (2) administrative and strategic documents, (3) project briefs, construction specification, and management manuals, (4) relevant research projects, (5) monitoring and archival records, and (6) other secondary sources (i.e., journal articles, newspaper, and other articles appearing in the mass media or Internet [18]). To obtain on-site evidence, we conducted fieldtrips in June 2009, February 2011, and June 2013 using GPS equipment (MobileMapperCE). In terms of topography, we downloaded the DEM (Digital Elevation Model) data with a resolution of 30 m and an elevation accuracy of 1 m for topographic analysis from ASTER [33].
By doing so, individual thematic maps were produced to represent different indicators. The following step was rasterization, which converted vector maps into raster maps. Considering the mean width of waterways at Lingang, we selected 50 m as the cell size, which the output raster dataset was created with. After raster-based thematic maps were overlaid, the operation of ‘Aggregate’ can resample an input raster to a coarser resolution based on a specific aggregation strategy. The aggregated result map as the output results can clearly indicate higher and lower performance of regulating ESw provisions. The overall performance of regulating ESw provision is calculated as:
ESW = WF × FS × WQ ,
where ESW represents the overall performance for the provision of regulating water-related ecosystem services. WF, FS, and WQ denote the performance of water flow regulation, flooding and stormwater regulation, and water quality regulation, respectively. They were normalized into the value range between one and five based on their attributes, which are specified in the following sub-sections.

2.2.2. Key Indicators for Evaluating Water Flow Regulation

Regarding the ES of water flow regulation (WF) in the YRD, three different indicators were defined based on peer-reviewed publications. Indicators are listed in Table 1 (from 1.1 to 1.3). The performance for WF is evaluated based on the following formula:
WF = Sr × Ee × Vr 1 3 ,
where WF represents the performance for regulating water flow; Sr, Ee, and Vr1 represent sinuosity ratio, extent of engineering intervention, and vegetated riparian buffer width, respectively, which are specified below.
Sinuosity ratio (Sr, 1.1) represents the impact of the geometric complexity of a water channel on sedimentation and erosion [34,35], and it can be measured by the ‘the ratio of a channel length and the valley length’ [18,36]. Since the channels in the YRD had to accommodate excessive particles from upstream, straight channels (Sr = 1.0) were defined as high performance (they had a score of 5). Channels with the Sr between 1.0 and 1.5 have a score of 3, and the others with the Sr of 1.5 have a score of 1.
The extent of engineering intervention (Ee, 1.2), expressed as the percentage of engineered water body, was derived from a combination of the predominant planform, cross profile, and level of reinforcement of the water body [37]. Excessively engineered or newly built water bodies (Pe between 70% and 100%; i.e., channelization, straightening, simplifying river banks, dredging riverbeds and narrowing channel width), contributed less to WF and were assigned a value of 1. Semi-natural water bodies (Ee between 30% and 70%) were assigned values of 3, while natural ones (Ee less than 30%) were assigned a value of 5.
Vegetated riparian buffer width (Vr1, 1.3) is important for soil erosion reduction and filtering particles in the waterflow before it flows into downstream waterbodies [38]. As per the literature, an average width of 30 m riparian vegetated buffer was effective in preventing erosion and increasing the stability of lower waterbodies, while a buffer of 80 m-wide vegetation along the water was sufficient enough to deposit sediments and erosion from surrounding farmlands [18,21,39]. Thus, wider vegetated buffers (Vr1 ≥ 80 m) contributed more to WF (score 5). A water body with a buffer width between 30 and 80 m is assigned value of 3 and the others are score 1.

2.2.3. Key Indicators for Evaluating Flooding and Stormwater Mitigation

As for the flooding and stormwater mitigation (FS) in the YRD, three different indicators were defined based on peer-reviewed publications. Indicators are listed in Table 1 (from 2.1 to 2.3). The performance for FS was evaluated based on the formula as follows:
FS = Te × Cr × Sd 3 ,
where FS represents the performance for mitigating flooding and stormwater; Te, Cr, and Sd represent terrain elevation, the curve number, and stormwater drainage approach, respectively, which are specified below.
Terrain elevation (Te, 2.1) represents the tolerance of a site to floods as a result of its topographic character [18,40]. The irregular topography of a given site was computed using the DEM data in grid format. According to Chinese Standard for Flood Control (GB 50201-94) [41], the Hydrological Planning [32], and the elevation accuracy of 1 m of downloaded digital elevation maps, the areas with high elevations (Te ≥ 6m) that were less vulnerable were graded 5, while flood-prone sites of lower elevations (Te ≤ 4m) were considered more vulnerable to flooding (score 1). Other areas (Te between 4 and 6 m) were graded 3.
Coefficient of runoff (Cr, 2.2) is an empirical criterion used in hydrological studies in order to predict direct runoff or infiltration caused by rainfall excess, and it is influenced by soil composition, texture, and land cover types [18,42,43,44]. Generally speaking, urban runoff increases with slope and an impervious surface coverage, but it decreases with soil organic content and vegetative cover [42]. Since the soil type at Lingang is of the silt loam variety (comprised of 0%–15% clay, 45%–100% silt, and 0%–55% sand), this article adopted the Cr for ‘Clay and Silt Loam’ [18,42]. According to Marsh [42], commercial land uses were assigned a Cr of 1.0. Heavy industrial land was assigned a Cr of 1.5, while light industrial, roads, and car parking were assigned Cr values of 2.5. Residential land with storied buildings was assigned a Cr of 3.5, while low-density residential land and cultivated land were graded 4. Areas of woodland (0%–5% slope) were assigned a Cr of 4.5, and parks were graded 5.
Indicator 2.3 of Sd represented different approaches of stormwater drainage, focusing on how runoff was collected and transported across different surfaces. The areas with drainage channel enlargement, pipe networks, and intensive pumps were considered as a short-circuiting route in the hydrological cycle (score 1), often with disastrous results of peak discharge and localized sedimentation [40,45]. The areas where runoff spread over impervious surfaces before entering the conventional drainage piping system had a score of 3 [40,45]. Other more sustainable drainage approaches (i.e., pervious pavement, detention ponds, a buffer strip, and rain gardens) [46] that deposited ‘the design storm and then allow it to discharge at a specified rate’ [18,42] had a score 5.

2.2.4. Key Indicators for Evaluating Water Quality Regulation

The ES of regulating water quality (WQ) in the YRD concerned five different indicators involving a combination of intrinsic and extrinsic factors, as listed in Table 1 (from 3.1 to 3.5). The performance of WQ was evaluated based on the formula as follows:
WQ = Wv × Ef × Vr 2 × Bp × Ep 5 ,
where WQ represents the performance for regulating water quality; Wv, Ef, Vr2, Bp, and Ep represent water volume, extent of flow velocity improvement, vegetated riparian buffer width, extent of biological processes improvement, and extent of pollution, respectively, which are specified below.
Indicator 3.1 of Wv was quantified by the mean depth of a lake and the size of the cross-sectional area of the water channel [18,47]. The literature suggests shallower water areas were more vulnerable to algae blooms if their mean depths were less than 10 m [18,47]. Lakes with a 10 m or deeper mean depth and channels with larger cross-sectional areas were graded 5. Lakes with a mean depth less than 10 m and channels with medium-sized cross-sectional areas had scores of 3, and everything else was scored 1. Any changes to Wv may result in modifications to channel morphology or riparian habitats, which should be carefully considered during the planning and design processes.
Indicator 3.2 (Ef) is the extent of flow velocity improvement, which determines how susceptible water bodies are to pollution [40]. Streamflow is correlated with dissolved oxygen in water [47], while flow velocity effects the quality of the in-stream habitat [48,49]. Lakes are likely more susceptible to contamination than rivers because of their longer circulation times, higher sensitivities to pollution, and more difficult recoveries compared to rivers [18,40]. Considering the low-lying, flat, and stagnant water flow in the YRD, the water bodies with a semi-natural intervention to increase dissolved oxygen in water (i.e., riverbed sill, rock ramp, zig-zag sill) were graded 5, while ones with engineering intervention (i.e., polder, pump, weir, and sluice gate) were graded 3 [50]. A value of 1 was assigned if there was no consideration of Ef.
Vegetated riparian buffer width (Vr2, 3.3) is also correlated to WQ, but their filtering functions differ according to their widths [51]. The literature recommends that an average width of 30 m vegetated riparian buffer can effectively filter nutrients and remove other pollutants [18,39], while there is significantly higher removal efficiency (in %) in 10 m-wide riparian buffers compared to 5 m widths [51]. Thus, regarding the contribution to WQ, the wider vegetated buffers (Vr2 ≥ 30 m) were graded 5. Buffers were graded 3 if they were between 10 m and 30 m, and they graded lowest if below 10 m (score 1).
Indicator 3.4 of Bp acknowledges the role of biological processes in mitigating eutrophic processes through a healthy food web in aquatic ecosystems [18,52]. A water body that can largely purify itself through an input of micro-organism treatment and self-perpetuating biological communities was graded 5 [18,47]. The water with an interaction of fishes and aquatic plants was graded 3. No consideration of Bp was assigned a value of 1.
Extent of pollution (Ep, 3.5) was also considered. A water body was assigned 1 if it was polluted by adjacent sewage outfalls, industrial effluent pipes, or surface runoff pipes [37]. Wastewater without treatment discharged from agriculture, households, and industry and urban runoff were major sources of nutrients, synthetic organic pollutants, heavy metals, and pesticides [18,53]. The water influenced by adjacent land uses, including industrial, commercial, and roads had a score of 3. The water with no pollution input was assigned a value of 5.

3. Results

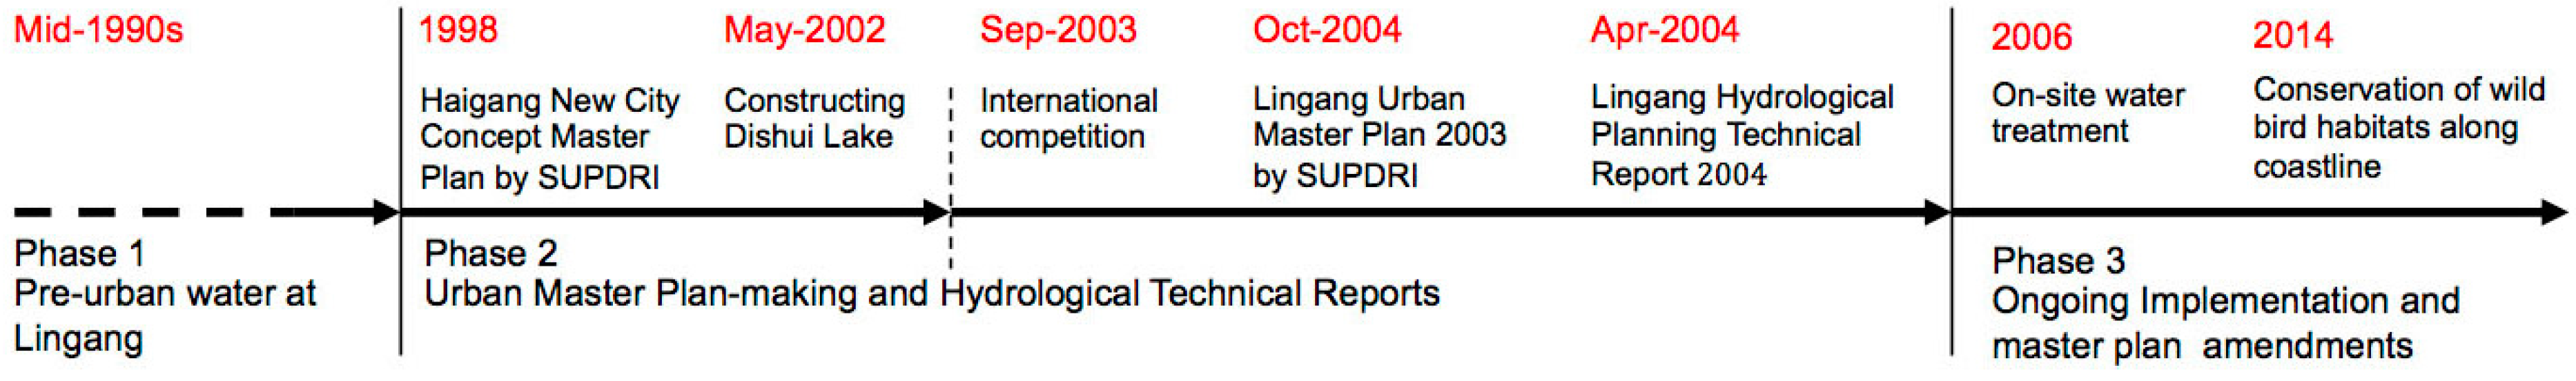
3.1. Comparison of Water-Related Spatial Patterns in Three Development Stages of Lingang New City

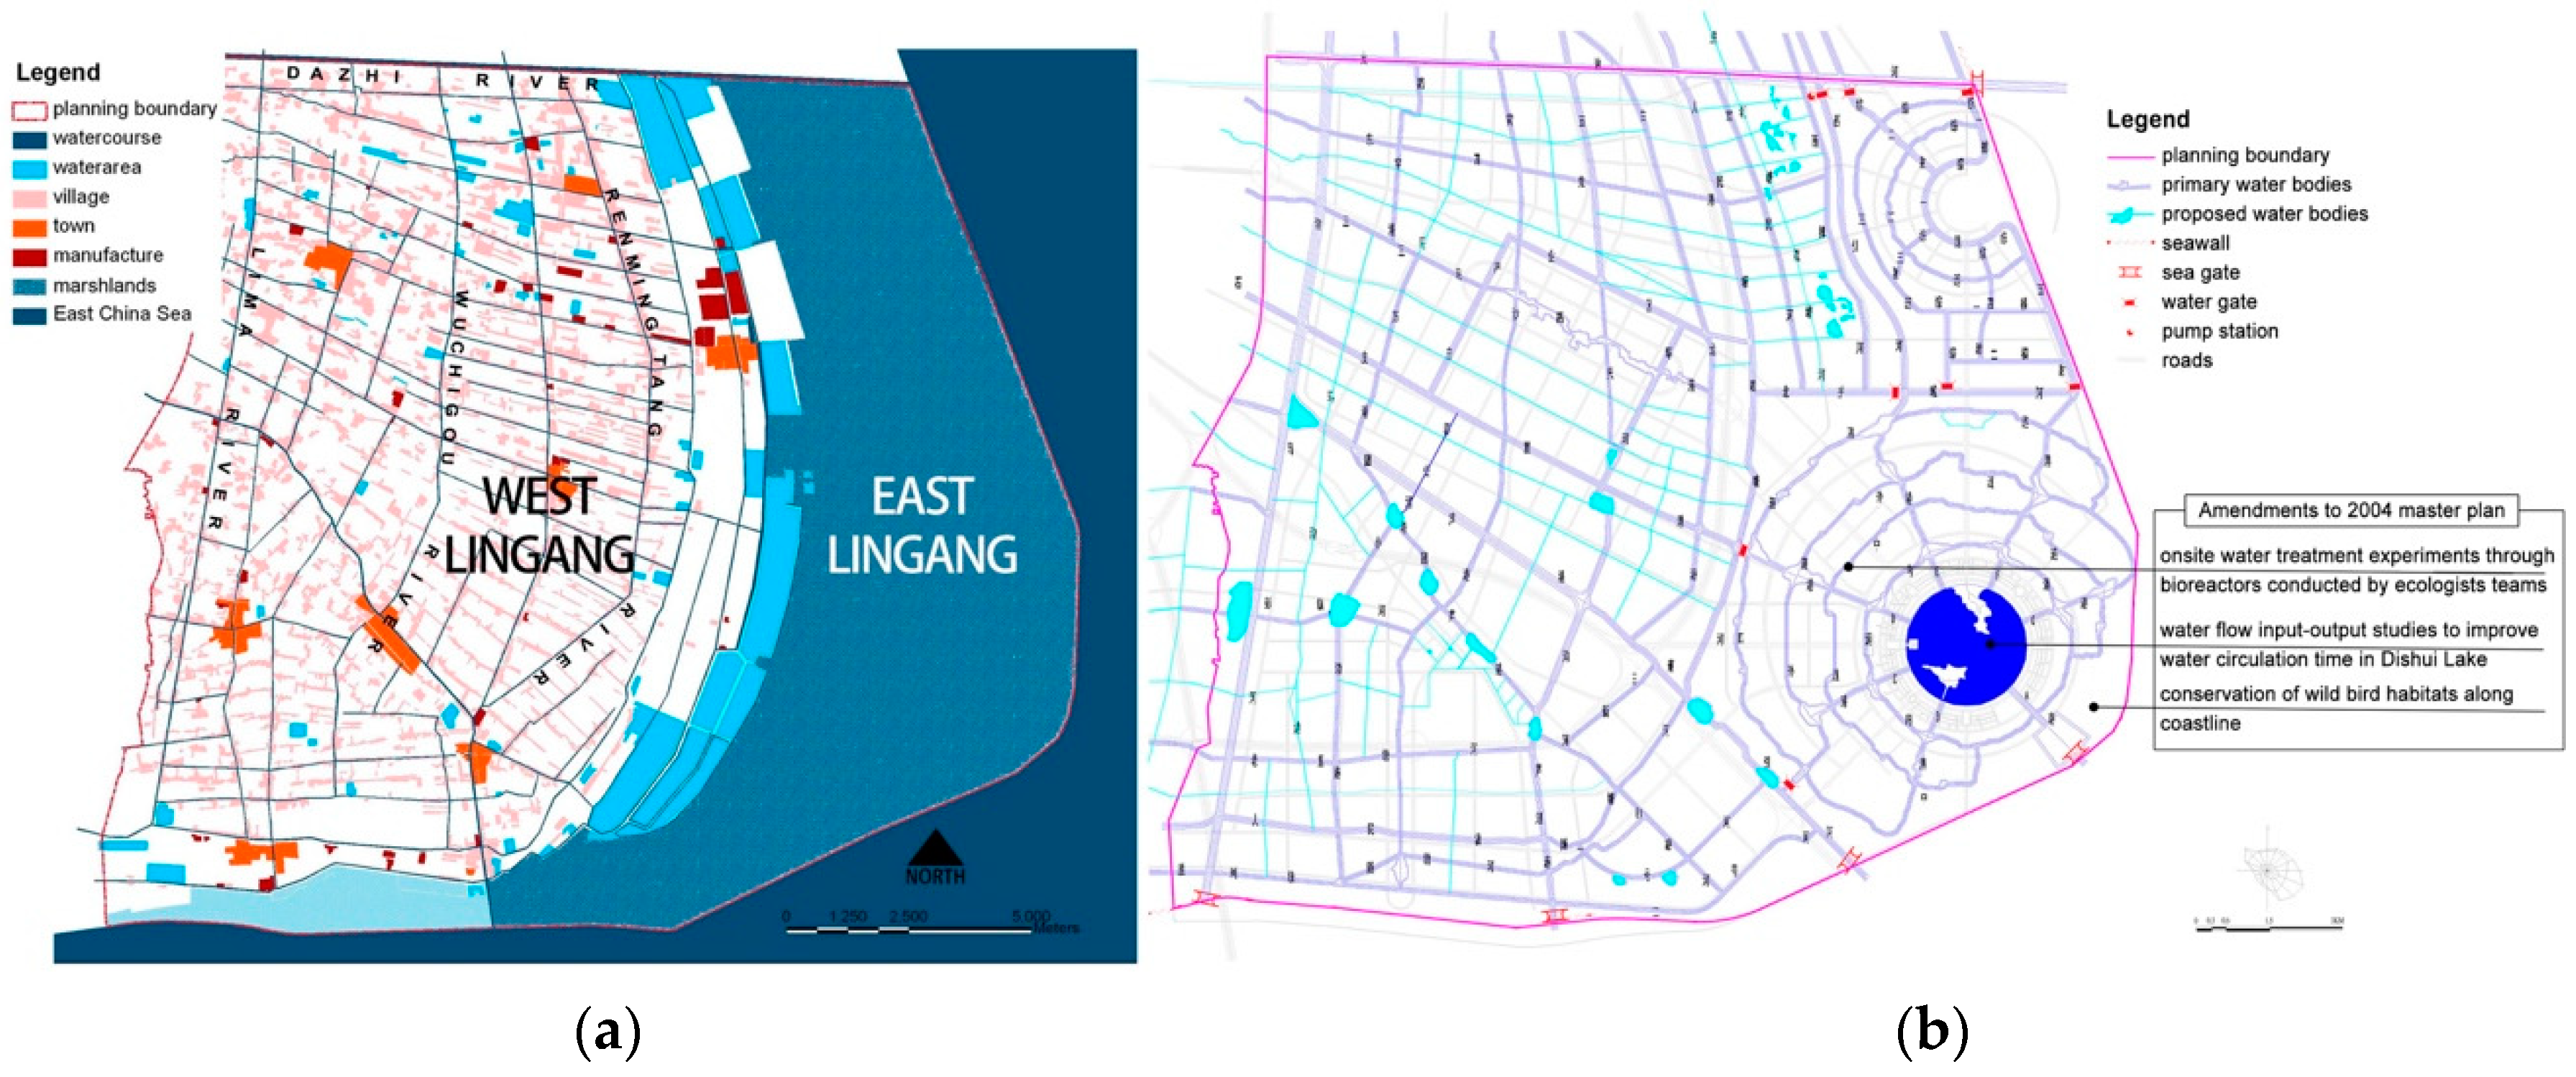
3.1.1. Pre-Urban Spatial Patterns of Water (before 1998)

The spatial patterns of the pre-urban Lingang were dominated by a river and channel network and a large tract of native salt marsh bordering the East China Sea (Figure 4a). There were small fish ponds scattered on or off the water grid in West Lingang. Large low-lying ponds next to the salt marshlands were dominated in East Lingang, which was one of the most ecologically sensitive habitats for wildlife and wild birds along the coastline [18]. The water grid coupled with scattered ponds covered 12.4% of the 200 km2 terrestrial land before development. The low elevation, relatively flat topography, and coastal location of East Lingang made it vulnerable to seasonal floods resulting from the cumulative impacts of rainfall excess and seasonal typhoons in summer months [54].

3.1.2. Spatial Patterns Made in the Lingang Urban Master Planning and Hydrological Planning Technical Report (1998–2004)

Since 1998, the spatial patterns of water at Lingang have been transformed drastically. Following the Concept Master Plan 1998, a man-made circular shaped Dishui Lake (literally ‘Waterdrop Lake’) of 530 hectares was suggested to be built as the center of the proposed urban area at East Lingang. In May 2002, the local city council decided to start the groundwork for this new lake to speed up the development process. In 2003, Dishui Lake, 3.5 m in depth and 2500 m in diameter, was created in the middle of the salt marsh. In the same year, an international competition for the conceptual master plan was completed. The winning plan, inspired by Howard’s ‘Garden City’ model [55], was dominated by a strong concentric and radial urban form organized around the already striking circular shaped Dishui Lake in the center [32]. The local government approved the master plan, but its ecological implications (i.e., ES provision) remained unclear. At West Lingang, the spatial pattern of the pre-urban water grid remained to establish a double grids model. However, the overall water coverage decreased from the original 12.4% to 8% [18,56].
Hydrological infrastructures were prepared by the Hydrological Planning in April 2004 to serve the new town. The spatial pattern of the water network was modified by water engineers who calculated the design storm and proposed the flood control infrastructure [18]. Consequently, the water coverage increased to 11% [32].

3.1.3. Master Plan Amendments (from 2006)

Responding to the concerns about the water quality of Dishui Lake addressed by local scholars, several studies and amendments were organized by the Lingang Administrative Committee after 2006. These studies included: (1) water flow input-output studies, aiming to accelerate water circulation in Dishui Lake prepared by the Nanhui Water Authority and local universities [18,57,58], and (2) on-site treatment experiments through bioreactors to improve water quality (through on-site observations in June 2009). In addition, since the significance of wild bird habitats along the coastline was acknowledged, the native marshlands were reserved as an ecological park.

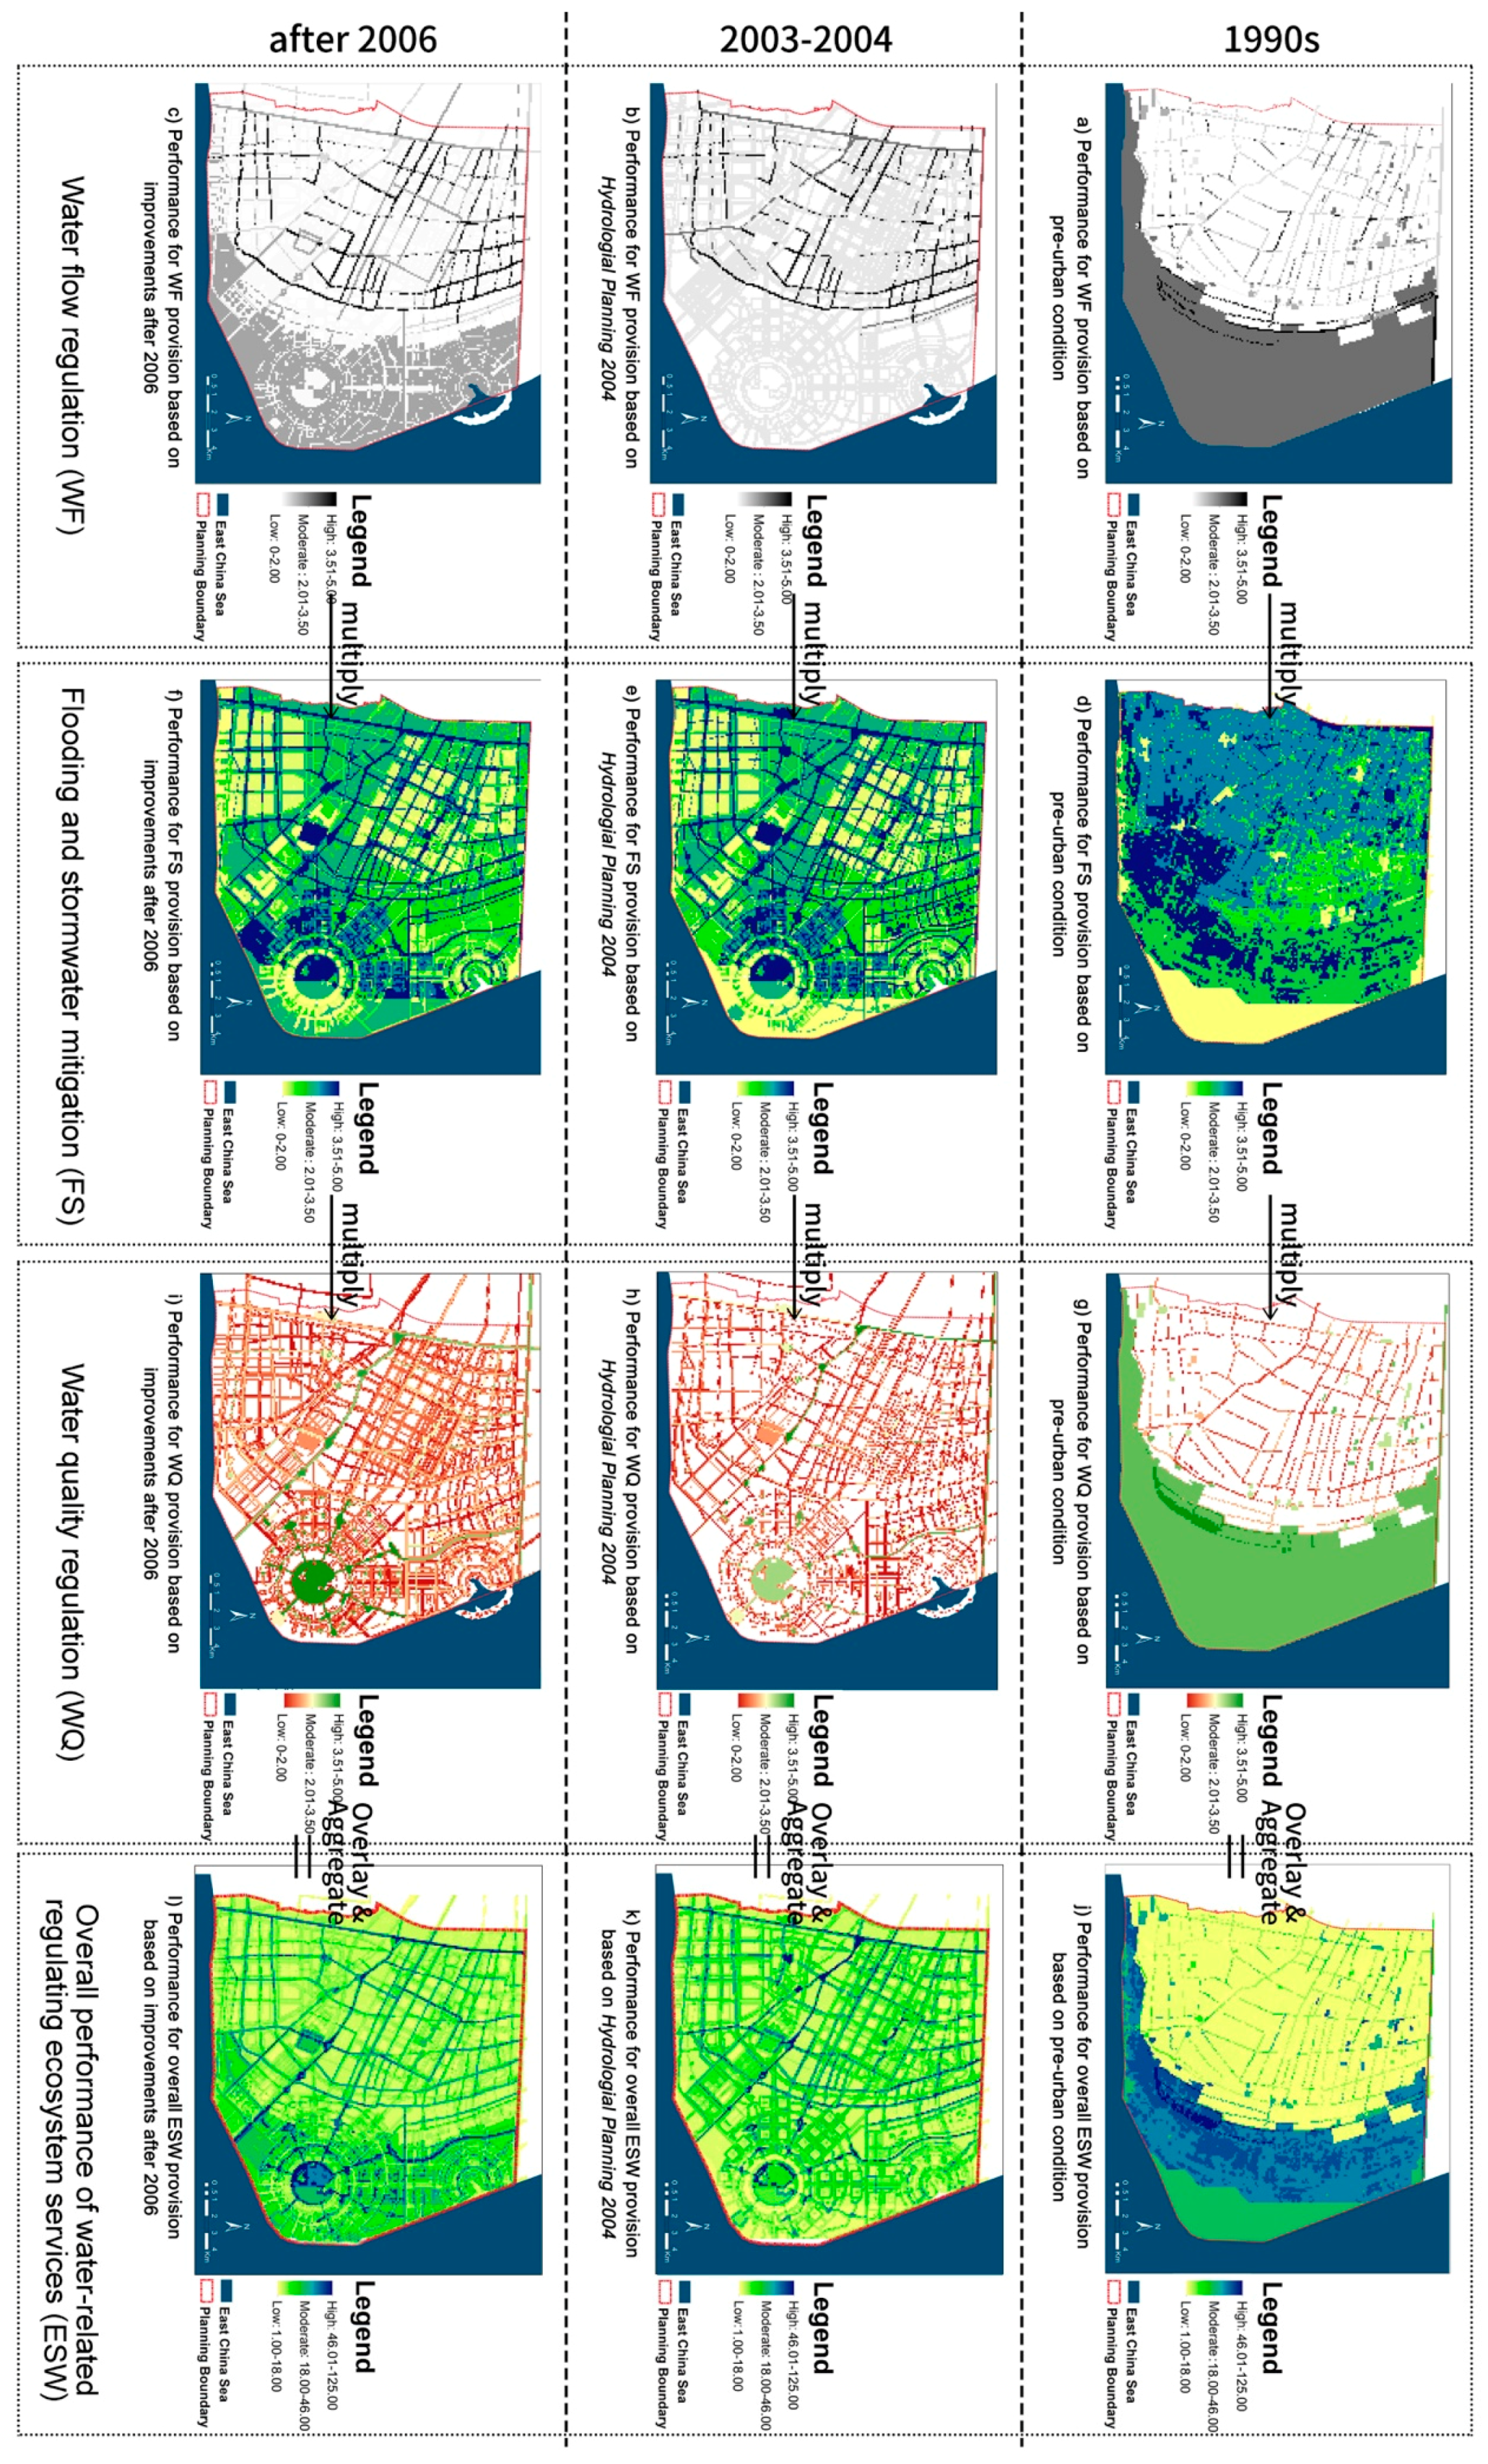
3.2. Evaluating the Impacts of Changing Water-Related Spatial Patterns on Regulating Water-Related Ecosystem Service (ESw) Performances

Using the aforementioned evaluation method of regulating ESw, different performances of WF, FS, and WQ and their overlapping results of ESW between pre-urban and post-urban Lingang were measured. The performance of the post-urban Lingang was measured primarily based on the spatial patterns of water proposed in the Hydrological Planning. Figure 5a–l depicts the spatial patterns of different performances for WF, FS, WQ, and ESW, supported by the line graph in Figure 6. As for WF, FS, and WQ, a value range from 0 to 2 was considered a lower performance, a range from 2.01 to 3.5 was considered a medium performance, and the range from 3.51 to 5 was considered a higher performance. Regarding ESW, the value range from 1 to 18 was considered as a lower overall performance, the range from 18.01 to 46 was considered medium, and the range from 46.01 to 125 was considered a higher performance. The evaluation results of WF, FS, WQ, and overall ESW are compared and discussed below.

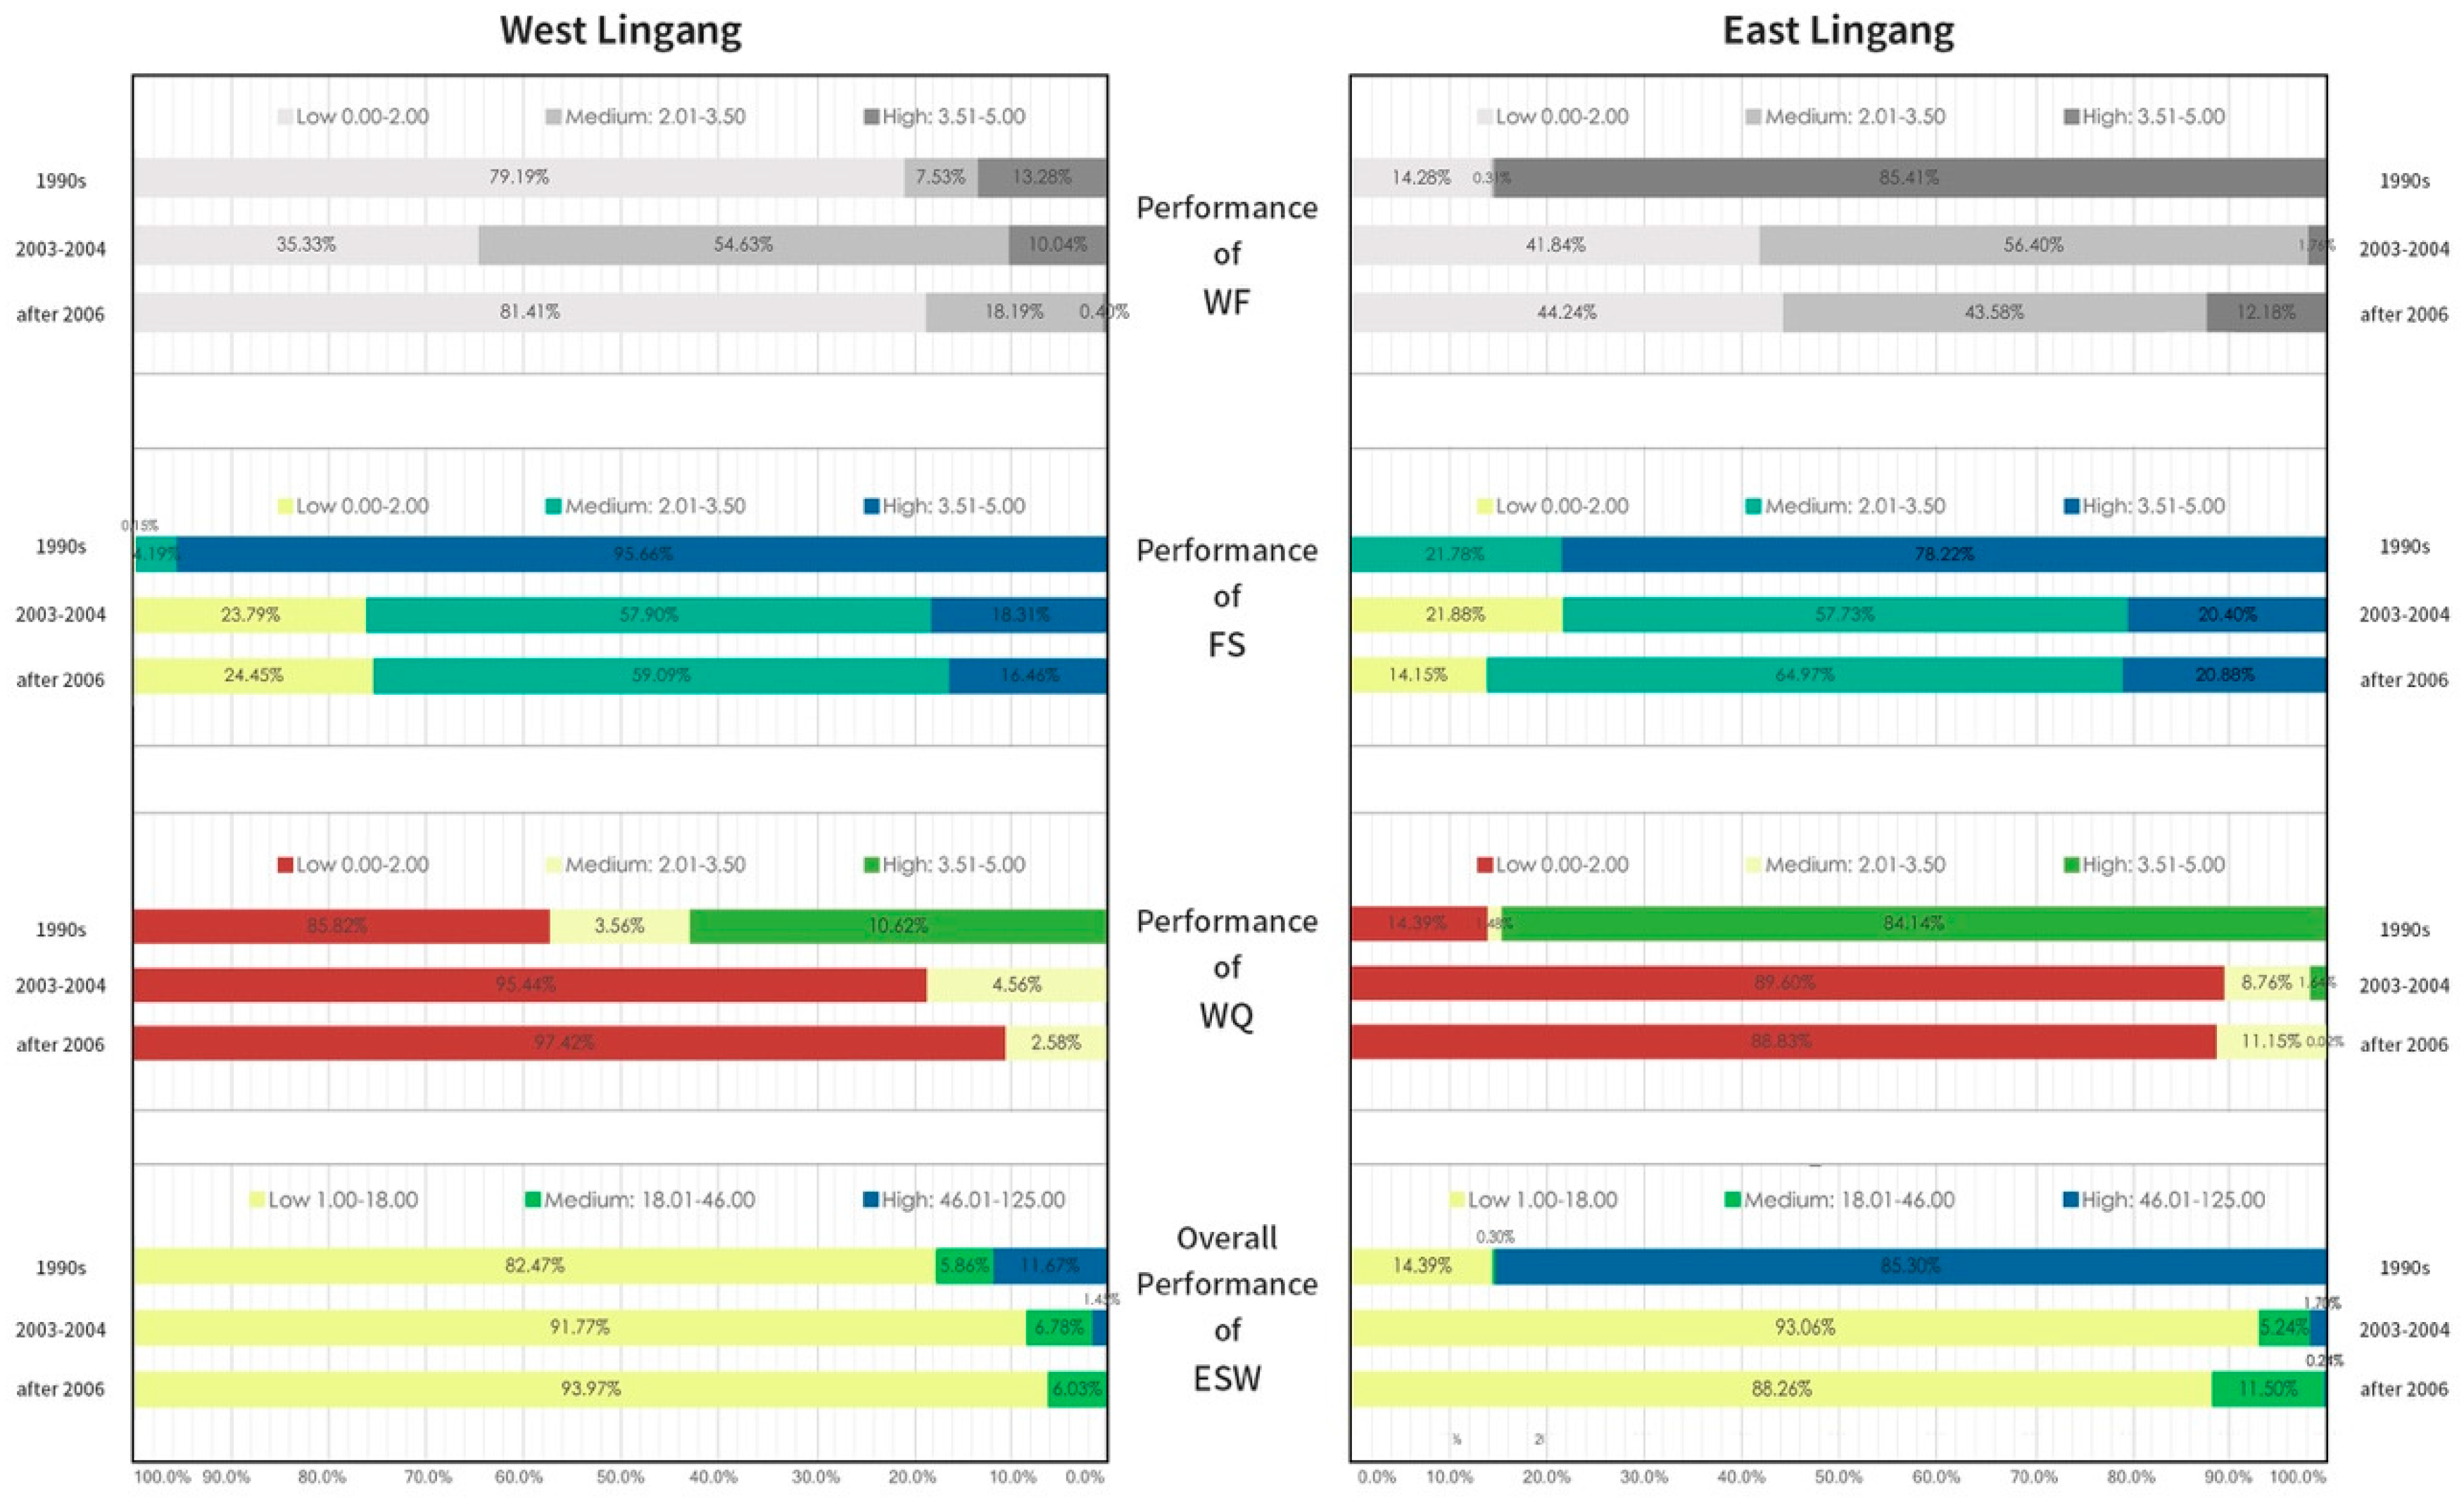
3.2.1. Different Performances of Water Flow Regulation

The performance of WF provision was measured through overlaying three indicators of Sr, Ee, and Vr1. As illustrated in Figure 5a–c, the study areas at East Lingang showed particularly remarkable changes in this measure, with 85.41% of the pre-urban areas having the higher value but dropped to 1.76% at post-urban time (Figure 6). It was likely caused by the creation of ‘waterdrop and water ripples’ and ‘lakeside model’ of the newly built water system, which ignored the conservation of native marshlands. Consequently, 56.40% of post-urban East Lingang had a moderate performance of WF. By contrast, at West Lingang, the lower value decreased from 79.19% to 35.33% between pre-urban and post-urban times, primarily because the major rivers in the northern precinct were well-conserved and supported with sufficient vegetated riparian buffers.

3.2.2. Different Performances of Flooding and Stormwater Mitigation

The performance of FS was measured by overlaying three indicators of Te, Cr, and Sd. As illustrated in Figure 5d–f, the overlay results provided a significant reduction in FS performance from pre-urban to post-urban Lingang. At East Lingang, the higher performance of FS showed a decline from 78.22% to 20.40% (Figure 6), partly because the pre-urban native marshlands were planned to be converted into built-up areas. The indicator of Te was a major component in determining the performance of FS in the eastern part of Lingang where most sites were flat and low-lying. Intensive urban development should have been minimized at East Lingang because it is a floodplain; however, there was no evidence that this had been considered in the planning proposals from 2003 to 2004. Figure 5e illustrates that some basins or ponds in residential communities at East Lingang (deep blue) likely performed better because of its role as a biorention basin in detaining the design storm and smoothing peak flows. From 2006 onwards, there was consideration given to conserving marshlands as wild bird habitats along the eastern coastline (Figure 5f). This resulted in a slight increase of medium performance of FS from 57.73% in 2004 to 64.97% after 2006. At West Lingang, there was a remarkable decline of higher performance of FS from 95.66% to 18.31% (Figure 6) between pre-urban and post-urban conditions. Meanwhile, the moderate performance of FS increased to 57.90%, primarily resulting from the loss of pre-urban farmlands and the increasing impermeable surfaces of manufacturing areas. For example, since the previous woodlands were converted into the proposed Logistic Park Precinct, rapidly drained surfaces were built that had a lower performance of FS. Moreover, the major rivers and canals in the spatial pattern of the double grids model were adjacent to roads across the industrial areas and were also vulnerable to floods.

3.2.3. Different Performances of Water Quality Regulation

The performance of WQ provision was measured through overlaying five indicators of Wv, Ef, Vr2, Bp, and Ep, among which Ef and Bp were evaluated based on the input–output studies of water flow [58] and water treatment experiments [30]. As illustrated in Figure 5g–i, the water grid, primarily located at West Lingang, performed poorly in terms of WQ provision, and it was not enhanced by following Hydrological Planning. The spatial pattern of the lakeside model at East Lingang was not significantly enhanced either, but was improved after 2006 to have a higher performance of WQ because of the water quality treatment. 84.14% of the pre-urban East Lingang had a higher performance of WQ because of the filtering function of marshlands (Figure 6). Although drainage and sewage piping systems were established by the Hydrological Planning, the water adjacent to built-up areas and roads performed poorly for WQ in general (89.60% in Figure 6). The indicators of Ef and Bp were found to be major factors in determining the performance of WQ because the accelerated water circulation and introduced biological processes specified in the water improvement design achieved better water quality in Dishui Lake, represented by the target of Grade III-IV (blue in Figure 5i). Furthermore, 85.82% of the pre-urban West Lingang performed poorly on WQ (Figure 6), particularly because the rivers and canals in the double grids model were largely influenced by factories and villages (red in Figure 5g). Despite the fact that its water quality had been already degraded before new town development, there was no evidence water quality improvements, and 95.44% of the post-urban West Lingang performed poorly in WQ.

3.2.4. Different Overall Performances of Water-Related Regulating Ecosystem Services

The maps of WF, FS, and WQ were overlaid in order to measure the overall performance in pre-urban and post-urban Lingang, respectively. The research findings were quite evident based on the composite maps (Figure 5j–l). Firstly, as illustrated in Figure 5j, 82.47% of the pre-urban West Lingang in the spatial pattern of the double grids model had lower performance of ESW provision (Figure 6), while 85.30% of the pre-urban East Lingang performed better because of its marshlands and water basins. Secondly, based on the Hydrological Planning, major rivers in West Lingang were improved to have a moderate to higher performance of overall ESw provision; however, the minor canals across manufacturing areas or adjacent to roads continued to perform poorly (Figure 5k). There was 93.06% of post-urban East Lingang in the spatial pattern of the lakeside model that performed poorly in terms of ESW provision, partly because the low-lying flood-prone areas and native marshlands were converted into built-up areas. Xiyin River that linked Dazhi River with Dishui Lake showed moderate performance because it was supported by constructed wetlands and sufficiently wide riparian vegetation, while other small water basins within the residential communities around Dishui Lake may serve as bioretention areas to mitigate peak flows, thereby leading to good performance. Thirdly, based on the 2006 water improvement design (Figure 5l), the water circulation and underwater biological processes in the waterways around Dishui Lake, East Lingang, were improved by ecologists and water engineers and, therefore, has performed better since 2006. In addition, there was a noticeable conservation of wild bird habitats along the east coastline, contributing to the conservation of floodplains. As a result, the lower capacity of ESW was slightly decreased from 93.06% in 2004 to 88.26%.

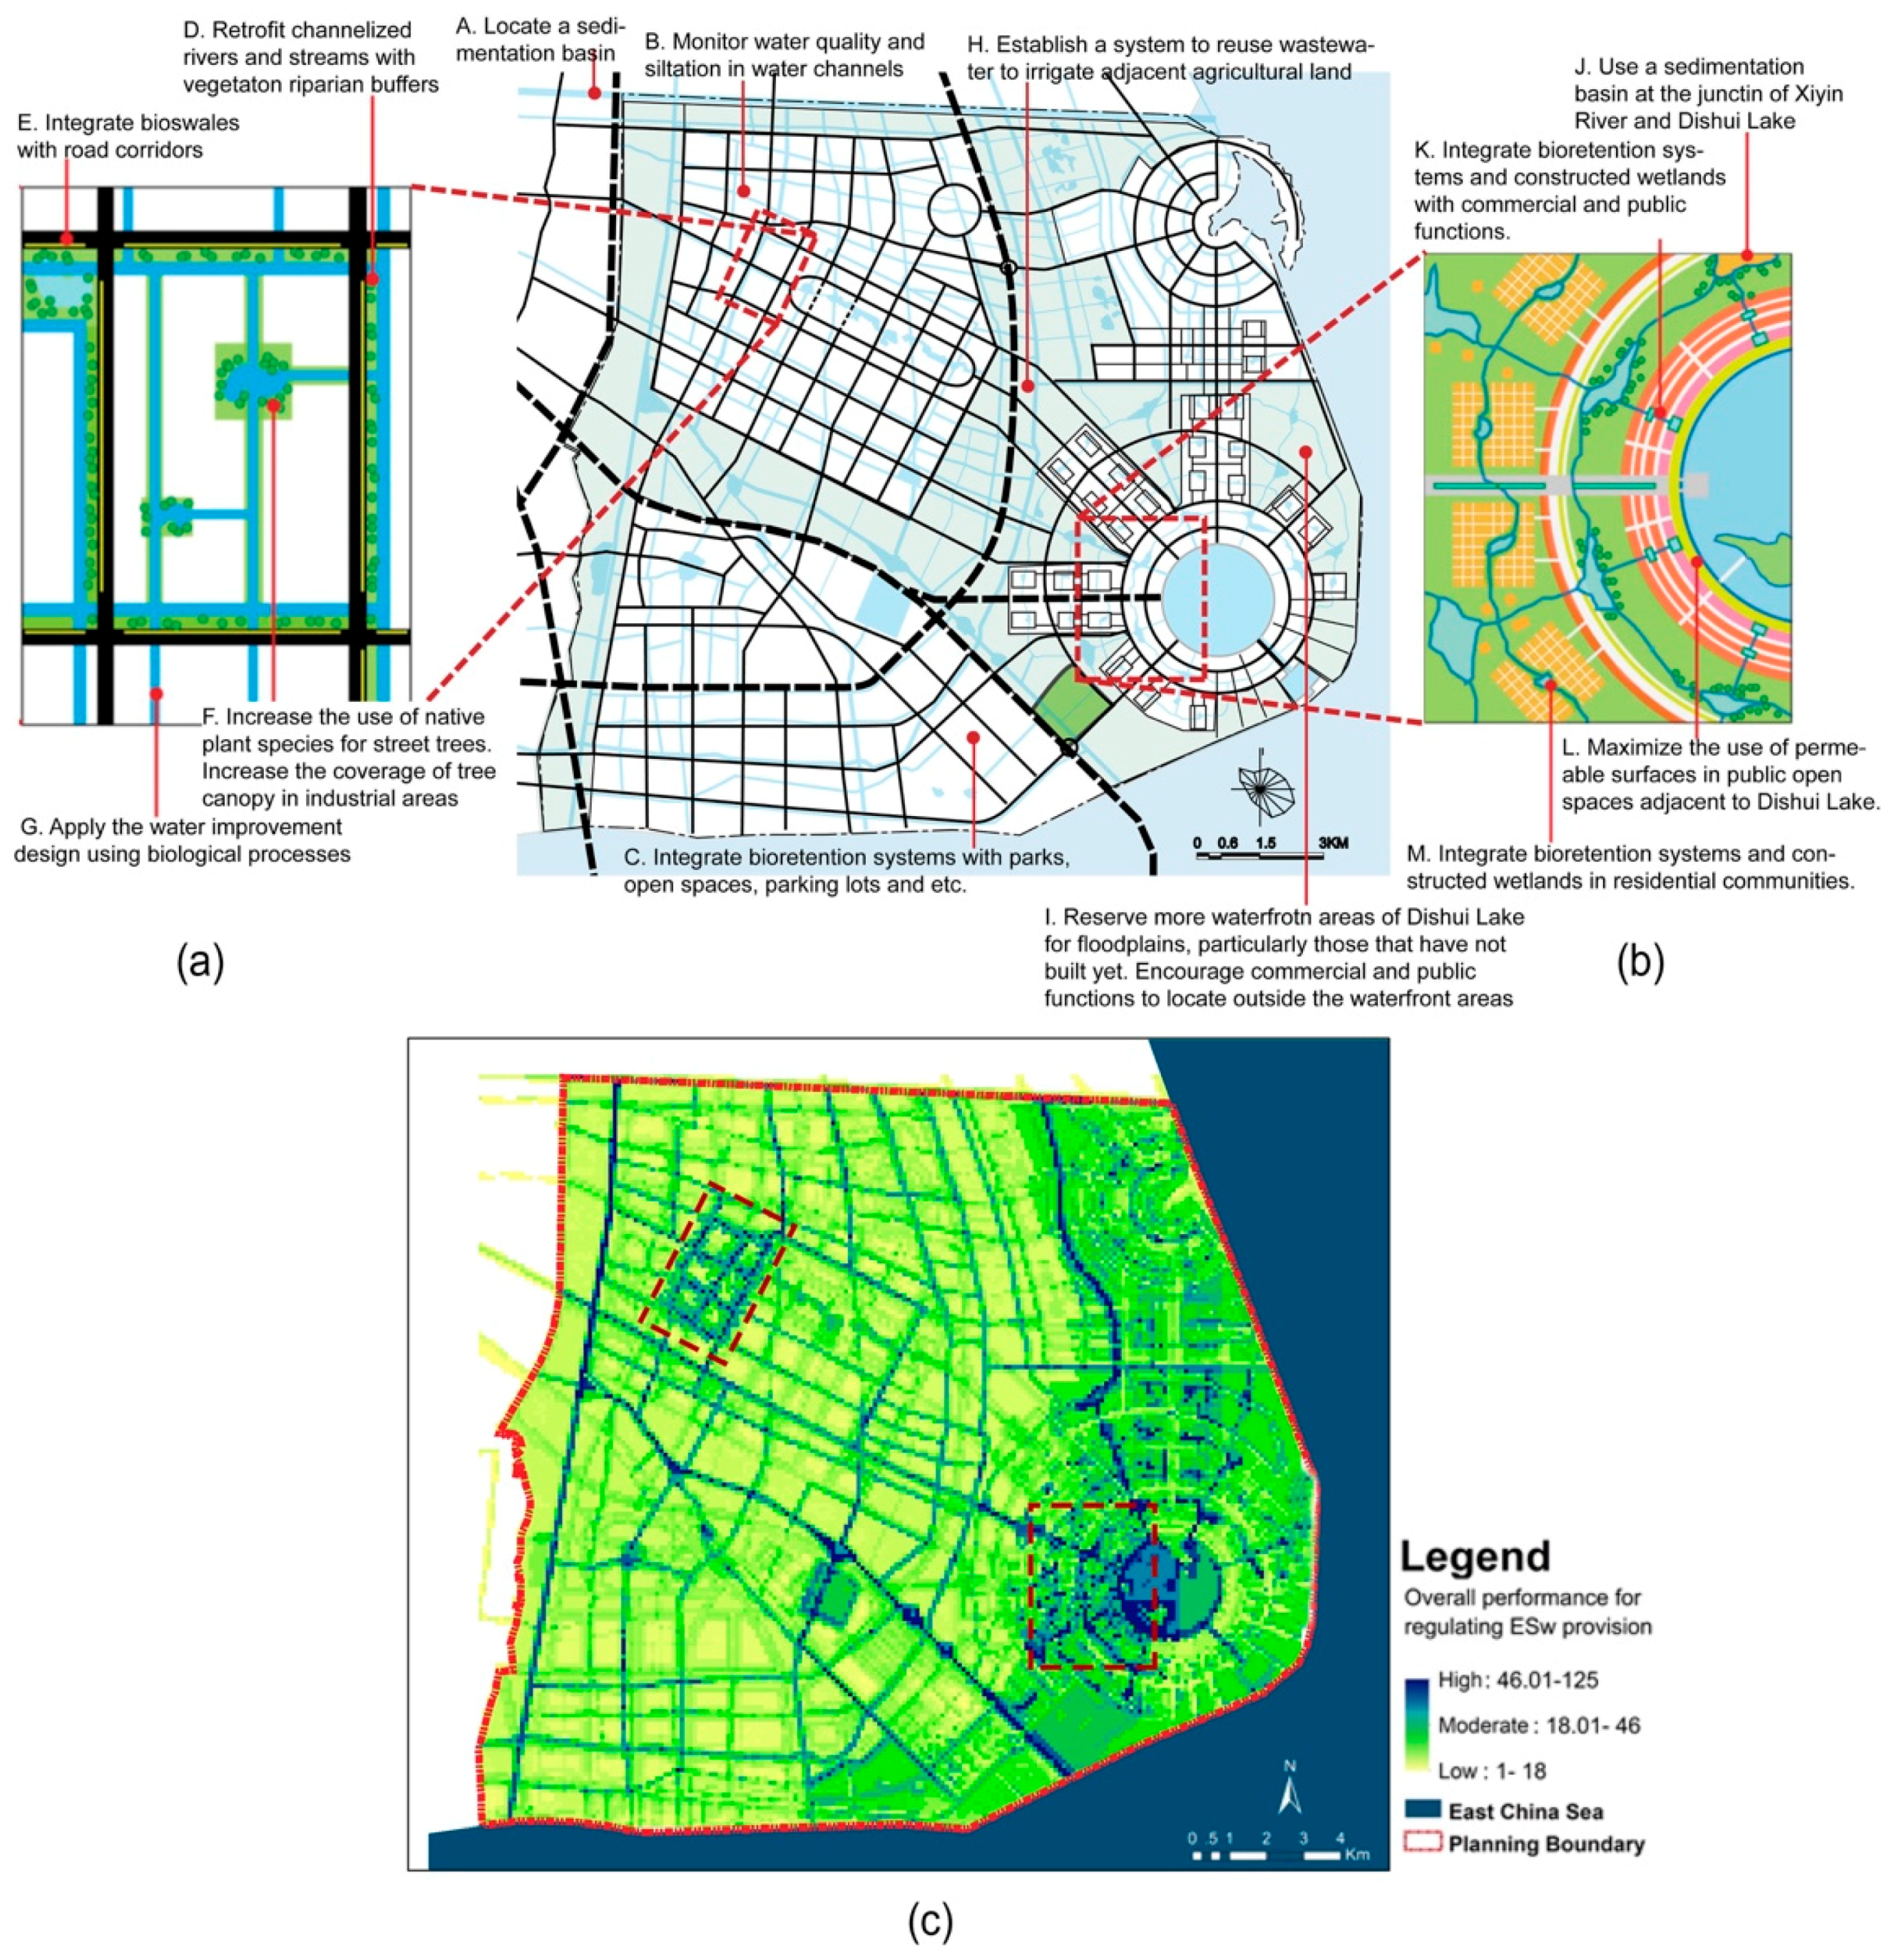
4. Discussion: Urban Design Principles for Effectively Regulating ESw

The concept of ES has become a catchphrase in the international literature, while its delivery in practice falls behind. As criticized by de Groot et al [59], there was a gap between the notion of ES and its coherent and integrated delivery in practice, particularly in the planning and design processes. The aforementioned evaluation results in the case of Lingang are practical for urban design of both large-scale and finer-scale spatial patterns. Here, urban design mainly concerns the planning and design of the built environment [60]. We discuss the following four urban design principles to achieve safer and more sustainable new town developments through effective regulation of ESw.

4.1. Minimizing Changes to Water Coverage and Land Uses in Flood-Prone Areas for Flooding Mitigation

Liao [60] argued that relying solely on flood control infrastructure would make modern cities more vulnerable to flood hazards. In the YRD, minimizing changes to natural water bodies and flood-prone areas should be considered in the first place during a new town development process in order to maintain high performance of FS. The early Lingang Urban Master Plan highlighted the geometric spatial pattern of water, aiming to provide the new town development with unique characters and a different identity. Urban design, however, should respect inherent functions of aquatic ecosystems rather than pursuing visual pleasure and a desire for modernity using engineering approaches [18]. Local professionals and other parties also failed to challenge this idea and to stress the significance of ecosystem-based adaptation. Instead, flood control infrastructure (such as river embankments and coastal defense walls) were built, which have been argued to ‘often produce a false sense of security’ [60,61]. The following Hydrological Planning decided to restore the water coverage to 11% of surface area from 8% based on the calculation of accommodating possible stormy high floods, although the designed water coverage was still lower than the 12.4% in pre-urban Lingang. Furthermore, the aforementioned evaluation results revealed that urban design should incorporate and anticipate the ecological processes of flooding. It means there should be priority in planning and formulating to keep flood-prone areas clear of obstacles to such processes. Rather than being converted into built-up areas, flood-prone land is, from the viewpoint of maximizing FS performance, best utilized for open spaces [60]. Major traffic roads and high-density development can be allocated on ridgelines and high lands, while low density development can be arranged between high lands and the floodplains.

4.2. Conserving Waterway Morphology before Designating Water Conservation Areas

Hydraulic engineering approaches, such as channelization, straightening, simplifying river banks, dredging riverbeds, and narrowing channel width [18], have often been applied in controlling natural water bodies in modern cities. In China, the conservation of waterway morphology is critical to regulating water flow, removing contaminants, and enhancing other ESw’s, particularly those ecological sensitive waterways that act as habitats or corridors for unique species, or small channels with low flow velocity that have difficulty in regulating their water flows. Modern engineering approaches should be minimized. In previous 1990 Chinese planning systems, there was no legislation that prevented water bodies from being destroyed, broken, and dramatically changed. In 2006, the Management Regulation for Urban Blue Line [62] was enacted [18]. This, however, also failed to achieve conservation in practice. In fact, an ‘Urban Blue Line’ (water conservation area) is often drawn after a natural water body has been changed or a new shape of water area has been created. However, from the sake of ES performance, ‘Urban Blue Line’ should be used to designate natural water bodies with high conservation values before any plans and design processes commence.

4.3. Adapting the Double Grids Model through a Finer-Scale Living Filter

Another lesson seen in the case of Lingang is the importance of finer-scale living filters in helping adapt the indigenous double grids model in modern cities. Different from the model in historic cities, most waterways are no longer ‘public’ for transportation. Roads that tend to be built adjacent to water to maximize the land for other functions are busy and wide for vehicles, likely bringing high temperature runoff, oil, dirt, heavy metals, and other toxic chemicals to the water [18]. To maintain the spatial pattern of the double grids model as well as water quality, roads can be upgraded with finer-scale living filters (Figure 7a), for example, bioswales or buffer strips that can detain surface runoff and filter pollutants from pavements. In addition, at the site level such as West Lingang, other detailed improvements should be made (Figure 7a), including the application of water quality improvement design using biological processes, the monitoring of water quality and siltation in water channels, and the usage of decentralized wastewater treatment to protect water from being polluted by domestic, agricultural, and industrial effluents. Instead of building embankments with concrete for neat appearances and flooding prevention, the plant species and the width of vegetation buffer along the water bodies are critical to select. According to the local literature, either native plant species with higher filtering functions (such as Iris pseudacorus, Canna indica Linn., etc.) [63,64] or hardy plants that require little, if any, irrigation, fertilizer, or pesticide, should be suggested. As per the existing knowledge on ecosystem services [18,39,51], a riparian buffer of 30 m is generally recommended as the minimum width to effectively remove chemical residuals and particles, reduce high temperatures of runoff, as well as water-dependent wildlife and birds.

4.4. Integrating the Lakeside Model with Biorention Systems within Developments

Compared to the creation of large man-made water bodies during development that rely on huge costs and intensive maintenance, it is relatively more sustainable and achievable to accommodate a biorention system in the lakeside model in modern cities. Although the lakeside model has been long considered as an ideal form in the YRD because of its easy access to water, this article suggests that the model should be carefully considered through an integrated approach of ecologically sensitive alternatives (Figure 7b). By re-naturalizing the flood-prone areas in the eastern part of Dishui Lake, new aquatic ecosystems associated with open spaces could emerge in order to achieve a high performance in flooding mitigation. Considering the accumulative impacts on water quality, land uses with indirect pollution inputs (such as commercial and industrial) should be encouraged to be located outside waterfront areas. Direct pollution inputs of pipes should be eliminated. If they are proximate to water bodies, their negative impacts must be monitored. This case study also manifested that for a high performance in overall regulation of ESw, stormwater management needs to be integrated with urban design and site-scale landscape design (Figure 7b). This includes maximizing the width of riparian conservation buffers for filtering purposes, establishing constructed wetlands to recycle wastewater and stormwater, locating sedimentation basins in the headwaters to protect important water bodies from upstream pollutants, and reduce excessive sediments. The lakeside model in modern cities can utilize other ecologically sensitive alternatives by integrating plazas, rooftops, and parking lots with bioretention basins. By doing so, an unconnected and long-circuit drainage approach is established, through which surface runoff spreads over pervious areas before being discharged to drainage systems and, accordingly, peak flows of natural water bodies decline.

4.5. Limitations and Caveats

Some limitations in our research should be recognized. Firstly, the theory of ‘design for eco-services’ [1] had not been widely applied in practice during the planning of Lingang. The term ecosystem services might not be explicitly described or expressed in the case of Lingang. Secondly, as the ‘one case embedded design’ [65] used in this article, some research findings from the YRD, one of the most developed metropolises in China, cannot be generalized to other developing cities or towns. Thirdly, the evaluation method proposed in this article was affected by the selection of case and, therefore, had its own limitations in the accessibility of data. It only centered on three regulating ESw’s (WF, FS, and WQ) that are deteriorating but critical to the landscape health of the YRD. Supported by different key indicators, this method can be generalized to other ESw’s or other types of ESs related to vegetation, waste, carbon, and soil. Although this article demonstrated an evaluation method that can qualify different impacts of various spatial patterns of water on the performance of regulating ESw, the indicators identified in this article may differ from case to case. When applying the method in different contexts or at different scales, key ecosystem services and their related indicators need to be reconsidered.

5. Conclusions

Our research aimed to help planners and designers develop a better understanding of regulating ESw in practice by providing ‘relevant, actionable and efficacious’ [66] knowledge. This article had three major conclusions.
Firstly, this article related spatial patterns with ES performance. Since most existing ecological and biological knowledge of ES mapping has focused on non-urban areas, we turned this focus into practical knowledge for new town development. Typically, urban planners and designers are always concerned with the urban designs they create through their design, but not so much with their ecological consequences. This article clarified what and how formal outcomes impact on the performance of regulating ESw. We demonstrated that the two traditional spatial patterns of Jiangnan Shui Xiang, namely the lakeside model and the double grids model, had achieved higher performance for ESw in pre-urban conditions than their contemporary manifestations. Compared with the well-conserved double grids model at West Lingang, the lakeside model centering on the man-made Dishui Lake at East Lingang, influenced by pursuing a mixture of the nostalgia for indigenous form, the approaches of hydraulic engineering, and the desire for modernity, consequently led to lower performance for regulating ESw. The evaluation results informed practical urban design principles for effectively regulating ESw in modern cities, requiring large-scale land uses considerations in conserving water coverage, floodplains, and channel morphology, as well as finer-scale design implications in integrating with living filters and bioretention systems.
Secondly, the GIS-based evaluation method of regulating ESw not only presented qualitative evidence through mapping that identified where ecological problems might be embedded, but also provided semi-quantitative findings that measured how the performance for specific or overall ecosystem services statistically changed. For planning and design professionals during the planning process, this method can be utilized to diagnose what spatial pattern is likely problematic regarding ESw performance. This method can be applied to evaluate both large- and fine-scaled urban forms, effectively supporting the iterative processes of refining and optimizing planning or design schemes. The method can also facilitate effective decision-making for cities. Semi-quantitative maps provide strong evidence to support arguments, while qualitative diagrams are readable and legible to the public. This evaluation method has been tested to be useful in methodological contribution because all indicators were selected with spatial characteristics that practitioners care about and have control of. This method is, therefore, expected to meet the relevance requirements of ecological practical knowledge [63].
The final contribution of this article was contextualization—the process of applying international knowledge on ES mapping to the contemporary Chinese context and showcasing urban design principles for evaluating ES in future new town developments. Although Birkeland argued that low-cost eco-innovation inspired by ES would be also beneficial to developing countries [1], their argument was largely based on generic conditions that were suggested to be applicable to western or developed nations [18]. This article advanced the field by applying the theories of ES to the specific situation of the YRD, operationalizing them in practices for sustainable new towns. The two indigenous forms in the YRD studied in this article contributed to regulating ESw, which can provide insights to international knowledge on ES, particularly in new town developments in deltaic regions.

Author Contributions

Conceptualization, J.W. and S.C.; methodology, J.W. and S.C.; software, J.W. and S.C.; validation, M.W.; formal analysis, J.W.; investigation, J.W.; resources, J.W.; data curation, J.W.; writing—original draft preparation, J.W. and S.C.; writing—review and editing, J.W. and M.W.; visualization, J.W.; supervision, S.C.; project administration, M.W.; funding acquisition, M.W.

Funding

This research was funded by China National R&D Program “Building strong ecological security patterns through elevating green infrastructure’s level of ecosystem services” (No. 2017YFC0505705).

Acknowledgments

Jieqiong Wang would like to express her sincere appreciation to her doctoral supervisor team: Catherin Bull, Alan March, and Siqing Chen. The gratitude also goes to Ming Qiu in CAUP of Tongji University. This study would have been impossible without their help.

Conflicts of Interest

The authors declare no conflict of interest.

References

  1. Birkeland, J. Positive Development: From Vicious Circles to Virtuous Cycles through Built Environment Design; Earthscan: London, UK, 2008. [Google Scholar]
  2. Millennium Ecosystem Assessment. Ecosystems and Human Well-Being: Synthesis; Millennium Ecosystem Assessment Board: Washington, DC, USA, 2005. [Google Scholar]
  3. TEEB. The Economics of Ecosystems and Biodiversity: Ecological and Economic Foundation; Earthscan: London, UK; Washington, DC, USA, 2010. [Google Scholar]
  4. Haase, D.; Larondelle, N.; Andersson, E.; Artmann, M.; Borgström, S.; Breuste, J.; Gomez-Baggethun, E.; Gren, Å.; Hamstead, Z.; Hansen, R.; et al. A quantitative review of urban ecosystem service assessments: Concepts models, and implementation. AMBIO 2014, 43, 413–433. [Google Scholar] [CrossRef] [PubMed]
  5. Xiang, W.-N. Pasteur’s quadrant: An appealing ecophronetic alternative to the prevalent Bohr’s quadrant in ecosystem services research. Landsc. Ecol. 2017, 32, 2241–2247. [Google Scholar] [CrossRef]
  6. Wooddruff, S.C.; BenDor, T.K. Ecosystem services in urban planning: Comparative paradigms and guidelines for high quality plans. Landsc. Urban Plan. 2016, 152, 90–100. [Google Scholar] [CrossRef]
  7. Neuman, M. Regional design: Recovering a great landscape architecture and urban planning tradition. Landsc. Urban Plan. 2000, 47, 115–128. [Google Scholar] [CrossRef]
  8. Colins, S.L.; Capenter, S.R.; Swinton, S.M.; Orenstein, D.E.; Childers, D.L. An integrated conceptual framework for long-term social-ecological research. Front. Ecol. Environ. 2011, 9, 351–357. [Google Scholar] [CrossRef]
  9. Daily, G.C.; Polasky, S.; Goldstein, J. Ecosystem services in decision making: Time to deliver. Front. Ecol. Environ. 2009, 7, 21–28. [Google Scholar] [CrossRef]
  10. Jujnovsky, J.; Ramos, A.; Caro-Borrero, Á.; Mazari-Hiriart, M.; Maass, M.; Almeida-Leñero, L. Water assessment in a peri-urban watershed in Mexico City: A focus on an ecosystem services approach. Ecosyst. Serv. 2017, 24, 91–100. [Google Scholar] [CrossRef]
  11. Seifert-Dähnn, I.; Barkved, L.J.; Interwies, E. Implementation of the ecosystem service concept in water management—Challenges and ways forward. Sustain. Water Qual. Ecol. 2015, 5, 3–8. [Google Scholar] [CrossRef]
  12. Keeler, B.L.; Polasky, S.; Brauman, K.A.; Johnson, K.A.; Finlay, J.C.; O’Neill, A.; Kovacs, K.; Dalzell, B. Linking water quality and well-being for improved assessment and valuation of ecosystem services. Proc. Natl. Acad. Sci. USA 2012, 109, 18619–18624. [Google Scholar] [CrossRef] [PubMed] [Green Version]
  13. Brauman, K.A.; Daily, G.C.; Duarte, T.K.; Mooney, H.A. The Nature and Value of Ecosystem Services: An Overview Highlighting Hydrologic Services. Annu. Rev. Environ. Resour. 2007, 32, 67–98. [Google Scholar] [CrossRef]
  14. Hackbart, V.C.S.; de Lima, G.T.N.P.; dos Santos, R.F. Theory and practice of water ecosystem services valuation: Where are we going? Ecosyst. Serv. 2017, 23, 218–227. [Google Scholar] [CrossRef]
  15. Pinto, R.; de Jonge, V.N.; Neto, J.M.; Domingos, T.; Marques, J.C.; Patrício, J. Towards a DPSIR driven integration of ecological value, water uses and ecosystem services for estuarine systems. Ocean Coast. Manag. 2013, 72, 64–79. [Google Scholar] [CrossRef]
  16. Millennium Ecosystem Assessment. Ecosystems and Human Well-Being: Wetlands and Water Synthesis; Millennium Ecosystem Assessment Board: Washington, DC, USA, 2005; p. 39. [Google Scholar]
  17. Brogna, D.; Vincke, C.; Brostaux, Y.; Soyeurt, H.; Dufrêne, M.; Dendoncker, N. How does forest cover impact water flows and ecosystem services? Insights from “real-life” catchments in Wallonia (Belgium). Ecol. Indic. 2017, 72, 675–685. [Google Scholar] [CrossRef]
  18. Wang, J. Eco-Services for Urban Sustainability in the Yangtze River Delta of China: Strategies for Physical form and Planning. Ph.D. Thesis, The University of Melbourne, Melbourne, Australia, 2012. [Google Scholar]
  19. Wu, L. Beijing Charter. Urban Stud. 1999, 4, 1–4. [Google Scholar]
  20. Yu, K. Art of Survival: Positioning Contemporary Landscape Architecture Design. Archit. J. 2006, 10, 39–43. [Google Scholar]
  21. Yu, K.; Li, D.; Liu, H. Approach of “Reverse Planning” = “Fan Gui Hua” Tu Jing; China Building Industrial Press: Beijing, China, 2005. [Google Scholar]
  22. Chen, W.Y.; Jim, C.Y. Assessment and Valuation of the Ecosystem Services Provided by Urban Forests. In Ecology, Planning, and Management of Urban Forests: International Perspectives; Carreiro, M.M., Song, Y.C., Wu, J., Eds.; Springer: New York, NY, USA, 2008; pp. 53–83. [Google Scholar]
  23. Koschke, L.; Furst, C.; Frank, S.; Makeschin, F. A multi-criteria approach for an integrated land-cover-based assessment of ecosystem services provision to support landscape planning. Ecol. Indic. 2012, 21, 54–66. [Google Scholar] [CrossRef]
  24. Radford, K.G.; James, P. Changes in the value of ecosystem services along a rural–urban gradient: A case study of Greater Manchester, UK. Landsc. Urban Plan. 2013, 109, 117–127. [Google Scholar] [CrossRef]
  25. Troy, A.; Wilson, M. Mapping ecosystem services: Practical challenges and opportunities in linking GIS and value transfer. Ecol. Econ. 2006, 60, 435–449. [Google Scholar] [CrossRef]
  26. Cheng, S.; Grosse, W.; Karrenbrock, F.; Thoennessen, M. Efficiency of constructed wetlands in decontamination of water polluted by heavy metals. Ecol. Eng. 2002, 18, 317–325. [Google Scholar] [CrossRef] [Green Version]
  27. Li, J.; Li, Y.; Qian, B.; Niu, L.; Zhang, W.; Cai, W.; Wu, H.; Wang, P.; Wang, C. Development and validation of a bacteria-based index of biotic integrity for assessing the ecological status of urban rivers: A case study of Qinhuai River basin in Nanjing, China. J. Environ. Manag. 2017, 196, 161–167. [Google Scholar] [CrossRef] [PubMed]
  28. Gu, C.; Hu, L.; Zhang, X.; Wang, X.; Guo, J. Climate change and urbanization in the Yangtze River Delta. Habitat Int. 2011, 35, 544–552. [Google Scholar] [CrossRef]
  29. Gu, C.; Han, S. Climate change and China’s mega urban regions. Front. Archit. Civ. Eng. China 2010, 4, 418–430. [Google Scholar] [CrossRef]
  30. Shanghai Lingang New City Administration Committee (SLNCAC). 2007 Annual Report of Implementation of Shanghai Lingang New City Planning=Shang Hai Shi Lin Gang Xin Cheng Gui Hua Shi Shi Nian Du Bao Gao; SLNCAC: Shanghai, China, 2007. [Google Scholar]
  31. Raven, P.J.; Holmes, N.T.H.; Dawson, F.H.; Fox, P.J.A.; Everard, M.; Fozzard, I.R.; Rouen, K.J. River Habitat Quality—The Physical Character of Rivers and Streams in the UK and Isle of Man; Environment Agency: Bristol, UK, 1998.
  32. Shanghai Hydrological Planning and Design Institute (SHPDI). Lingang New City Hydrological Planning Technical Report = Lin Gang Xin Cheng Shui Wu Zhuan Ye Gui Hua; SHPDI: Shanghai, China, 2004. [Google Scholar]
  33. ASTER (Advanced Spaceborne Thermal Emission and Reflection Radiometer). Global Digital Elevation Map Announcement, GDEM. 2011. Available online: https://gdex.cr.usgs.gov/gdex/ (accessed on 4 April 2019).
  34. Baattrup-Pedersen, A.; Larsen, S.E.; Andersen, D.K.; Jepsen, N.; Nielsen, J.; Rasmussen, J.J. Headwater streams in the EU Water Framework Directive: Evidence-based decision support to select streams for river basin management plans. Sci. Total Environ. 2018, 613–614, 1048–1054. [Google Scholar] [CrossRef] [PubMed]
  35. Ghosh, K. Planform Pattern of the Lower Teesta River After the Gazaldoba Barrage. Indian J. Geogr. Environ. 2014, 13, 127–137. [Google Scholar]
  36. Keller, E.A. The Fluvial System: Selected Observations. In Riparian Forests in Californis: Their Ecology and Conservation; SANDS, A., Ed.; Agriculture Sciences Publications: Berkeley, CA, USA, 1980. [Google Scholar]
  37. Gurnell, A.; Shuker, L.; Wharton, G. Urban River Survey Manual. 2016. Available online: http://urbanriversurvey.org/wp-content/uploads/2016/08/URS-Manual-2016.pdf (accessed on 20 February 2019).
  38. Alemu, T.; Bahrndorff, S.; Alemayehu, E.; Ambelu, A. Agricultural sediment reduction using natural herbaceous buffer strips: A case study of the east African highland. Water Environ. J. 2017, 31, 522–527. [Google Scholar] [CrossRef]
  39. Large, A.R.G.; Petts, G.E. Rehabilitation of river margins. In The Rivers Handbook: Hydrological and Ecological Principles; Wiley-Blackwell: Oxford, UK, 1994; pp. 401–418. [Google Scholar]
  40. Spirn, A.W. The Granite Garden: Urban Nature and Human Design; Basic Books: New York, NY, USA, 1984; pp. 138, 144–145. [Google Scholar]
  41. Ministry of Construction. Standard for Flood Prevention = Fang Hong Biao Zhun; GB50201-94; Ministry of Hydrology: Beijing, China, 1995.
  42. Marsh, W.M. Landscape Planning: Environmental Applications; John Wiley & Sons Inc.: Hoboken, NJ, USA, 2005; pp. 149–150. [Google Scholar]
  43. Pandit, A.; Gopalakrishnan, G. Estimation of annual storm runoff coefficients by continuous simulation. J. Irrig. Drain. Eng. 1996, 122, 211–220. [Google Scholar] [CrossRef]
  44. Soil Conservation Service. SCS National Engineering Handbook; US Department of Agriculture: Washington, DC, USA, 1972.
  45. Jiang, Y.; Zevenbergen, C.; Ma, Y. Urban pluvial flooding and stormwater management: A contemporary review of China’s challenges and “sponge cities” strategy. Environ. Sci. Policy 2018, 80, 132–143. [Google Scholar] [CrossRef]
  46. Birgani, Y.T.; Yazdandoost, F. An Integrated Framework to Evaluate Resilient-Sustainable Urban Drainage Management Plans Using a Combined-adaptive MCDM Technique. Water Resour. Manag. 2018, 32, 2817–2835. [Google Scholar] [CrossRef]
  47. Hough, M. City Form and Natural Process: Towards a New Urban Vernacular; Croom Helm: London, UK, 1984; pp. 67–69. [Google Scholar]
  48. Macura, V.; Stefunkova, Z.; Skrinar, A. Determination of the Effect of Water Depth and Flow Velocity on the Quality of an In-Stream Habitat in Terms of Climate Change. Adv. Meteorol. 2016. [Google Scholar] [CrossRef]
  49. Wright, R.M.; Mcdonnell, A.J. In-stream deoxygenation rate prediction. J. Environ. Eng. Div. 1979, 105, 323–335. [Google Scholar]
  50. Prominski, M.; Stokman, A.; Stimberg, D.; Voermanek, H.; Zeller, S. River Space Design: Planning Strategies, Methods and Projects for Urban Rivers; Walter de Gruyter: Berlin, Germany, 2012. [Google Scholar]
  51. Syversen, N. Effect and design of buffer zones in the Nordic climate: The influence of width, amount of surface runoff, seasonal variation and vegetation type on retention efficiency for nutrient and particle runoff. Ecol. Eng. 2005, 24, 483–490. [Google Scholar] [CrossRef]
  52. Berggren, M.; Klaus, M.; Selvam, B.P.; Ström, L.; Laudon, H.; Jansson, M.; Karlsson, J. Quality transformation of dissolved organic carbon during water transit through lakes: Contrasting controls by photochemical and biological processes. Biogeosciences 2018, 15, 457–470. [Google Scholar] [CrossRef]
  53. Walsh, C.J.; Roy, A.H.; Feminella, J.W.; Cottingham, P.D.; Groffman, P.M.; Morgan, R.P. The urban stream syndrome: Current knowledge and the search for a cure. J. N. Am. Benthol. Soc. 2005, 24, 706–723. [Google Scholar] [CrossRef]
  54. Shanghai Lingang New City Administration Committee (SLNCAC). 2009 Annual Report of Implementation of Shanghai Lingang New City Planning=2009 Shang Hai Shi Lin Gang Xin Cheng Gui Hua Shi Shi Nian Du Bao Gao; SLNCAC: Shanghai, China, 2009. [Google Scholar]
  55. Howard, E. Garden Cities of To-Morrow; S. Sonnenschein & Co., Ltd.: London, UK, 1902. [Google Scholar]
  56. Shanghai Urban Planning and Design Research Institute (SUPDRI). Lingang New City Master Planning Technical Reports Presentation = Lin Gang Xin Cheng Zong Ti Gui Hua Zhuan Ye Xi Tong Hui Bao; SUPDRI: Shanghai, China, 2003. [Google Scholar]
  57. Gao, W.A. Preliminary Demonstration of Introducing Water into “Luchao Lake” of Hai Gang New City=Hai Gang New City Lu Chao Hu Yin Shui Fang An Chu Bu Lun Zheng. Shanghai Water. 2007, 4, 47–49. [Google Scholar]
  58. Yin, H.L.; Xu, Z.X.; Wei, Z.; Chen, Y.X. Study on water transfer scheme of Dishui Lake water system in Lingang New City = Shang Hai Lin Gang Xin Cheng Di Shui Hu Shui Xi Shui Li Diao Du Mo Shi. In Proceedings of the 21st National Hydraulics Forum and the 8th National Hydraulics Academic Conference, Jinan, China, 22–27 August 2008. [Google Scholar]
  59. de Groot, R.; Alkemade, R.; Braat, L.; Hein, L.; Willemen, L. Challenges in integrating the concept of ecosystem services and values in landscape planning, management and decision making. Ecol. Complex. 2010, 7, 260–272. [Google Scholar] [CrossRef]
  60. Liao, K.-H.; Le, T.A.; Nguyen, K.V. Urban design principles for flood resilience: Learning from the ecological wisdom of living with floods in the Vietnamese Mekong Delta. Landsc. Urban Plan. 2016, 155, 69–78. [Google Scholar] [CrossRef]
  61. Pielke, R.A. Nine fallacies of floods. Clim. Chang. 1999, 42, 413–438. [Google Scholar] [CrossRef]
  62. Ministry of Construction. Management Regulation for Urban Blue Line = Cheng Shi Lan Xian Guan Li Ban Fa; Ministry of Construction: Beijing, China, 2006.
  63. Wu, J.; Cui, N.; Cheng, S. Effects of sediment anoxia on growth and root respiratory metabolism of Iris pseudacorus: Implications for vegetation restoration of eutrophic waters in China. Ecol. Eng. 2013, 53, 194–199. [Google Scholar] [CrossRef]
  64. Xiao, H.; Cheng, S.; Wu, Z. Microbial community variation in phytoremediation of triazophos by Canna indica Linn. in a hydroponic system. J. Environ. Sci. 2010, 22, 1225–1231. [Google Scholar] [CrossRef] [Green Version]
  65. Yin, R.K. Case Study Research: Design and Methods; Sage Publications: Thousand Oaks, CA, USA, 1994; p. 40. [Google Scholar]
  66. Xiang, W.-N. Ecophronesis: The ecological practical wisdom for and from ecological practice. Landsc. Urban Plan. 2016, 155, 53–60. [Google Scholar] [CrossRef]
Figure 1. Locations of (a) the Yangtze River Delta (YRD) and (b) Lingang New City.
Sustainability 11 02010 g001
Figure 2. Two indigenous spatial patterns of water in the YRD, including (a) the double grids model and (b) the lakeside model.
Sustainability 11 02010 g002
Figure 3. Three phases in the development timeline related to water at Lingang New City.
Sustainability 11 02010 g003
Figure 4. Water-related spatial patterns of (a) pre-urban and (b) Hydrological Planning and other master plan amendments from 2006.
Sustainability 11 02010 g004
Figure 5. Evaluation results of the impacts of changed spatial patterns on the performance of regulating ESw, including (a) performance for WF provision based on pre-urban condition; (b) performance for WF provision based on Hydrological Planning 2004; (c) performance for WF provision based on improvements after 2006; (d) performance for FS provision based on pre-urban condition; (e) performance for FS provision based on Hydrological Planning 2004; (f) performance for FS provision based on improvements after 2006; (g) performance for WQ provision based on pre-urban condition; (h) performance for WQ provision based on Hydrological Planning 2004; (i) performance for WQ provision based on improvements after 2006; (j) performance for overall ESW provision based on pre-urban condition; (k) performance for overall ESW provision based on Hydrological Planning 2004; and (l) performance for overall ESW provision based on improvements after 2006.
Sustainability 11 02010 g005
Figure 6. Line graph of different performances of WF, FS, WQ, and overall ESw provision.
Sustainability 11 02010 g006
Figure 7. Integration in regulating ESw and the evaluation results based on improvements. As illustrated in Figure 7a,b, the above urban design principles are applied in Lingang to demonstrate the possibility of integrating water-related spatial patterns with regulating ESw provision for urban sustainability. Consequently, the overall performance for ESw at Lingang can be increased (Figure 7c). (a) Improvements to West Lingang; (b) Improvements to East Lingang; and (c) Improved performance of regulating ESw based on proposed urban design principles.
Sustainability 11 02010 g007
Table 1. Key indicators and their scores in regulating water-related ecosystem service (ESw) evaluation based on peer-reviewed publications.
Types of ESwNo.Key IndicatorsQuantification/Definition Based on Peer-Reviewed PublicationsUrban or Finer ScaleConditionsScoring (1–5)
Ecosystem services of water flow regulation (WF)1.1Sinuosity ratio (Sr)the ratio of a channel length and the valley length (%) [18,34,35]at urban scaleSr = 1.05
1.0 < Sr ≤ 1.53
Sr > 1.51
1.2Extent of engineering intervention (Ee)the percentage of engineered water body, derived from a combination of the predominant planform, cross profile, and level of reinforcement of the water body (%) [37]at finer scale0 ≤ Ee < 30%5
30% ≤ Ee ≤ 70%3
70% < Ee ≤ 100%1
1.3Vegetated riparian buffer width (Vr1)the mean width of vegetated riparian buffer along the water (m) [18,21,39]at finer scaleVr ≥ 80 m5
30m ≤ Vr < 80 m3
Vr < 30 m1
Ecosystem service of flooding and stormwater regulation (FS)2.1Terrain Elevation (Te)the mean elevation of an area, representing its tolerance to floods (m) [18,32,40]at urban and finer scalesTe > 6 m (not flooded by constant tide)5
4 m < Ta ≤ 6 m (flooded by constant tide, but not flooded by peak flow)3
Ta ≤ 4 m (flooded by peak flow)1
2.2Coefficient of Runoff (Cr)an empirical criterion to predict direct runoff or infiltration caused by rainfall excess, influenced by soil texture and composition, and land cover types [18,42,43,44]at urban scalepark5
woodland (flat)4.5
residential (single family), cultivated (flat)4.0
residential (attached, multifamily)3.5
industrial (light); road, car parking2.5
industrial (heavy)1.5
commercial (shopping center, etc.)1.0
2.3Stormwater drainage approach (Sd)the presence of a sustainable stormwater drainage approach [40,45,46]at finer scalewith more sustainable drainage approaches5
with conventional drainage pipe network3
with drainage channel enlargement, pipe network and intensive pumps1
Ecosystem service of water quality regulation (WQ)3.1Water Volume (Wv)the mean depth of a lake; the size of a cross-sectional area of a water channel (m or m2) [18,47]at urban scalelake’s mean depth ≥ 10 m; or larger cross-sectional area of a water channel5
Lake’s mean depth < 10 m; or medium cross-sectional area of a water channel3
smaller cross-sectional area of a water channel1
3.2Extent of flow velocity improvement (Ef)the extent of improving water circulation using different approaches [18,40,50]at finer scalewith semi-natural intervention to increase dissolved oxygen in water5
with engineering intervention3
none1
3.3Vegetated riparian buffer width (Vr2)the mean width of vegetated riparian buffer along the water (m) [18,21,39,51]at finer scaleVr ≥ 30 m5
10 m ≤ Vr < 30 m3
Vr < 10 m1
3.4Biological processes (Bp)the presence of biological processes in the water [18,47,52]at finer scalewith the input of micro-organism treatment5
with fish input and/or aquatic plants3
none1
3.5Extent of pollution (Ep)the extent of pollution inputs [18,37,53]at urban and finer scalesnone5
influenced by adjacent land uses, including industrial, commercial, roads, etc.3
influenced by pollutant inputs from sewage outfalls, industrial effluent pipes, and surface runoff pipes1

