The Comovement of Exchange Rates and Stock Markets in Central and Eastern Europe

1
Institute for World Economy, Romanian Academy, Bucharest 050711, Romania
2
Finance Department, University of Craiova, Craiova 200585, Romania
*
Author to whom correspondence should be addressed.
Sustainability 2019, 11(14), 3985; https://doi.org/10.3390/su11143985
Submission received: 19 June 2019
/
Revised: 19 July 2019
/
Accepted: 21 July 2019
/
Published: 23 July 2019
(This article belongs to the Special Issue Sustainable Financial Markets)
Abstract
:This paper analyses the link between exchange rates and stock markets in four Central and Eastern European countries. We simultaneously explore the comovements of foreign exchange markets and stock markets at the cross-country level and the link between these two markets within each country while employing a Dynamic Conditional Correlation Mixed Data Sampling (DCC-MIDAS) model. Such an approach to financial markets conveys a much more visible picture of the existing patterns of financial integration between these markets that would otherwise be neglected. The estimates reveal significant differences between the patterns of correlation in our sample countries. First, the paper finds a quite low degree of convergence between foreign exchange markets, with rising correlations during some of the crisis episodes. Second, both the 2004 European Union enlargement and the European sovereign debt crisis underpin the stock market comovements in the Central and Eastern European countries. Third, the correlations between the exchange rate returns and stock markets rise mostly during the European sovereign debt crisis and to a lesser extent during the global financial crisis, revealing signs of contagion and lower portfolio diversification opportunities. These results are of utmost relevance for the process of financial integration and they also have important implications for policy makers, risk management, and investors.
1. Introduction
In general, exchange rates and stock markets have been some of the most studied areas in finance. Understanding their development patterns and degree of interconnectedness, especially in the light of the last global financial crisis (GFC) and the European sovereign debt crisis (ESDC), has significant relevance for investors and policy makers. Furthermore, the nexus between them has been reviewed in a significant number of studies, but with conflicting results. The flow-oriented model proposes a positive link between the exchange rate and stock market, the portfolio-based model assumes a negative relationship between exchange rate and stock market, while the monetary model indicates a weaker or no link between the two assets [1,2,3]. Appropriate investment strategies could be devised to reduce portfolio risk, based on possible correlations between different markets. Understanding the time-varying nature of these correlations would help decision makers to react timely to financial shocks through adequate policies, especially in the light of the latest crises that have significantly stressed the financial markets. Moreover, given the particularities of Central and Eastern European (CEE) countries in terms of foreign exchange markets and stock markets, the region offers an optimal framework for our analysis.
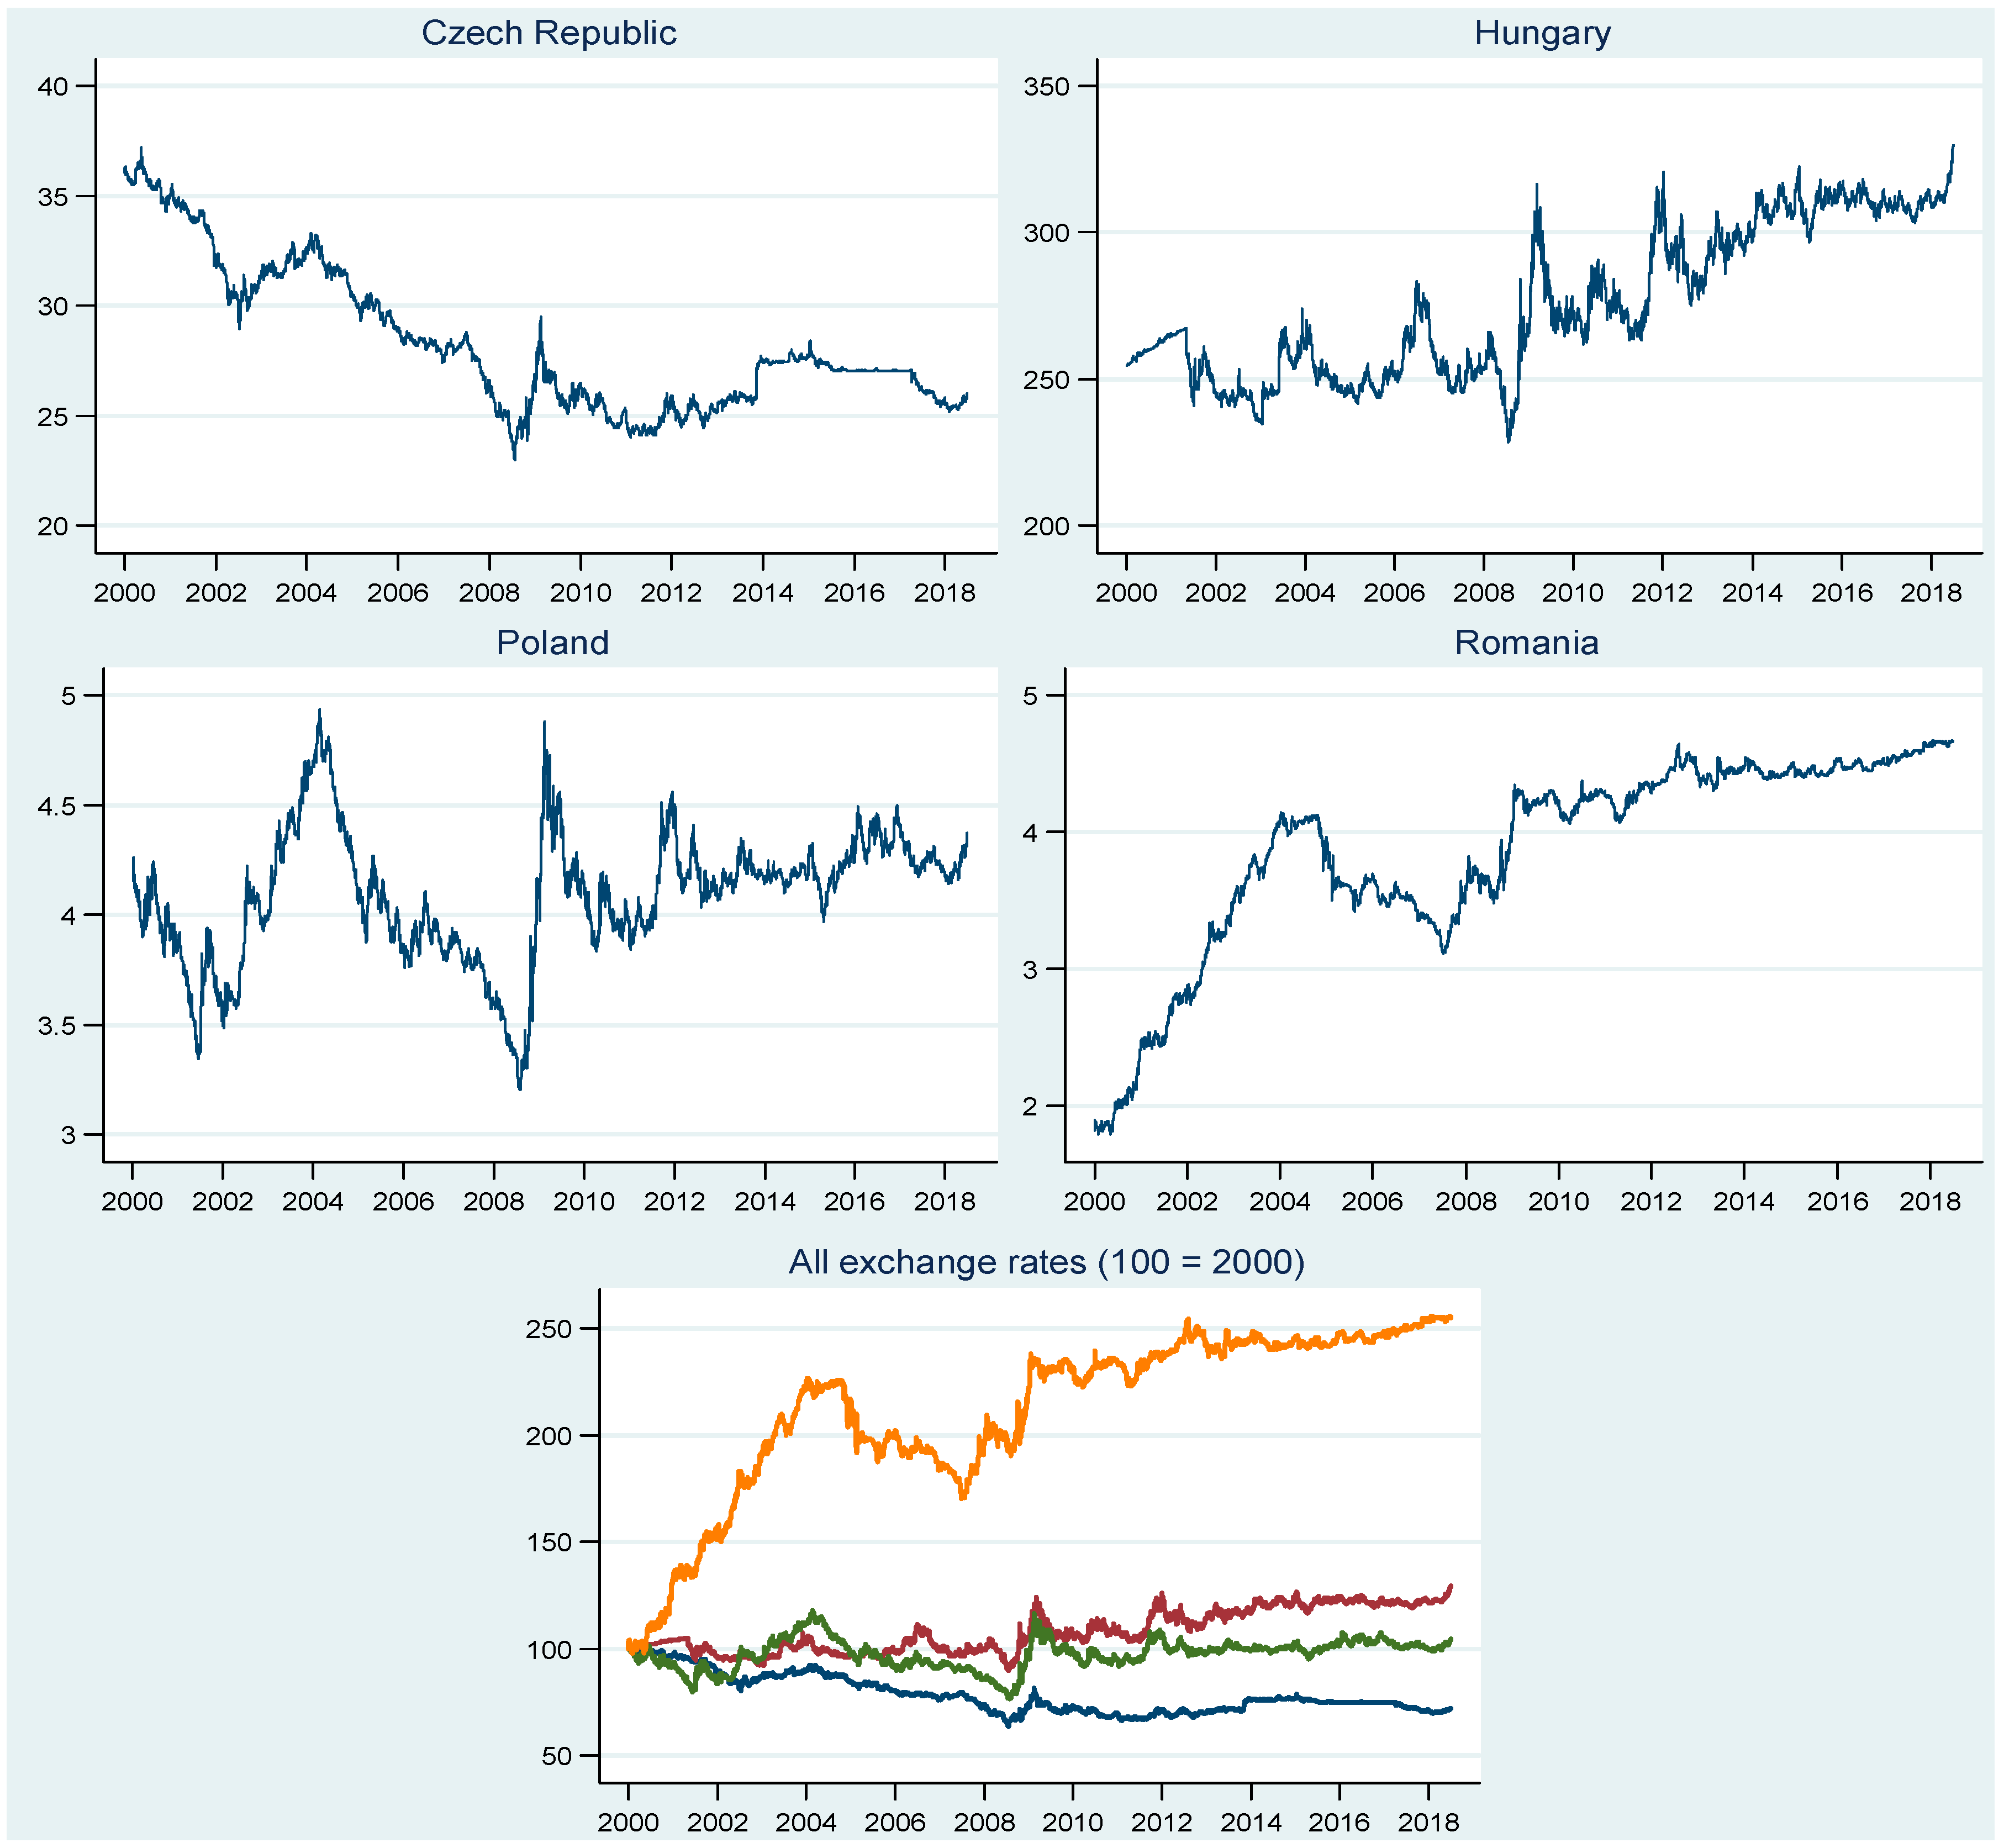
Our sample countries include the Czech Republic, Hungary, Poland, and Romania, regarding the period from 2003 to 2018. The exchange rates in these countries share some similarities, but their evolution is disparate in many ways (see Figure 1). In general, the exchange rate arrangements are similar within the four countries, having the euro as a reference currency. Nevertheless, we notice some peculiarities regarding the exchange rate arrangements and differences in how central banks react to national currency volatility episodes over the sample period. The Czech Republic follows a floating currency regime. However, the central bank may use foreign exchange interventions to damper volatility or to ease/tighten monetary policy [4]. This was the case between 2013 and 2017, when the country maintained a de facto exchange rate anchor to the euro. Within this period, the central bank objective was to maintain a weaker exchange rate and intervened in the foreign market to keep the exchange rate close to 27 Czech koruna/1 euro. In Hungary, the exchange rate is floating freely vis-à-vis the euro since 2008. Until then, Hungary used a pegged exchange rate with horizontal bands, with a ±15.00% intervention band since 2001 [5]. Poland follows a floating exchange rate arrangement. However, the central bank reserves the right to intervene in the foreign exchange market in order to achieve the inflation target if necessary [6]. Over the last decade, and during the GFC and ESDC in particular, Poland’s central bank used foreign exchange interventions. More precisely, in April 2010, from September 2011 to December 2011, and in June 2013, the central bank intervened in order to prevent national currency depreciation [7,8]. Romania has a managed float regime, according to the central bank website [9]. The central bank resorts to foreign exchange market interventions to achieve its inflation target and respond to unforeseen shocks. As can be seen, especially during the latest crises, some of the central banks in the CEE countries have used exchange rates in order to soften the impact of negative shocks.
To better understand the patterns of the CEE countries’ exchange rates, we plot their dynamics in Figure 1. A simple analysis of the graphs emphasizes the presence of three different trends in the sample period, i.e., long-term, medium-term, and short-term trends. These developments might be related both to the global factors and country-specific factors. The long-term trends present distinct patterns in the analysed countries. A depreciation path can be noticed for Hungary and Romania, with a higher magnitude in the case of Romania. In Poland, a stable trend characterizes the evolution of exchange rates, while the exchange rate dynamic exhibits an upswing for the Czech Republic. The medium-term trends reveal how exchange rates respond to international shocks and the internal macroeconomic environment. During the GFC, we observe a pronounced devaluation path for all currencies, while a smoother pattern of depreciation and smaller magnitudes in the return dynamics occur during the ESDC. Before and after the crises, different patterns and stages emerge, depending on the national macroeconomic developments. The Czech Republic exhibits a sharp appreciation trend within the 2000–2008 time span, which is fragmented by an episode of a mild exchange rate decline over the 2002–2004 period. After the GFC, a more stable upward trend emerges, especially within the 2014–2018 time span. In the case of Hungary, we observe a gradual downturn path before and after the GFC. In Poland, three different stages in the return dynamics may be noticed in the pre-crisis period: a sharp rising trend during the 2000–2002 period, followed by a reversed evolution within the 2002–2004 time span, and an accelerated upward episode over the 2004–2008 period. After the GFC, a similar accelerated appreciation episode may be noticed, followed by a downward trend. A more stable path characterizes the return dynamics over the 2012–2018 period. Finally, before the GFC, we observe a sharp downswing during the 2000–2004 period in Romania, followed by an upward trend within the 2004–2008 time span. After the GFC, a mild gradual depreciation trend can be detected. The short-term trends for our sample countries present common patterns, which are characterized by a quite high volatility and numerous ups and downs in the return dynamics.
The CEE post-transition economies have quite similar patterns of stock market development, due to their common past and significant liberalization reforms, including large-scale privatization initiated in the 1989–1990 period. Large capital inflows from Western Europe entered the region and played an important role in its economic development after establishing macroeconomic stability and key market infrastructures. Taking the form of FDI and cross-border bank flows, the level of capital inflows that were related to the region’s GDP overpassed the average for emerging markets [10]. Moreover, increased confidence in the catching-up process with Western Europe has spurred the development of the equity market. European Union (EU) accession has led to a further reduction in barriers to capital flows and widespread foreign ownership. The CEE stock markets remain still relatively underdeveloped and dissimilar in many ways despite an increasing role of stock markets in the course of financial integration. Firstly, the Czech Republic, Hungary, and Poland are classified as emerging stock markets, while Romania is a frontier market, based on the investment opportunity criteria used by the MSCI Market Classification Framework [11]. Secondly, as capital inflows entered the CEE countries following the EU accession, their level of capitalization is quite different, and remains well behind that of the euro area, despite a significant increase in stock market capitalization over the past decade. The highest level is recorded by Poland, accounting for a 33 percent GDP share [12], which is well below the stock market capitalization of the euro area (67.5 percent GDP share). It is followed by Hungary, where the total capitalization of the stock exchange reaches about 22 percent of GDP in 2017, and the Czech Republic, where it amounts to 14 percent of GDP. The Romanian equity market remains considerably underdeveloped, recording only a 9.6 percent GDP share. All of these disparities are likely to have an important impact on the pairwise dynamic correlations between the financial markets of these countries.
Figure 2 plots the dynamics of stock market indices for our sample countries. Similar patterns can be noticed within the 2000–2012 time span. A gradual downward trend is depicted during the 2000–2002 period, with different magnitudes in the return dynamics. Afterwards, a sharp upswing follows during the 2002–2008 period. In the subsequent period, from 2008 to 2009, all the stock market indices plunge as the global financial crises hits the CEE countries. A reversed double V-shape characterizes the evolution of stock market indices during the 2009–2012 period. After 2012, until the end of the sample period, the evolution of the stock market indices in the analysed countries follows different paths. The Czech Republic exhibits a quite stable trend, while we see an upward trend for Hungary and Romania, with a higher magnitude in the case of Hungary. Finally, in respect of Poland, we notice a stable path between the end of 2012 and 2015, followed by a U-shape evolution until the end of 2017. A gradual downward trend characterizes the last part of the sample period.
When considering the dynamics of exchange rates and stock markets, we assume that our comovement analysis will reveal important patterns in the region. Moreover, the financial integration within the EU, the catching-up process, and the forthcoming integration within the euro area are likely to be reflected in the dynamics of both the exchange rates and stock market prices. In this context, studying the links between foreign exchange markets and stock markets is of utmost interest.
The objectives of our paper are manifold. First, we examine the cross-country links between foreign exchange markets and stock markets. Second, we assess the nexus between exchange rates and stock markets within each country. Having these objectives in mind, we will simultaneously address the following correlation pairs: exchange rate-exchange rate, stock-stock, and stock-exchange rate. The first two categories refer to cross-country comovements, while the third is oriented within the distinct country. Such an approach to financial markets is set to make the existing patterns between assets and countries more visible, which would be otherwise neglected. Third, we document the impact of the global financial crisis and the European sovereign debt crisis on comovement pairs.
2. Literature Review
There is wide literature assessing the comovements of different financial assets in view of addressing distinct objectives, like the degree of financial markets interdependence or the volatility spillovers. The literature related to the comovements of foreign exchange markets could be divided into two groups. One important group has its roots in the past financial crisis episodes, when the international finance literature has largely debated whether the level of comovements of currency markets during turmoil periods increased, and to what degree [13,14,15,16,17,18,19,20,21]. The second group of studies focuses on assessing the degree of exchange markets interdependence, i.e., their integration [22,23,24,25,26,27,28,29].
To our knowledge, the issue of exchange rate comovements in the CEE region is not sufficiently studied. Pramor and Tamirisa [30] find that the long-term volatility trends in the CEE currencies and the euro are closely correlated while exploring the degree of convergence between CEE economies and the euro area in the 1997–2005 period, and that spillovers of volatility across regional markets have diminished over time. Babetskaia-Kukharchuk, et al. [31] document a high degree of synchronicity between the currencies of the Czech Republic, Hungary, Poland, and Slovakia, which is in line with the composition of the currency baskets and the share of the euro within these economies’ trade transactions. While using nominal exchange rates of the euro, Czech koruna, Hungarian forint, Polish zloty, Romanian leu, Slovak koruna, and Croatian kuna against the United States (US) dollar for a span time from 2000 to 2008, Stavarek [32] suggests that none of the euro candidates’ currencies achieved a sufficient degree of convergence, even experiencing a decrease in convergence during the recent period. Bubák, et al. [33] explore the dynamics of volatility transmission between Central European currencies and the EUR/USD and find evidence of statistically significant intra-regional volatility spillovers among the CEE foreign exchange markets, which tend to increase in periods that are characterized by market uncertainty. Andrieş, et al. [34] investigate the co-movement of exchange rates in the CEE countries (Czech koruna, Hungarian forint, Lithuanian litas, Latvian lats, Polish zloty, and Romanian leu) against the euro for the 1999–2013 period, which revealed that interactions between them have different characteristics at different timescales, i.e., in the short and medium run the exchange rates are integrated, while the integration is weak in the long run. Kadlčáková and Komárek [35] examine the contagion phenomenon in the foreign exchange markets of three Central European countries (Hungary, the Czech Republic, and Poland) and the euro area, as the occurrence of extreme events taking place in different countries simultaneously. They find significant potential for disequilibrium transmission within the foreign exchange markets of these countries and the euro area.
A plethora of research has emerged on stock markets comovements being stimulated by the globalization of capital markets around the world. The literature is either focused on contagion in stock markets or the degree of market integration, highlighting heterogeneous results depending on the definition of contagion and interdependence, methodology, data sample, or other factors. The first group of literature emphasizes that extreme events generate a high volatility in equity markets comovements and lead to contagion and tail dependence [36,37,38,39,40,41,42,43,44,45,46,47,48]. The second group of studies focuses on the issue of stock market integration [49,50,51,52,53,54].
The studies that document contagion effects and stock market integration patterns among CEE countries are rather scarce. Cappiello, et al. [55] reveal that integration within the new EU countries and with the old EU countries increases over time while studying the integration of seven new EU countries’ stock markets, and that this is mainly due to the three largest markets, i.e., the Czech Republic, Hungary, and Poland. Christiansen and Ranaldo [56] suggest that, after the EU enlargement, the new EU stock markets have become more integrated with the old EU markets and more related to the euro. Their results also suggest that capital markets in the old EU are more integrated than in the new EU. Testing for stock market contagion among CEE economies as compared with some Western European countries, the USA, and Japan, during the latest financial crisis, Lupu and Lupu [57] demonstrated that the correlations become higher towards the end of the sample period, i.e., by the end of 2008. Savva and Aslanidis [58] find the Czech Republic, Poland, and Hungary to be the most interconnected markets in the region. Gjika and Horvath [59] examine time-varying stock market comovements in Central Europe while using daily data from 2001 to 2011, and find strong correlations among stock markets in Central Europe and between Central Europe and the euro area. They reveal that these correlations increased after EU entry and remained almost at the same level during the GFC. Harkmann [60] investigates the possible contagion from West European stock markets to stock markets in Central and Eastern Europe during the crisis years 2008–2012, and finds market correlations increasing between 2002 and 2012, meaning closer financial integration. Additionally, his results suggest some contagion during the GFC and several episodes of contagion during the sovereign debt crisis. Bieńkowski, et al. [61] show Poland, the Czech Republic, and Hungary to be volatility-takers over the period 2005–2013, and also document extremely high volatility spillovers during periods that are characterized by market uncertainty.
There is a large strand of research that explores the comovements of stock markets and foreign exchange markets, with a focus on exploring either the volatility spillovers from one market to another or the degree of their correlation [62,63,64,65,66,67,68,69,70,71,72].
The CEE region is not sufficiently covered. Büttner and Hayo [73] find that the highest correlations in foreign exchange and stock markets exist between Hungary and Poland while exploring the conditional correlations between the financial markets in the Czech Republic, Hungary, and Poland. The effect of shocks on the time-varying correlations is the strongest for foreign exchange and stock markets, which indicated a tendency toward contagion. Ülkü and Demirci [74] study the joint dynamics of stock and foreign exchange markets in Hungary, Poland, the Czech Republic, Romania, Croatia, Turkey, Russia, and Ukraine. They find that a significant portion of the stock market-exchange rate comovement is due to global developed market returns, while the sign of this relationship is driven by the dependence on foreign capital and depth of the local stock market. Islami and Welfens [75] show that there are significant short-term links between the stock market index and the foreign exchange rate for Hungary, Slovenia, and Poland, while both long-term and short-term links exist for Poland. Additionally, their results highlight that the integration of the stock markets in Eastern European countries seems to be rather week, except for the Hungarian stock market. Analysing volatility spillovers and the dynamic relationship between the stock and currency markets in the Czech Republic, Poland, Hungary, and Russia for the period 2001–2011, Lee, et al. [76] find significant dynamic correlation in all of the considered countries.
In our view, the contribution of our paper to the literature is manifold. Firstly, even if there is wide literature assessing the comovements of different financial assets, previous studies are often limited to one category of comovements of financial assets, either to cross-country comovements of a distinct asset or to cross-asset market comovements. We simultaneously study three categories of correlations. Secondly, even if the papers analysing some of the correlation pairs (exchange rate–exchange rate, stock return–stock return, and stock return–exchange rate) are numerous, to our knowledge the literature addressing this subject among CEE countries is rather scarce. Thirdly, we document the time varying correlation in both normal periods and crisis periods, which allows for investigating the differences. Fourthly, when compared to other studies, we employ a Dynamic Conditional Correlation Mixed Data Sampling (DCC-MIDAS) model that enables the extraction of short- and long-term correlation series.
3. Methodology
The time varying dynamic correlations between foreign exchange markets and stock markets will be obtained by using the DCC-MIDAS methodology that Colacito, et al. proposed [77]. This model combines the Dynamic Conditional Correlation (DCC) model of Engle [78], with a component specification of correlation in Engle and Rangel [79] and Engle, et al. [80]. The purpose of this model is to extract two components, one that pertains to short-term fluctuations and the other that pertains to a long-run component. The DCC-MIDAS model is estimated in two steps. First, the conditional variances are estimated by using a univariate GARCH-MIDAS model, where the short-run component is a GARCH component, while the long run component is extracted while using the MIDAS weighting scheme. The second step consists of estimating the DCC-MIDAS parameters and constructing the standardized residuals.
We estimate the GARCH-MIDAS model while using Engle, et al. [80] specifications. We assume that the returns on day period are generated by the following process that has two variance components, a short-run component that is defined by and a long-run component defined by :
where with is the information set available up to day of period and is the number of the trading days in period .
The short-run variance component follows a daily GARCH process:
where and are positive and restricted to and does not change for all days in period .
While the low frequency component is defined as smoothed realized volatility while using MIDAS regression:
where is the number of periods over which we smooth the volatility, while the component is constant over a fixed time span.
Where the realized variances imply daily squared returns, namely:
A long history of is weighted by a beta polynomial with weights and as:
The DCC-MIDAS parameters are estimated while using the methodology of Colacito, et al. [77]. It extends the GARCH-MIDAS model to the multivariate case model, which has dimensional time series data observations. Thus, it is possible to obtain a conditional covariance matrix that is decomposed into conditional variances, which follow a GARCH-MIDAS model, and a conditional correlation matrix, which is time varying. While assuming that is the conditional correlation matrix with the typical element , then the conditional covariance between returns of asset and asset can be expressed as:
where and are the standardized residuals of the previous period, which are obtained from the GARCH-MIDAS model.
The long-run component does not vary at daily frequencies and it is a MIDAS weighted sum of lags of sample correlations matrices :
where are the weights in the beta function (Equation (5)) and is determined by the sample correlation matrix from the observations. The final set of correlations yield in the correlation matrix :
Further, we estimate the DCC-MIDAS parameters by using the quasi-maximum likelihood function, as stated in Engle [78] and Colacito, et al. [77]. In setting the number of lags in the MIDAS equation ( in Equations (3), (5) and (7)), we follow other studies [54,81] and use , which corresponds to a so-called three MIDAS years period. Furthermore, we follow Engle, et al. [79] and fix the weight to one. Additionally, using daily returns we obtain daily DCC for the short-run component and we fix to a quarter, to obtain quarterly DCC-MIDAS.
To conclude, we employ the DCC-MIDAS because it decomposes the dynamic correlation into a short- and a long-run component. Generally, other DCC models only estimate a short-run component for the correlation. Therefore, by solely averaging the high-frequency component, we may obtain a low-frequency component. The DCC-MIDAS model obviates this disadvantage.
4. Data
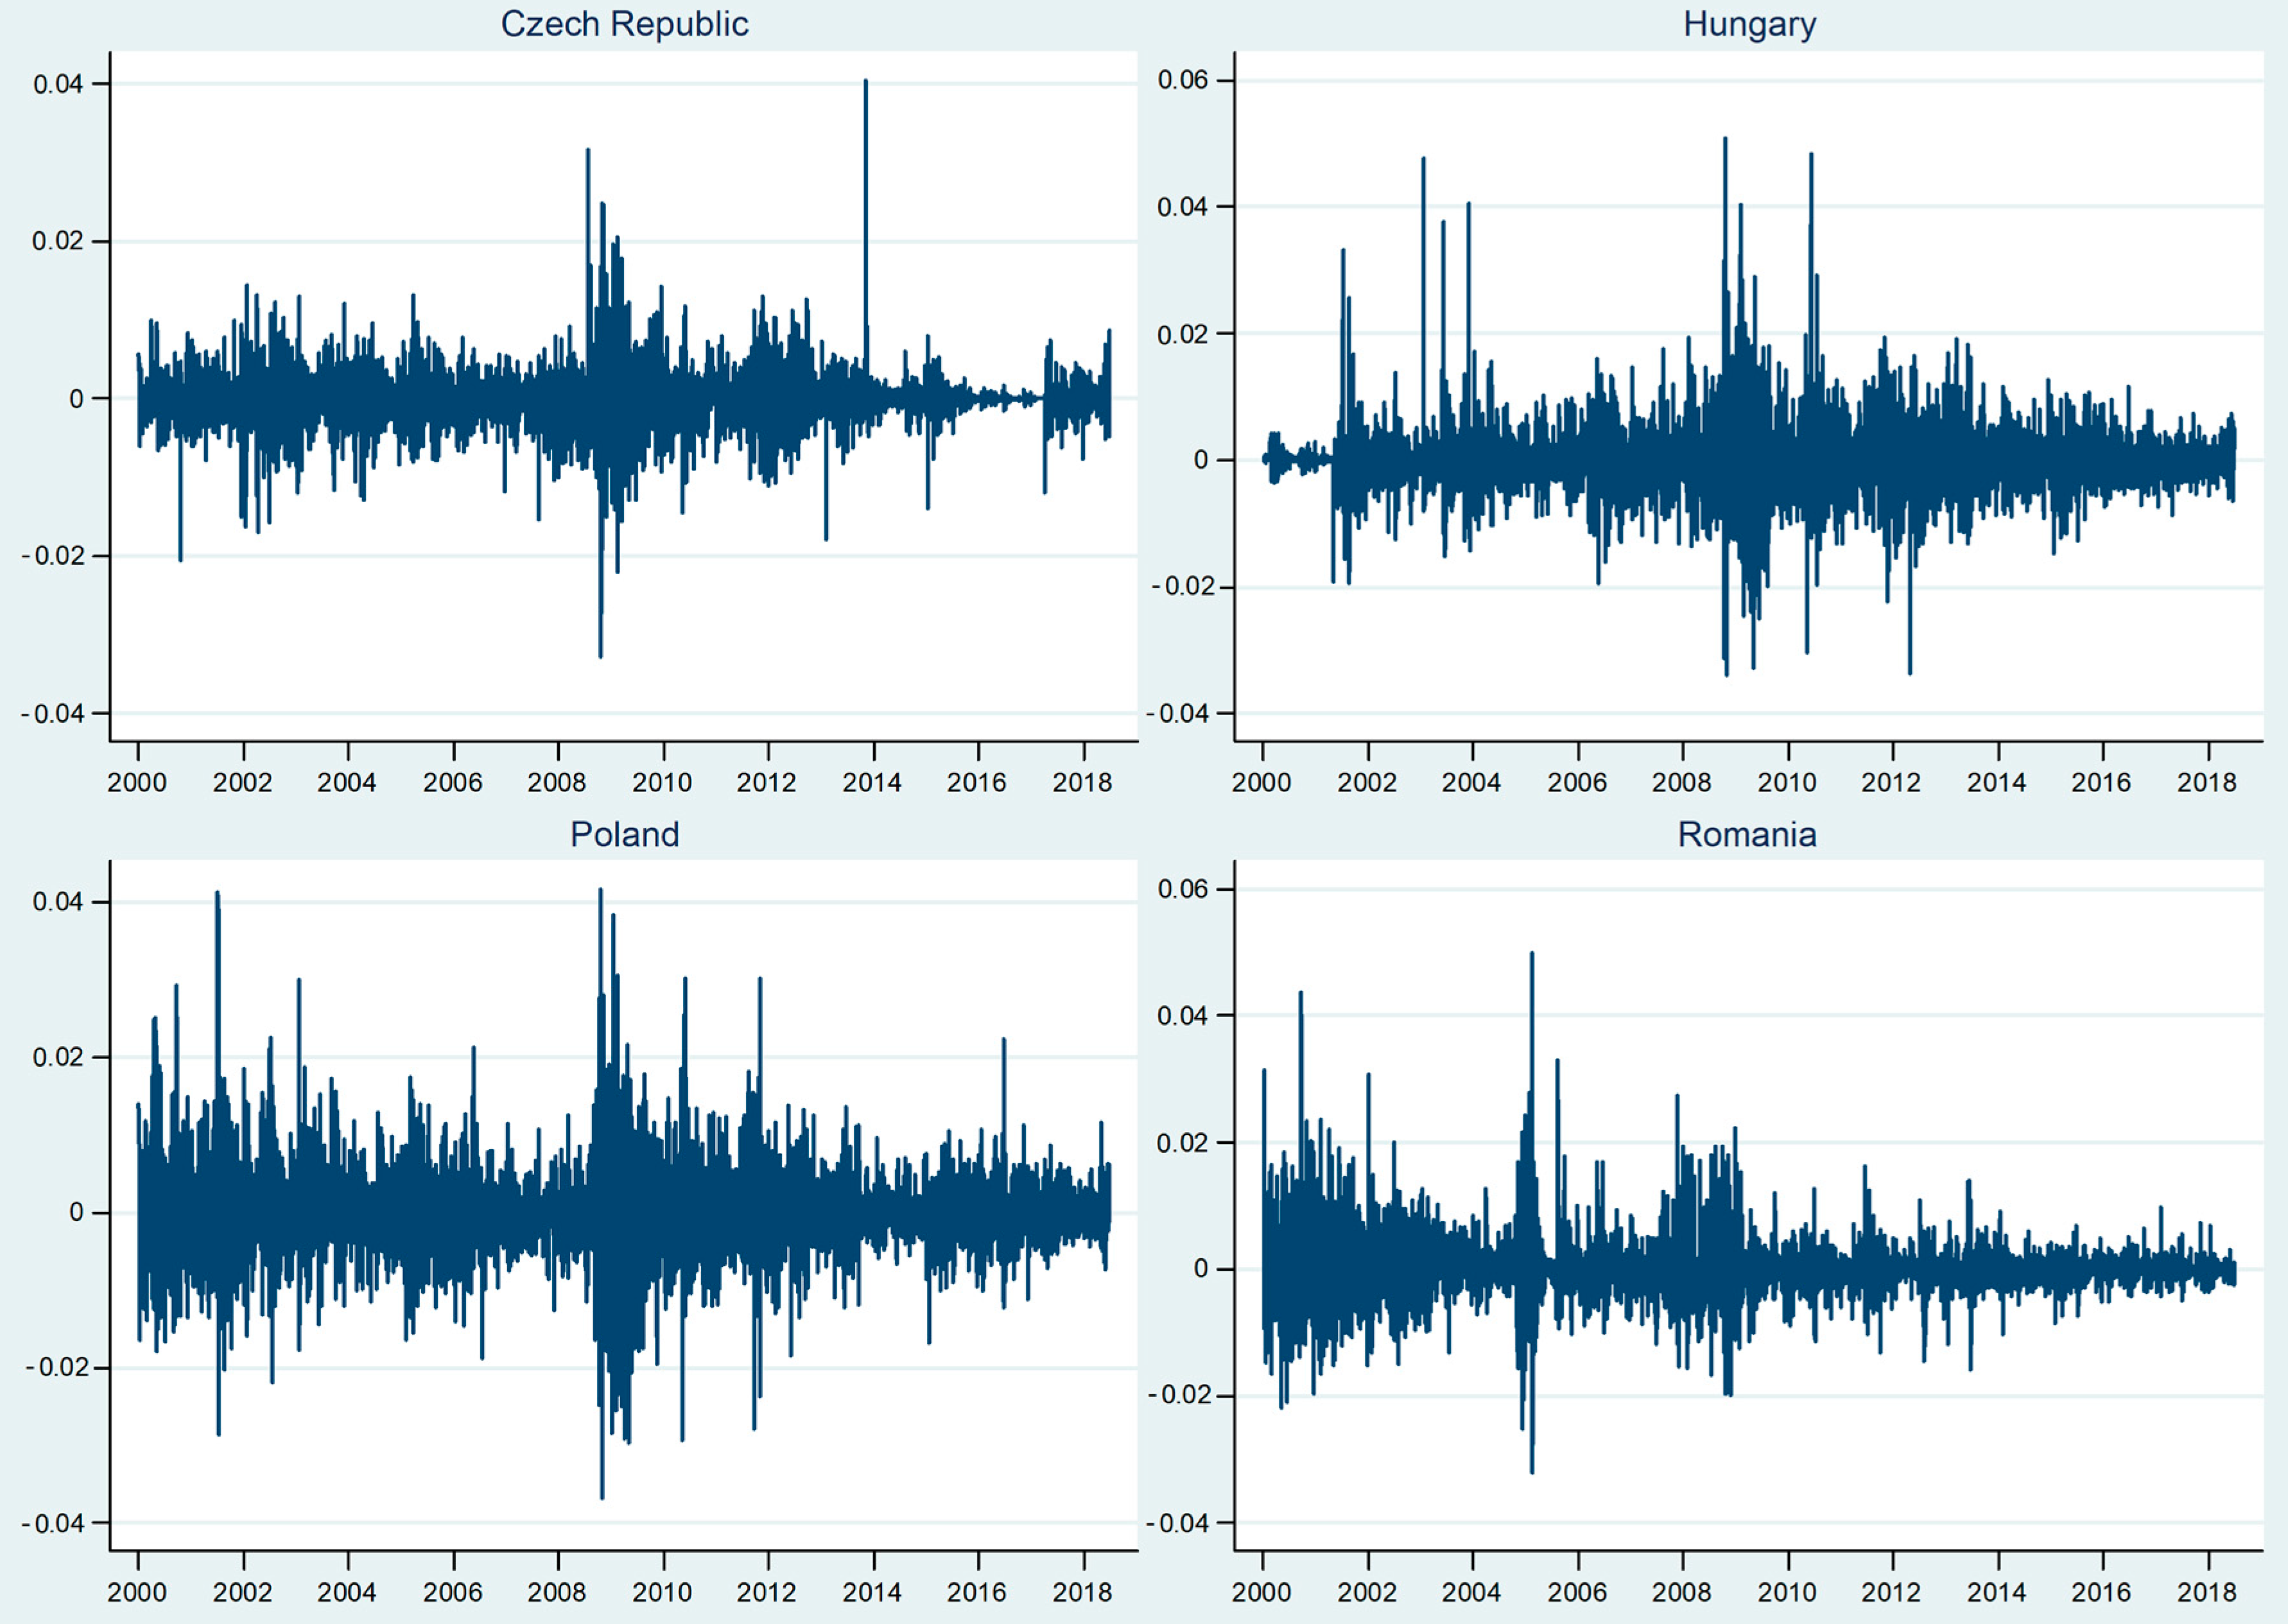
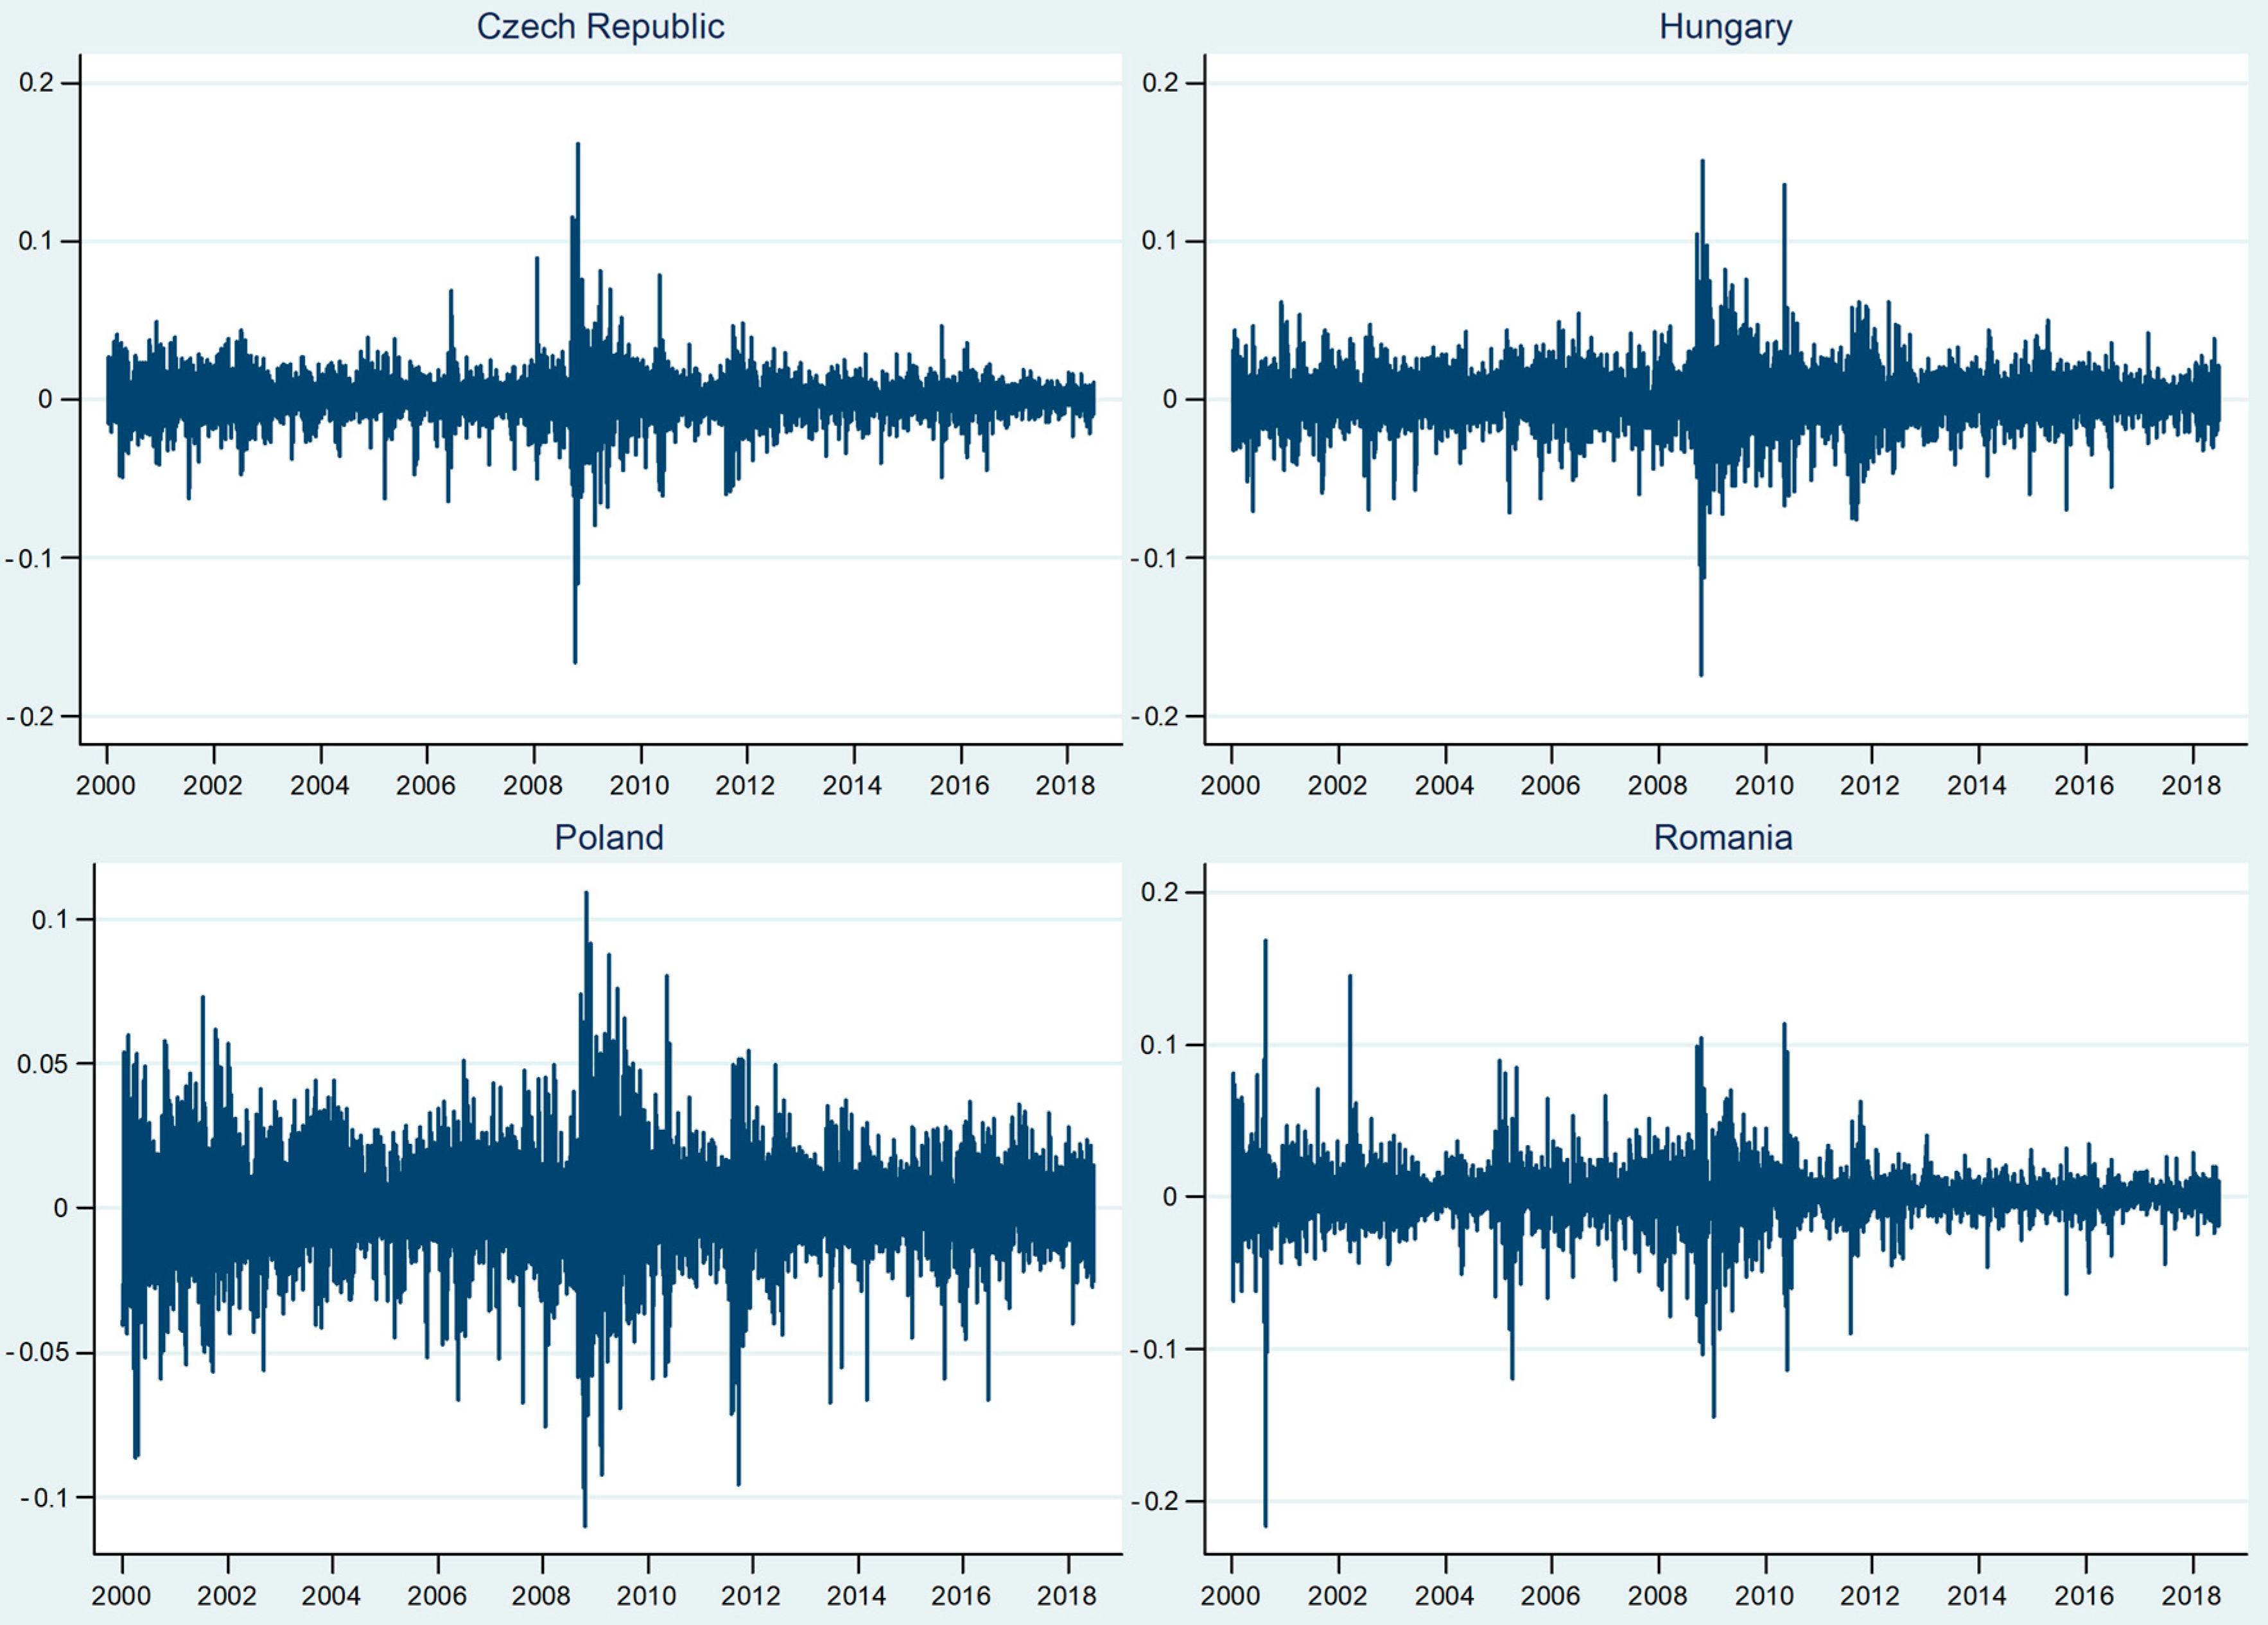
The data employed in this study consists of daily closing prices of currency exchange rates and stock market indices in four Central and Eastern European countries, namely the Czech Republic, Hungary, Poland, and Romania. More precisely, we collect these countries’ national currencies exchange rates, i.e., Czech koruna vs. euro, Hungarian forint vs. euro, Polish zloty vs. euro, and Romanian leu vs. euro, respectively, from the European Central Bank Statistical Data Warehouse. Stock market indices, PX Index, BUX Index, WIG20 Index, and BET Index, respectively, are extracted from Thomson Reuters Datastream. If observations are unavailable due to public holidays, we adjust the data through the previous trading day value. Finally, the exchange rates and stock market indices are transformed by taking the first difference of the natural log. Our sample covers the period from January 3, 2000 to June 29, 2018, which totals 4 825 observations. The first three years correspond to the so-called three MIDAS years period. Figure A1 and Figure A2, as listed in the Appendix A, depict the returns of exchange rates and stock markets. Generally, we notice the volatility clustering phenomenon for both the exchange rates and stock markets indices. More specifically, large/small returns tend to be followed by large/small returns, implying alternative periods of volatility and stability.
Table 1 lists the descriptive statistics of the stock markets indices and exchange rates. The mean returns for exchange rates and stock markets are positive in most cases. However, we notice a negative mean only for the Czech Republic’s national currency, which implies a currency appreciation over the sample period. Volatility proxied by standard deviation is lower for the exchange rates when compared to stock markets indices. The volatility differences are minor between countries. Particularly, we see lower volatility in the Czech Republic and a higher one in Poland. The returns for exchange rates are positively skewed, while the returns are negatively skewed for stock markets indices. The returns for both exchange rates and stock markets indices have positive excess kurtosis, indicating the presence of major shocks in these markets. The Ljung-Box Q-statistics with 10 lags and ARCH-LM (5) reject the null of hypothesis of serial correlation and they suggest conditional heteroscedasticity, respectively.
5. Results and Discussion
5.1. Comovements of Foreign Exchange Markets
Table 2 reports the estimates for the MIDAS conditional correlations between exchange rates. Almost all parameters are significant at the 5% level. In most cases, we notice that the sums of and are close to one, which indicated that the short-run correlation component is mean-reverting to the long-run trend. Additionally, we see that the decay parameter is greater than one, signaling that the weights are decaying with time. More precisely, higher weights are assigned to the most recent correlation matrices.
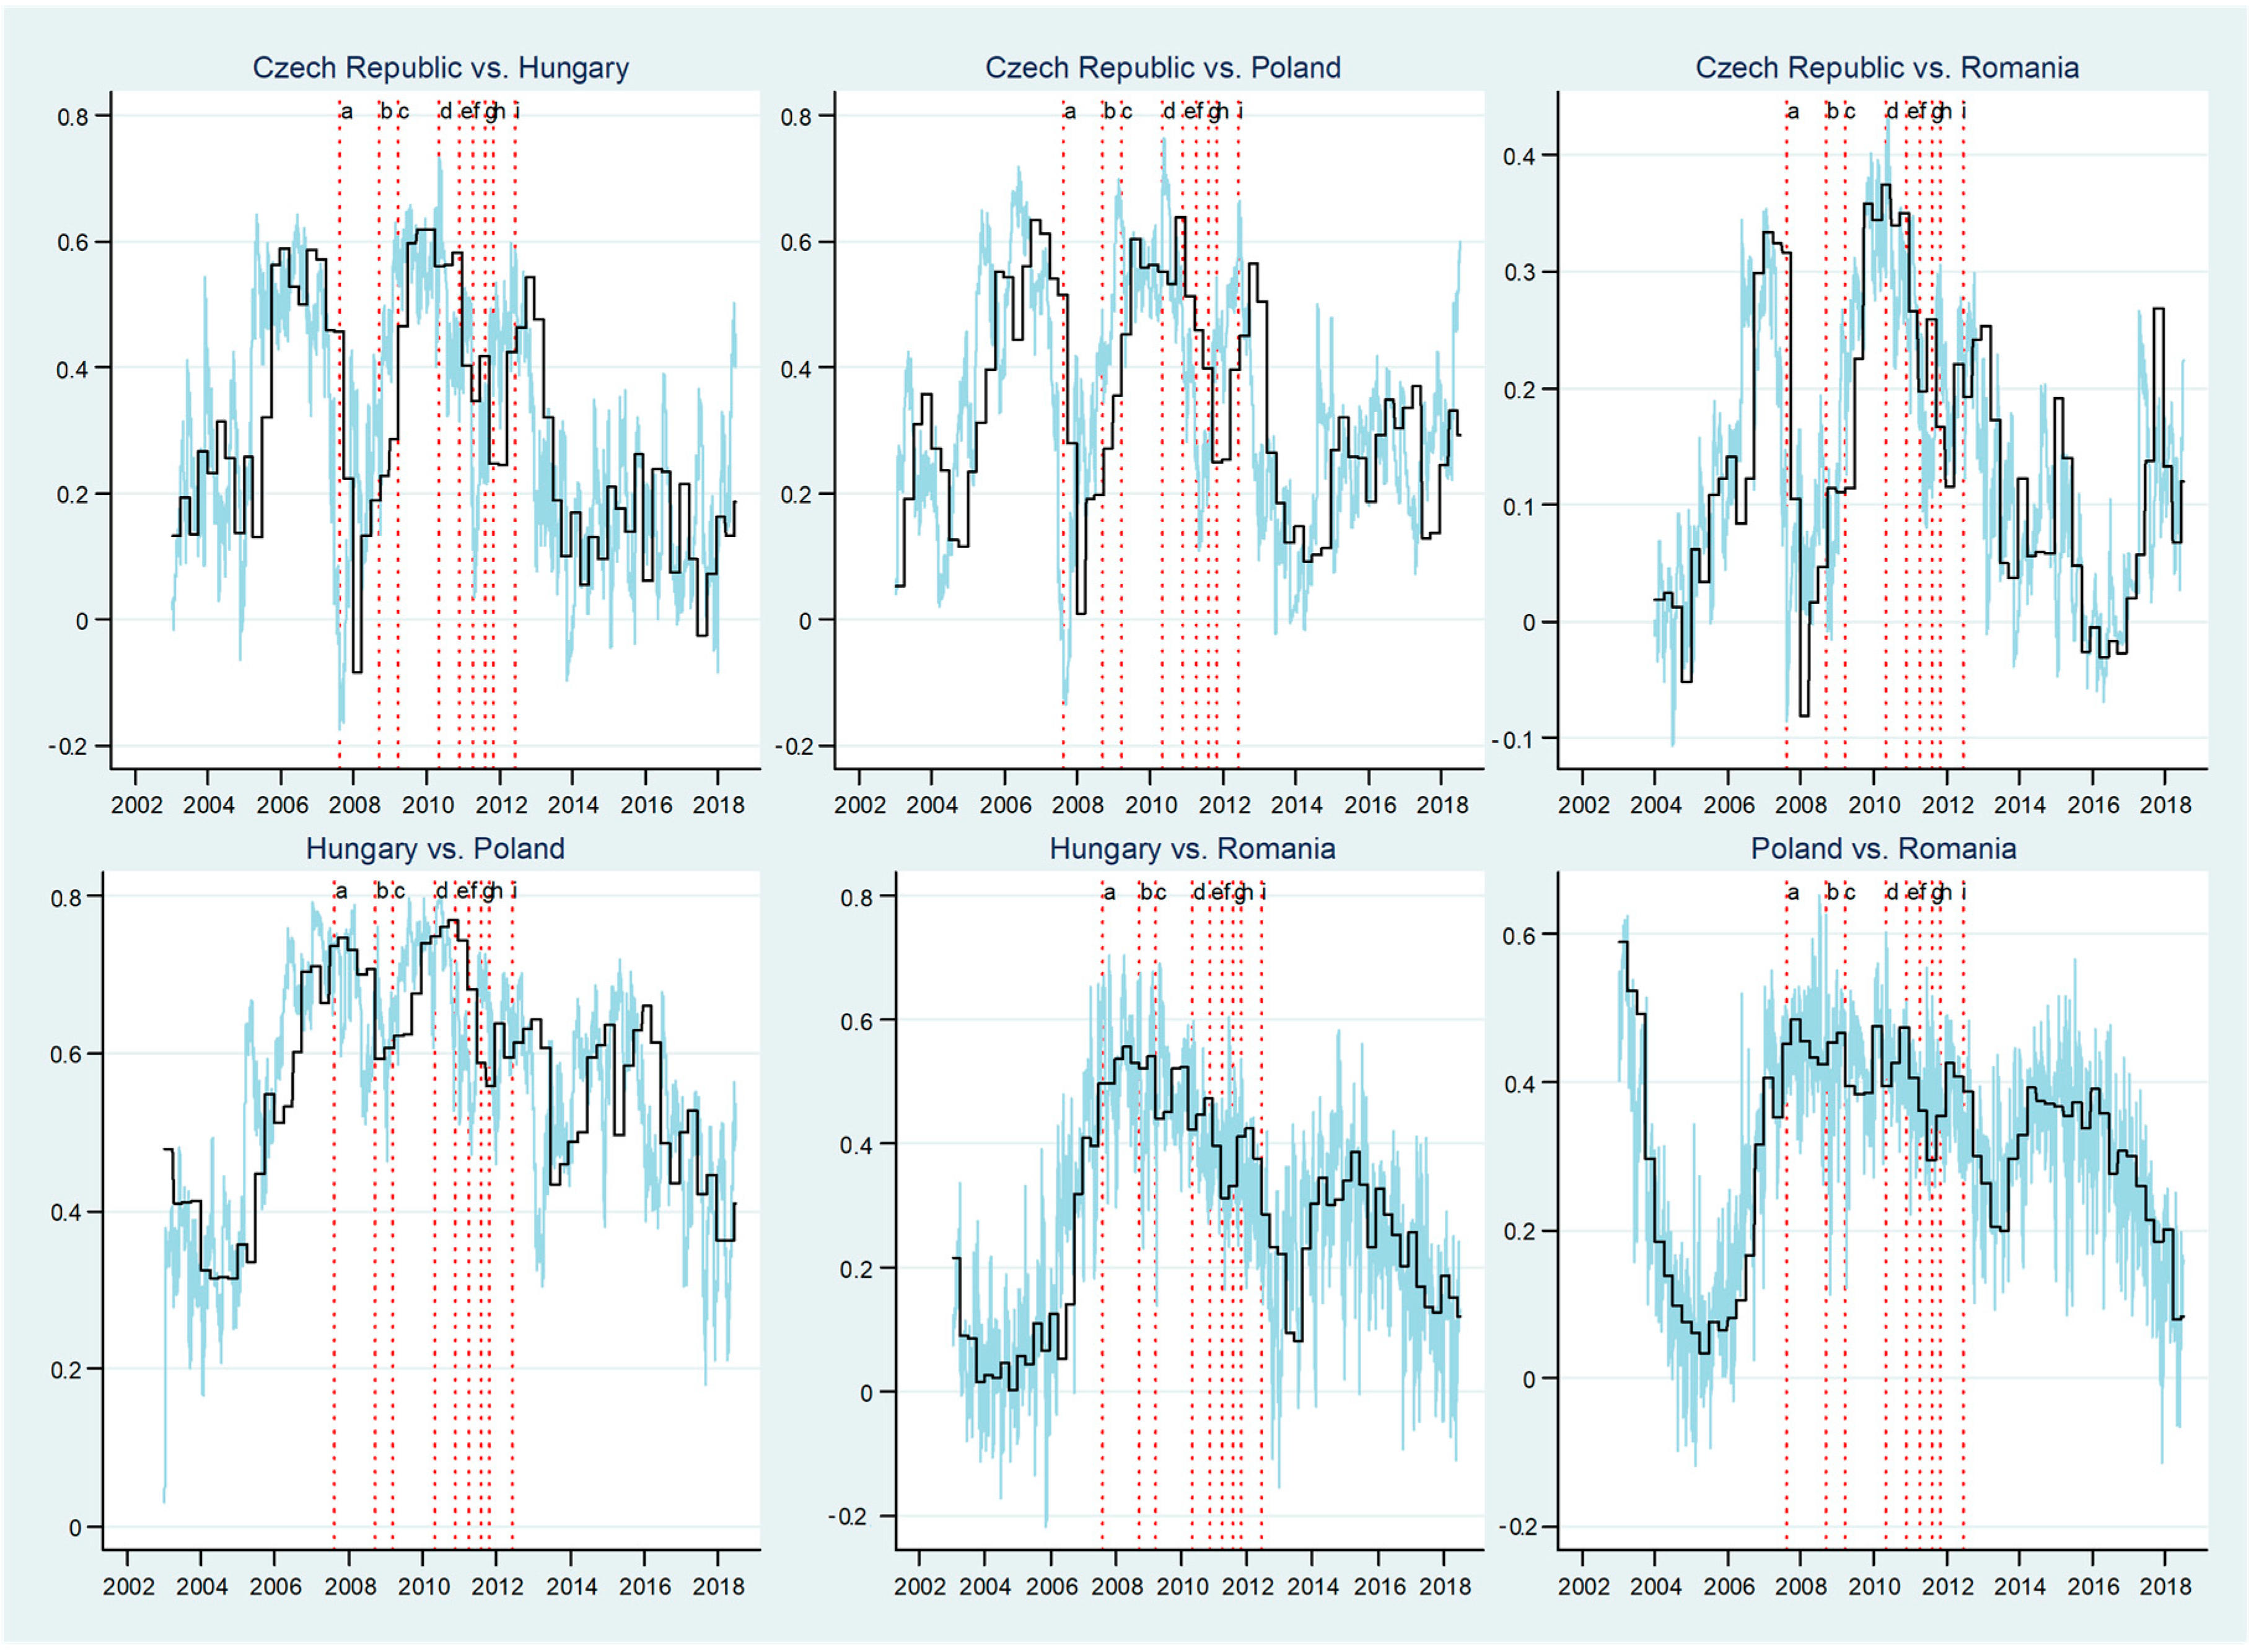
Figure 3 plots time varying correlations based on the DCC-MIDAS estimates for CEE’s exchange rates, for the time span from January 6, 2003 to June 29, 2018. Aiming to explore the comovement patterns in the light of the GFC and the ESDC, we have used cut-off lines in the plots for the major shocks that took place during these crises. The analysis of the graphs reveals that both the short-run and long-run comovements appear to be quite volatile over the entire period for all country pairs. We observe that time varying correlations have several stages in their dynamic, from quite a stable path in the dynamic correlations at the beginning of the sample period, to a sharp upward trend during the 2005–2007 period, followed by a time span from 2007 up to 2013, when the correlations appear to be quite volatile and are decreasing after 2013. This complies with the previous findings of Bubák, et al. [33], who provide evidence of statistically significant intra-regional volatility spillovers among the CEE’ foreign exchange markets during the periods of market uncertainty. However, country pairs present distinct patterns in terms of the value of time varying correlations and they are affected by the evolution of countries’ exchange rates.
An intense rising path until the middle of 2007 may be noticed for the Czech Republic–Hungary pair, after a short period of quite stable dynamic correlations. When the GFC emerged, this trend turned negative, both in the high-frequency and the low-frequency correlations, and it has been deepened after the BNP Paribas’ suspension of three investment funds. This sudden drop seems to be a consequence of the Czech crown appreciation until the middle of 2008 (see Figure 1). Starting with the mid-2008, the pairwise dynamic correlation entered a growing area, being pushed up, especially after the Lehman Brothers’ bankruptcy, the Vienna initiative, and the Greek first rescue package. In our opinion, this rising pattern is determined by a depreciation of the Czech crown and the Hungarian forint, which started at the beginning of 2009. The trend turns again negative until 2014, being followed by a V-shaped dynamic, with a minimum value recorded during the Portugal aid package. The end of the period is characterized by a quite stable pattern, which returned to the values that were recorded during the pre-crisis period.
Concerning the pairwise dynamic correlations between the Czech Republic and Poland, we observe very similar patterns to the previous currency pair in terms of the sign of the DCC and its values. The rising trend recorded up to the mid-2007 is suddenly reversed, collapsing from 0.70 to more than −0.10, as in the case of the Czech crown and the Hungarian forint pair. Thereafter, the conditional correlation starts to exhibit a positive relationship, having the same push-up events as the Czech Republic-Hungary pair until late 2010. Subsequently, the dynamic correlation records a V-shaped path and it returns to similar values as those of the pre-crisis time span.
In the case of the Hungary-Poland pair, the plot clearly shows that the returns exhibit a positive relationship starting with late 2005 up to 2011 after a mild fall at the beginning of the sample period. This period of high DCC is interrupted after Lehman Brothers’ collapse, when the returns entered a downside path. However, the level of comovements between the two currencies remains significantly high during both the GFC and the ESDC, fluctuating around 0.7. It is plausible that this evolution is influenced by the depreciation of the Hungarian forint and the Polish zloty during this period. It is noteworthy that these two markets are the most correlated during the crisis period, as compared to the other pairs. In the subsequent period, right after the Irish and the Portugal aid package, starting with late 2011, the correlation shows a sign switching until the end of the sample period.
The pairwise dynamic correlations between the Czech Republic and Romania reveal similarities with the Czech Republic-Hungary and Czech Republic-Poland pairs in terms of regime shifts. First, the correlation between the exchange rate returns seems to drop during the GFC and to rise during the European sovereign debt crisis. Second, the DCC reaches its peak right after the Greek first rescue package around the value of 0.4. However, this value is almost two times lower than in the case of the other two currency pairs. The returns go down until 2016, when a sign switch may be noticed.
In the case of the Hungary-Romania pair, we observe that the returns rise until early 2008, when the trend is being reversed, after a period of stable comovements at the beginning of the time sample. One peculiarity of the correlation between the Hungarian forint and the Romanian leu is that we remark a quite volatile trend for the short-run path, which may be determined by speculative or conjectural investors’ behaviour. Contrary to the previous country pairs, the plot reveals that the global financial crisis triggered positive relationship in currency returns, while they felt during the ESDC. It could be a consequence of the Hungarian forint and the Romanian leu’s depreciation during the debt crisis (see Figure 1).
The plot for the Poland–Romania pair displays that the DCC in currency returns starts with a value above 0.6 at the beginning of the sample period and it ends with 0.1, revealing a decreased convergence between these two foreign exchange markets. However, the relationship goes up during turmoil periods, reaching its peak in late 2008. It is negatively marked by two crisis episodes, the Lehman Brothers’ collapse and the Vienna initiative, when the short run DCC felt. Overall, the long-term correlation has quite similar values during both crises. The end of the sample period is marked by a decrease in the dynamic correlation.
Our findings that are related to the comovements of foreign exchange markets reveal a quite low degree of convergence between the country pairs, with most of them recording similar values to those before the crisis in the post-crisis period. We also emphasize the differences in how foreign markets in our sample countries react to different events. However, our results show a rise in DCC in currency returns during some of the crisis episodes the rise, which suggests possible signs of contagion.
5.2. Comovements of Stock Markets
Table 3 reports the results for the MIDAS conditional correlations between stock markets. In general, the findings are similar with the ones that are depicted for exchange rates correlations. More specifically, we see that all of the coefficients are significant. Furthermore, the sums for and are close to one, while the value for the decay parameter imply a rapidly decreasing weighting function.
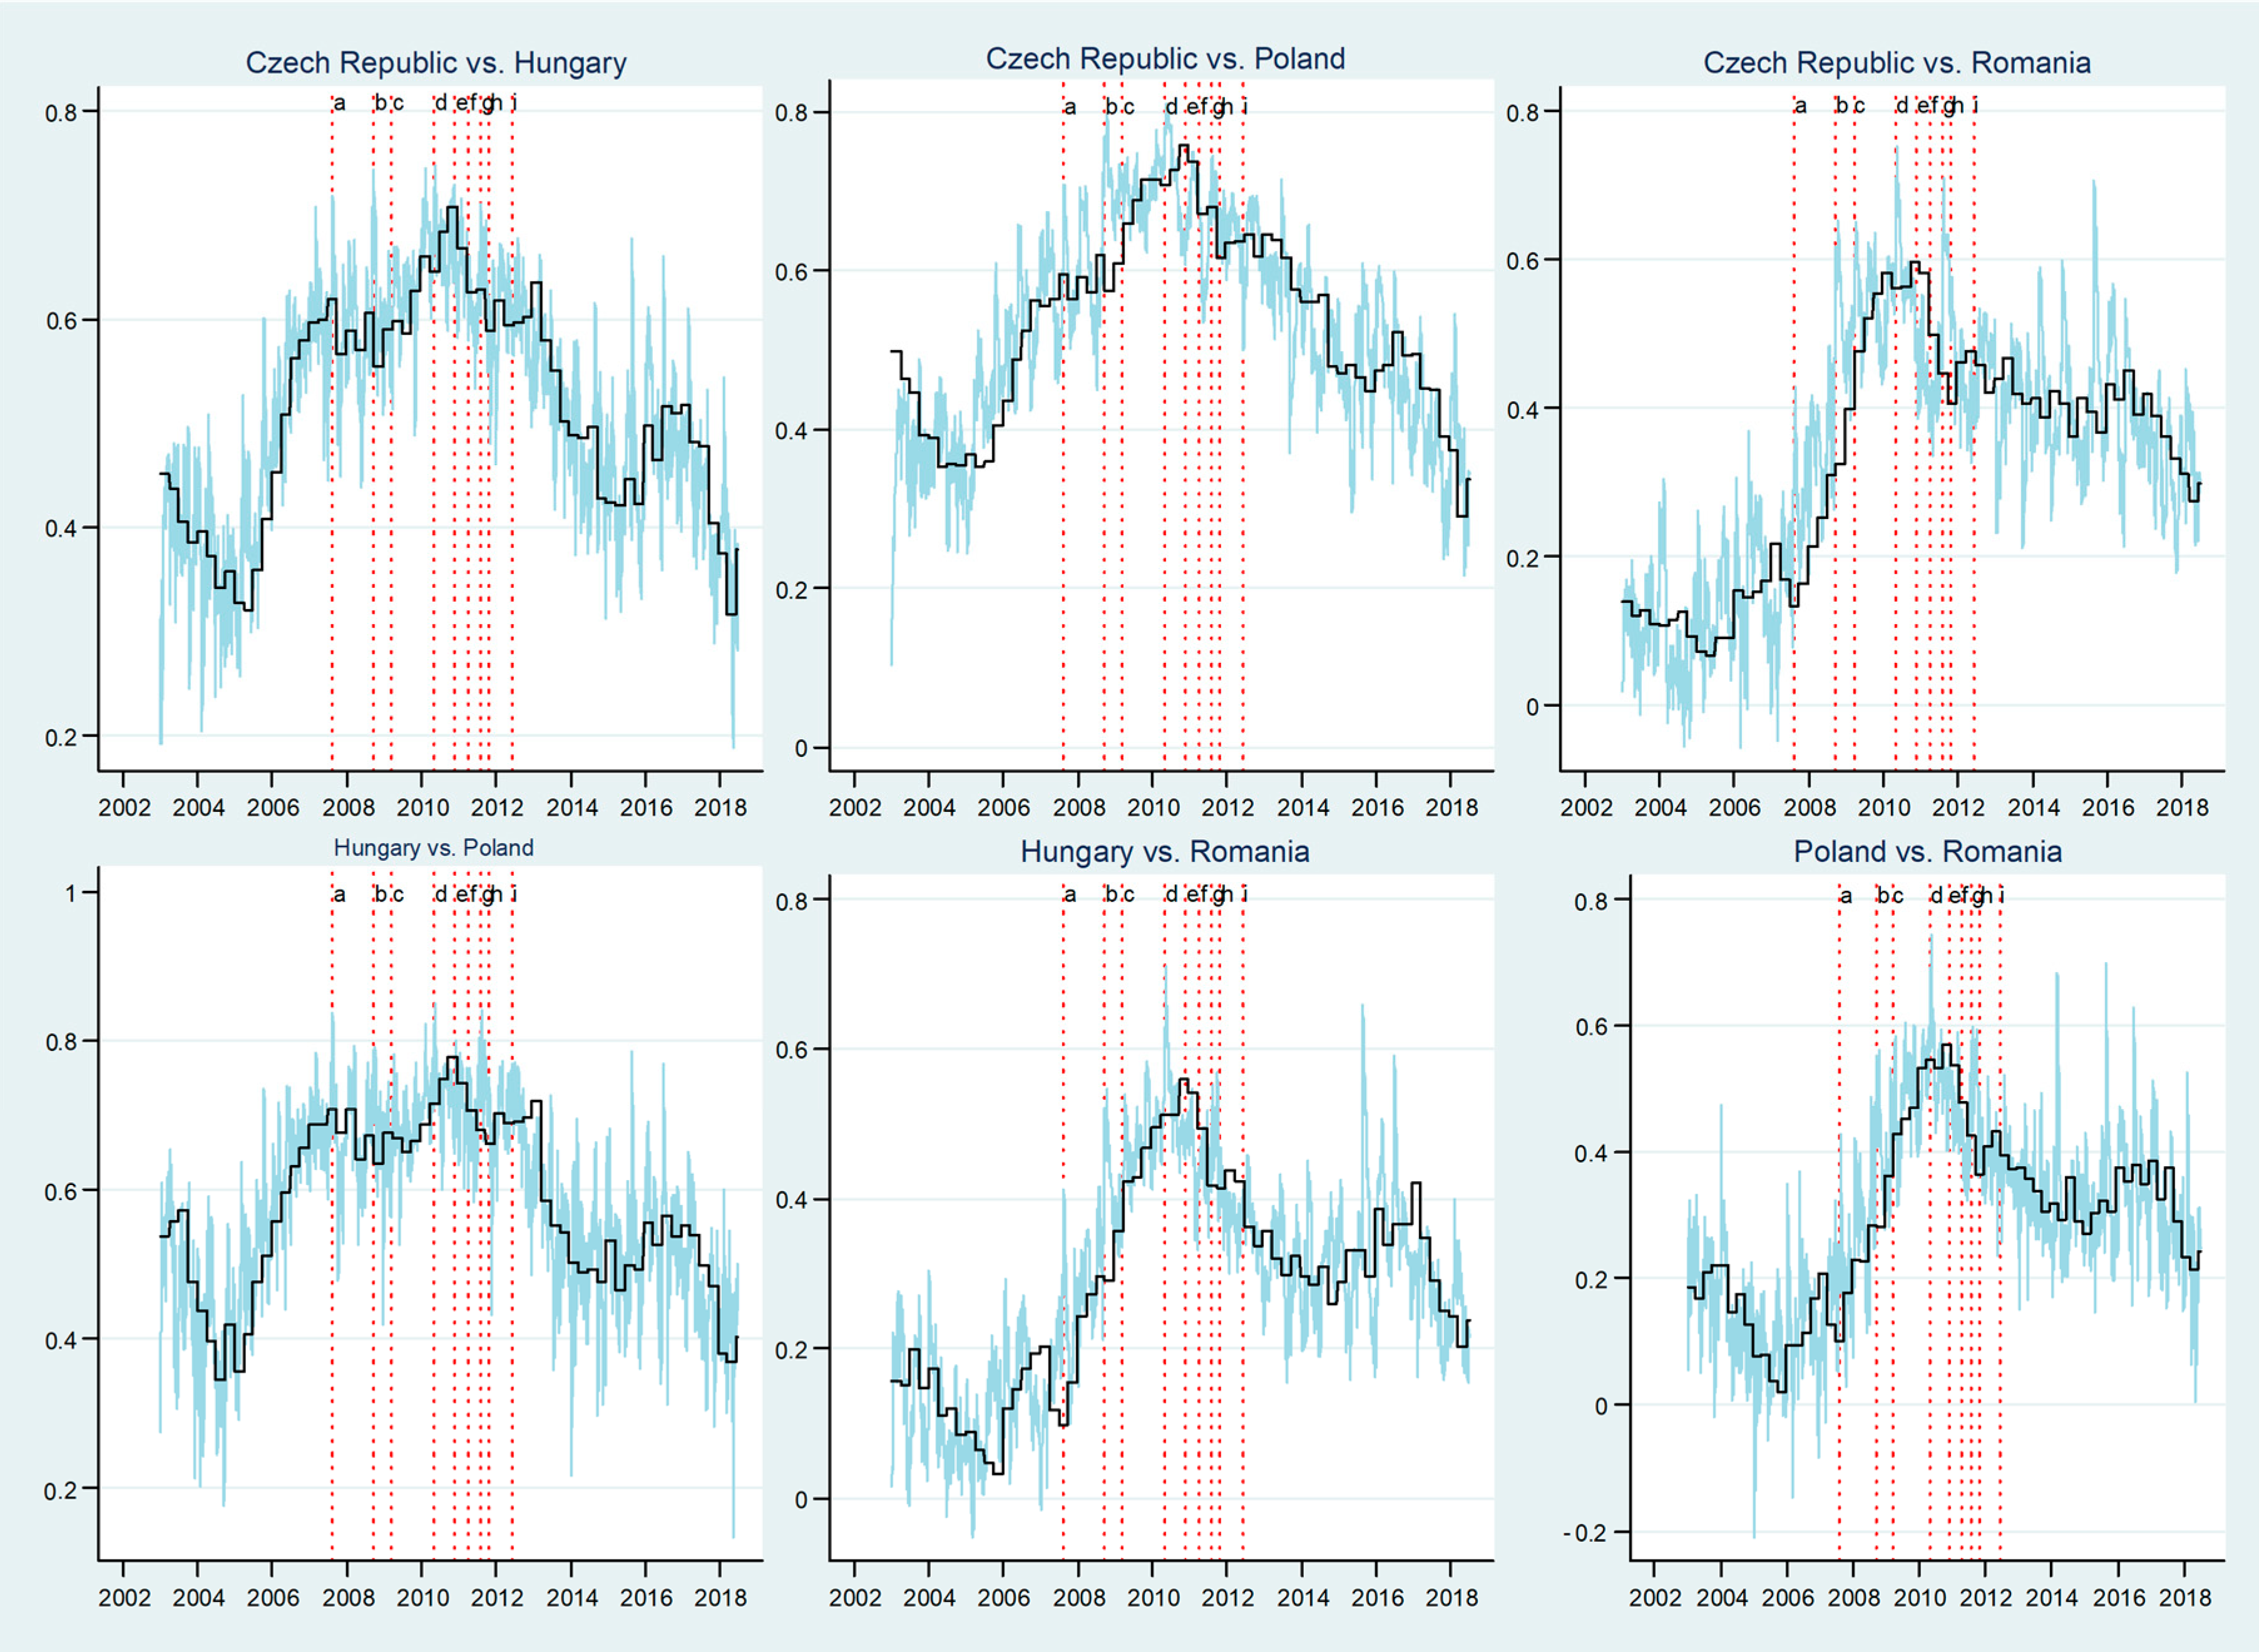
Figure 4 depicts daily and quarterly stock market pairwise dynamic correlations, based on the DCC-MIDAS estimates for the time span from January 6, 2003 to June 29, 2018. The findings suggest some similar patterns among the pairwise time varying correlations, while they record differences regarding their values. Overall, the short-run comovements are more volatile in comparison with the long-run correlations. It may be noticed that time varying correlations have different stages in their dynamic. From quite low levels of dynamic correlations at the beginning of the sample period, they recorded an upward trend during the 2005–2008 period, followed by a time range from 2008 up to 2011, when the correlations appear to be quite volatile, entering a final downward path after late 2011.
The dynamic correlations that were recorded during the period 2005–2008 suggest an increase in comovements dependence. Such a dynamic could be related to the EU enlargement that took place in 2004, when the CEE stock markets became more connected to the old EU markets. Correlations among CEE stock markets increased rightly after these countries entered the EU, which was in line with the results of Savva and Aslanidis [58] and Gjika and Horvath [59]. An upward trend characterizes the next period from 2008 until 2011, with quite volatile correlations in the high frequency correlations series. During this time span, DCC seem to be marked by the crisis episodes. This complies with the previous findings of Harkmann [60] and Bieńkowski, et al. [61], who document an increase in the comovements of stock markets in the CEE countries during the GFC and the euro area crisis. Moreover, in line with their findings, our sample countries were volatility-takers in turbulent times, when the volatility spillovers were uncommonly high. A downward trend could be distinguished after late 2011, with high discrepancies between market returns, which generates opportunities for portfolio diversification.
Related to the distinct pairwise comovements of stock markets, it is important to mention that the highest average values of dynamic correlations are between Hungary and Poland (0.57), the Czech Republic and Poland (0.53), and the Czech Republic and Hungary (0.51), while the lowest are those between these three countries and Romania (ranging from 0.33 in the case of the Czech Republic–Romania pair to 0.28 for the Hungary-Romania pair). This is in line with the findings of Savva and Aslanidis [58], who reveal that the most interconnected stock markets in the region are the Czech Republic, Poland, and Hungary. These three largest markets in the CEE are considered to be the main contributors to the financial integration within the new EU countries and with the old EU countries [55]. Conversely, Romania has joined the EU three years later than these countries, which has postponed its financial integration with the other CEE countries.
For the Hungary–Poland pair, we observe a mild rising trend of the DCC beginning with the middle of 2005 up to the middle of 2007 as consequence of the integration process within the EU that was triggered by the 2004 EU enlargement. However, this path entered a volatility zone, starting with August 2007, when BNP Paribas suspended three investment funds. This period is dominated by numerous short-lived V-shaped correlations, with some pronounced peak points during the crises. There is a downward pattern from early 2012, which tends to stabilize around the tail end of the sample period. In the case of the Czech Republic–Poland pair, an increasing trend in the dynamic correlations is observed for the period from mid-2005 up to 2010, followed by a decrease afterwards. The correlations appear to be volatile, especially in accordance with the main GFC events, i.e., the suspension of three investment funds by BNP Paribas and the Lehman Brothers’ collapse. The highest point in the short-run comovements is reached right after the Lehman Brothers’ collapse, which is in line with the global trend that was revealed by Kotkatvuori-Örnberg, et al. [43], who suggest that this event has resulted in a significant increase in 50 stock market correlations. We note a more intense upward trend in the comovements until late 2007 concerning the pairwise dynamic correlations between the Czech Republic and Hungary, which probably indicated a stronger integration pattern for these markets. However, the dynamic correlations entering the volatile range since the GFC have triggered and reached higher peak points during the ESDC. From early 2012, a downward pattern is recorded, which seems to be quite steady after mid-2015.
For the pairwise dynamic correlations between these three countries and Romania, quite a similar path might be observed, i.e., an increasing trend in correlations for the period from late 2007 to late 2010, followed by a mild decrease afterwards. The surge in DCCs reached the peak during the ESDC, right after the aid package for the Greece bailout was approved in May 2010. A downward path is recorded after that event, followed by a stabilising trend starting with late 2014. At the end of the sample, we see slightly higher DCC compared to the beginning of the sample. We explain these values through the integration path of Romanian within the EU.
Taken together, these results establish some important corollaries. Firstly, the stock market comovements have somewhat strengthened in Central Europe, being particularly sustained by the 2004 EU enlargement. Secondly, we notice that the surge in DCC was stronger and more persistent during the crises. Thirdly, the degree of convergence between the Romanian stock market and the other three CEE markets increased in the post-crisis period in comparison with the pre-crisis one.
5.3. Comovements of Stock Markets and Exchange Rates
Table 4 reports the estimates of the DCC-MIDAS parameters for exchange rates vs. stock markets indices. All of the parameters are significant at the 5% level. However, we see differences between the four countries estimates. For the Czech Republic, Hungary, and Poland, the sum of the and parameters is close to 1. For the Czech Republic, the result for the decay parameter denotes a rapidly decreasing weighting function, while the decay parameter implies a flat weighting function for Hungary, Poland, and Romania. The different behaviour of short- and long-run correlation series is determined by the MIDAS polynomial that allows the long-run correlation to move frequently over time, especially for the Czech Republic.
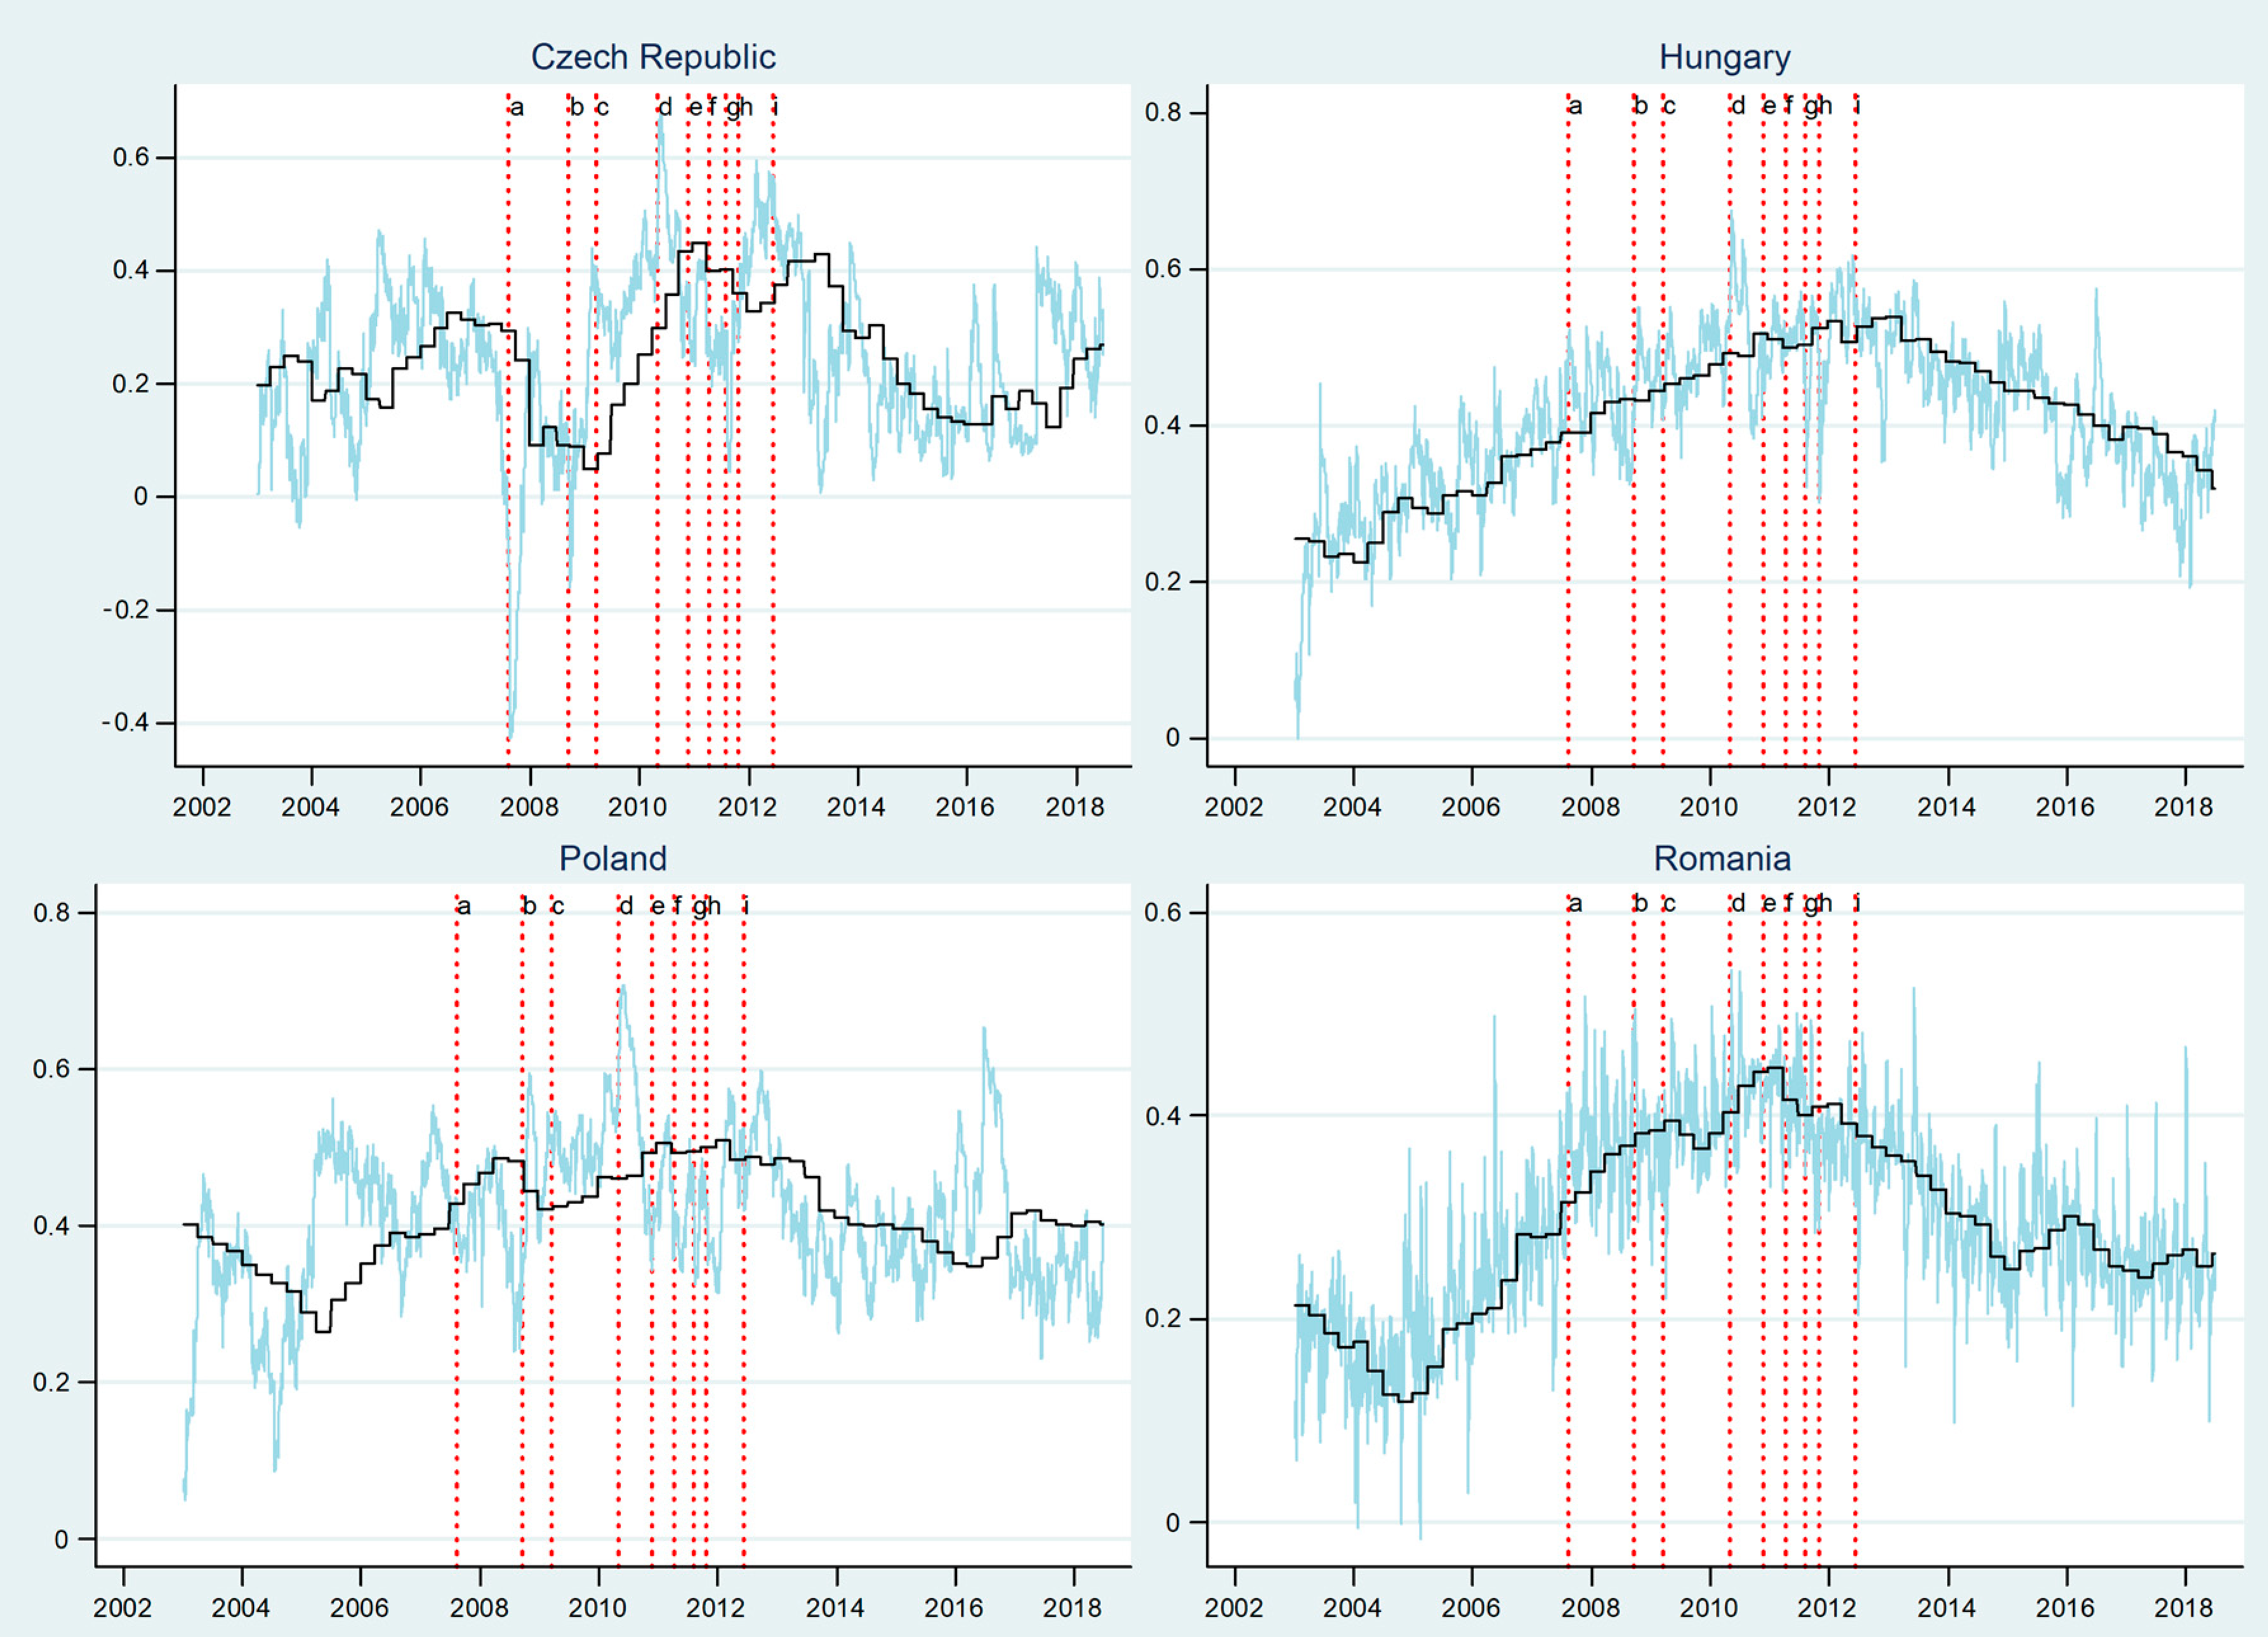
Figure 5 plots the patterns in time varying correlations between stock market and exchange rate in the Czech Republic, Hungary, Poland, and Romania while using the estimates from the DCC-MIDAS model. Broadly, a visual analysis of the graphs highlights significant differences in DCC between the four countries, both in terms of level and variances, signaling higher opportunities for portfolio diversification. In our opinion, this divergence can be related to idiosyncratic factors, which are strongly related to exchange rate patterns, i.e., exchange rate regime, central bank interventions. However, we observe an upward trend in DCC for most countries over the time span from 2007 to 2013, implying increased comovement dependence. This observation is consistent with Islami and Welfens [75] and Lee, et al. [76], who analyze the links between the stock and currency markets in the Czech Republic, Poland, and Hungary, and find significant levels of correlation in all the considered countries. Moreover, a very interesting feature is the jump in the high-frequency correlations that emerge for all the countries during the crisis episodes, when a series of important events occur. These patterns indicate that the benefits of portfolio diversification decrease over volatility periods and they imply signs of contagion.
The plot for the Czech Republic displays increased volatility in time varying DCC, both in the high-frequency and low-frequency correlations, as well as numerous regimes shifts over the entire time range. It is noteworthy that we cannot identify a stable pattern with respect to the time varying dynamics, but rather a more related specific period trend. More precisely, we see a steady correlation that varies around 0.2 at the beginning of the sample period until 2005, alternating negative DCC periods with positive ones. After 2005, we notice a mild upward trend in the low-frequency correlations. However, this is disrupted by two crisis events, i.e., the BNP Paribas announcement of suspending three investments funds and the Lehman Brothers’ bankruptcy, when significant negative ebbs are recorded. The divergence between stock market and exchange rate returns will hold until the beginning of 2009. The low-frequency DCC enters a positive path right after the launching of the Vienna initiative, which was a significant mark in European banking cooperation and convergence. We note that the period of positive correlation holds up until the middle of 2013. However, within this time span, different crisis events have different impact on the time varying high-frequency DCC. For instance, two signal points for the surging returns are caused by the first rescue package for Greece that was approved in May 2010 and the Greece debt cut by the end of 2011, which may indicate a sign of contagion. Conversely, other crisis-related events triggered lower DCC, i.e., the financial aid requested by Portugal and the spreading contagion from the sovereign debt crisis to Italy and Spain in the mid-2011. The DCC returned to quite similar levels to the pre-crisis ones at the end of the sample period. It is interesting to note that the GFC episodes triggered negative trends in DCC in terms of responses, while the sovereign debt crisis pushed up the level of DCC, signaling differences in how stock markets and foreign exchange markets reacted to these crises.
In Hungary, the time varying DCC between stock market and exchange rate displays a different path when compared to the Czech Republic and Poland. We notice positive comovements for the long-term DCC, from the beginning of the time sample up to 2013, when the trend is being reversed. However, we remark a quite volatile trend for the short-run path, i.e., increased values are rapidly followed by significant decreases, which may be a consequence of speculative and conjectural behaviour from investors. The moments when Lehman Brothers filed for bankruptcy, Greece received the first rescue package, and Spain requested financial assistance seem to be the most influential in moving up the returns. Contrary to the Czech Republic, the plot reveals that the global financial crisis and the sovereign debt crisis both have had similar effects on the returns, triggering a mild rising path.
Quite specific patterns in time varying DCC could be noticed in the case of Poland, both in the high-frequency and low-frequency correlations. The short-term DCC path is marked by numerous V-shaped periods. However, the short-term DCC ranges within a more stable interval after 2005 while we notice a more volatile period at the beginning of the sample period. Surprisingly, the crisis episodes do not imply a consistent behaviour in DCC. The only exception is related to the Greece rescue package episode, when the increase in DCC is considerable, while we do not observe significant jumps for other episodes. The long-term comovement is rather stable, especially after 2006, ranging around 0.4.
The plot for Romania displays different regime shifts within the time sample, recording low correlations with a downward path up to 2005. After 2005, we notice a mild upward trend in the exchange rate and stock exchange returns until the middle of 2011, which is boosted by the global financial crisis and the sovereign debt crisis episodes. The Vienna initiative seems to alleviate this long-term DCC upward path, while the Greek and Irish rescue package episodes turn it up again. It may be observed that the peak in the DCC is recorded during the European sovereign debt crisis, which implies more similar returns and possible signs of contagion. After mid-2011, we see a downward pattern for the DCC, which is stabilized around the value of 0.3, beginning with 2015.
The plotted correlation series for the four markets display the important conclusion that the correlations between stock market and exchange rate returns seem to rise mostly during the European sovereign debt crisis.
6. Conclusions
The purpose of this paper is to highlight the development patterns of foreign exchange markets and stock markets, as well as their degree of interconnectedness, especially in the light of the last global financial crisis and the European sovereign debt crisis.
To this aim, it addresses the link between the stock market indices and the exchange rates in four CEE countries, namely the Czech Republic, Hungary, Poland, and Romania, in the period from 2003 to 2018. The CEE region offers an optimal framework for our analysis, given the particularities of these countries in terms of exchange markets and stock markets. We simultaneously examine three categories of comovements, two of which are at the cross-country level, between foreign exchange markets and between stock markets, respectively, while the third one refers to the links between these markets within each country. Such an approach to financial markets gives a much more visible picture of the existing patterns between the assets and countries, which would otherwise be neglected. The results show that there are significant differences between the four countries. Therefore, a clear pattern for the correlations cannot be identified. Moreover, during the most severe crisis episodes we may notice an increased correlation, which suggests some signs of contagion.
Our empirical findings may be summarized, as follows. The comovements of foreign exchange markets reveal a quite low degree of convergence between the country pairs. Most of them record similar values to those before the crisis over the post-crisis period. Moreover, there are differences in how foreign exchange markets in our sample countries react to different events. Yet, during some of the crisis episodes, the DCC in currency returns rises, which suggests possible signs of contagion. In addition, the results that were related to the interdependences between stock markets establish several important corollaries. We can notice that the 2004 EU enlargement supported the stock market comovements in the CEE region. The surge in conditional correlations was stronger and more persistent during the ESDC than during the GFC. The degree of convergence between the Romanian stock market and the other three CEE markets marked a slight increase in the post-crisis period as compared to the pre-crisis one. The comovements between foreign exchange markets and stock markets within each country seem to mostly rise during the ESDC, which revealed clear signs of contagion and lower portfolio diversification opportunities.
The findings of this paper have important implications for policy makers and market practitioners, especially in the CEE countries, where the catching-up process strongly influences both the exchange rates and stock markets.
The depicted patterns of conditional correlations between foreign exchange markets are of overwhelming importance for investors in the forex markets, for hedging and pricing purposes, currency portfolio optimization and allocation decisions. High levels of conditional correlations between exchange rates during the GFC and the ESDC imply less diversification benefits for market participants that operate in the CEE markets. Additionally, understanding the exchange rate comovements is of major importance for monetary authorities from this group of economies, in taking decisions that are related to appreciation or depreciation of the domestic currency against other currencies. Furthermore, the results have critical inference for decision makers in predicting exchange rates correlations, i.e., how foreign currencies could react to an intervention in the domestic currency, both in normal and turbulent times.
The results regarding stock market correlations are important firstly from the point of view of measuring financial integration between the CEE economies. Although, it has been revealed that stock market convergence has increased right after the 2004 EU enlargement, and the values remain quite similar after the crisis. These findings are of utmost importance for the EU policy makers to further address the issue of financial integration. Moreover, the strong and persistent surge of conditional correlations during the crises could serve decision makers for building warning systems for cross-border capital flows and strengthen the stability of the local stock markets. While, with regard to portfolio managers, high levels of conditional correlations during the GFC and the ESDC mean decreased opportunities for investment portfolio diversification.
This study also provides useful insights into the relationship between the exchange rates and stock markets. Firstly, the results show increased comovement dependence during the crisis episodes, which suggests signs of contagion. In this context, understanding the time-varying nature of these correlations and the volatility transmission channels would be helpful for decision makers from a financial stability perspective, in preventing the spread of negative shocks through adequate policies, before they can destabilize the financial market. Secondly, the depicted quite low degree of convergence between these two markets, being revealed by similar values in comovements, both before the crisis and in the post-crisis period, offers useful insights to policy makers for designing a more integrated financial market in the region. Thirdly, this study is helpful in assisting monetary policy decisions, confirming whether the use of monetary policy instruments has achieved the expected results. Fourthly, the increased comovement dependence among these markets during the crises episodes means less portfolio diversification opportunities for investors. Based on these results, market practitioners could devise appropriate investment strategies for reducing portfolio risk and finding better ways to guard their portfolios from future market turmoil. Moreover, understanding the relationship between exchange rates and stock markets could be used for predicting the exchange rate course, both by decision makers and market practitioners, in managing the exchange rate risk and the exposure to foreign contracts.
Author Contributions
Conceptualization, S.M.-P. and D.C.; Data Curation, C.-V.S. and S.M.-P., Methodology, C.-V.S. and S.M.-P.; Writing-Original Draft Preparation, D.C. and S.M.-P.; Writing-Review & Editing, D.C.
Funding
This research received no external funding.
Conflicts of Interest
The authors declare no conflict of interest.
Appendix A
Figure A1.
Dynamics of daily exchange rates returns.

Figure A2.
Dynamics of daily stock market indices returns.

References
- Dornbusch, R.; Fischer, S. Exchange rates and the current account. Am. Econ. Rev. 1980, 70, 960–971. [Google Scholar]
- Branson, W.H.; Henderson, D.W. The specification and influence of assets markets. In Handbook of International Economics; Jones, R.W., Kenen, P.B., Eds.; Elsevier: Amsterdam, The Netherlands, 1985; pp. 749–806. [Google Scholar]
- Frankel, J.A. Monetary and portfolio-balance models of exchange rate determination. In Economic Interdependence and Flexible Exchange Rates; Bhandari, J.S., Putnam, B.H., Eds.; MIT Press: Cambridge, UK, 1983; pp. 84–115. [Google Scholar]
- CNB. Monetary Policy Instruments. Available online: https://www.cnb.cz/en/monetary-policy/instruments/ (accessed on 10 January 2019).
- MNB. Exchange Rates. Available online: https://www.mnb.hu/en/statistics/statistical-data-and-information/statistical-time-series/exchange-rates/changes-in-the-width-of-the-huf-intervention-band (accessed on 10 January 2019).
- NBP. Monetary Policy. Available online: https://www.nbp.pl/homen.aspx?f=/en/onbp/informacje/polityka_pieniezna.html (accessed on 10 January 2019).
- Lízal, L.; Schwarz, J. Foreign exchange interventions as an (un)conventional monetary policy tool. BIS Pap. 2013, 73, 127–143. [Google Scholar]
- The Financial Times. Poland’s Intervention, Explained. Available online: https://www.ft.com/content/902f85f8-d103-399e-baf1-b3c05812b306 (accessed on 12 February 2019).
- BNR. Exchange Rate Regime. Available online: http://www.bnr.ro/Exchange-rate-regime-of-the-leu--3648.aspx (accessed on 12 February 2019).
- Roaf, J.; Atoyan, R.; Joshi, B.; Krogulski, K. 25 Years of Transition Post-Communist Europe and the IMF. International Monetary Fund 2014. Available online: https://www.researchgate.net/publication/267390310_25_Years_of_Transition_Post-Communist_Europe_and_the_IMF (accessed on 12 February 2019).
- MSCI. MSCI Global Market Accessibility Review 2018. Available online: https://www.msci.com/documents/1296102/1330218/MSCI_Global_Market_Accessibility_Review_June_2018_%28FINAL%29.pdf/04dd3b70-487a-8395-912c-89a202b5b4fa (accessed on 25 February 2019).
- European Commission. Convergence Report. Institutional Paper 078. 2018. Available online: https://ec.europa.eu/info/publications/economy-finance/convergence-report-2018_en (accessed on 25 February 2019).
- Baig, T.; Goldfajn, I. Financial Market Contagion in the Asian Crisis. IMF Staff Papers 1999. Available online: https://papers.ssrn.com/sol3/papers.cfm?abstract_id=142285 (accessed on 27 February 2019).
- Fratzscher, M. On currency crises and contagion. Int. J. Financ. Econ. 2003, 8, 109–129. [Google Scholar] [CrossRef] [Green Version]
- Huang, B.-N.; Yang, C.-W. An analysis of exchange rate linkage effect: An application of the multivariate correlation analysis. J. Asian Econ. 2003, 14, 337–351. [Google Scholar] [CrossRef]
- Dungey, M.; Fry, R.; Martin, V.L. Currency market contagion in the Asia-Pacific region. Aust. Econ. Pap. 2004, 43, 379–395. [Google Scholar] [CrossRef]
- Horen, N.V.; Jager, H.; Klaassen, F. Foreign exchange market contagion in the Asian crisis: A regression based approach. Rev. World Econ. 2006, 142, 374–401. [Google Scholar] [CrossRef]
- Orlov, A.G. A Cospectral Analysis of Exchange Rate Comovements during Asian Financial Crisis. J. Int. Financ. Mark. Inst. Money 2009, 19, 742–758. [Google Scholar] [CrossRef]
- Kitamura, Y. Testing for intraday interdependence and volatility spillover among the euro, the pound and the Swiss franc markets. Res. Int. Bus. Financ. 2010, 24, 158–171. [Google Scholar] [CrossRef]
- Celık, S. The more contagion effect on emerging markets: The evidence of DCC-GARCH model. Econ. Model. 2012, 29, 1946–1959. [Google Scholar] [CrossRef]
- Dimitriou, D.; Kenourgios, D.; Simos, T. Financial crises, exchange rate linkages and uncovered interest parity: Evidence from G7 markets. Econ. Model. 2017, 66, 112–120. [Google Scholar] [CrossRef]
- Calvet, L.E.; Fisher, A.J.; Thompson, S.B. Volatility comovement: A multifrequency approach. J. Econ. 2006, 131, 179–215. [Google Scholar] [CrossRef]
- Jiang, J.; Ma, K.; Cai, X. Scaling and correlations in foreign exchange market. Phys. A Stat. Mech. Its Appl. 2007, 375, 274–280. [Google Scholar] [CrossRef]
- Wu, M.-C. Phase correlation of foreign exchange time series. Phys. A Stat. Mech Its Appl. 2007, 375, 633–642. [Google Scholar] [CrossRef]
- Kühl, M. Strong Comovements of Exchange Rates: Theoretical and Empirical Cases When Currencies Become the Same Asset; Center European, Governance and Economic Development Research Discussion Papers 76; Department of Economics, University of Goettingen: Göttingen, Germany, 2008. [Google Scholar]
- Boero, G.; Silvapulle, P.; Tursunalieva, A. Modelling the Bivariate Dependence Structure of Exchange Rates Before and After the Introduction of the Euro: A Semi-Parametric Approach. Int. J. Financ. Econ. 2011, 16, 357–374. [Google Scholar] [CrossRef]
- Antonakakis, N. Exchange return co-movements and volatility spillovers before and after the introduction of euro. J. Int. Financ. Mark. Inst. Money 2012, 22, 1091–1109. [Google Scholar] [CrossRef] [Green Version]
- Tamakoshi, G.; Hamori, S. Co-movements among major European exchange rates: A multivariate time-varying asymmetric approach. Int. Rev. Econ. Financ. 2014, 31, 105–113. [Google Scholar] [CrossRef]
- Albulescu, C.T.; Aubin, C.; Goyeau, D.; Tiwari, A.K. Extreme co-movements and dependencies among major international exchange rates: A copula approach. Q. Rev. Econ. Financ. 2018, 69, 56–69. [Google Scholar] [CrossRef]
- Pramor, M.; Tamirisa, N. Common Volatility Trends in the Central and Eastern European Currencies and The Euro, IMF Working Papers 2006. Available online: https://www.researchgate.net/publication/5124926_Common_Volatility_Trends_in_the_Central_and_Eastern_European_Currencies_and_the_Euro (accessed on 27 February 2019).
- Babetskaia-Kukharchuk, O.; Babetskii, I.; Podpiera, J. Convergence in exchange rates: Market’s view on CE-4 joining EMU. Appl. Econ. Lett. 2008, 15, 385–390. [Google Scholar] [CrossRef]
- Stavarek, D. Assessment of the exchange rate convergence in euro-candidate countries. Amfiteatru Econ. 2009, 11, 159–180. [Google Scholar]
- Bubák, V.; Kočenda, E.; Žikeš, F. Volatility transmission in emerging European foreign exchange markets. J. Bank. Financ. 2011, 35, 2829–2841. [Google Scholar] [CrossRef] [Green Version]
- Andrieş, A.M.; Ihnatov, I.; Tiwari, A.K. Comovement of exchange rates: A Wavelet analysis. Emerg. Mark. Financ. Trade 2015, 52, 574–588. [Google Scholar] [CrossRef]
- Kadlčáková, N.; Komárek, L. Foreign exchange market contagion in Central Europe from the viewpoint of extreme value theory. Prague Econ. Pap. 2017, 26, 690–721. [Google Scholar] [CrossRef]
- Longin, F.; Solnik, B. Extreme correlation of international equity markets. J. Financ. 2001, 56, 649–676. [Google Scholar] [CrossRef]
- Forbes, K.J.; Rigobon, R. No contagion, only interdependence: Measuring equity market comovements. J. Financ. 2002, 57, 2223–2261. [Google Scholar] [CrossRef]
- Bekaert, G.; Harvey, C.R. Market Integration and Contagion. NBER Working Paper No. 9510. The National Bureau of Economic Research 2003. Available online: https://faculty.fuqua.duke.edu/~charvey/Research/Published_Papers/P77_Market_integration_and.pdf (accessed on 27 February 2019).
- Corsetti, G.; Pericoli, M.; Sbracia, M. Some contagion, some interdependence: More pitfalls in tests of financial contagion. J. Int. Money Financ. 2005, 24, 1177–1199. [Google Scholar] [CrossRef]
- Chiang, T.C.; Jeon, B.N.; Li, H. Dynamic correlation analysis of financial contagion: Evidence from Asian markets. J. Int. Money Financ. 2007, 26, 1206–1228. [Google Scholar] [CrossRef]
- Aloui, R.; Aïssa, M.S.B.; Nguyen, D.K. Global financial crisis, extreme interdependences, and contagion effects: The role of economic structure? J. Bank. Financ. 2011, 35, 130–141. [Google Scholar] [CrossRef]
- Peng, Y.; Ng, W.L. Analysing financial contagion and asymmetric market dependence with volatility indices via copulas. Ann. Financ. 2012, 8, 49–74. [Google Scholar] [CrossRef]
- Kotkatvuori-Örnberg, J.; Nikkinen, J.; Äijö, J. Stock market correlations during the financial crisis of 2008–2009: Evidence from 50 equity markets. Int. Rev. Financ. Anal. 2013, 28, 70–78. [Google Scholar] [CrossRef]
- Samitas, A.; Tsakalos, I. How can a small country affect the European economy? The Greek contagion phenomenon. J. Int. Financ. Mark. Inst. Money 2013, 25, 18–32. [Google Scholar] [CrossRef]
- Apostolakis, G.; Papadopoulos, A.P. Financial stress spillovers across the banking, securities and foreign exchange markets. J. Financ. Stab. 2015, 19, 1–21. [Google Scholar] [CrossRef]
- Mobarek, A.; Muradoglu, G.; Mollah, S.; Hou, A.J. Determinants of time varying co-movements among international equity markets during crisis and non-crisis periods. J. Financ. Stab. 2016, 24, 1–11. [Google Scholar] [CrossRef]
- Niţoi, M.; Pochea, M.M. Time-varying dependence in European equity markets: A contagion and investor sentiment driven analysis. Econ. Model. 2019, in press. [Google Scholar]
- Junior, L.; Mullokandov, A.; Kenett, D. Dependency Relations among International Stock Market Indices. J. Risk Financ. Manag. 2015, 8, 227–265. [Google Scholar] [CrossRef] [Green Version]
- Bekaert, G.; Harvey, C.R. Time-varying world market integration. J. Financ. 1995, 50, 403–444. [Google Scholar] [CrossRef]
- Kim, S.J.; Moshirian, F.; Wu, E. Dynamic stock market integration driven by the European Monetary Union: An empirical analysis. J. Bank. Financ. 2005, 29, 2475–2502. [Google Scholar] [CrossRef] [Green Version]
- Égert, B.; Kočenda, E. Time-varying synchronization of European stock markets. Empir. Econ. 2011, 40, 393–407. [Google Scholar] [CrossRef]
- Dorodnykh, E. What is the Degree of Convergence among Developed Equity Markets? Int. J. Financ. Res. 2012, 3, 2–16. [Google Scholar] [CrossRef]
- Christoffersen, P.; Errunza, V.; Jacobs, K.; Langlois, H. Is the potential for international diversification disappearing? A dynamic copula approach. Rev. Financ. Stud. 2012, 25, 3711–3751. [Google Scholar] [CrossRef]
- Virk, N.; Javed, F. European equity market integration and joint relationship of conditional volatility and correlations. J. Int. Money Financ. 2017, 71, 53–77. [Google Scholar] [CrossRef] [Green Version]
- Cappiello, L.; Gérard, B.; Kadareja, A.; Manganelli, S. Financial Integration of New EU Member States; Working Paper; European Central Bank: Frankfurt, Germany, 2006. [Google Scholar]
- Christiansen, C.; Ranaldo, A. Extreme coexceedances in new EU member states’ stock markets. J. Bank. Financ. 2009, 33, 1048–1057. [Google Scholar] [CrossRef]
- Lupu, R.; Lupu, I. Contagion across central and eastern European stock markets: A dynamic conditional correlation test. Econ. Comput. Econ. Cybern. Stud. Res. 2009, 43, 173–186. [Google Scholar]
- Savva, C.S.; Aslanidis, C. Stock market integration between new EU member states and the Euro-zone. Empir. Econ. 2010, 39, 337–351. [Google Scholar] [CrossRef]
- Gjika, D.; Horvath, R. Stock market comovements in Central Europe: Evidence from the asymmetric DCC model. Econ. Model. 2013, 33, 55–64. [Google Scholar] [CrossRef]
- Harkmann, K. Equity market contagion from Western Europe to Central and Eastern Europe during the crisis years 2008–2012. East. Eur. Econ. 2014, 52, 55–65. [Google Scholar] [CrossRef]
- Bieńkowski, W.; Gawrońska-Nowak, B.; Grabowski, W. Comovements of stock markets in the CEE-3 countries during the global financial crisis. East. Eur. Econ. 2014, 52, 32–55. [Google Scholar] [CrossRef]
- Tai, C.S. Market integration and contagion: Evidence from Asian emerging stock and foreign exchange markets. Emerg. Mark. Rev. 2007, 8, 264–283. [Google Scholar] [CrossRef]
- Lee, C.H.; Doong, S.C.; Chou, P.I. Dynamic correlation between stock prices and exchange rates. Appl. Financ. Econ. 2011, 21, 789–800. [Google Scholar] [CrossRef]
- Lin, C.H. The comovement between exchange rates and stock prices in the Asian emerging markets. Int. Rev. Econ. Financ. 2012, 22, 161–172. [Google Scholar] [CrossRef]
- Andreou, E.; Matsia, M.; Savvides, A. Stock and foreign exchange market linkages in emerging economies. J. Int. Financ. Mark. Inst. Money 2013, 27, 248–268. [Google Scholar] [CrossRef] [Green Version]
- Moore, T.; Wang, P. Dynamic linkage between real exchange rates and stock prices: Evidence from developed and emerging Asian markets. Int. Rev. Econ. Financ. 2014, 29, 1–11. [Google Scholar] [CrossRef]
- Caporale, G.M.; Hunter, J.; Ali, F.M. On the linkages between stock prices and exchange rates: Evidence from the banking crisis of 2007–2010. Int. Rev. Financ. Anal. 2014, 33, 87–103. [Google Scholar] [CrossRef]
- Chkili, W.; Nguyen, D.K. Exchange rate movements and stock market returns in a regime-switching environment: Evidence for BRICS countries. Res. Int. Bus. Financ. 2014, 31, 46–56. [Google Scholar] [CrossRef]
- Lestano; Kuper, G.H. Correlation dynamics in East Asian financial markets. Emerg. Mark. Financ. Trade 2016, 52, 382–399. [Google Scholar] [CrossRef]
- Dua, P.; Tuteja, D. Financial crises and dynamic linkages across international stock and currency markets. Econ. Model. 2016, 59, 249–261. [Google Scholar] [CrossRef]
- Abed, R.E. On the comovements among European exchange rates and stock prices: A multivariate time-varying asymmetric approach. J. Appl. Financ. Bank 2016, 6, 53–59. [Google Scholar]
- Vodenska, I.; Becker, A.; Zhou, D.; Kenett, D.; Stanley, H.; Havlin, S. Community Analysis of Global Financial Markets. Risks 2016, 4, 13. [Google Scholar] [CrossRef]
- Büttner, D.; Hayo, B. News and correlations of CEEC-3 financial markets. Econ. Model. 2010, 27, 915–922. [Google Scholar] [CrossRef] [Green Version]
- Ülkü, N.; Demirci, E. Joint dynamics of foreign exchange and stock markets in emerging Europe. J. Int. Financ. Mark. Inst. Money 2012, 22, 55–86. [Google Scholar] [CrossRef]
- Islami, M.; Welfens, P.J.J. Financial market integration, stock markets and exchange rate dynamics in Eastern Europe. Int. Econ. Econ. Policy 2013, 10, 47–79. [Google Scholar] [CrossRef]
- Lee, Y.H.; Fang, H.; Su, W.F. Effectiveness of portfolio diversification and the dynamic relationship between stock and currency markets in the emerging Eastern European and Russian markets. Czech. J. Econom. Financ. 2014, 64, 296–311. [Google Scholar]
- Colacito, R.; Engle, R.F.; Ghysels, E. A component model for dynamic correlations. J. Econ. 2011, 164, 45–59. [Google Scholar] [CrossRef] [Green Version]
- Engle, R. Dynamic conditional correlation: A simple class of multivariate generalized autoregressive conditional heteroskedasticity models. J. Bus. Econ. Stat. 2002, 20, 339–350. [Google Scholar] [CrossRef]
- Engle, R.F.; Rangel, J.G. The spline-GARCH model for low-frequency volatility and its global macroeconomic causes. Rev. Financ. Stud. 2008, 21, 1187–1222. [Google Scholar] [CrossRef]
- Engle, R.F.; Ghysels, E.; Sohn, B. Stock market volatility and macroeconomic fundamentals. Rev. Econ. Stat. 2013, 95, 776–797. [Google Scholar] [CrossRef]
- Asgharian, H.; Christiansen, C.; Hou, A.J. Macro-finance determinants of the long-run stock–bond correlation: The DCC-MIDAS specification. J. Financ. Econom. 2015, 14, 617–642. [Google Scholar] [CrossRef]
Figure 1.
The dynamics of exchange rates in the Central and Eastern European (CEE) countries. In the last plot, orange line is for Romania, red line for Hungary, green line for Poland, and blue line for the Czech Republic.
Figure 1.
The dynamics of exchange rates in the Central and Eastern European (CEE) countries. In the last plot, orange line is for Romania, red line for Hungary, green line for Poland, and blue line for the Czech Republic.

Figure 2.
The dynamics of stock market indices in the CEE countries. In the last plot, orange line is for Romania, red line for Hungary, green line for Poland, and blue line for the Czech Republic.
Figure 2.
The dynamics of stock market indices in the CEE countries. In the last plot, orange line is for Romania, red line for Hungary, green line for Poland, and blue line for the Czech Republic.

Figure 3.
The correlations between exchange rates in the CEE countries. The blue line is used for daily Dynamic Conditional Correlation (DCC), the black line is for quarterly Dynamic Conditional Correlation Mixed Data Sampling (DCC-MIDAS). (a) BNP Paribas (b) Lehman Brothers (c) Vienna Initiative (d) Greece aid package (e) Irish aid package (f) Portugal aid package (g) Contagion to Italy and Spain (h) Greece debt cut (i) Spain aid package.

Figure 4.
The correlations between stock markets in the CEE countries. The blue line is used for daily DCC, the black line is for quarterly DCC-MIDAS. (a) BNP Paribas (b) Lehman Brothers (c) Vienna Initiative (d) Greece aid package (e) Irish aid package (f) Portugal aid package (g) Contagion to Italy and Spain (h) Greece debt cut (i) Spain aid package.

Figure 5.
The correlations between exchange rates and stock market indices in CEE. The blue line is used for daily DCC, the black line is for quarterly DCC-MIDAS. (a) BNP Paribas (b) Lehman Brothers (c) Vienna Initiative (d) Greece aid package (e) Irish aid package (f) Portugal aid package (g) Contagion to Italy and Spain (h) Greece debt cut (i) Spain aid package.


Table 1.
Descriptive statistics.
| Mean | Max | Min | Std. Dev. | Skewness | Kurtosis | Qz(10) | ARCH LM (5) | |
|---|---|---|---|---|---|---|---|---|
| Exchange rates | ||||||||
| The Czech Republic | −0.0001 | 0.0405 | −0.0327 | 0.0035 | 0.3694 | 14.2185 | 13.3350 * | 95.9287 *** |
| Hungary | 0.0001 | 0.0507 | −0.0339 | 0.0054 | 0.7373 | 12.8786 | 37.0370 *** | 75.6811 *** |
| Poland | 0.0000 | 0.0416 | −0.0368 | 0.0058 | 0.4786 | 9.0362 | 38.7060 *** | 195.0694 *** |
| Romania | 0.0002 | 0.0500 | −0.0321 | 0.0047 | 0.9797 | 13.8784 | 49.9970 *** | 226.1385 *** |
| Stock market indices | ||||||||
| The Czech Republic | 0.0002 | 0.1612 | −0.1654 | 0.0144 | −0.2595 | 16.6427 | 44.7810 *** | 249.9560 *** |
| Hungary | 0.0002 | 0.1503 | −0.1738 | 0.0173 | −0.1471 | 10.2704 | 66.3520 *** | 129.1190 *** |
| Poland | 0.0000 | 0.1093 | −0.1100 | 0.0174 | −0.2257 | 6.3691 | 26.2930 *** | 130.6841 *** |
| Romania | 0.0004 | 0.1680 | −0.2162 | 0.0171 | −0.4400 | 18.1503 | 40.7510 *** | 166.3801 *** |
Note: *, **, *** denotes statistical significance at the 10%, 5% and 1% level, respectively.
Table 2.
DCC-MIDAS parameters estimates for exchange rates.
| Czech Republic vs. Hungary | 0.0306 *** (0.0054) | 0.9531 *** (0.0106) | 8.2256 ** (3.2124) |
| Czech Republic vs. Poland | 0.0227 *** (0.0031) | 0.9715 *** (0.0077) | 6.7729 * (4.3126) |
| Czech Republic vs. Romania | 0.0148 *** (0.0051) | 0.9642 *** (0.0206) | 6.6174 ** (2.6148) |
| Hungary vs. Poland | 0.0250 *** (0.0039) | 0.9639 *** (0.0091) | 5.9173 * (3.0406) |
| Hungary vs. Romania | 0.0491 *** (0.0085) | 0.8837 *** (0.0265) | 5.9989 *** (1.9718) |
| Poland vs. Romania | 0.0433 *** (0.0108) | 0.8070 *** (0.0683) | 4.5315 *** (1.2427) |
Note: *, **, *** denotes statistical significance at the 10%, 5% and 1% level, respectively. Robust standard errors (in parentheses) are used for all estimates.
Table 3.
DCC-MIDAS parameters estimates for stock markets.
| Czech Republic vs. Hungary | 0.0272 *** (0.0085) | 0.8865 *** (0.0415) | 3.1269 *** (0.8733) |
| Czech Republic vs. Poland | 0.0214 *** (0.0053) | 0.9504 *** (0.0165) | 2.7904 *** (0.8453) |
| Czech Republic vs. Romania | 0.0251 *** (0.0052) | 0.9437 *** (0.0147) | 2.5046 *** (0.7101) |
| Hungary vs. Poland | 0.0440 *** (0.0087) | 0.8531 *** (0.0353) | 3.4554 *** (0.8956) |
| Hungary vs. Romania | 0.0214 *** (0.0059) | 0.9411 *** (0.0234) | 3.0748 *** (1.094) |
| Poland vs. Romania | 0.0333 *** (0.0070) | 0.8906 *** (0.0331) | 3.088 *** (0.8636) |
Note: *, **, *** denotes statistical significance at the 10%, 5% and 1% level, respectively. Robust standard errors (in parentheses) are used for all estimates.
Table 4.
DCC-MIDAS parameters estimates.
| Czech Republic | 0.0225 *** (0.0037) | 0.9707 *** (0.0073) | 2.3765 * (1.7681) |
| Hungary | 0.0193 *** (0.0055) | 0.9414 *** (0.0222) | 1.0010 *** (0.0532) |
| Poland | 0.0178 *** (0.0045) | 0.9731 *** (0.0082) | 1.0010 *** (0.0992) |
| Romania | 0.0284 ** (0.0128) | 0.8208 *** (0.1031) | 1.0010 *** (0.0459) |
Note: *, **, *** denotes statistical significance at the 10%, 5% and 1% level, respectively. Robust standard errors (in parentheses) are used for all estimates.
© 2019 by the authors. Licensee MDPI, Basel, Switzerland. This article is an open access article distributed under the terms and conditions of the Creative Commons Attribution (CC BY) license (http://creativecommons.org/licenses/by/4.0/).
Share and Cite
MDPI and ACS Style
Moagăr-Poladian, S.; Clichici, D.; Stanciu, C.-V. The Comovement of Exchange Rates and Stock Markets in Central and Eastern Europe. Sustainability 2019, 11, 3985. https://doi.org/10.3390/su11143985
AMA Style
Moagăr-Poladian S, Clichici D, Stanciu C-V. The Comovement of Exchange Rates and Stock Markets in Central and Eastern Europe. Sustainability. 2019; 11(14):3985. https://doi.org/10.3390/su11143985
Chicago/Turabian StyleMoagăr-Poladian, Simona, Dorina Clichici, and Cristian-Valeriu Stanciu. 2019. "The Comovement of Exchange Rates and Stock Markets in Central and Eastern Europe" Sustainability 11, no. 14: 3985. https://doi.org/10.3390/su11143985
Note that from the first issue of 2016, this journal uses article numbers instead of page numbers. See further details here.