Article

Clean and Green Urban Water Bodies Benefit Nocturnal Flying Insects and Their Predators, Insectivorous Bats

1
School of BioSciences, The University of Melbourne, Parkville VIC 3010, Australia
2
Ecosystem Science/Plant Ecology, Department of Ecology, Technische Universität Berlin, 12165 Berlin, Germany
3
Berlin-Brandenburg Institute of Advanced Biodiversity Research (BBIB), 14195 Berlin, Germany
4
Arthur Rylah Institute for Environmental Research, Department of Environment, Land, Water and Planning, Heidelberg VIC 3084, Australia
5
Ecology and Infrastructure International, Wantirna VIC 3152, Australia
*
Author to whom correspondence should be addressed.
Sustainability 2020, 12(7), 2634; https://doi.org/10.3390/su12072634
Submission received: 25 February 2020 / Revised: 15 March 2020 / Accepted: 18 March 2020 / Published: 26 March 2020
(This article belongs to the Special Issue Biodiversity Conservation and Sustainable Urban Development)

Abstract

:
Nocturnal arthropods form the prey base for many predators and are an integral part of complex food webs. However, there is limited understanding of the mechanisms influencing invertebrates at urban water bodies and the potential flow-on effects to their predators. This study aims to: (i) understand the importance of standing water bodies for nocturnal flying insect orders, including the landscape- and local-scale factors driving these patterns; and (ii) quantify the relationship between insects and insectivorous bats. We investigated nocturnal flying insects and insectivorous bats simultaneously at water bodies (n = 58) and non-water body sites (n = 35) using light traps and acoustic recorders in Melbourne, Australia. At the landscape scale, we found that the presence of water and high levels of surrounding greenness were important predictors for some insect orders. At the water body scale, low levels of sediment pollutants, increased riparian tree cover and water body size supported higher insect order richness and a greater abundance of Coleopterans and Trichopterans, respectively. Most bat species had a positive response to a high abundance of Lepidopterans, confirming the importance of this order in the diet of insectivorous bats. Fostering communities of nocturnal insects in urban environments can provide opportunities for enhancing the prey base of urban nocturnal insectivores.

1. Introduction

Freshwater habitats play a crucial role in the life cycle of many insects [1,2,3] which are a fundamental part of diverse food webs [4]. Orders with aquatic life stages such as flies (Diptera) and caddisflies (Trichoptera) include species that are important prey for insectivorous bats [5,6] and studies from forested and agricultural areas have shown the positive effect of water bodies on insect abundance and related insectivorous bat activity [7,8]. However, these relationships have not yet been investigated in urban areas, which is crucial in our understanding of the global phenomena of urbanisation and its impacts on animal communities [9]. In particular, urbanisation can cause various stressors to water bodies via the introduction of sediment pollution [10,11], modification or removal of vegetation and extreme fluctuations in water flow [12,13]. These activities can significantly modify and degrade invertebrate communities [14,15,16], with subsequent implications for their predators [17]. Insectivorous bats (Chiroptera) occur in urban areas globally [18,19] and depend on insect-rich feeding grounds [20]; thus, they are good model organisms for understanding the effects of anthropogenic impacts on urban water bodies and altered prey availability [21,22].
Landscape surroundings and the structure of local habitats at urban water bodies influence patterns of insect biodiversity [23,24]. At the landscape scale, urban green spaces have high value for insects [25,26] but artificial light at night can have mixed effects on nocturnal insects due to attraction, or temporal and spatial disorientation [27,28]. Further, a higher density of built structures can lead to lower insect biomass [29]. At the local scale, vegetation structure [25,30] and water quality in urban water bodies can drive patterns in insect communities [31]. For instance, while some species of non-biting midges (Diptera, Chironomidae) are less sensitive to water quality, almost all caddisflies are extremely sensitive to water pollutants [31,32]. These competing drivers of nocturnal flying insects at urban water bodies can have consequences for their nocturnal predators. In an earlier study, the presence of standing water bodies (i.e., bodies of water of any size that do not flow and are not connected to moving water) with low sediment pollution and high tree cover in unlit areas were found to be positive predictors for insectivorous bat species richness and activity in an urban environment [33]. Knowing whether these factors also influence nocturnal flying insects at urban standing water bodies can be valuable in informing effective conservation management strategies for both insects and their predators [34].
Hence, the aims of this study were to: (i) understand the importance of standing water bodies for nocturnal flying insect orders, including the landscape- and local-scale factors that drive these patterns; and (ii) quantify the relationship between nocturnal flying insects and insectivorous bats. These aims were addressed using a large-scale study in Greater Melbourne in south-east Australia, covering an area of ~10,000 km2 that incorporates a wide range of habitats, including remnant vegetation and water bodies, and supports diverse communities of both insects [35] and insectivorous bats [33,36].

2. Methods

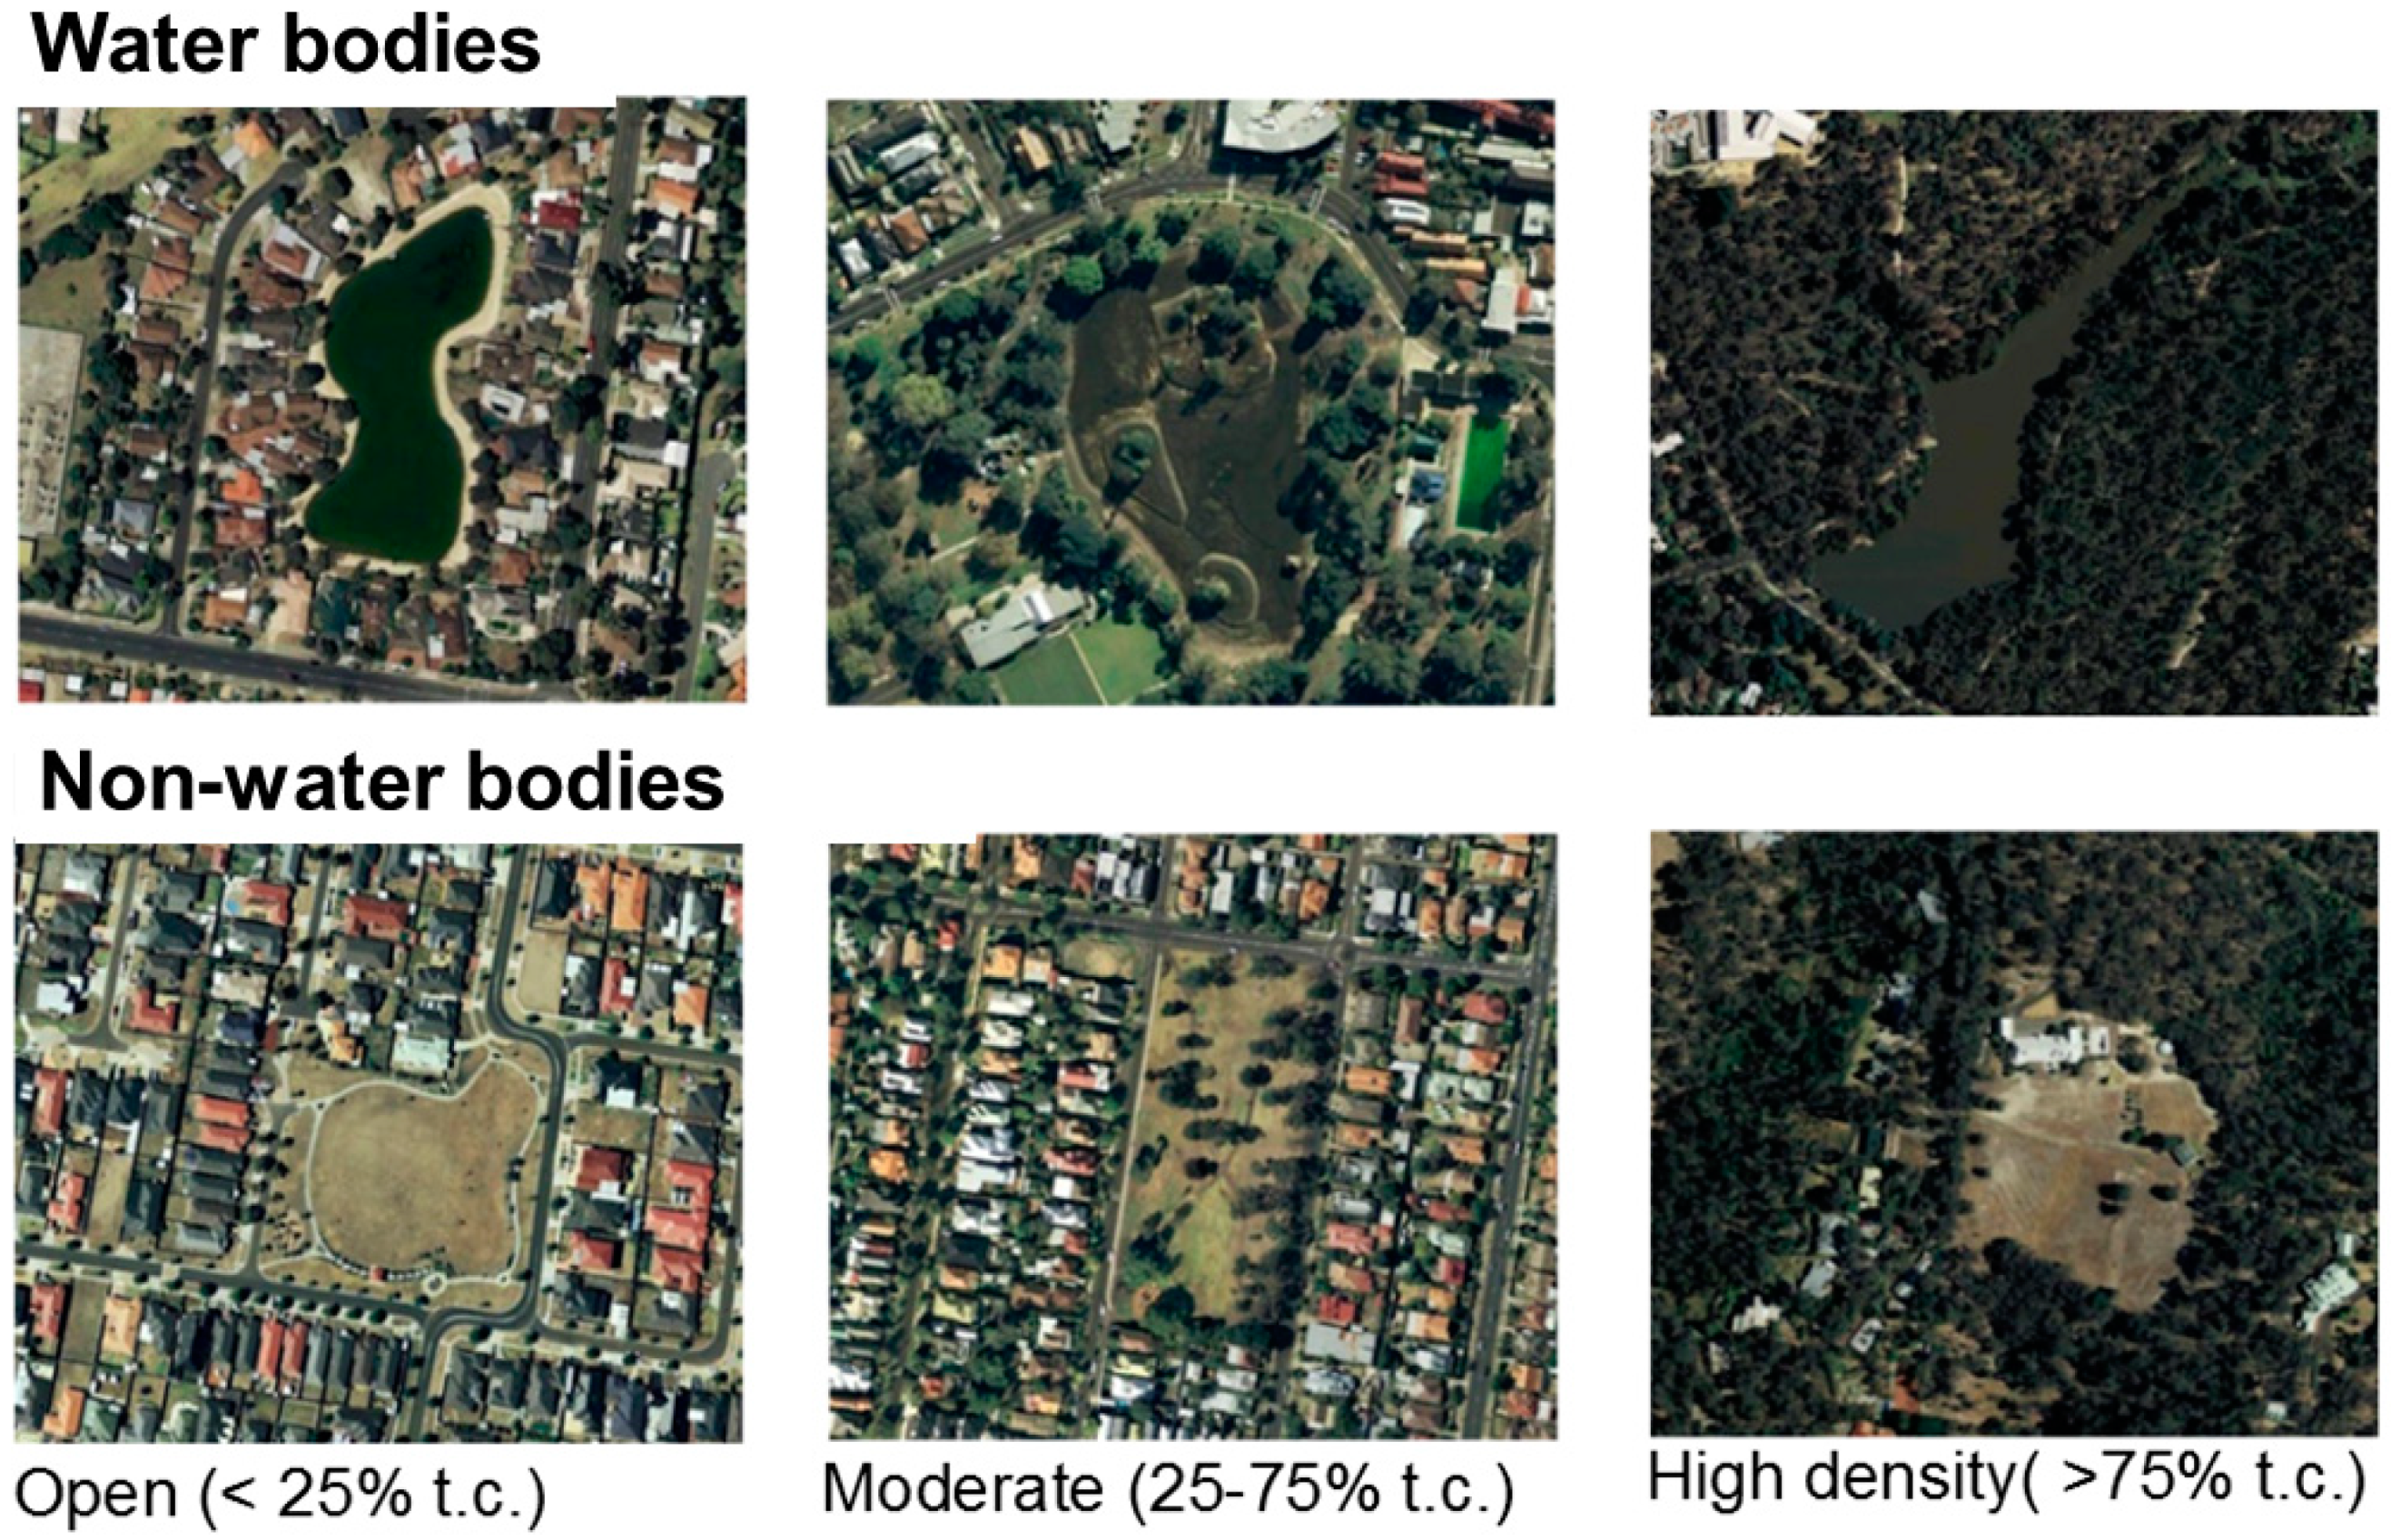
2.1. Study Area and Selection of Study Sites

Melbourne (37°48′S, 144°55′E) is a sprawling megacity of ~ 4.9 M residents in Victoria, south-east Australia and is the most rapidly growing city in Australia [37]. Melbourne has a mixture of natural, modified natural and constructed water bodies which are predominantly designed for stormwater management and flood reduction, as well as for public recreation [38]. A total of 58 standing and permanent water bodies, including lakes, ponds and wetlands were selected from an existing data set on sediment pollutants of 120 water bodies in Melbourne (V. Pettigrove, Centre for Aquatic Pollution Identification and Management, The University of Melbourne, unpublished data). These were selected in a stratification process based on their size (two categories: small < 5000 m2 and large > 5000 m2), tree coverage (three categories: water body flanked with an open < 25%, moderate 25%–75% and high density > 75% of trees), and degree of urbanisation, as well as their accessibility for this research. For the urbanisation measure, we used the length of roads (two categories: < 3000 m road length and > 3000 m road length within a 1 km circular buffer around the central points of water bodies and non-water body sites) as a proxy for anthropogenic impacts such as artificial light or street run off associated with impervious surfaces that cause pollutants to enter urban water bodies [39,40].
To determine the effect of standing water per se on the abundance and richness of orders of nocturnal flying insects, 35 urban green areas without water were also selected and paired with 35 of the 58 selected water bodies. We selected more water bodies than non-water body sites since we were interested in the local factors driving nocturnal flying insects at water bodies and due to logistical constraints to sample a similar number of non-water bodies. These ‘non-water body’ sites were ecologically similar to their paired water bodies, with the exception that they lacked water; in its place, they had an open and grassy area similar in size to the body of water. In addition, the non-water body sites had a similar density of trees surrounding the open area and also similar levels of urbanisation in the surrounding landscape as the water body sites (Figure 1). The 93 sites (58 water bodies and 35 non-water body sites) were distributed across Melbourne within 60 km of the central business district (Figure 2). Further details on the process used for site selection can be found in Straka et al. [33].

2.2. Data Collection

Nocturnal insects and bats were surveyed simultaneously at each site using light traps and bat detectors, respectively, over four nights (two consecutive nights in January/February, austral summer, and two nights in March/April, austral autumn) in 2012 or 2013. Given that insect activity decreases with declining temperatures [41], all surveys were undertaken on mild nights (> 10 °C at sunset) without rain, nights that were relatively still (i.e., where only slight movement of branches was visible; [42]). Paired water body and non-water body sites were sampled simultaneously to avoid sampling bias associated with weather conditions. If a light trap or bat detector failed at one of the paired sites, both sites were re-surveyed at the same time and during the same season.
Light traps (20 L buckets with two 12 volt 8 W fluorescent tubes—one black/UV tube and one white tube) were used to survey nocturnal flying insects [43,44]. Light traps were set on a timer and operated for 3.5 h starting at sunset and again for 2 h before sunrise in order to investigate insect availability at the time when bat activity was expected to peak (after dusk and before dawn; [45]). Light traps were set within 2 m of the edge of the water bodies or at the edge of the open area of the non-water body sites, and in both cases close to dense vegetation (i.e., shrubs or trees). Sites with streetlights were avoided to control for the impact of local artificial light on insects. If light sources were present, light traps and bat detectors were set up at the furthest possible point (> 10 m) from other light sources. Collected insects were stored in 75% ethanol for later sorting and identification. Specimens were identified to order using relevant keys [46]. Insects captured during the two consecutive nights within a season were pooled for statistical analyses. While light traps may not attract all insect orders [47], they capture most of the known prey items for insectivorous bats, including beetles, moths, mosquitoes, flies, midges, bugs and wasps (see Supplementary Materials Table S1).
Bat detectors (Anabat SD1; Titley Electronics, Ballina, Australia) were set up inside a possum nest box (to provide protection and security) and placed on a tree trunk 3 m above the ground. At all sites, light traps and bat detectors were set at least 5 m apart [48]. Bat calls were analysed using AnaScheme software and a regional identification key; with species identification only undertaken for recordings with ≥ five good-quality pulses, and where > 50% of pulses were identified as the same species [43,49]. Bat activity was defined as the number of bat passes (i.e., a series of echolocation pulses recorded on the detector when a bat flies past the microphone). Recordings with fewer than five pulses, or where no singular species was identified with > 50% of calls, were classified as ‘unknown’ and included in the measure of total bat activity [43].
During surveys, data loggers (HOBO U23 Pro v2: Onset Computer Corporation Inc., Bourne MA), attached to the nest boxes housing the Anabats, were used to measure the ambient temperature between sunset and sunrise at 15 min intervals. The average temperature was calculated for each survey night (the average nocturnal temperature for all nights sampled was 17.7 °C). Given that moon phase can influence both bat and insect activity [50], moon phase was categorised for each survey as either ‘full moon’ (the night of a full moon and the four nights either side of it) or ‘new moon’ (all other nights).

2.3. Landscape- and Water Body Scale Variables

Two landscape-scale variables were calculated around the centre point of each study site using ArcGIS version 10 (ESRI, Redlands, CA) within 500 m, 1 km and 2 km radii, namely (1) mean Normalised Difference Vegetation Index (NDVI) as a proxy for vegetation greenness, [51] and (2) Visible Near Infrared (VNIR) as a proxy for artificial light at night (see Supplementary Materials Table S2 for data on landscape variables).
Variables measured at each water body included tree cover, understorey vegetation, and emergent aquatic vegetation. Tree cover and understorey vegetation were assessed within 5 m of the water body edge. Tree cover was described as the percent coverage of riparian trees flanking the water body borders and understorey vegetation as percent coverage of reeds and shrubs > 50 cm high. Aquatic vegetation was defined as the percentage of emergent aquatic vegetation covering the water body surface. All three types of vegetation were given a score of 0 to 1, representing absent to 100% cover, respectively. In addition, sediment pollution of each water body was assessed by calculating a sediment quality quotient (SQQ) following Stokeld et al. [52] from the already existing raw data set of heavy metals in the sediment of each water body (V. Pettigrove, Centre for Aquatic Pollution Identification and Management, The University of Melbourne, unpublished data). A low SQQ refers to low levels of heavy metals in the sediment, while a high SQQ refers to high levels of heavy metals with potential degrading biological effects (based on the interim sediment quality guidelines from the National Water Quality Management Strategy, ANZECC and ARMCANZ 2000; following Stokeld et al. [52,53]). Several chemical and permanent organic nutrients impact aquatic macroinvertebrate fauna and subsequently food webs [54]. Sediment pollution has, however, also been shown to be a useful measure for direct effects on the occurrence and abundance of macroinvertebrates in water bodies associated with urbanisation [15,31,55]. Water body size was calculated using ArcGIS version 10 and encompassed the whole water body, including areas covered by emergent aquatic vegetation. Further details of the assessment of water body variables can be found in Straka et al. [33].

2.4. Data analyses and Model Selection

Generalised linear mixed models (GLMMs) with Poisson error distributions and log links were fitted using the ‘glmer’ function from the ‘lme4′ package [56] in R (v. 3.0.1, R Development Core Team, 2013) with site treated as a random effect to characterise unmodelled variation among sites. To understand the importance of water bodies and factors influencing nocturnal flying insects (based on the data set of 58 water bodies and 35 non-water body sites), we used richness and abundance patterns of the most frequently captured insect orders (with ≥ 10% of total abundance across all sites) as response variables and ’habitat’ (water body/non-water body site), NDVI and VNIR as explanatory variables. To visualise the differences between insects at water bodies and non-water bodies, we present boxplots using the data provided in Supplementary Materials Table S3, and used an independent t-test to compare abundance or order richness between both habitats, based just on the data from paired sites.
In an initial exploratory analysis, impervious surface, NDVI and VNIR were fitted at the three spatial scales (within a radius of 500 m, 1 km and 2 km) against insect abundance and order richness data. Based on the lowest Akaike Information Criterion corrected for small sample size (AICc) [57], NDVI and VNIR at a radius of 500 m were found to be the best fit for species richness and abundance across the studied water bodies. Since no correlations between explanatory variables were found (r < 0.7 and > −0.7, Spearman for all continuous variables and polyserial for the continuous variable VNIR and categorical variable moon, see Supplementary Materials Table S4), they could be included together in the subsequent modelling. Hence, the full landscape-scale model included five candidate variables including ambient conditions (temperature and moon): ‘habitat’, ‘NDVI’ (500 m), ‘VNIR’ (500 m), with temperature and moon phase as fixed factors focusing on the water body (n = 58 sites) and non- water body site data (n = 35 sites). The full water body model included seven candidate variables: tree cover, understorey vegetation, emergent aquatic vegetation, heavy metal pollution (SQQ), water body size, temperature and moon phase, using the water body data (n = 58 sites). For both the landscape and water body models an information-theoretic approach was taken for model selection using a reverse stepwise model reduction procedure, based on AICc [58] (see Supplementary Materials Table S5). We further calculated the predictive power for each model, assuming that a high percentage of explained deviance reduction (deviance reduction: [(null deviance−deviance of final model)/null deviance] × 100) indicated a good model fit [59].
To test the relationship between nocturnal insects and insectivorous bats, we ran separate GLMM analyses with bat species richness, total bat activity and activity of the six most frequently recorded bat species (Chalinolobus gouldii, Chalinolobus morio, Austronomus australis, Vespadelus darlingtoni, Vespadelus vulturnus and Vespadelus regulus) separately as response variables, and included the landscape variables, insect order richness, the abundance of Coleoptera, Diptera, Lepidoptera and Trichoptera and the three landscape variables (habitat, NDVI and VNIR) as fixed effects. Since total insect abundance was highly correlated with the abundance of Coleoptera, Diptera, Lepidoptera and Trichoptera (r > 0.7, Spearman, see Supplementary Materials Table S4), we excluded it from the model. Model selection followed the same steps as for the landscape and water body models and included all fixed effects in the full model. All numeric variables were centered and standardised (mean of zero and standard deviation of one) to improve convergence of the fitting algorithm and so that the estimated coefficients were on the same scale, allowing for comparison of effect sizes [60]. We expected approximately linear relationships between the dependent and independent variables in each model within the range of our data, and so no non-linear fits were tested in the variable selection process.

3. Results

In total, we collected 38,765 insect specimens belonging to 16 orders at the 93 study sites. The most abundant insect order was Lepidoptera (moths, 31%), followed by Coleoptera (order includes beetles and weevils, 20%), Diptera (flies and mosquitoes, 16%), and Trichoptera (caddisflies, 14%), which are all known to be important bat prey (Supp. Material Table S1). The orders of the remaining insects (19%) are shown in the Supplementary Materials Table S5. When looking at the most captured orders of insects (> 10%) at the paired sites (35 non-water bodies and their matching 35 water bodies, Figure 3), Dipterans (t (140) = 3.22, p < 0.01) and Trichopterans (t (140) = 2.10, p < 0.05) were significantly more abundant at water bodies compared to non-water body sites, while the abundance of Coleoptera (t (140) = 0.42, p = 0.67) and Lepidoptera (t (140) = −0.14, p = 0.89) as well as order richness (t (140) = 1.42, p = 0.16) and total abundance (t (140) = 1.57, p = 0.11) did not significantly differ when only considered at paired sites.

3.1. Landscape Factors Driving Nocturnal Flying Insects in the Urban Environment

Models of the influence of landscape variables on species abundance and community richness ranged in their deviance reductions between 15.3% (total insect abundance) and 52.7% (Coleoptera abundance) and hence, explained a moderate to high amount of the variation. At the landscape scale, there was a significant negative association between the absence of a water body and the abundance of Trichoptera (−2.60 ± 0.50), Diptera (−1.69 ± 0.31) and in contrast to the t-test above, also on total insect abundance (−0.82 ± 0.36), while smaller and non-significant associations were found for the remaining insect orders and richness (Table 1).
Model estimates indicated a positive and significant effect of increasing levels of Normalised Difference Vegetation Index (NDVI, which ranged from 0.22 to 0.63 units) on the abundance of Diptera and Coleoptera, total insect abundance and insect order richness (Table 1). In contrast, Visible Near Infrared (VNIR, which ranged from 11 to 63 units) did not show any significant predictive potential on insects and showed high uncertainty (Table 1). Insect order richness was predicted to increase more than twice (from 3.4 orders to 7.3), abundance of Coleopterans more than eight times (from 3.4 to 28.3 individuals), abundance of Dipterans more than four times (from 9.5 to 40.8) and total insect abundance more than seven times (from 34.2 to 260.4 individuals) with increasing levels of the modelled range of NDVI. The average nightly temperature had a positive significant effect on the abundance of all insect orders (except for Coleopterans) and total insect abundance (Table 1). Total insect abundance and the abundance of all of the insect orders (except for Trichoptera, i.e., negative effect and Coleoptera) were significantly highest during the full moon phase.

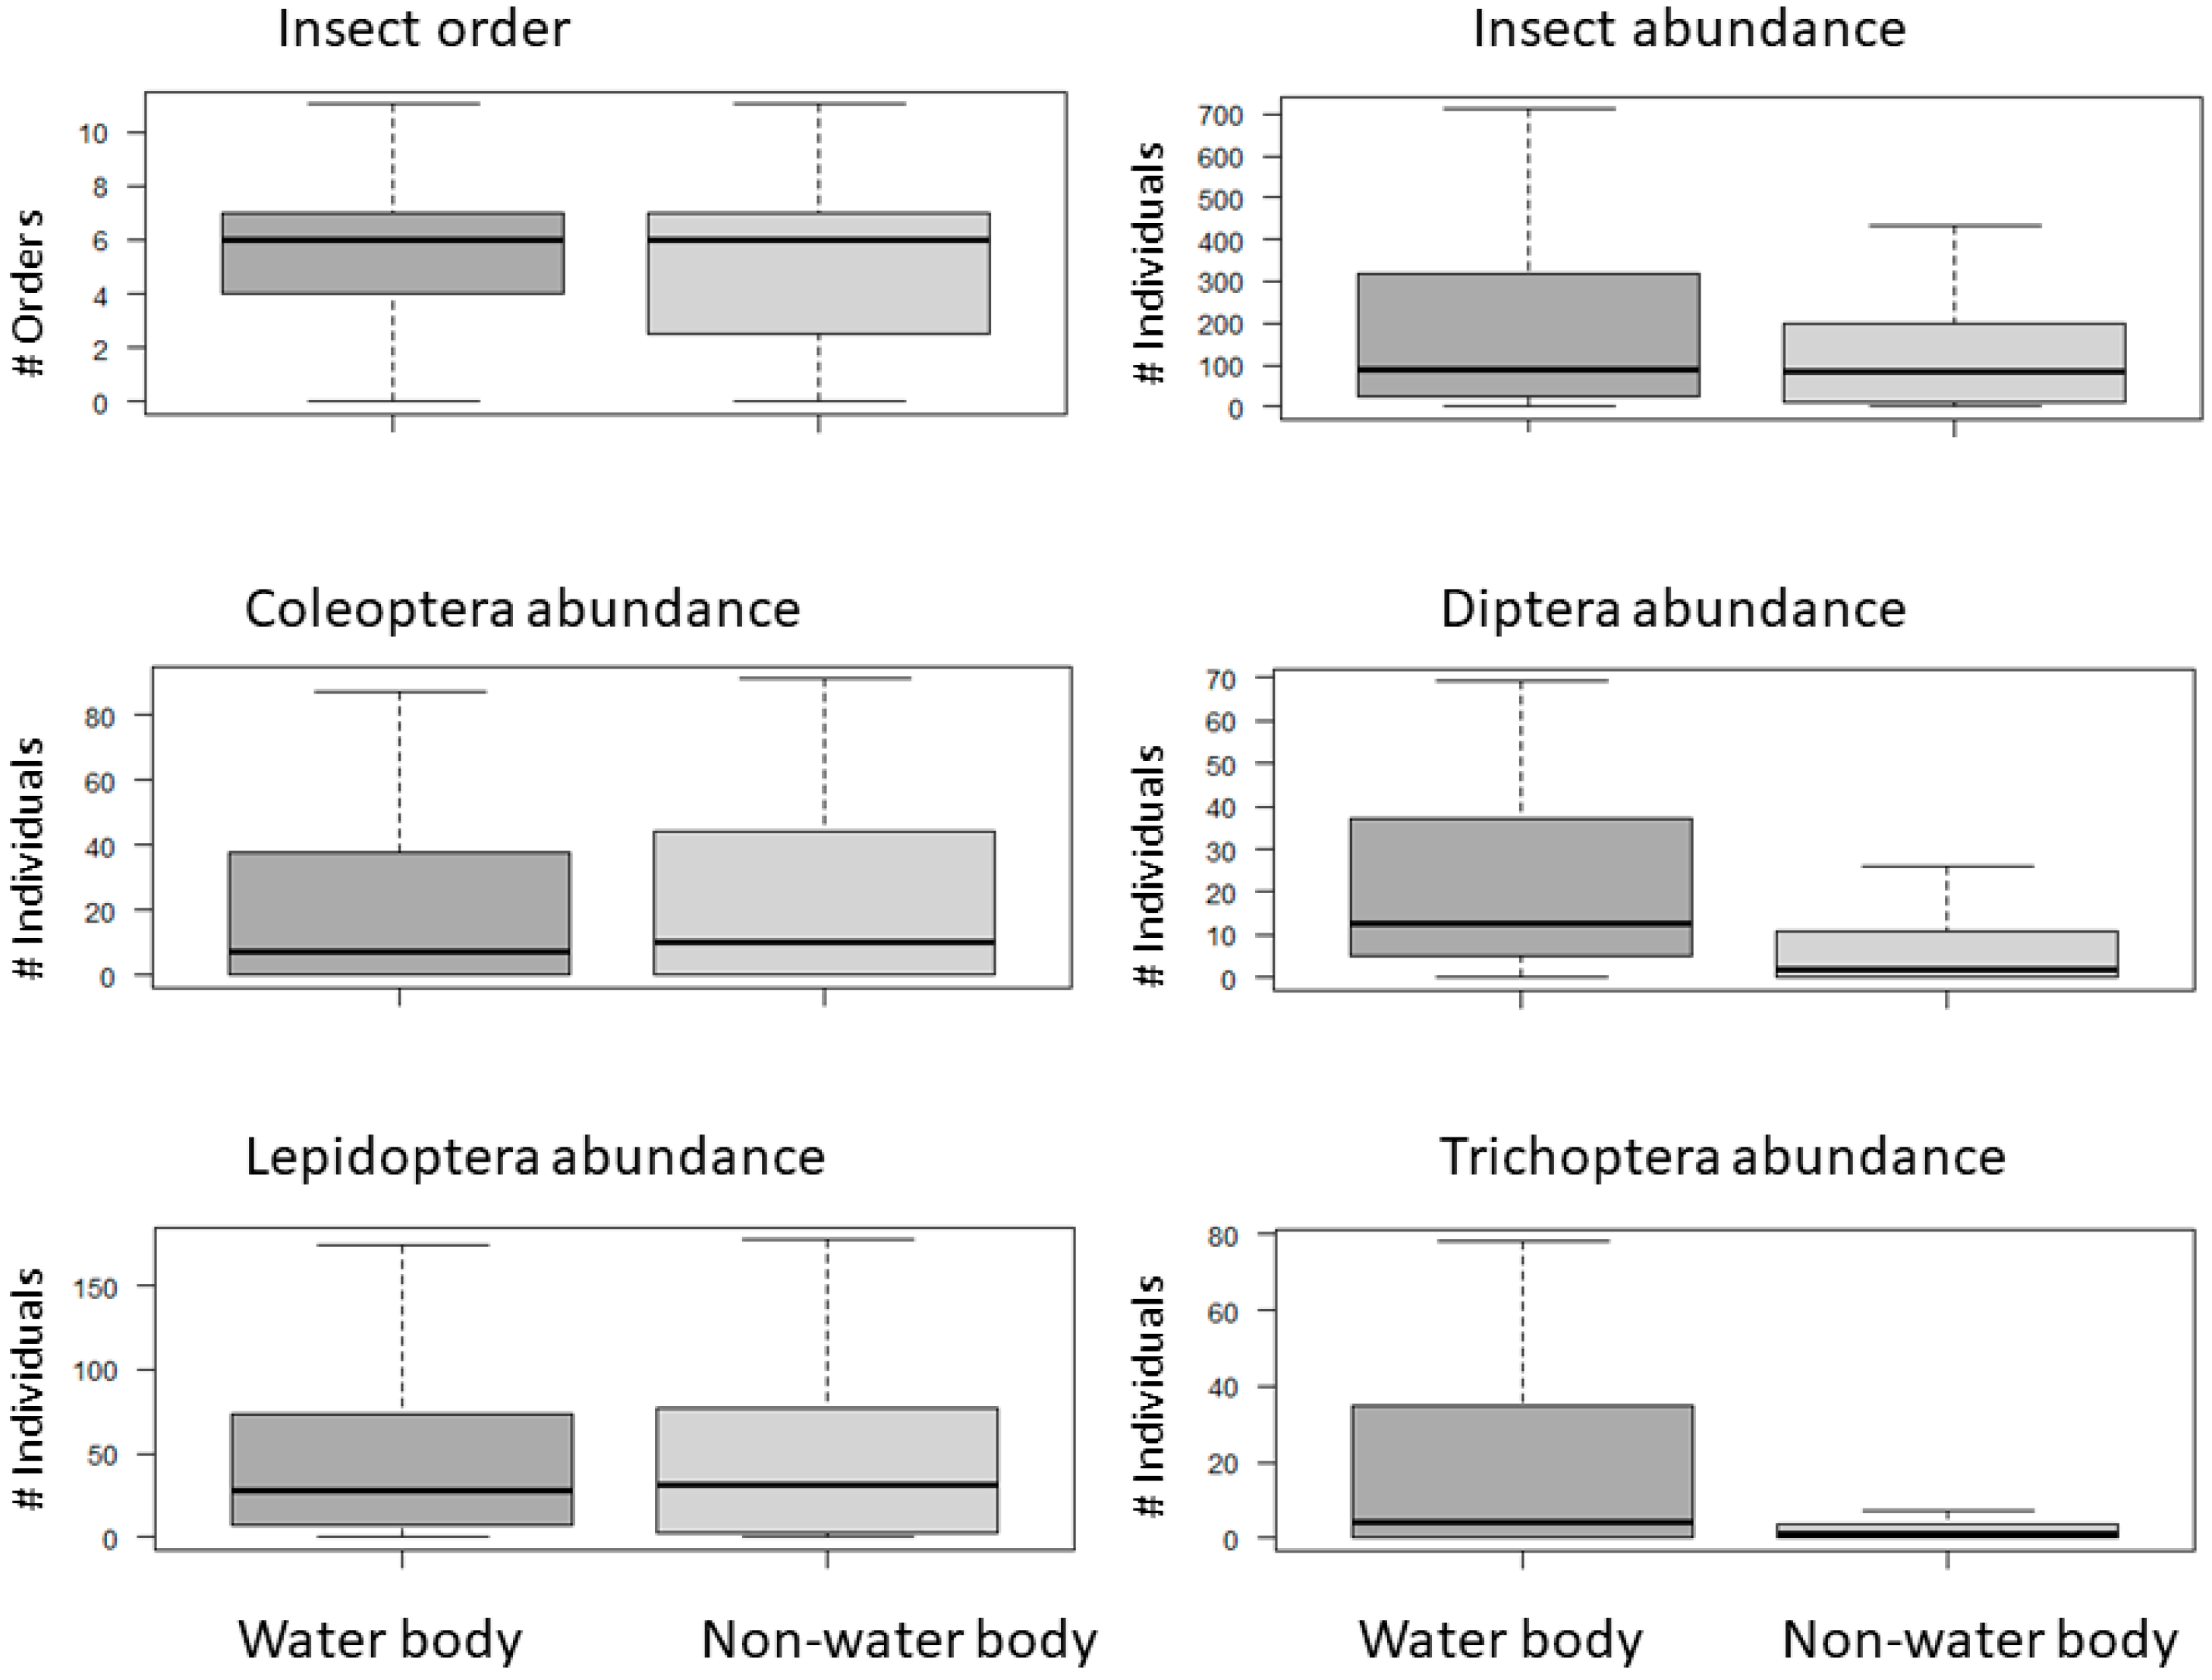
3.2. Water Body Characteristics Driving Nocturnal Flying Insects

Deviance reduction of water body models ranged from 38.6% (Diptera) to 61.4% (Coleoptera) (Table 2). Sediment quality quotient (SQQ) was only significant for insect order richness. With increasing levels of SQQ (ranging from 0 to 10.43), insect order richness was predicted to decrease from 7.5 to 4.8 orders. Tree cover was a significant predictor for the abundance of Coleopterans. With increasing tree cover from 0 to 100%, Coleoptera abundance was predicted to increase from 4.3 to 10.0 individuals. Water body size appeared to be a significant predictor for the abundance of Trichoptera (increased from 5.8 to 305.6 individuals with increasing water body size from 0.02 ha to 60.6 ha). Although understorey vegetation remained after the AICc selection process in the model for Coleoptera abundance, this effect was non-significant. Aquatic vegetation did not predict the abundance of any insect order nor on insect order richness or total abundance (see Supplementary Materials Table S5).
Similar to the landscape model, the average nightly temperature had a significant and positive effect on the abundance of all insect orders (except for Trichoptera), total insect abundance and insect order richness (Table 2). Total insect abundance and the abundance of all insect orders (except for Trichoptera) were significantly highest during the full moon phase.

3.3. Relationship between Insect Order Richness and Insectivorous Bat Species Richness and Activity

A total of 24,705 bat passes were recorded across all sites from twelve bat species or species complexes. Results specific to the activity and species richness of bats are reported in Straka et al. [33]. Deviance reduction was moderate to high for models with bats, insects and landscape variables, ranging from 25.1% (bat species richness) to 44.0% (Austronomus australis).
The landscape variable NDVI had a stronger positive and significant effect on bat activity than the abundance of insect orders, except for C. gouldii, and was the only significant predictor for bat species richness (Table 3). The absence of a water body only had a negative significant effect on total bat activity, while there were no significant effects associated with light (VNIR).
A significant positive association was found between the abundance of Lepidopterans and the activity of four out of the six most commonly recorded bat species (A. australis, C. gouldii, C. morio, V. vulturnus) and total bat activity (Table 3). Similarly, a significant positive relationship was found between insect order richness and the activity of three bat species (C. gouldii, V. darlingtoni and V. regulus) and total bat activity. A high abundance of Trichopterans showed a significant association with the activity of three bat species (A. australis, V. regulus and V. darlingtoni) and a high abundance of Dipterans with the activity of two bat species (A. australis and C. gouldii) and total bat activity. A high Coleopteran abundance showed a positive significant association only with the activity of two bat species (C. morio and V. vulturnus). In contrast, there was either zero, or between one (Lepidoptera) and four (Trichoptera) negative associations between insect order abundance and bat species richness (see Supplementary Materials Table S6 for detailed effect sizes and standard errors).

4. Discussion

Invertebrates form the prey base for a wide range of insectivores, but there are gaps in our understanding of the mechanisms driving the diversity and abundance of nocturnal flying insects at urban water bodies and the potential consequences for their predators, such as bats. While it is not too surprising that the presence of water had a significant positive effect on total insect abundance and the abundance of Trichopterans and Dipterans at the landscape scale, this also has consequences for nocturnal insectivorous predators feeding on these orders. At the landscape scale, high levels of surrounding greenness (measured by NDVI) were an important predictor for nocturnal flying insects, while at the water body scale low levels of sediment pollution, a high cover of riparian trees and water body size supported higher insect order richness, the abundance of Coleopterans and Trichopterans, respectively.

4.1. Landscape Factors Driving Nocturnal Flying Insects in the Urban Environment

With the landscape model, we found that the presence of water was a significant predictor for the abundance of Trichoptera and Diptera and insect abundance (although not significant when only compared between paired sites). Both orders, Trichoptera and Diptera, require a moist or aquatic habitat for their larval stages [2,3] and are important components of urban water quality assessments such as the EPT taxa (Ephemeroptera, Plecoptera and Trichoptera) group [61,62,63]. The two orders, Lepidoptera and Coleoptera, did not show significant associations with the presence of water, while urban greenness was a strong positive predictor for the abundance of Coleoptera. Overall, the key landscape-scale driver of insect availability at both water bodies and non-water bodies was a high degree of urban greenness, measured in this study as Normalised Difference Vegetation Index (NDVI). Although NDVI is a broad measure of greenness, it generally provides a good proxy of productivity [64] and insect activity [51] due to the predominance of phytophagy amongst insects [65]. Increasing the amount of urban green habitats is suggested to be the most important strategy to provide habitat not only for flying insects (e.g., [66]), but also for urban biodiversity in general [67]. Interestingly, artificial light at night (using VNIR as a proxy) did not show any significant effect on the abundance of all insect orders and order richness. A previous review showed that responses of nocturnal flying insects to artificial light at night can be mixed [28]. For instance, the effect of artificial light at night on nocturnal insects is influenced by the different light spectra, with UV streetlights having the greatest effect on abundance and diversity [68,69]. Most of these studies used smaller scales such as in the immediate surrounding area (e.g., 50 m buffer; [68]) or light coming from streetlights directly [70]). Hence smaller spatial scales and the differentiation of light types might be a better measure for understanding the effect of artificial light at night on nocturnal flying insects.

4.2. Water Body Characteristics Driving Nocturnal Flying Insects

The cover of riparian trees surrounding the water bodies was a strong and significant driver for the abundance of Coleoptera while not significant for other insect orders. As earlier studies have shown at streams, riparian trees provide multiple benefits for insects, ranging from the provision of foraging areas to favourable microclimatic conditions [70] and aid the conservation of biodiversity in freshwater habitats [71]. Riparian trees foster a greater biomass of benthic invertebrates [72], and a higher diversity of aquatic adult insects [73] but also benefit terrestrial invertebrates [74]. The degree to which insects are dependent on riparian trees is species specific [75] and while these studies have focused on stream vegetation, our results show that maintaining and restoring riparian vegetation at standing urban water bodies support Coleopteran abundance. Pollution of water body sediments by heavy metals, for which we used SQQ as a proxy, had a significant negative effect on insect order richness. Interestingly, SQQ did not show significant effects on Trichopterans or Dipterans. Trichopterans are often used for water quality assessments because of their pollution sensitivity, and they are also used for stormwater runoff assessments in urban water bodies [62,76]. Similarly, families within the order Diptera (such as Chironomids) are commonly used as bioindicators for water quality with some species thriving in polluted sites, while others do not [77]. Direct comparisons between this study and other studies investigating water quality and insects should be considered with caution due to differences in sampling methods and the focus on flying adult insects in our study. The assessment of macroinvertebrates as bioindicators for water bodies is normally done directly by sampling from the sediment or in the water [31,62] but see [78] for exception. Water body size was found in this study to be an important predictor for Trichopterans, which aligns with a study from Stockholm, Sweden, in which the size of urban ponds was positively correlated with the richness of Trichopterans [79].
As expected, temperature and moon phase influenced the number of insects caught and, as with previous studies, most insect orders were more active on warm nights [41]. However, we found mixed responses to the full moon. A greater number of insect orders and higher total insect abundances were caught during the full moon phase, while Trichopterans were caught less frequently. Bright moonlight can encourage insects to be active for mating and reproduction and also competes with streetlights as well as the light from the traps [50]. Earlier studies found fewer insects using light traps during the full moon phase [50,80]. We did not take into account other meteorological factors such as cloud cover or wind speed during trapping nights which also influence the effectiveness of light traps [41,50]. Hence, insect responses towards moon light should be considered with caution, since they cannot be clearly disentangled from other environmental factors.

4.3. Relationship among Insects, Landscape Variables and Insectivorous Bats

The activity of most bat species (four of six) was positively associated with the abundance of Lepidopterans, confirming the important role that this order plays in the diet of bats (see Supplementary Materials Table S1). Interestingly, while Coleopterans are also important prey for many bat species (see Supplementary Materials Table S1), our results showed a positive link only with the activity of two bat species (Table 3). The analysis of relationships between insects and bats provides some indication of a predator-prey relationship [81]. However, previous dietary studies have shown that V. vulturnus feeds on Dipterans [82], whereas our study found a negative relationship between the two. Further, our results suggest a strong relationship between the activity of V. darlingtoni and the abundance of Trichopterans. However, little is known about the role of Trichopterans in the diet of bats in Australia, partially due to their poor taxonomic representation in genetic reference databases used in molecular dietary analyses [83] and also the limitations of traditional dietary analysis techniques such as visual observations of semi-digested fragments in stomach or faeces [84]. Dietary analyses are required to gain a more insightful understanding of the predator-prey relationship between bats and insects [82]. Our results also revealed that high levels of NDVI (urban greenness) are not only crucial for insects (as discussed above), but also for bats, and (with the exception of C. gouldii) NDVI was interestingly a stronger predictor of bat species activity than the abundance of insects. This suggests that urban green areas do not only serve as foraging grounds for bats but also as commuting and roosting grounds if trees are available. This is an interesting addition to our earlier study on bats, which did not include NDVI [33].

4.4. Implications for Insectivorous Bats

Different species of insectivorous bats vary in their dietary range (see Supplementary Materials Table S1) and are considered good bioindicators because they reflect the productivity of insect communities [21]. Our landscape-scale findings are in accordance with studies that have shown that bat species, particularly the ones that feed on insects such as Dipterans or Trichopterans, might benefit particularly from sites with water and the maintenance of large areas of urban greenness [25,26,29,85]. At the water body scale, riparian trees are not only associated with higher Coleoptera abundance, but also benefit insectivorous bats by providing roost sites [86] and shelter against wind or predators [87]. Further, our results indicate that urban water bodies with high sediment pollution generally support fewer insect orders, which we would expect to limit prey availability for some insectivorous bat species with less dietary flexibility. An additional concern for bats feeding on prey insects from polluted sites is that heavy metals can accumulated in these [88,89] which could subsequently lead to higher metal concentrations in bat tissues such as the kidney and liver [17]. Although the potential effect of aquatic insects in which heavy metals are accumulated has not yet been fully investigated in bat dietary studies, it is likely that there are negative long-term health effects on bats [17]. We did not measure body size or biomass of insects in our study. However, given the lower energy profitability of smaller Dipterans such as mosquitoes, it is known that bats need to feed on more small Dipterans than Lepidopterans to meet their required energy demands; though dietary preferences are also bat species specific [83] and Dipterans can also vary in their size.
As models explained a moderate to high amount of the variation in order abundance, it is reasonable to assume that the associations we observed are providing reliable indicators of the key drivers. However, there are also clearly other factors not captured by our analyses that may be influential. Further, we are aware that the landscape variables we derived in ArcGIS such as NDVI and VNIR, as well as the local variables such as water body pollution (SQQ), were acting as proxies in our analyses to explain the landscape and local environment of a water body, and it is likely that some of these measures (such as urban greenness) may have differed between our two sample periods.

5. Conclusions

This study has shown that urban green spaces containing water bodies with fringing trees and low levels of sediment pollution provide quality habitats for a variety of nocturnal flying insect orders, which in turn significantly increases the habitat quality for bats. The most captured insect orders in this study (Coleoptera, Diptera, Lepidoptera and Trichoptera) are important dietary components of bats, although knowledge about the role of Trichopterans in Australian bat diets is still lacking. Nevertheless, these results have implications for the management of bat prey in urban environments. Our findings stress the importance of low sediment pollution for insect order richness, riparian trees for Coloepterans and size for Trichopterans at standing water bodies. While light has proven to be a crucial factor in influencing bat activity at these sites [33], light pollution was not found to be a significant predictor for nocturnal flying insect orders in this study. Lastly, although insects might not be a taxon which is valued or appreciated by many people in urban environments [90], nevertheless, they provide a vital contribution to biodiversity in cities globally given their important roles ranging from acting as pollinators, to decomposers, to forming prey for a variety of wildlife [91,92,93]. Hence, fostering communities of nocturnal flying insects in urban environments will not only contribute to the conservation of their nocturnal predators, such as insectivorous bats, but also contribute to human well-being to some extent [94]. This is particularly crucial in a time which is considered as an era of insect crisis [95,96].

Supplementary Materials

The following are available online at https://www.mdpi.com/2071-1050/12/7/2634/s1, Table S1: Invertebrate orders in the diet of bats known to occur in Melbourne, Australia (list based on data from the Victorian Biodiversity Atlas, Department of Environment, Land, Water and Planning, Victoria), Table S2: Landscape-scale measures of urbanization, Table S3: Nocturnal flying invertebrates captured at water body and non-water body sites, Table S4: Correlation for explanatory variables in landscape, water body and bat-insect models, Table S5: Model selection results for landscape, water body and bats and insects models, Table S6: Parameter effect sizes (± SE) for fixed factors (Diptera, Coleoptera, Lepidoptera, Trichoptera, Insect order richness, Habitat, NDVI and VNIR) and site as random effect derived from Poisson GLMMs.

Author Contributions

Conceptualization, T.M.S., L.F.L., and R.v.d.R.; Methodology, T.M.S., L.F.L. and R.v.d.R.; Formal Analysis, T.M.S., P.E.L. and B.A.W.; Investigation, T.M.S.; Writing—Original Draft Preparation, T.M.S.; Writing—Review & Editing, P.E.L., L.F.L., B.A.W., R.v.d.R. and S.B.; Visualization, T.M.S.; Supervision, P.E.L., L.F.L., B.A.W. and R.v.d.R.; Funding Acquisition, T.M.S., L.F.L., B.A.W. and R.v.d.R. All authors have read and agreed to the published version of the manuscript.

Funding

This research project was funded by Albert Shimmins Award, Australian Research Council (ARC) linkage grant (LP0990359), Holsworth Wildlife Research Endowment, Melbourne Water and The Baker Foundation. P.E.L. was funded through the National Environmental Research Program (NERP), and B.A.W. was supported by an ARC Future Fellowship (FT100100819). Funding sources had no intellectual involvement in this study.

Acknowledgments

We would like to thank Luis Mata for his support with the insect identification, Sarah Mitchell for her assistance with sorting insects, and Julia Stammers for proof reading earlier drafts. We further thank Vincent Pettigrove for sharing his data set on heavy metal pollutants in the sediments of our water bodies. We also thank icons8 for their icons in Table 1 and Table 2.

Conflicts of Interest

The authors declare no conflict of interest.

References

  1. Batzer, D.P.; Wissinger, S.A. Ecology of insect communities in nontidal wetlands. Annu. Rev. Entomol. 1996, 41, 75–100. [Google Scholar] [CrossRef]
  2. Colless, D.H.; McAlpine, D.K. Diptera. In The Insects of Australia: A Textbook for Students and Research Workers, 2nd ed.; Naumann, I.D., Came, P.B., Lawrence, J.F., Nielsen, E.S., Spradbery, J.P., Taylor, R.W., Whitten, M.J., Littlejohn, M.J., Eds.; Melbourne University Press: Melbourne, Australia; Cornell University Press: Ithaca, NY, USA, 1991; Volume 1, pp. 717–786. [Google Scholar]
  3. Neboiss, A. Trichoptera. In The Insects of Australia: A Textbook for Students and Research Workers, 2nd ed.; Naumann, I.D., Came, P.B., Lawrence, J.F., Nielsen, E.S., Spradbery, J.P., Taylor, R.W., Whitten, M.J., Littlejohn, M.J., Eds.; Melbourne University Press: Melbourne, Australia; Cornell University Press: Ithaca, NY, USA, 1991; Volume 1, pp. 787–816. [Google Scholar]
  4. Warren, P.H. Spatial and temporal variation in the structure of a freshwater food web. Oikos 1989, 55, 299–311. [Google Scholar] [CrossRef]
  5. Racey, P.A.; Swift, S.M. Feeding ecology of Pipistrellus pipistrellus (Chiroptera: Vespertilionidae) during pregnancy and lactation. I. Foraging behaviour. J. Anim. Ecol. 1985, 45, 205–215. [Google Scholar] [CrossRef]
  6. Wickramasinghe, L.P.; Harris, S.; Jones, G.; Jennings, N.V. Abundance and species richness of nocturnal insects on organic and conventional farms: Effects of agricultural intensification on bat foraging. Conserv. Biol. 2004, 18, 1283–1292. [Google Scholar] [CrossRef]
  7. Vindigni, M.A.; Morris, A.D.; Miller, D.A.; Kalcounis-Rueppell, M.C. Use of modified water sources by bats in a managed pine landscape. Forest Ecol. Manag. 2009, 258, 2056–2061. [Google Scholar] [CrossRef]
  8. Stahlschmidt, P.; Pätzold, A.; Ressl, L.; Schulz, R.; Brühl, C.A. Constructed wetlands support bats in agricultural landscapes. Basic Appl. Ecol. 2012, 13, 196–203. [Google Scholar] [CrossRef]
  9. Piano, E.; Souffreau, C.; Merckx, T.; Baardsen, L.; Backeljau, T.; Bonte, D.; Brans, K.I.; Cours, M.; Dahirel, M.; Debortoli, N.; et al. Urbanization drives cross-taxon declines in abundance and diversity at multiple spatial scales. Glob. Chang. Biol. 2019. [Google Scholar] [CrossRef]
  10. Göbel, P.; Dierkes, C.; Coldewey, W.G. Storm water runoff concentration matrix for urban areas. J. Contam. Hydrol. 2007, 91, 26–42. [Google Scholar] [CrossRef]
  11. Pettigrove, V.; Hoffmann, A. Impact of urbanisation on heavy metal contamination in urban stream sediments: Influence of catchment geology. Australas. J. Ecotoxicol. 2003, 9, 119–128. [Google Scholar]
  12. Ehrenfeld, J.G. Exotic invasive species in urban wetlands: Environmental correlates and implications for wetland management. J. App. Ecol. 2008, 45, 1160–1169. [Google Scholar] [CrossRef]
  13. Owen, C. Hydrology and history: Land use changes and ecological responses in an urban wetland. Wetl. Ecol. Manag. 1998, 6, 209–219. [Google Scholar] [CrossRef]
  14. Lundquist, M.J.; Zhu, W. Aquatic insect functional diversity and nutrient content in urban streams in a medium-sized city. Ecosphere 2018, 9, e02284. [Google Scholar] [CrossRef]
  15. Pettigrove, V.; Hoffmann, A. A field-based microcosm method to assess the effects of polluted urban stream sediments on aquatic macroinvertebrates. Environ. Toxicol. Chem. 2005, 24, 170–180. [Google Scholar] [CrossRef] [PubMed]
  16. Walsh, C.J.; Sharpe, A.K.; Breen, P.F.; Sonneman, J.A. Effects of urbanization on streams of the Melbourne region, Victoria, Australia. I. Benthic macroinvertebrate communities. Freshw. Biol. 2001, 46, 535–551. [Google Scholar] [CrossRef]
  17. Naidoo, S.; Vosloo, D.; Schoeman, M.C. Foraging at wastewater treatment works increases the potential for metal accumulation in an urban adapter, the banana bat (Neoromicia nana). Afr. Zool. 2013, 48, 39–55. [Google Scholar] [CrossRef]
  18. Jung, K.; Threlfall, C.G. Urbanisation and its effects on bats—A global meta-analysis. In Bats in the Anthropocene: Conservation of Bats in a Changing World; Voigt, C.C., Kingston, T., Eds.; Springer: Cham, Switzerland, 2016; pp. 13–33. [Google Scholar]
  19. Russo, D.; Ancillotto, L. Sensitivity of bats to urbanization: A review. Mamm. Biol. 2015, 80, 205–212. [Google Scholar] [CrossRef]
  20. Jong, J.; Ahlén, I. Factors affecting the distribution pattern of bats in Uppland, central Sweden. Ecography 1991, 14, 92–96. [Google Scholar] [CrossRef]
  21. Jones, G.; Jacobs, D.S.; Kunz, T.H.; Willig, M.R.; Racey, P.A. Carpe noctem: The importance of bats as bioindicators. Endanger. Species Res. 2009, 8, 93–115. [Google Scholar] [CrossRef] [Green Version]
  22. Russo, D.; Jones, G. Bats as bioindicators: An introduction. Mamm. Biol. Z. Säugetierkd. 2015, 80, 157–158. [Google Scholar] [CrossRef] [Green Version]
  23. Hill, M.J.; Biggs, J.; Thornhill, I.; Briers, R.A.; Gledhill, D.G.; White, J.C.; Wood, P.J.; Hassall, C. Urban ponds as an aquatic biodiversity resource in modified landscapes. Glob. Chang. Biol. 2017, 23, 986–999. [Google Scholar] [CrossRef]
  24. Thornhill, I.; Batty, L.; Death, R.G.; Friberg, N.R.; Ledger, M.E. Local and landscape scale determinants of macroinvertebrate assemblages and their conservation value in ponds across an urban land-use gradient. Biodivers. Conserv. 2017, 26, 1065–1086. [Google Scholar] [CrossRef] [PubMed] [Green Version]
  25. Mata, L.; Threlfall, C.G.; Williams, N.S.; Hahs, A.K.; Malipatil, M.; Stork, N.E.; Livesley, S.J. Conserving herbivorous and predatory insects in urban green spaces. Sci. Rep. 2017, 7, 40970. [Google Scholar] [CrossRef] [PubMed] [Green Version]
  26. Threlfall, C.G.; Mata, L.; Mackie, J.; Hahs, A.K.; Stork, N.E.; Williams, N.S.G.; Livesley, S.J. Increasing biodiversity in urban green spaces through simple vegetation interventions. J. Appl. Ecol. 2017, 54, 1874–1883. [Google Scholar] [CrossRef] [Green Version]
  27. Knop, E.; Zoller, L.; Ryser, R.; Gerpe, C.; Hörler, M.; Fontaine, C. Artificial light at night as a new threat to pollination. Nature 2017, 548, 206. [Google Scholar] [CrossRef]
  28. Owens, A.C.; Lewis, S.M. The impact of artificial light at night on nocturnal insects: A review and synthesis. Ecol. Evol. 2018, 8, 11337–11358. [Google Scholar] [CrossRef] [Green Version]
  29. Avila-Flores, R.; Fenton, M.B. Use of spatial features by foraging insectivorous bats in a large urban landscape. J. Mammal. 2005, 86, 1193–1204. [Google Scholar] [CrossRef]
  30. Ober, H.K.; Hayes, J.P. Influence of forest riparian vegetation on abundance and biomass of nocturnal flying insects. Forest Ecol. Manag. 2008, 256, 1124–1132. [Google Scholar] [CrossRef]
  31. Carew, M.E.; Pettigrove, V.; Cox, R.L.; Hoffmann, A.A. The response of Chironomidae to sediment pollution and other environmental characteristics in urban wetlands. Freshw. Biol. 2007, 52, 2444–2462. [Google Scholar] [CrossRef]
  32. Ruiz-García, A.; Márquez-Rodríguez, J.; Ferreras-Romero, M. Implications of anthropogenic disturbance factors on the Trichoptera assemblage in a Mediterranean fluvial system: Are Trichoptera useful for identifying land-use alterations? Ecol. Indic. 2012, 14, 114–123. [Google Scholar] [CrossRef]
  33. Straka, T.M.; Lentini, P.E.; Lumsden, L.F.; Wintle, B.A.; van der Ree, R. Urban bat communities are affected by wetland size, quality, and pollution levels. Ecol. Evol. 2016, 6, 4761–4774. [Google Scholar] [CrossRef] [Green Version]
  34. Oertli, B.; Parris, K.M. Review: Toward management of urban ponds for freshwater biodiversity. Ecosphere 2019, 10, e02810. [Google Scholar] [CrossRef] [Green Version]
  35. Yen, A.L. Melbourne’s terrestrial invertebrate biodiversity: Losses, gains and the new perspective. Vic. Nat. 2011, 128, 201–208. [Google Scholar]
  36. Van der Ree, R.; McCarthy, M.A. Inferring persistence of indigenous mammals in response to urbanisation. Anim. Conserv. 2005, 8, 309–319. [Google Scholar]
  37. Australian Bureau of Statistics (ABS). Regional Population Growth, Australia 2018–2019. Available online: https://www.abs.gov.au/AUSSTATS/[email protected]/mf/3218.0 (accessed on 30 October 2019).
  38. Melbourne Water. Constructed Wetlands Guidelines; Melbourne Water: Melbourne, Australia, 2010. [Google Scholar]
  39. Kuechly, H.U.; Kyba, C.C.; Ruhtz, T.; Lindemann, C.; Wolter, C.; Fischer, J.; Hölker, F. Aerial survey and spatial analysis of sources of light pollution in Berlin, Germany. Remote Sens. Environ. 2012, 126, 39–50. [Google Scholar] [CrossRef]
  40. Leopold, L.B. Hydrology for Urban Land Planning—A Guidebook on the Hydrologic Effects of Urban Land Use; US Geological Survey: Washington, DC, USA, 1968; Volume 554. [Google Scholar]
  41. McGeachie, W.J. The effects of moonlight illuminance, temperature and wind speed on light-trap catches of moths. Bull. Entomol. Res. 1989, 79, 185–192. [Google Scholar] [CrossRef]
  42. Zahn, A.; Maier, S. Hunting activity of bats at streams and ponds. Z. Saugetierkd. 1997, 62, 1–11. [Google Scholar]
  43. Lumsden, L.F.; Bennett, A.F. Scattered trees in rural landscapes: Foraging habitat for insectivorous bats in south-eastern Australia. Biol. Conserv. 2005, 122, 205–222. [Google Scholar] [CrossRef]
  44. Scanlon, A.; Petit, S. Biomass and biodiversity of nocturnal aerial insects in an Adelaide City park and implications for bats (Microchiroptera). Urban Ecosyst. 2008, 11, 91–106. [Google Scholar] [CrossRef]
  45. O’Donnell, C.F.; Christie, J.E.; Simpson, W. Habitat use and nocturnal activity of lesser short-tailed bats (Mystacina tuberculata) in comparison with long-tailed bats (Chalinolobus tuberculatus) in temperate rainforest. N. Z. J. Zool. 2006, 33, 113–124. [Google Scholar] [CrossRef] [Green Version]
  46. Naumann, I.D.; Came, P.B.; Lawrence, J.F.; Nielsen, E.S.; Spradbery, J.P.; Taylor, R.W.; Whitten, M.J.; Littlejohn, M.J. The Insects of Australia: A Textbook for Students and Research Workers, 2nd ed.; Melbourne University Press: Melbourne, Australia; Cornell University Press: Ithaca, NY, USA, 1991; Volume 1. [Google Scholar]
  47. Kunz, T.H. Methods for assessing insect availability for insectivorous bats. In Ecological and Behavioural Methods for the Study of Bats; Kunz, T.H., Ed.; Smithsonian Institute Press: Washington, DC, USA, 1988; pp. 191–201. [Google Scholar]
  48. Threlfall, C.G.; Law, B.; Banks, P.B. Influence of landscape structure and human modifications on insect biomass and bat foraging activity in an urban landscape. PLoS ONE 2012, 7, e38800. [Google Scholar] [CrossRef]
  49. Adams, M.D.; Law, B.S.; Gibson, M.S. Reliable automation of bat call identification for eastern New South Wales, Australia, using classification trees and AnaScheme software. Acta Chiropterol. 2010, 12, 231–245. [Google Scholar] [CrossRef]
  50. Yela, J.L.; Holyoak, M. Effects of moonlight and meteorological factors on light and bait trap catches of noctuid moths (Lepidoptera: Noctuidae). Environ. Entomol. 1997, 26, 1283–1290. [Google Scholar] [CrossRef]
  51. Board, J.E.; Maka, V.; Price, R.; Knight, D.; Baur, M.E. Development of vegetation indices for identifying insect infestations in soybean. Agron. J. 2007, 99, 650–656. [Google Scholar] [CrossRef]
  52. Stokeld, D.; Hamer, A.J.; van der Ree, R.; Pettigrove, V.; Gillespie, G. Factors influencing occurrence of a freshwater turtle in an urban landscape: A resilient species? Wildl. Res. 2014, 41, 163–171. [Google Scholar] [CrossRef]
  53. Australian and New Zealand Environment and Conservation Council/Agriculture and resource Management Council of Australia and New Zealand (ANZECC/ARMCANZ). Australian and New Zealand Guidelines for Fresh and Marine Water Quality—The Guidelines; Australia Water Association: Artarmon, NSW, Australia, 2000; Volume 1.
  54. Windsor, F.M.; Pereira, M.G.; Tyler, C.R.; Ormerod, S.J. Persistent contaminants as potential constraints on the recovery of urban river food webs from gross pollution. Water Res. 2019, 163, 114858. [Google Scholar] [CrossRef]
  55. Sharley, D.J.; Hoffmann, A.A.; Pettigrove, V. Effects of sediment quality on macroinvertebrates in the Sunraysia region of the Murray—Darling rivers, Australia. Environ. Pollut. 2008, 156, 689–698. [Google Scholar] [CrossRef]
  56. Bates, D.; Maechler, M.; Bolker, B.; Walker, S. Fitting linear mixed-effects models using lme4. J. Stat. Softw. 2015, 67, 1–51. [Google Scholar] [CrossRef]
  57. Burnham, K.P.; Anderson, D.R. Model Selection and Multimodel Inference: A Practical Information-Theoretic Approach; Springer Science & Business Media: New York, NY, USA, 2002. [Google Scholar]
  58. Akaike, H. A new look at the statistical model identification. IEEE Trans. Autom. Control 1974, 19, 716–723. [Google Scholar] [CrossRef]
  59. Zuur, A.; Ieno, E.N.; Walker, N.; Saveliev, A.A.; Smith, G.M. Mixed Effects Models and Extensions in Ecology with R.; Springer: New York, NY, USA, 2009. [Google Scholar]
  60. Rhodes, J.R.; McAlpine, C.A.; Zuur, A.; Smith, G.; Ieno, E. GLMM applied on the spatial distribution of koalas in a fragmented landscape. In Mixed Effects Models and Extensions in Ecology with R.; Zuur, A., Ieno, E.N., Walker, N., Saveliev, A.A., Smith, G.M., Eds.; Springer: New York, NY, USA, 2009; pp. 469–492. [Google Scholar]
  61. Gresens, S.E.; Belt, K.T.; Tang, J.A.; Gwinn, D.C.; Banks, P.A. Temporal and spatial responses of Chironomidae (Diptera) and other benthic invertebrates to urban stormwater runoff. Hydrobiologia 2007, 575, 173–190. [Google Scholar] [CrossRef] [Green Version]
  62. Gołdyn, R.; Szpakowska, B.; Świerk, D.; Domek, P.; Buxakowski, J.; Dondajewska, R.; Barałkiewicz, D.; Sajnóg, A. Influence of stormwater runoff on macroinvertebrates in a small urban river and a reservoir. Sci. Total Environ. 2018, 625, 743–751. [Google Scholar] [CrossRef]
  63. Adler, P.H.; Courtney, G.W. Ecological and societal services of aquatic diptera. Insects 2019, 10, 70. [Google Scholar] [CrossRef] [PubMed] [Green Version]
  64. Wang, J.; Rich, P.M.; Price, K.P.; Kettle, W.D. Relations between NDVI and tree productivity in the central Great Plains. Int. J. Remote Sens. 2004, 25, 3127–3138. [Google Scholar] [CrossRef]
  65. Strong, D.R.; Lawton, J.H.; Southwood, R.S. Insects on Plants: Community Patterns and Mechanisms; Blackwell Scientific: Oxford, UK, 1984. [Google Scholar]
  66. McGeoch, M.A.; Chown, S.L. Impact of urbanization on a gall-inhabiting Lepidoptera assemblage: The importance of reserves in urban areas. Biodivers. Conserv. 1997, 6, 979–993. [Google Scholar] [CrossRef]
  67. Beninde, J.; Veith, M.; Hochkirch, A. Biodiversity in cities needs space: A meta-analysis of factors determining intra-urban biodiversity variation. Ecol. Lett. 2015, 18, 581–592. [Google Scholar] [CrossRef]
  68. Plummer, K.E.; Hale, J.D.; O’Callaghan, M.J.; Sadler, J.P.; Siriwardena, G.M. Investigating the impact of street lighting changes on garden moth communities. J. Urban Ecol. 2016, 2, 1–10. [Google Scholar] [CrossRef] [Green Version]
  69. Briers, R.A.; Gee, J.H.R. Riparian forestry management and adult stream insects. Hydrol. Earth Syst. Sci. 2004, 3, 545–549. [Google Scholar] [CrossRef] [Green Version]
  70. Wakefield, A.; Broyles, M.; Stone, E.L.; Harris, S.; Jones, G. Quantifying the attractiveness of broad-spectrum street lights to aerial nocturnal insects. J. Appl. Ecol. 2018, 55, 714–722. [Google Scholar] [CrossRef]
  71. Urban, M.C.; Skelly, D.K.; Burchsted, D.; Price, W.; Lowry, S. Stream communities across a rural–urban landscape gradient. Divers. Distrib. 2006, 12, 337–350. [Google Scholar] [CrossRef]
  72. Piccolo, J.J.; Wipfli, M.S. Does red alder (Alnus rubra) in upland riparian forests elevate macroinvertebrate and detritus export from headwater streams to downstream habitats in southeastern Alaska? Can. J. Fish. Aquat. Sci. 2002, 59, 503–513. [Google Scholar] [CrossRef] [Green Version]
  73. Harrison, S.S.; Harris, I.T. The effects of bankside management on chalk stream invertebrate communities. Freshw. Biol. 2002, 47, 2233–2245. [Google Scholar] [CrossRef]
  74. Allan, J.D.; Wipfli, M.S.; Caouette, J.P.; Prussian, A.; Rodgers, J. Influence of streamside vegetation on inputs of terrestrial invertebrates to salmonid food webs. Can. J. Fish. Aquat. Sci. 2003, 60, 309–320. [Google Scholar] [CrossRef]
  75. French, B.W.; Elliott, N.C. Spatial and temporal distribution of ground beetle (Coleoptera: Carabidae) assemblages in riparian strips and adjacent wheat fields. Environ. Entomol. 1999, 28, 597–607. [Google Scholar] [CrossRef]
  76. Tszydel, M.; Markowski, M.; Majecki, J.; Błońska, D.; Zieliński, M. Assessment of water quality in urban streams based on larvae of Hydropsyche angustipennis (Insecta, Trichoptera). Environ. Sci. Pollut. Res. 2015, 22, 14687–14701. [Google Scholar] [CrossRef] [PubMed]
  77. Molineri, C.; Tejerina, E.G.; Torrejón, S.E.; Pero, E.J.; Hankel, G.E. Indicative value of different taxonomic levels of Chironomidae for assessing the water quality. Ecol. Indic. 2020, 108, 105703. [Google Scholar] [CrossRef]
  78. Chantaramongkol, P. Light-trapped caddisflies (trichoptera) as water quality indicators in large rivers: Results from the danube at veröce, hungary. Aquat. Insects 1983, 5, 33–37. [Google Scholar] [CrossRef]
  79. Blicharska, M.; Andersson, J.; Bergsten, J.; Bjelke, U.; Hilding-Rydevik, T.; Johansson, F. Effects of management intensity, function and vegetation on the biodiversity in urban ponds. Urban For. Urban Green. 2016, 20, 103–112. [Google Scholar] [CrossRef]
  80. Nag, A.; Nath, P. Effect of moon light and lunar periodicity on the light trap catches of cutworm Agrotis ipsilon (Hufn.) moths. J. Appl. Entomol. 1991, 111, 358–360. [Google Scholar] [CrossRef]
  81. De Oliveira, L.Q.; Marciente, R.; Magnusson, W.E.; Bobrowiec, P.E.D. Activity of the insectivorous bat Pteronotus parnellii relative to insect resources and vegetation structure. J. Mammal. 2015, 96, 1036–1044. [Google Scholar] [CrossRef] [Green Version]
  82. Gonsalves, L.; Bicknell, B.; Law, B.; Webb, C.; Monamy, V. Mosquito consumption by insectivorous bats: Does size matter? PLoS ONE 2013, 8, e77183. [Google Scholar] [CrossRef] [Green Version]
  83. Burgar, J.M.; Murray, D.C.; Craig, M.D.; Haile, J.; Houston, J.; Stokes, V.; Bunce, M. Who’s for dinner? High-throughput sequencing reveals bat dietary differentiation in a biodiversity hotspot where prey taxonomy is largely undescribed. Mol. Ecol. 2014, 23, 3605–3617. [Google Scholar] [CrossRef] [Green Version]
  84. Whitaker, J.O., Jr.; Neefus, C.; Kunz, T.H. Dietary variation in the Mexican free-tailed bat (Tadarida brasiliensis mexicana). J. Mammal. 1996, 77, 716–724. [Google Scholar] [CrossRef] [Green Version]
  85. Ancillotto, L.; Bosso, L.; Salinas-Ramos, V.B.; Russo, D. The importance of ponds for the conservation of bats in urban landscapes. Landsc. Urban Plann. 2019, 190, 103607. [Google Scholar] [CrossRef]
  86. Campbell, S. So long as it’s near water: Variable roosting behaviour of the large-footed myotis (Myotis macropus). Aust. J. Zool. 2009, 57, 89–98. [Google Scholar] [CrossRef]
  87. Verboom, B.; Spoelstra, K. Effects of food abundance and wind on the use of tree lines by an insectivorous bat, Pipistrellus pipistrellus. Can. J. Zool. 1999, 77, 1393–1401. [Google Scholar] [CrossRef]
  88. Townsend, K.R.; Pettigrove, V.J.; Carew, M.E.; Hoffmann, A.A. The effects of sediment quality on benthic macroinvertebrates in the River Murray, Australia. Mar. Freshw. Res. 2009, 60, 70–82. [Google Scholar] [CrossRef]
  89. Lindqvist, L. Accumulation of cadmium, copper, and zinc in five species of phytophagous insects. Environ. Entomol. 1992, 21, 160–163. [Google Scholar] [CrossRef]
  90. Shwartz, A.; Turbé, A.; Simon, L.; Julliard, R. Enhancing urban biodiversity and its influence on city-dwellers: An experiment. Biol. Conserv. 2014, 171, 82–90. [Google Scholar] [CrossRef]
  91. Hall, D.M.; Camilo, G.R.; Tonietto, R.K.; Ollerton, J.; Ahrné, K.; Arduser, M.; Ascher, J.S.; Baldock, K.C.R.; Fowler, R.; Frankie, G.; et al. The city as a refuge for insect pollinators. Conserv. Biol. 2017, 31, 24–29. [Google Scholar] [CrossRef]
  92. Sanford, M.P.; Manley, P.N.; Murphy, D.D. Effects of urban development on ant communities: Implications for ecosystem services and management. Conserv. Biol. 2009, 23(1), 131–141. [Google Scholar]
  93. Parsons, S.E.; Kerner, L.M.; Frank, S.D. Effects of native and exotic congeners on diversity of invertebrate natural enemies, available spider biomass, and pest control services in residential landscapes. Biol. Conserv. 2020. [Google Scholar] [CrossRef]
  94. Potts, S.G.; Imperatriz-Fonseca, V.L.; Ngo, H.T.; Aizen, M.A.; Biesmeijer, J.C.; Breeze, T.D.; Dicks, L.V.; Garibaldi, L.A.; Hill, R.; Settele, J.; et al. Safeguarding pollinators and their values to human well-being. Nature 2016, 540, 220–229. [Google Scholar] [CrossRef] [PubMed]
  95. Hochkirch, A. The insect crisis we can’t ignore. Nature 2016, 539, 141. [Google Scholar] [CrossRef] [PubMed] [Green Version]
  96. Harvey, J.A.; Heinen, R.; Armbrecht, I.; Basset, Y.; Baxter-Gilbert, J.; Bezemer, T.M.; Böhm, M.; Bommarco, R.; Borges, P.A.V.; Cardoso, P.; et al. International scientists formulate a roadmap for insect conservation and recovery. Nat. Ecol. Evol. 2020. [Google Scholar] [CrossRef] [PubMed]
Figure 1. Examples of water bodies and non-water body sites used to study nocturnal flying insects and insectivorous bats, which were similar in size with respect to the open water surface or open grassy area, surrounding tree coverage (t.c.; open, moderate, high density) and degree of urbanisation (based on road length within a 1 km buffer). Source: Google Earth, retrieved July 2012.
Sustainability 12 02634 g001
Figure 2. Distribution of study sites across greater Melbourne used to study nocturnal flying insects and insectivorous bats (inset: location of Melbourne within the State of Victoria, south-east Australia). Dark grey = water body (n = 58); pale grey = non-water body sites (n = 35). Dark grey lines are highways and thin pale grey lines major roads.
Sustainability 12 02634 g002
Figure 3. Abundance and richness of orders of nocturnal flying insects that are important prey for bats at water body and non-water body sites. Only paired sites (35 non-water body and 35 matching water body sites) are included for the sake of comparison, and outliers have been removed (see Supplementary Materials Table S5).
Sustainability 12 02634 g003
Table 1. Parameter effect sizes (± SE) for fixed factors (habitat [water body vs non-water bodies], NDVI, VNIR, temperature and moon) and site as random effect derived from Poisson generalised linear mixed effects models (GLMMs) at the landscape scale.
Sustainability 12 02634 i001
Habitat
(Effect Shown for Non-Water Body Sites)
(Effect Size ± SE)
Sustainability 12 02634 i002
NDVI
500 m
(Effect Size ± SE)
Sustainability 12 02634 i003
VNIR
500 m
(Effect Size ± SE)
Sustainability 12 02634 i004
Temperature
(Effect Size ± SE)
Sustainability 12 02634 i005
Moon(Effect Size ± SE)
Deviance Reduction (%)
Coleoptera abundance−0.25
± 0.40
0.57 **
± 0.21
0.20
± 0.21
0.90
± 0.02
0.47
± 0.06
52.7
Diptera abundance−1.69 ***
± 0.31
0.33 *
± 0.16
0.20
± 0.15
0.42 ***
± 0.02
0.80 ***
± 0.06
39.7
Lepidoptera abundance−0.10
± 0.33
0.31
± 0.17
0.08
± 0.17
0.32 ***
± 0.02
0.38 ***
± 0.04
39.0
Trichoptera abundance−2.60 ***
± 0.50
NA0.14
± 0.24
0.94 ***
± 0.03
−0.27 ***
± 0.07
22.9
Total insect abundance−0.82 *
± 0.36
0.50 **
± 0.18
0.23
± 0.18
0.62 ***
± 0.01
0.13 ***
± 0.02
15.3
Insect order richness−0.08
± 0.08
0.15 ***
± 0.04
0.04
± 0.04
0.12
± 0.04
0.16
± 0.08
28.2
Results are shown for the abundance of the most frequently captured insect orders (> 10% of total insect abundance), total insect abundance and order richness. NA indicates that variables were not included in the final model after the model selection process based on the lowest Akaike Information Criterion corrected for small sample size (AICc) (see Supplementary Materials Table S5). Significant results are indicated in bold and by * p < 0.05, ** p < 0.01 and *** p < 0.001.
Table 2. Parameter effect sizes (± SE) for fixed factors (tree cover, understorey vegetation, water body size, sediment quality quotient (SQQ), temperature and moon) and site as random effect derived from Poisson GLMMs at the water body scale.
Sustainability 12 02634 i006
Tree cover
(Effect size ± SE)
Sustainability 12 02634 i007
Understorey vegetation
(Effect size ± SE)
Sustainability 12 02634 i008
Size
(Effect size ± SE)
Sustainability 12 02634 i009
SQQ
(Effect size ± SE)
Sustainability 12 02634 i010
Temperature
(Effect size ± SE)
Sustainability 12 02634 i011
Moon
(Effect size ± SE)
AICcDeviance reduction (%)
Coleoptera abundance0.48 *
± 0.22
0.41
± 0.21
NA−0.28
± 0.21
0.97 ***
± 0.03
0.70 ***
± 0.06
2964.661.4
Diptera abundanceNANANA 0.05
± 0.16
0.47 ***
± 0.02
0.97 ***
± 0.05
3861.838.6
Lepidoptera abundance0.30
± 0.15
NANA −0.12
± 0.14
0.38 ***
± 0.02
1.01 ***
± 0.05
4201.355.7
Trichoptera abundanceNANA0.66 *
± 0.27
−0.16
± 0.27
0.91
± 0.03
−0.20
± 0.07
3201.344.6
Total insect abundanceNANANA−0.04
± 0.15
0.69 ***
± 0.01
0.40 ***
± 0.02
13687.752.9
Insect order richness0.07
± 0.05
NANA−0.12 *
± 0.05
0.17 ***
± 0.04
0.12
± 0.09
552.845.4
Results are shown for the abundance of the most frequently captured insect orders (> 10% of total insect abundance), total insect abundance and order richness. NA indicates that variables were not included in the final model after the model selection process based on AICc (see Supplementary Materials Table S5). Significant results are indicated in bold and by * p < 0.05, ** p < 0.01 and *** p < 0.001.
Table 3. Parameter effect sizes (± SE) for fixed factors (Diptera, Coleoptera, Lepidoptera, Trichoptera, insect order richness, habitat, NDVI and VNIR) and site as random effect derived from Poisson GLMMs in relation to bat species richness and activity levels of individual species.
Diptera
(Effect Size ± SE)
Coleoptera
(Effect Size ± SE)
Lepidoptera
(Effect Size ± SE)
Trichoptera
(Effect Size ± SE)
Insect Order Richness
(Effect Size ± SE)
Habitat
(Effect Size ± SE)
NDVI (500 m)
(Effect Size ± SE)
VNIR (500 m)
(Effect Size ± SE)
Deviance Reduction (%)
Austronomus australis+ ***- ***+ ***+ ***- ***++ ***-44.0
Chalinolobus gouldii+ ***- ***+ ***- ***+ ***-++29.4
Chalinolobus morio- *+ ***+ *- ***- ***-+ ***-36.0
Vespadelus darlingtoni- ***NA- ***+ ***+ ***-+ **-40.6
Vespadelus regulusNA- *NA+ *+ ***-+ **-33.3
Vespadelus vulturnus- ***+ ***+ ***- ***- *-+ ***-32.6
Total bat activity+ ***- *+ ***- ***+ ***- *+ **-26.1
Bat species richness+NA+-+-+ ***+25.1
Results are shown for bat species activity of the most recorded bat species at the surveyed water bodies [33]. + indicates a positive effect (dark grey shading indicates a significant effect), - a negative (light grey shading indicates a significant effect) and NA indicates variables were not included in the final model after the model selection process based on AICc (see Supplementary Materials Table S5). Effect sizes and standard errors are listed in Supplementary Materials Table S6. Significant results are marked as * p < 0.05, ** p < 0.01 and *** p < 0.001.

