Urban Green Space Distribution Related to Land Values in Fast-Growing Megacities, Mumbai and Jakarta–Unexploited Opportunities to Increase Access to Greenery for the Poor

Abstract
:1. Introduction
1.1. Benefits of Dense Unmanaged UGS
1.2. Measures of UGS Inequity
1.3. Equity Challenges in Fast-Growing Cities
1.4. Aim and Objectives
2. Methodology
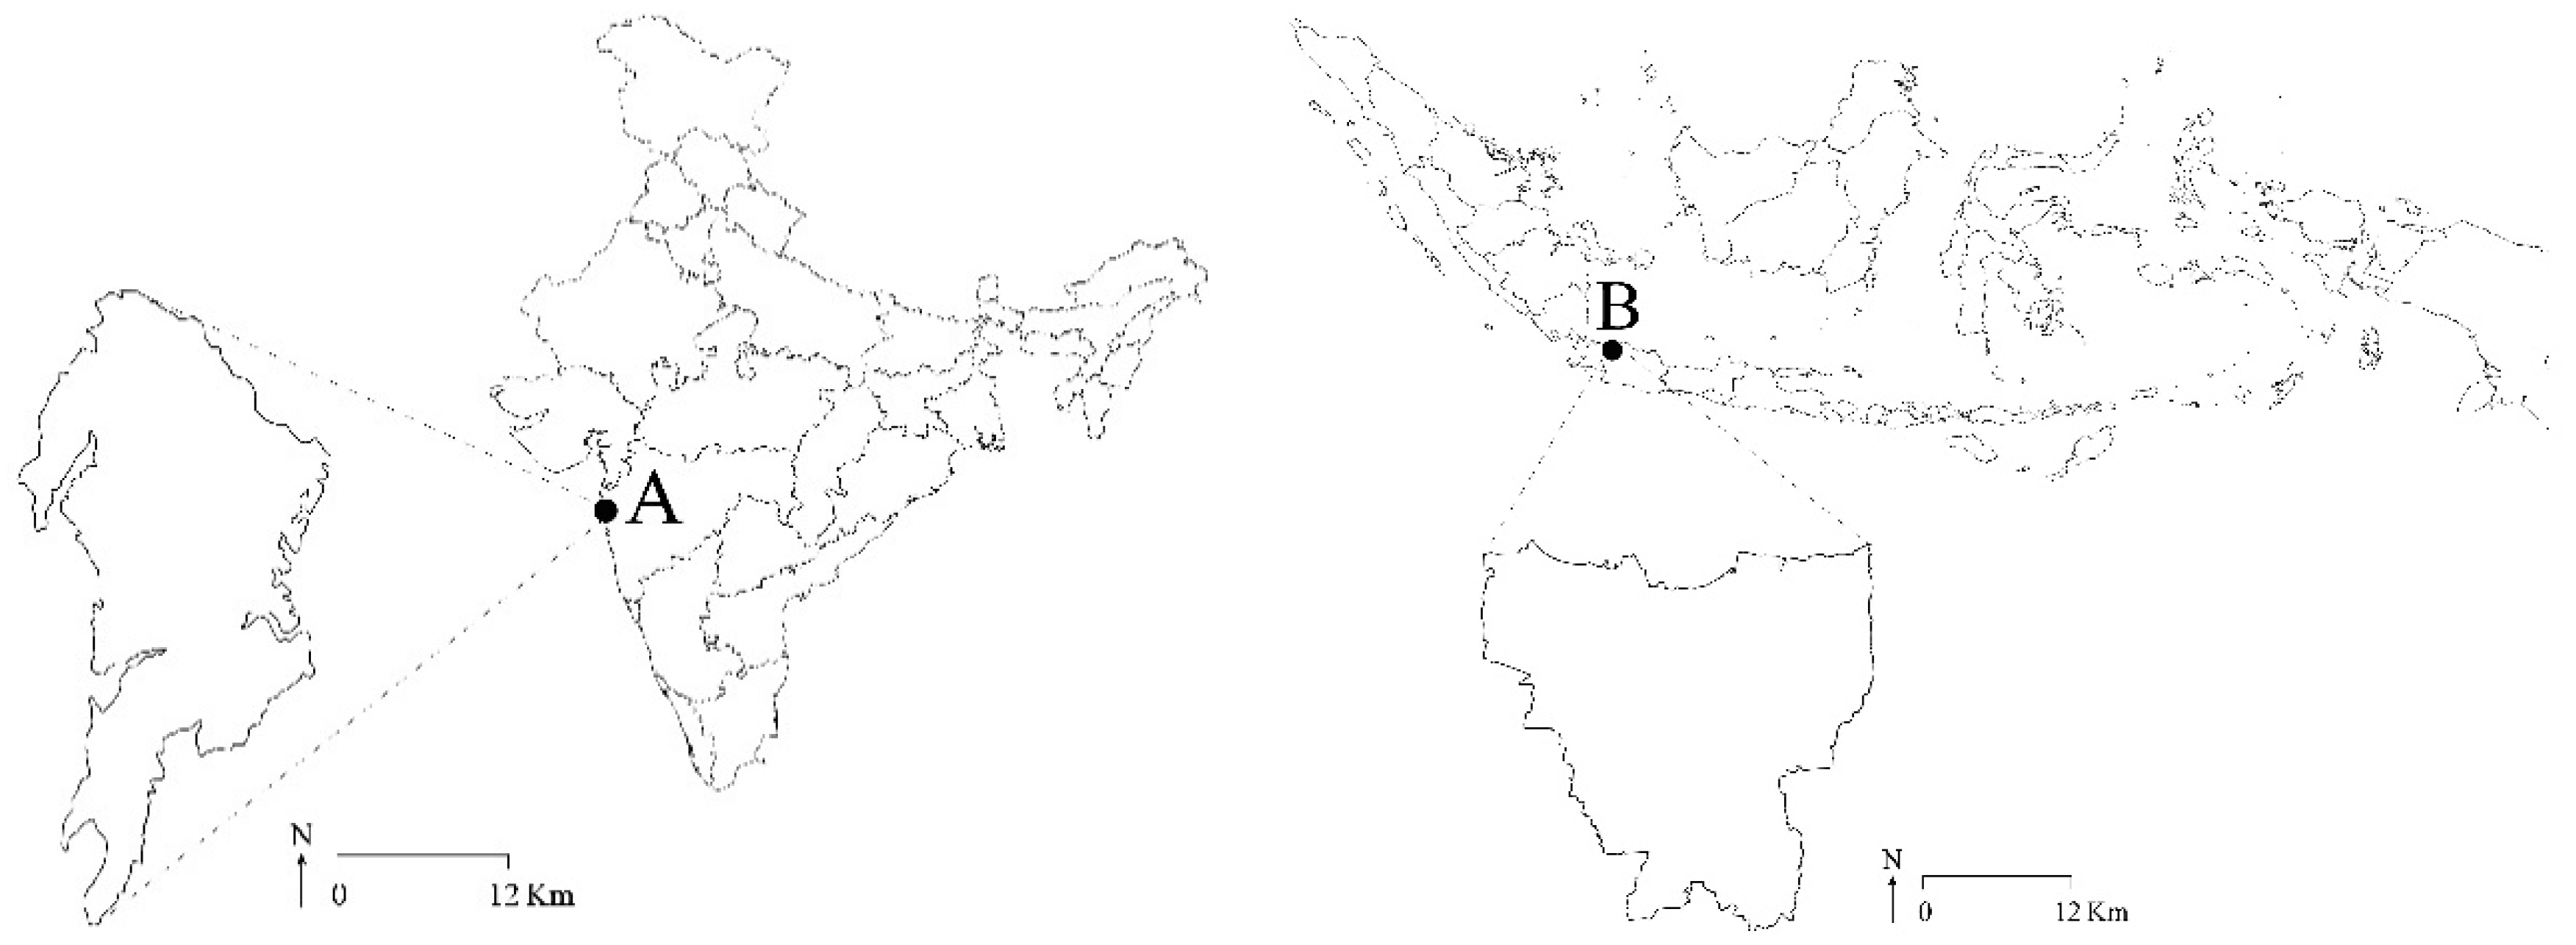
2.1. Study Area
2.2. Data Sources
2.3. Analysis
3. Results
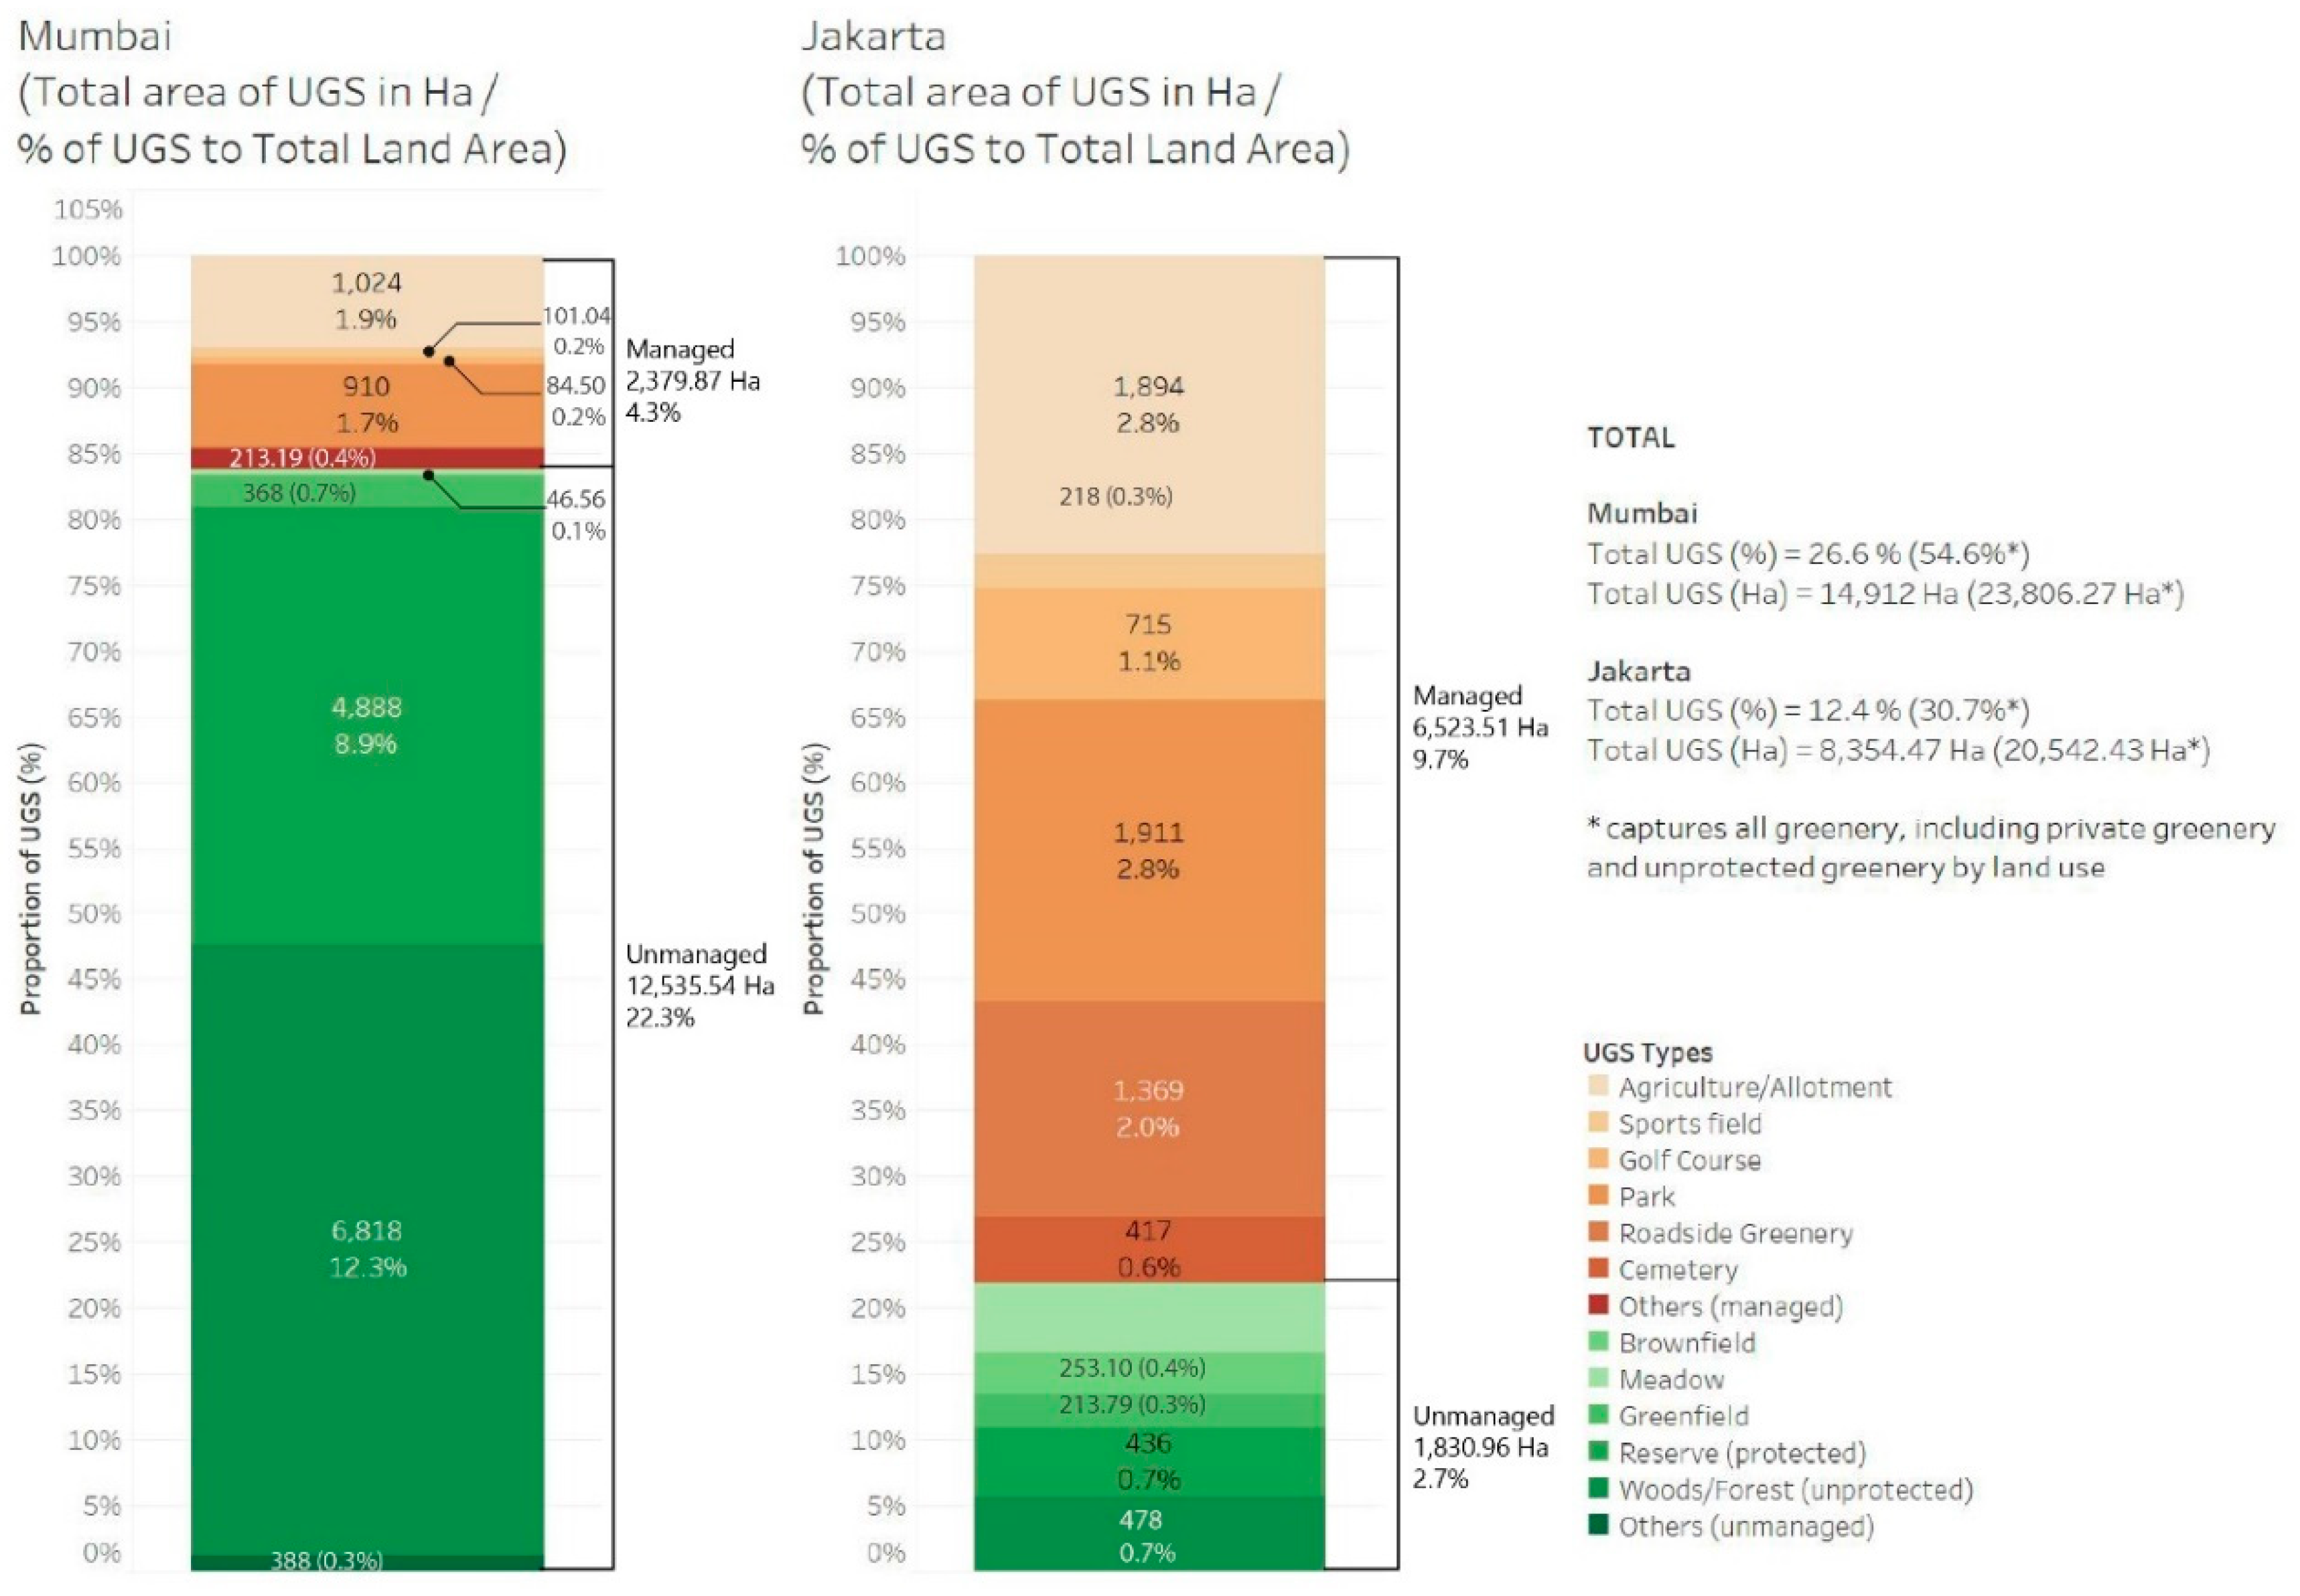
3.1. Quantity of UGS by Type
3.2. Characteristics of UGSs by Land Value
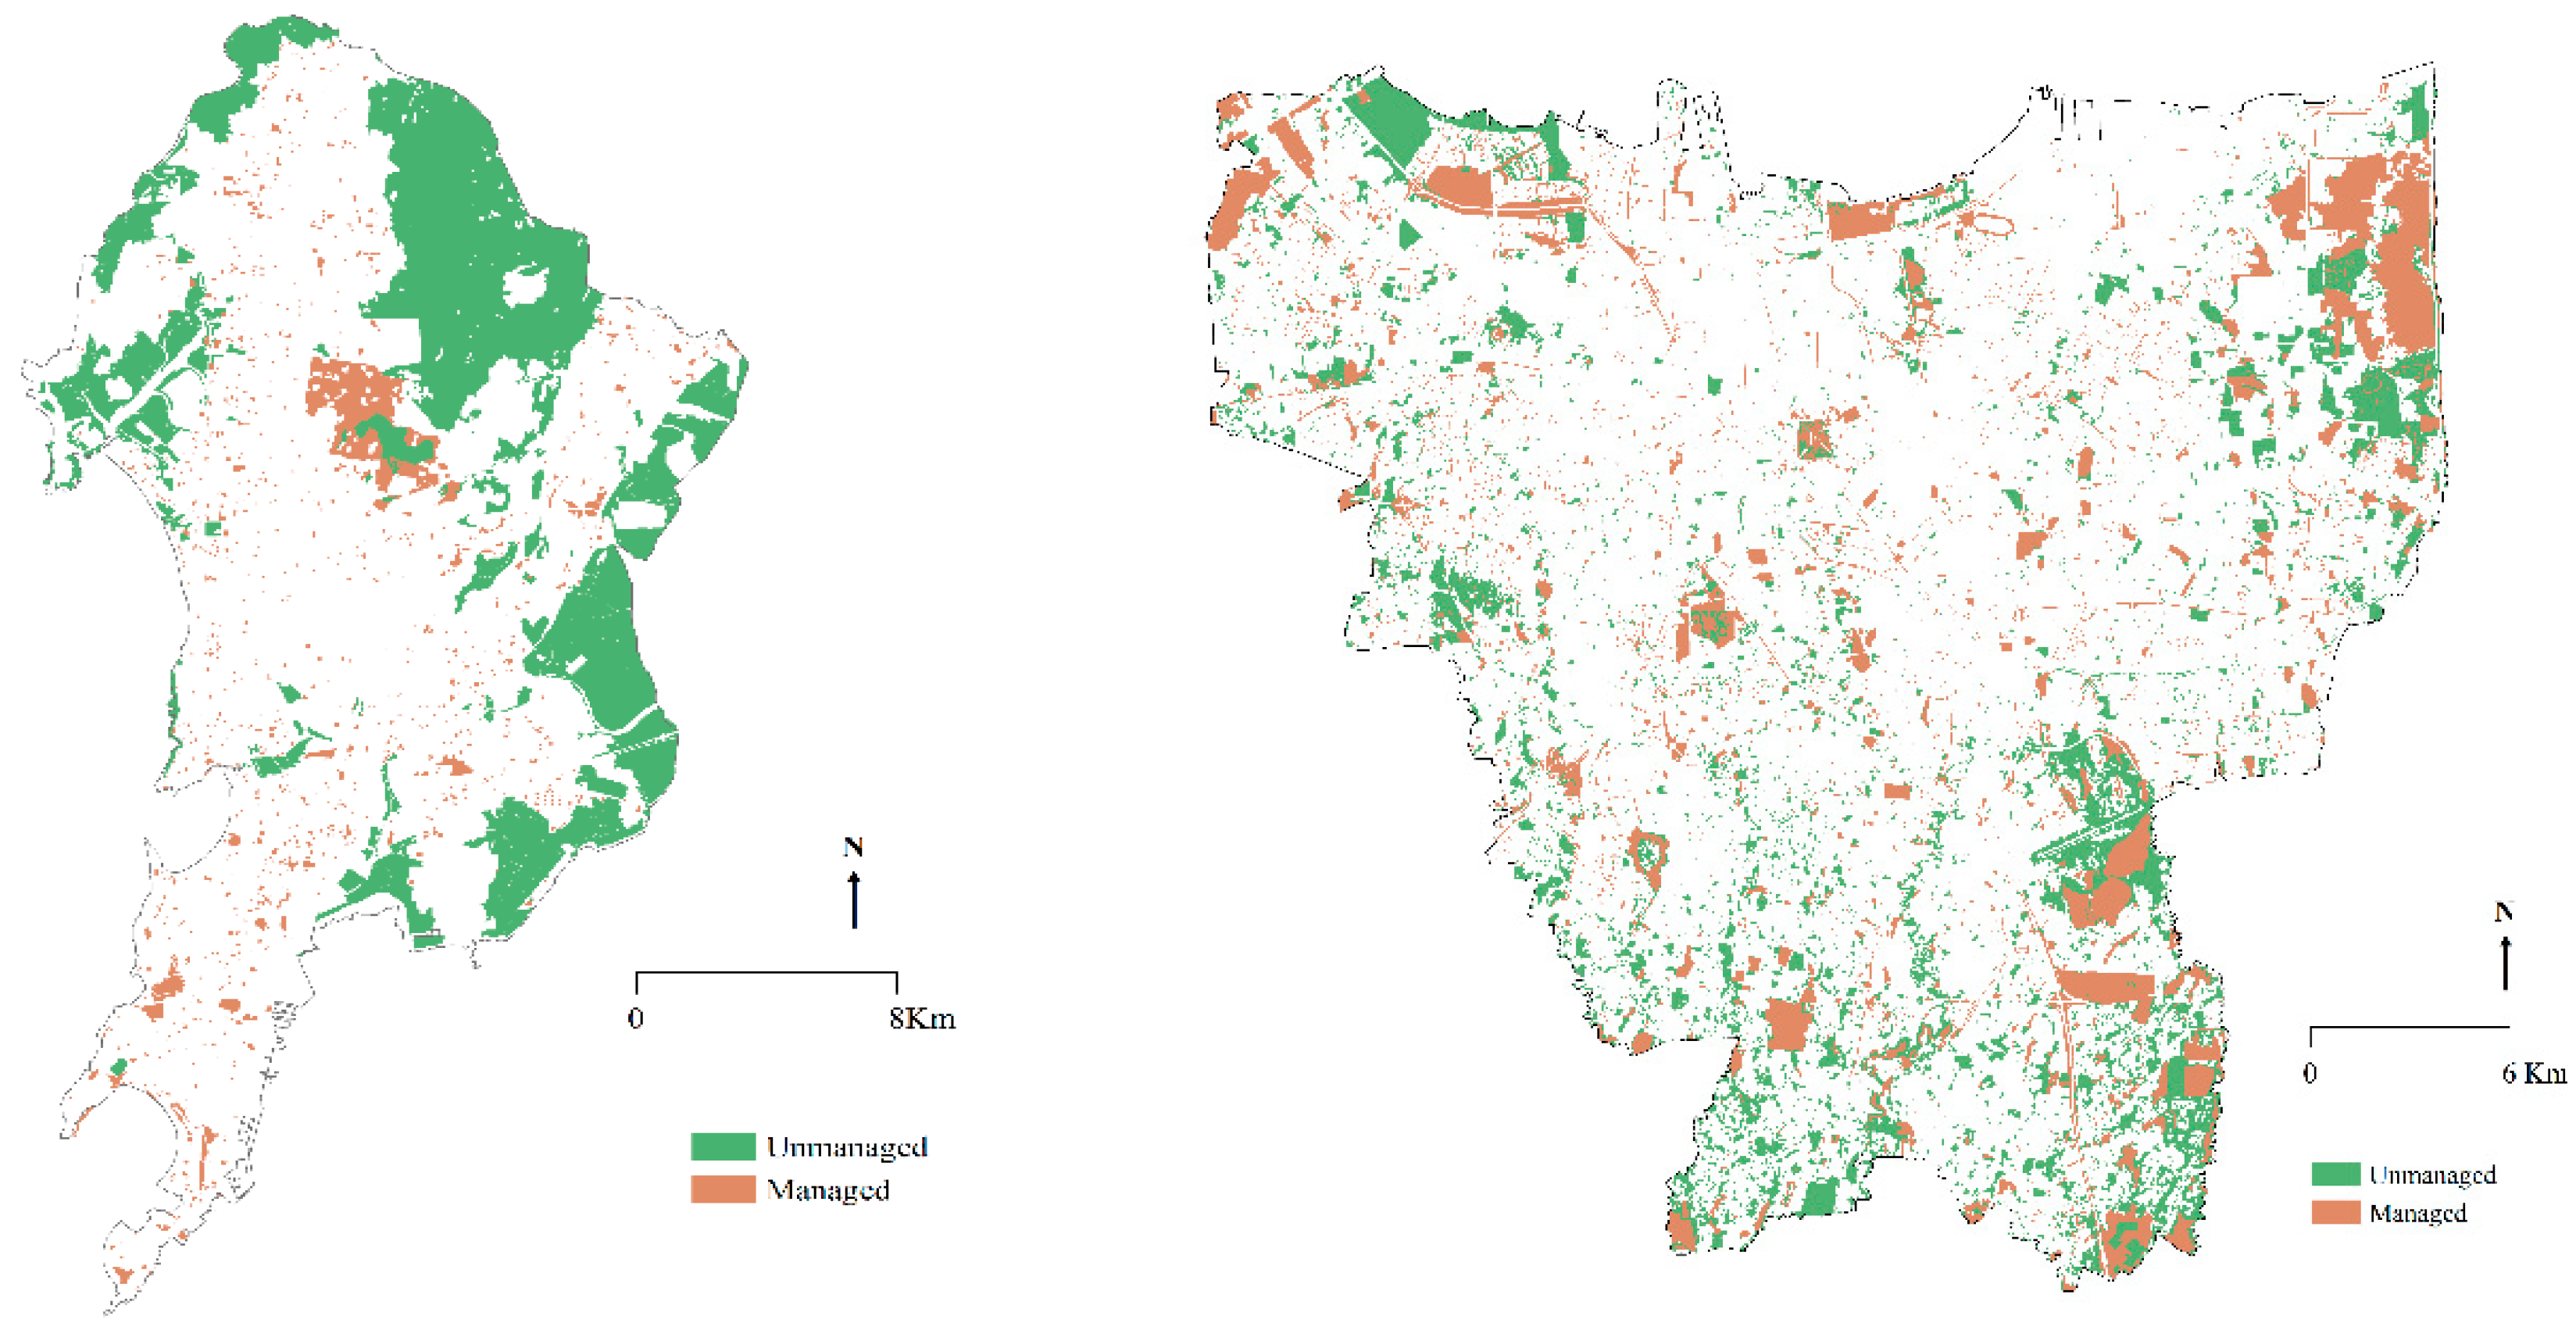
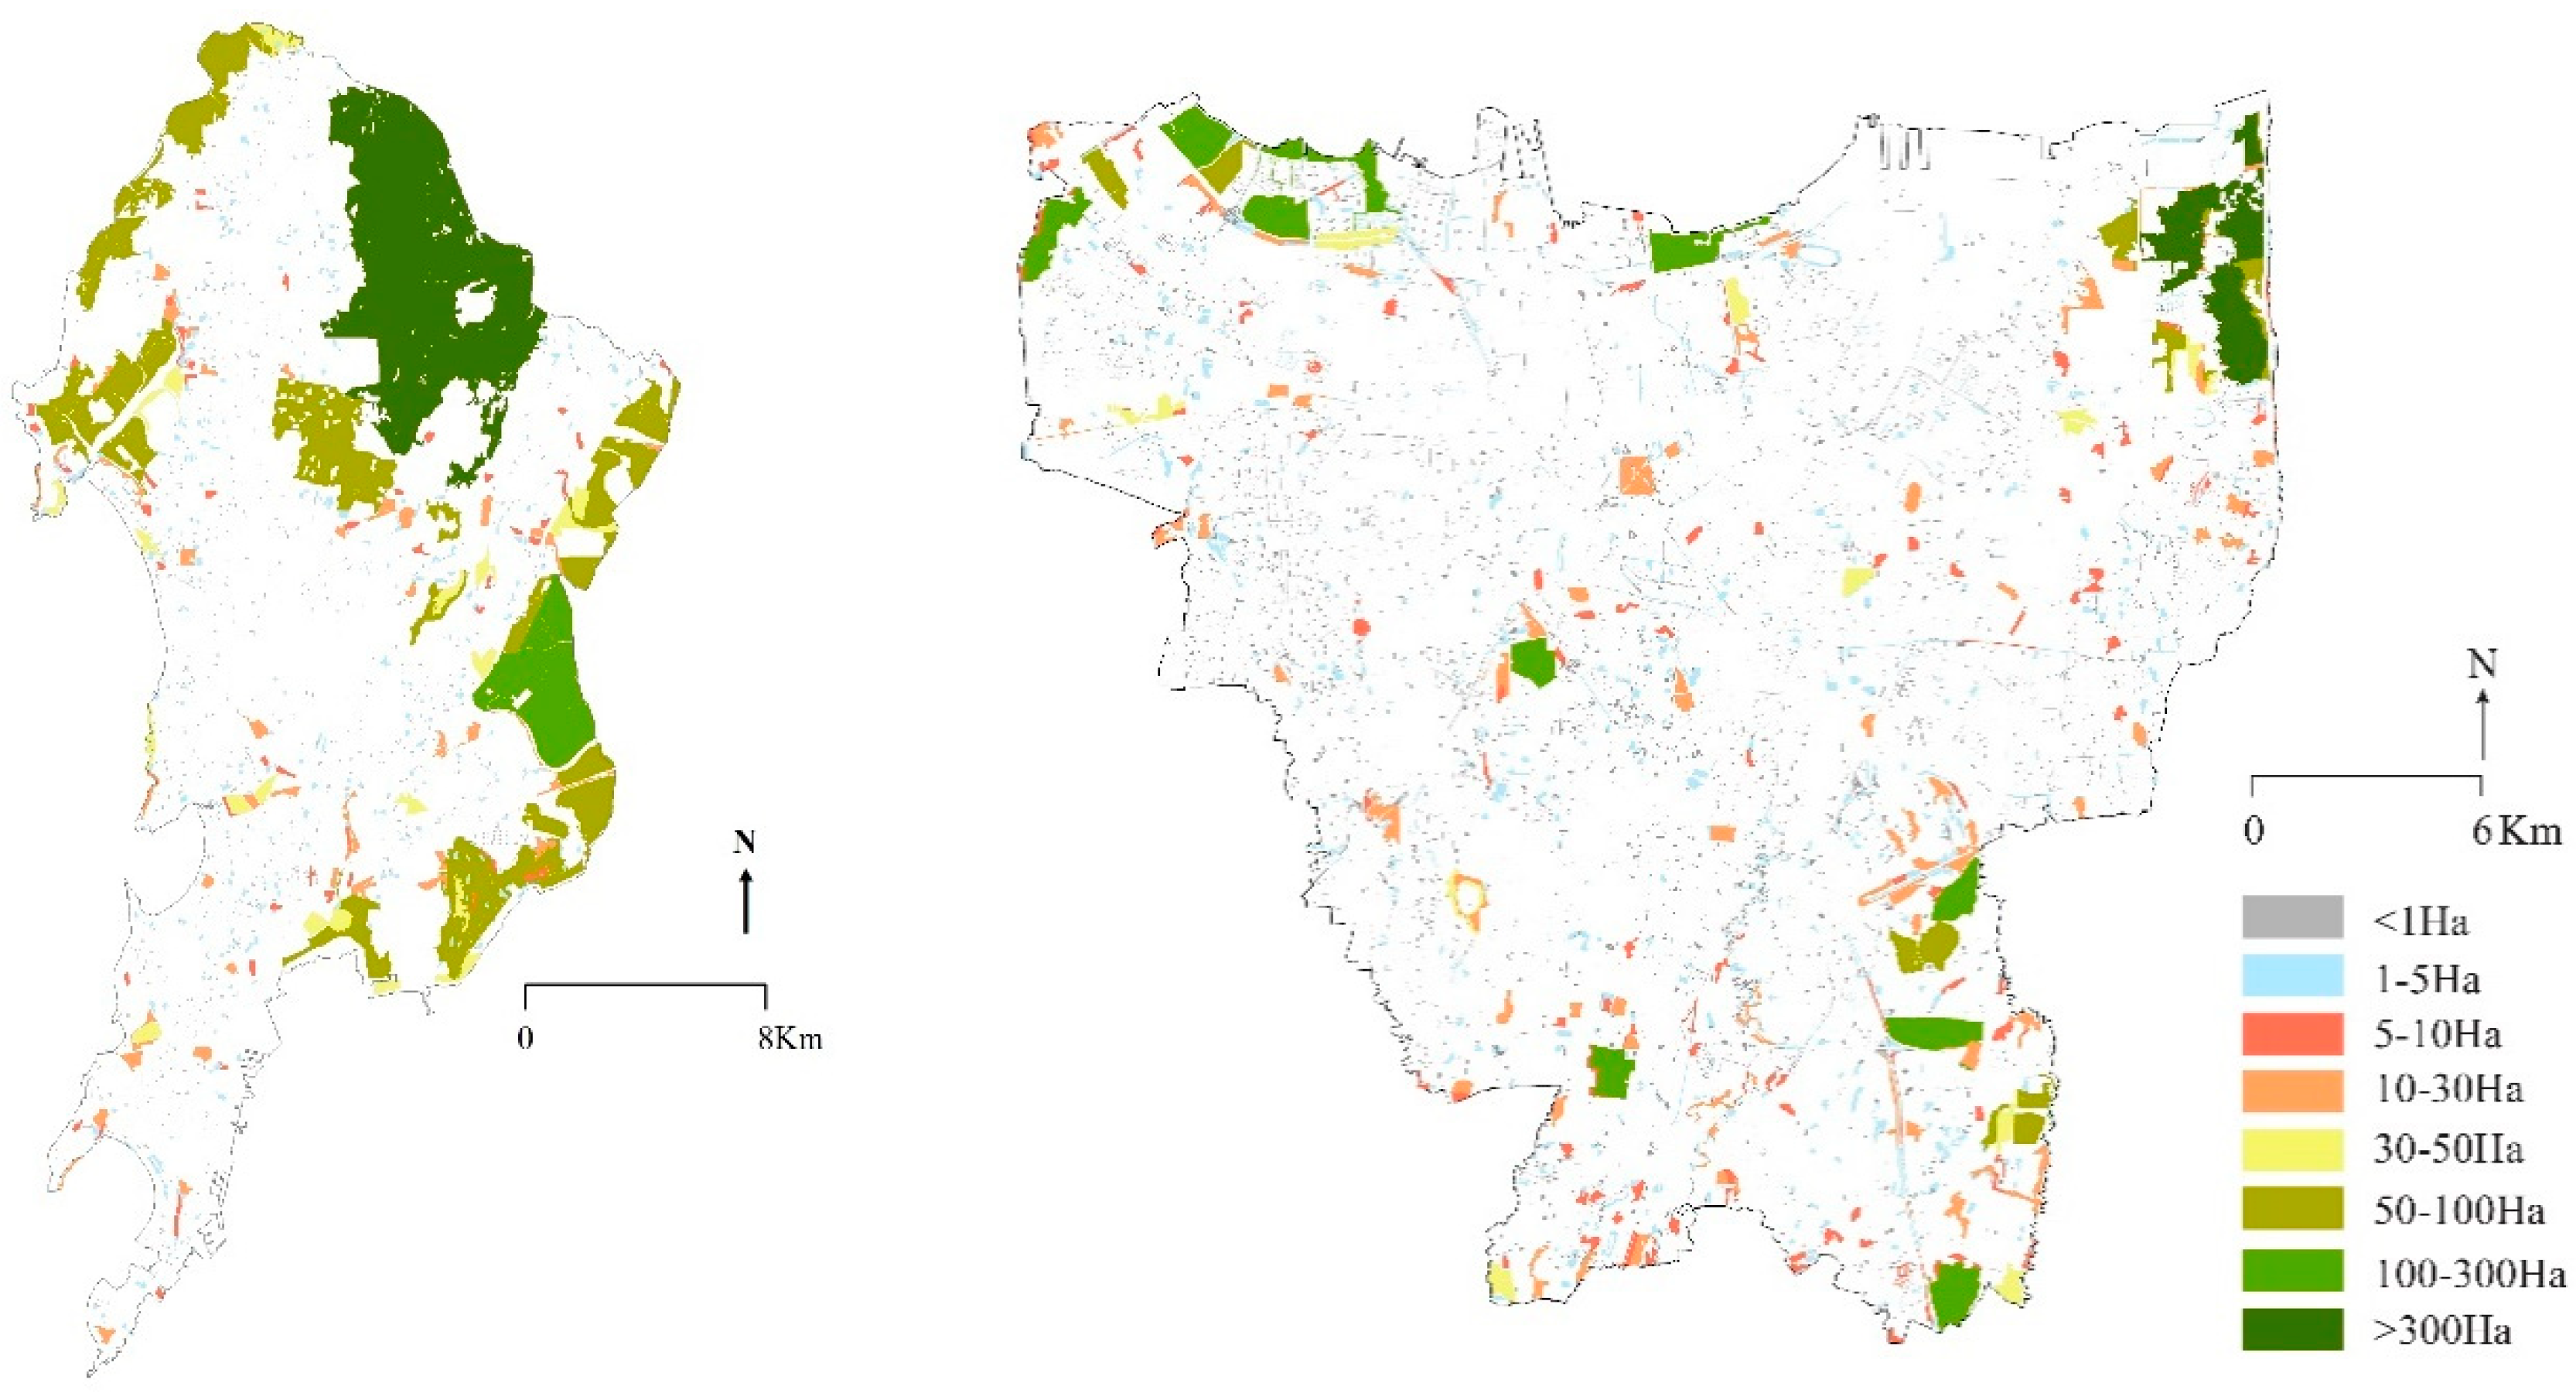
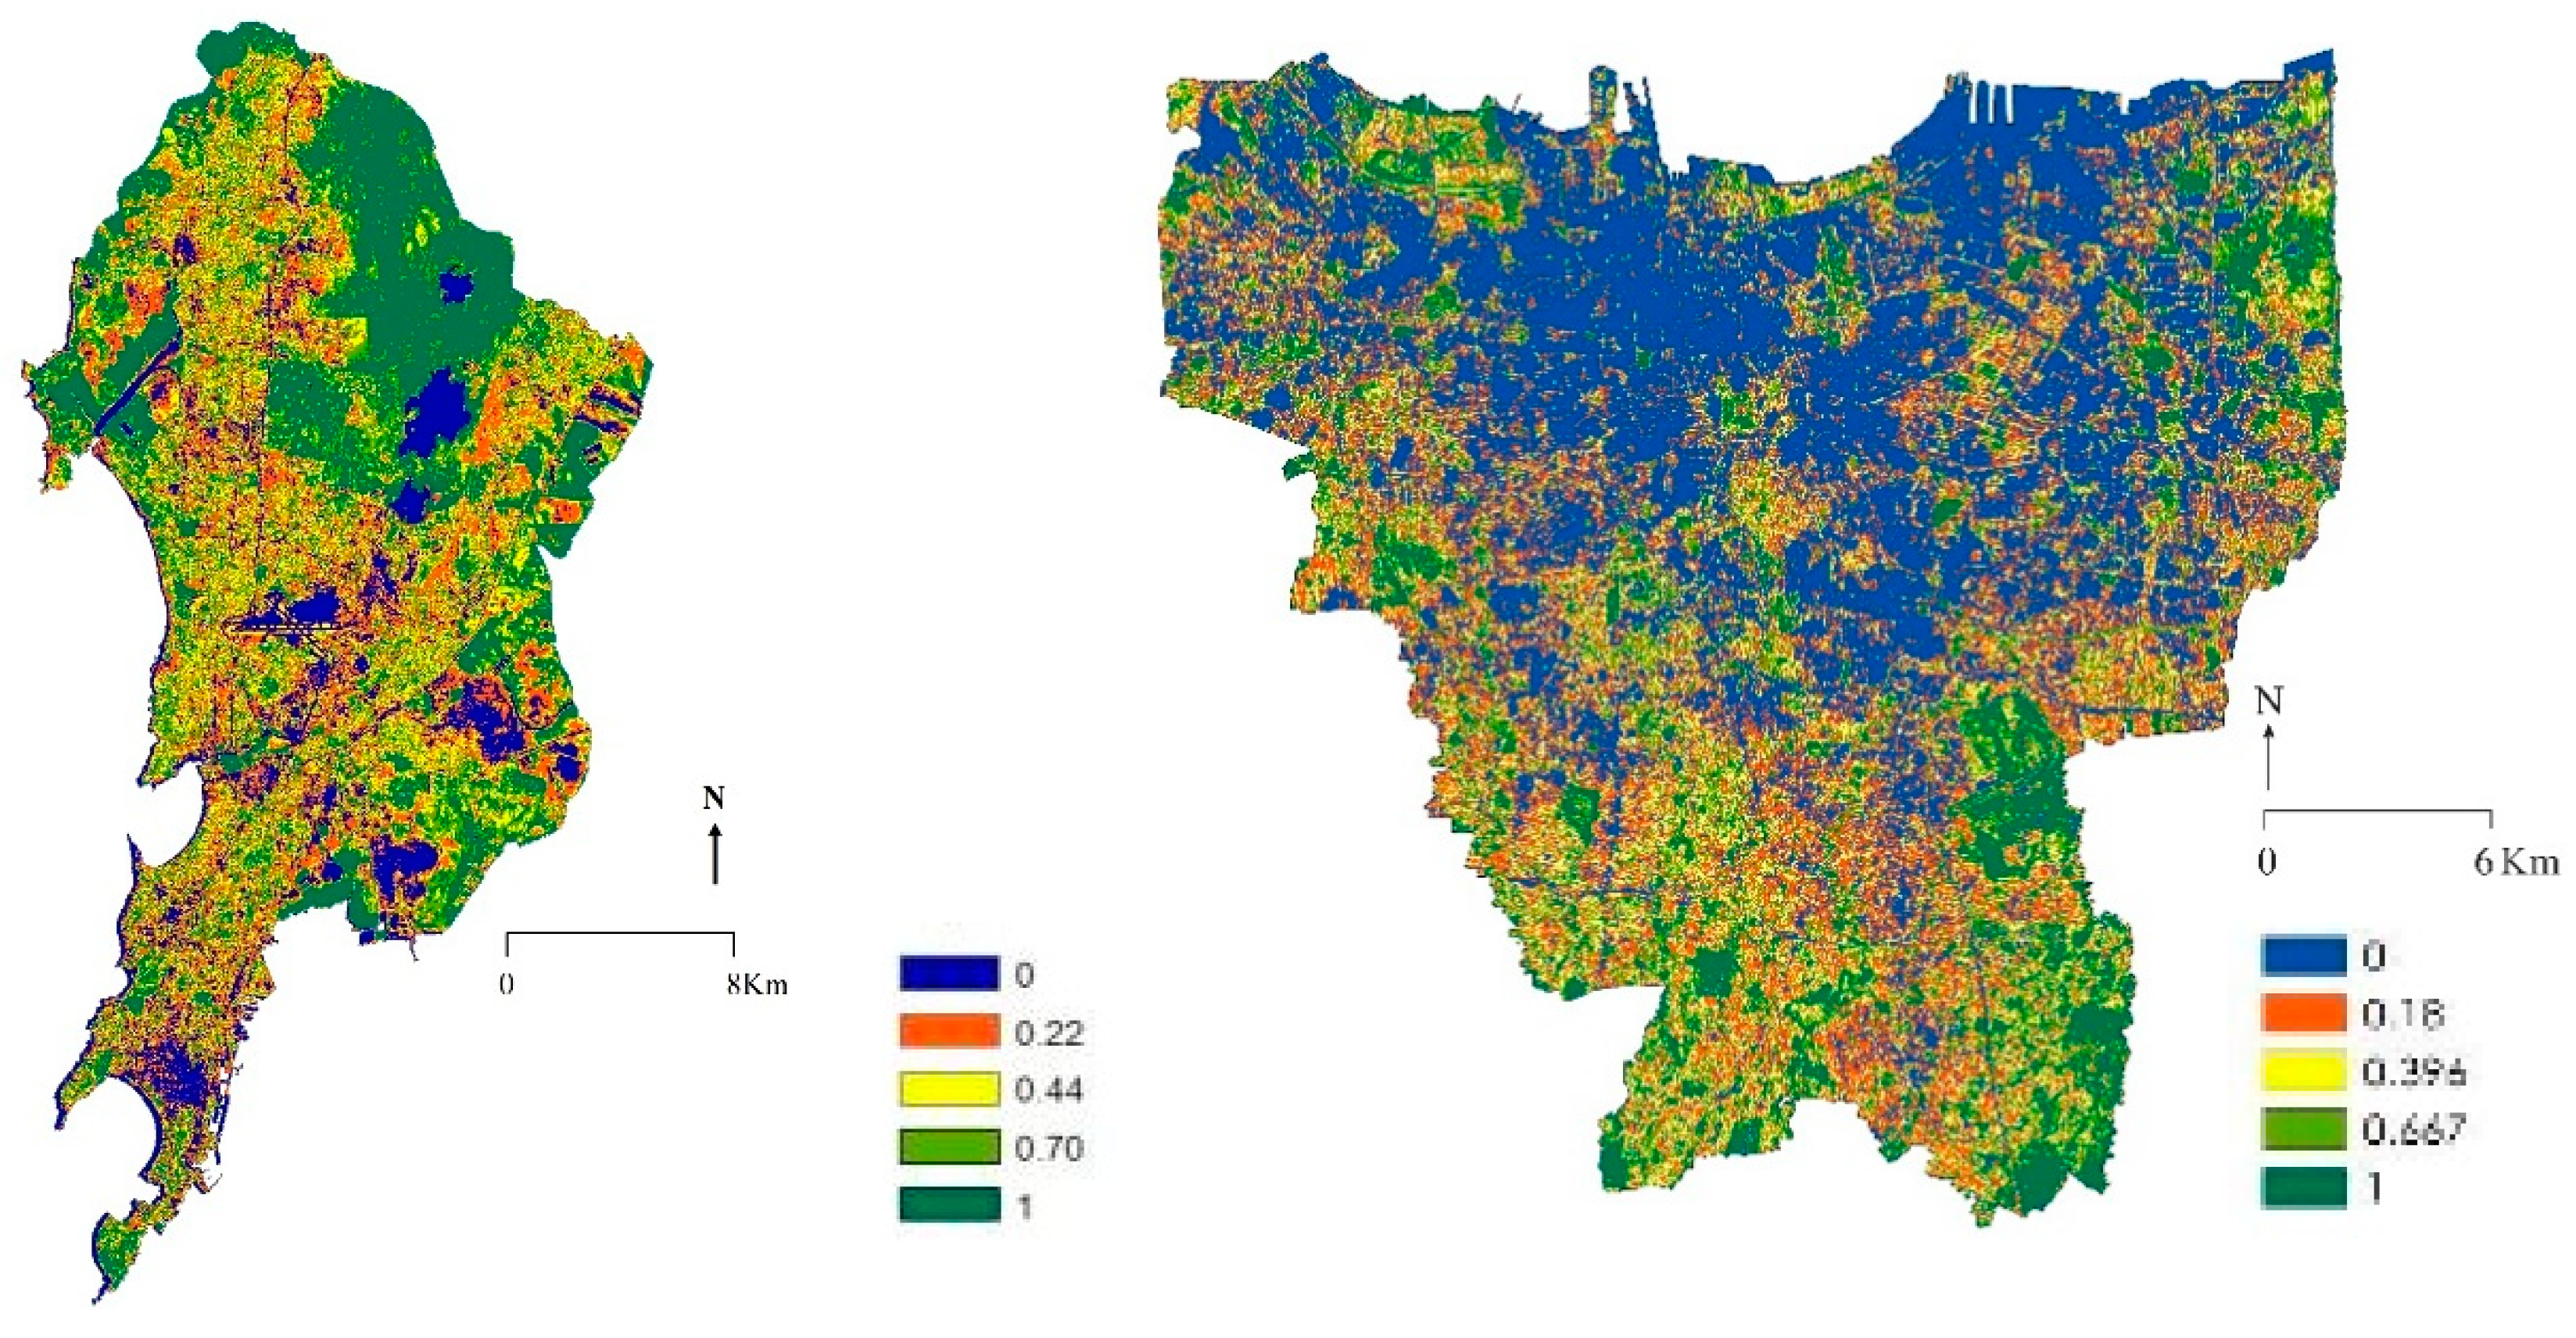
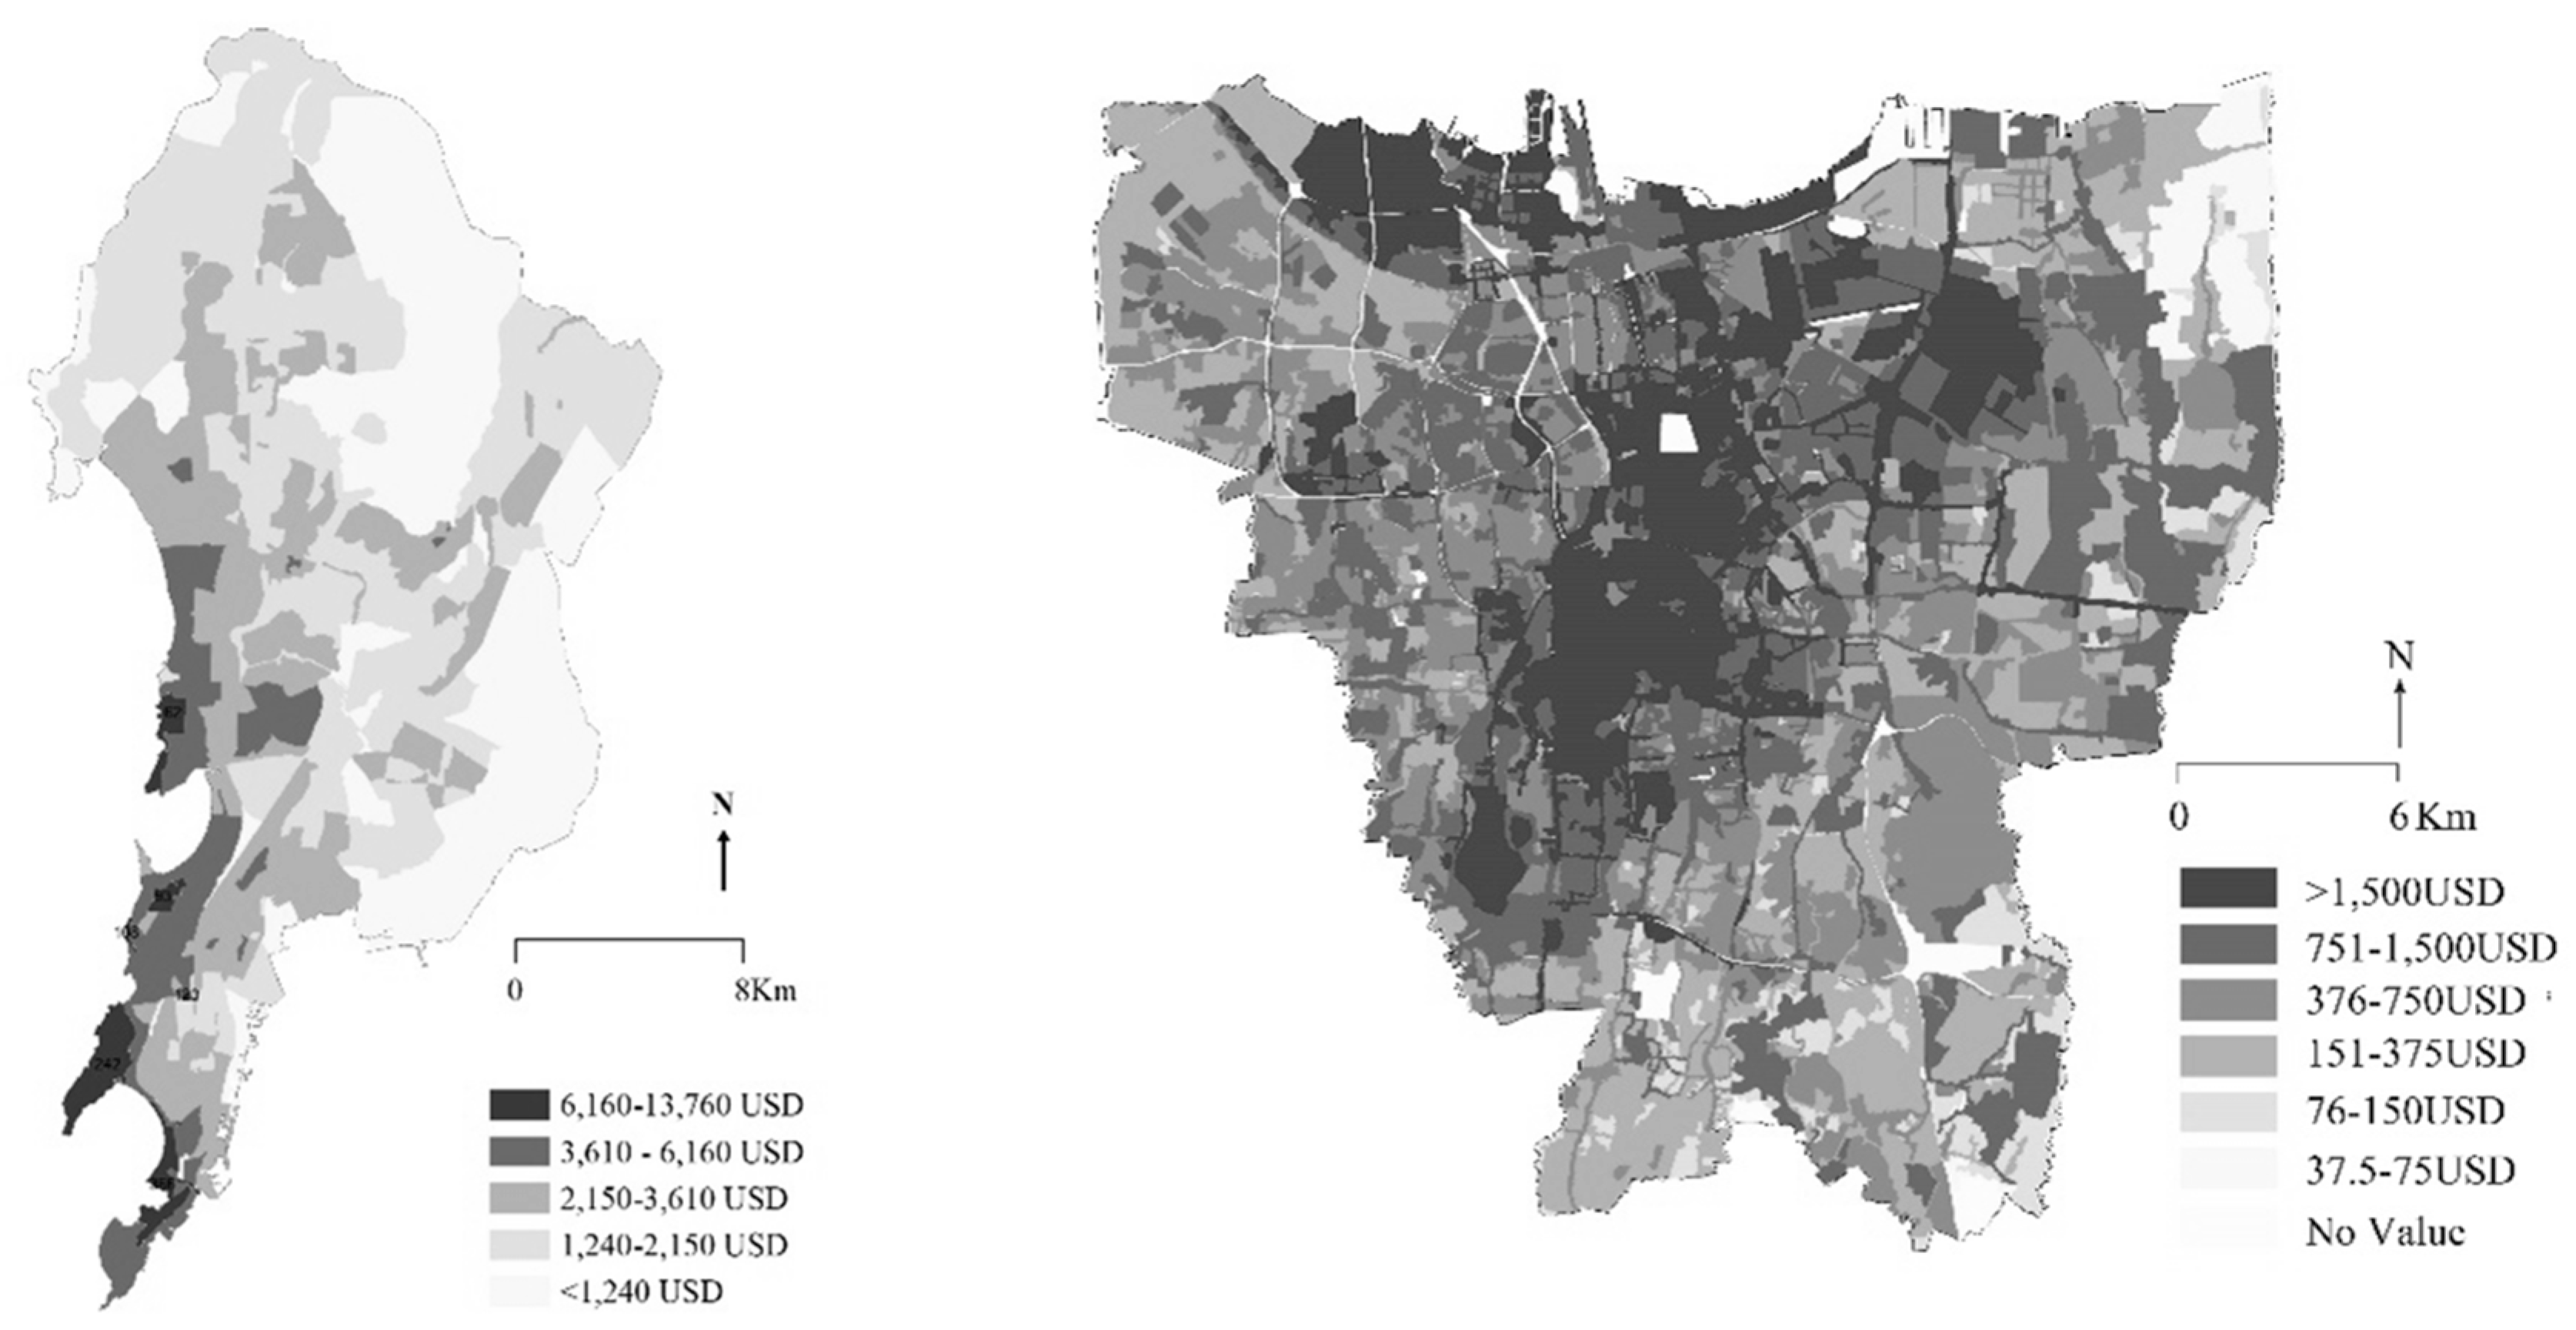
3.3. Spatial Distribution of UGS by Land Value
- -
- In Mumbai, the total UGS represents 26.6% of the total land area; of this, 22.3% is unmanaged green space.
- -
- In Mumbai, only 1.7% of the total land area consists of urban parks, compared to 2.8% in Jakarta.
- -
- In both cities, the lowest land value districts have a positive relationship with the patch size, vegetation density, and area of UGSs.
- -
- In both cities, larger, denser, unmanaged UGSs tend to be concentrated at the fringes, where the residential property values are low and the population has the highest density.
4. Discussion
4.1. Significance of the Study Results
4.2. Planning and Policies to Promote UGS Equity
4.3. Future Studies
5. Conclusions
- -
- The areas of unmanaged greenery are positively correlated with lower land value districts in Mumbai and Jakarta.
- -
- Unmanaged UGS has a positive relationship with larger patch sizes and denser vegetation, while managed UGS has smaller patch sizes and less complex vegetation structures.
- -
- Most unmanaged UGSs in lower land value districts are unprotected and underutilized.
Author Contributions
Funding
Conflicts of Interest
References
- UN-DESA. World Urbanization Prospects: The 2018 Revision, Key Facts; UN-DESA: New York, NY, USA, 2018; Available online: https://population.un.org/wup/Publications/ (accessed on 20 December 2018).
- UN. Global Issues Overview. Available online: https://www.un.org/en/sections/issues-depth/global-issues-overview/ (accessed on 20 December 2018).
- Satterthwaite, D.; Mitlin, D. Urban Poverty in the Global South: Scale and Nature; Routledge: London, UK; New York, NY, USA, 2012. [Google Scholar]
- Andersson, E.; Tengö, M.; McPhearson, T.; Kremer, P. Cultural ecosystem services as a gateway for improving urban sustainability. Ecosyst. Serv. 2015, 12, 165–168. [Google Scholar] [CrossRef]
- Lee, A.C.; Maheswaran, R. The health benefits of urban green spaces: A review of the evidence. J. Public Health 2010, 33, 212–222. [Google Scholar] [CrossRef]
- Konijnendijk, C.C.; Annerstedt, M.; Nielsen, A.B.; Maruthaveeran, S. Benefits of Urban Parks. A Systematic Review; IFPRA: Copenhagen, Denmark; Alnarp, Sweden, 2013. [Google Scholar]
- Forman, R.T. Urban Ecology: Science of Cities; Cambridge University Press: Cambridge, UK, 2014. [Google Scholar]
- Turner, M.G.; Gardner, R.H. Landscape Ecology in Theory and Practice: Pattern and Process, 2nd ed.; Springer: New York, NY, USA, 2015. [Google Scholar] [CrossRef]
- Fuller, R.; Gaston, K.J. The scaling of green space coverage in European cities. Boil. Lett. 2009, 5, 352–355. [Google Scholar] [CrossRef] [PubMed] [Green Version]
- Threlfall, C.G.; Ossola, A.; Hahs, A.K.; Williams, N.; Wilson, L.; Livesley, S. Variation in Vegetation Structure and Composition across Urban Green Space Types. Front. Ecol. Evol. 2016, 4, 581. [Google Scholar] [CrossRef] [Green Version]
- Huang, C.; Yang, J.; Jiang, P. Assessing Impacts of Urban Form on Landscape Structure of Urban Green Spaces in China Using Landsat Images Based on Google Earth Engine. Remote Sens. 2018, 10, 1569. [Google Scholar] [CrossRef] [Green Version]
- Beninde, J.; Veith, M.; Hochkirch, A. Biodiversity in cities needs space: A meta-analysis of factors determining intra-urban biodiversity variation. Ecol. Lett. 2015, 18, 581–592. [Google Scholar] [CrossRef] [PubMed]
- Threlfall, C.G.; Kendal, D. The distinct ecological and social roles that wild spaces play in urban ecosystems. Urban For. Urban Green. 2018, 29, 348–356. [Google Scholar] [CrossRef]
- Strohbach, M.; Arnold, E.; Haase, D. The carbon footprint of urban green space—A life cycle approach. Landsc. Urban Plan. 2012, 104, 220–229. [Google Scholar] [CrossRef]
- Davies, Z.G.; Edmondson, J.L.; Heinemeyer, A.; Leake, J.R.; Gaston, K.J. Mapping an urban ecosystem service: Quantifying above-ground carbon storage at a city-wide scale. J. Appl. Ecol. 2011, 48, 1125–1134. [Google Scholar] [CrossRef] [Green Version]
- Janhäll, S. Review on urban vegetation and particle air pollution—Deposition and dispersion. Atmos. Environ. 2015, 105, 130–137. [Google Scholar] [CrossRef]
- Bowler, D.E.; Buyung-Ali, L.; Knight, T.M.; Pullin, A. Urban greening to cool towns and cities: A systematic review of the empirical evidence. Landsc. Urban Plan. 2010, 97, 147–155. [Google Scholar] [CrossRef]
- McDonnell, M.J.; Kendal, D. The ecology of urban forests. In Routledge Handbook of Forest Ecology; Routledge: London, UK; New York, NY, USA, 2015; pp. 639–649. [Google Scholar]
- OASE. OASE Foundation. Available online: http://www.stichtingoase.nl/tuinlocaties (accessed on 20 December 2018).
- City of Boston. Urban Wilds Initiative. Available online: https://www.boston.gov/environment-and-energy/urban-wilds-initiative (accessed on 30 June 2018).
- Brauner-Otto, S.R. Environmental Quality and Fertility: The Effects of Plant Density, Species Richness, and Plant Diversity on Fertility Limitation. Popul. Environ. 2013, 36, 1–31. [Google Scholar] [CrossRef] [PubMed] [Green Version]
- Alcock, I.; White, M.P.; Wheeler, B.; Fleming, L.E.; Depledge, M.H. Longitudinal Effects on Mental Health of Moving to Greener and Less Green Urban Areas. Environ. Sci. Technol. 2014, 48, 1247–1255. [Google Scholar] [CrossRef] [PubMed] [Green Version]
- Shanahan, D.; Fuller, R.; Bush, R.; Lin, B.; Gaston, K.J. The Health Benefits of Urban Nature: How Much Do We Need? Bioscience 2015, 65, 476–485. [Google Scholar] [CrossRef] [Green Version]
- Anguluri, R.; Narayanan, P. Role of green space in urban planning: Outlook towards smart cities. Urban For. Urban Green. 2017, 25, 58–65. [Google Scholar] [CrossRef]
- Wen, M.; Zhang, X.; Harris, C.D.; Holt, J.B.; Croft, J.B. Spatial disparities in the distribution of parks and green spaces in the USA. Ann. Behav. Med. 2013, 45, S18–S27. [Google Scholar] [CrossRef] [Green Version]
- Maas, J.; Van Dillen, S.M.; Verheij, R.A.; Groenewegen, P. Social contacts as a possible mechanism behind the relation between green space and health. Health Place 2009, 15, 586–595. [Google Scholar] [CrossRef] [Green Version]
- Barrera, F.; Reyes-Paecke, S.; Banzhaf, E. Indicators for green spaces in contrasting urban settings. Ecol. Indic. 2016, 62, 212–219. [Google Scholar] [CrossRef]
- Sister, C.; Wolch, J.; Wilson, J. Got green? Addressing environmental justice in park provision. Geojournal 2009, 75, 229–248. [Google Scholar] [CrossRef]
- Wolch, J.R.; Byrne, J.; Newell, J.P. Urban green space, public health, and environmental justice: The challenge of making cities ‘just green enough’. Landsc. Urban Plan. 2014, 125, 234–244. [Google Scholar] [CrossRef] [Green Version]
- Jenerette, G.D.; Harlan, S.L.; Stefanov, W.L.; Martin, C.A. Ecosystem services and urban heat riskscape moderation: Water, green spaces, and social inequality in Phoenix, USA. Ecol. Appl. 2011, 21, 2637–2651. [Google Scholar] [CrossRef]
- Rigolon, A.; Browning, M.H.; Jennings, V. Inequities in the quality of urban park systems: An environmental justice investigation of cities in the United States. Landsc. Urban Plan. 2018, 178, 156–169. [Google Scholar] [CrossRef]
- Huang, G.; Cadenasso, M.L. People, landscape, and urban heat island: Dynamics among neighborhood social conditions, land cover and surface temperatures. Landsc. Ecol. 2016, 31, 2507–2515. [Google Scholar] [CrossRef]
- Chen, W.Y.; Hu, F.Z.; Li, X.; Hua, J. Strategic interaction in municipal governments’ provision of public green spaces: A dynamic spatial panel data analysis in transitional China. Cities 2017, 71, 1–10. [Google Scholar] [CrossRef]
- Wan, C.; Su, S. China’s social deprivation: Measurement, spatiotemporal pattern and urban applications. Habitat Int. 2017, 62, 22–42. [Google Scholar] [CrossRef]
- Chen, W.Y.; Wang, D. Economic development and natural amenity: An econometric analysis of urban green spaces in China. Urban For. Urban Green. 2013, 12, 435–442. [Google Scholar] [CrossRef]
- Kabisch, N.; Haase, D. Green justice or just green? Provision of urban green spaces in Berlin, Germany. Landsc. Urban Plan. 2014, 122, 129–139. [Google Scholar] [CrossRef]
- Xiao, Y.; Wang, Z.; Li, Z.; Tang, Z. An assessment of urban park access in Shanghai – Implications for the social equity in urban China. Landsc. Urban Plan. 2017, 157, 383–393. [Google Scholar] [CrossRef]
- Dai, D. Racial/ethnic and socioeconomic disparities in urban green space accessibility: Where to intervene? Landsc. Urban Plan. 2011, 102, 234–244. [Google Scholar] [CrossRef]
- McConnachie, M.M.; Shackleton, C. Public green space inequality in small towns in South Africa. Habitat Int. 2010, 34, 244–248. [Google Scholar] [CrossRef] [Green Version]
- Maroko, A.R.; Maantay, J.; Sohler, N.L.; Grady, K.L.; Arno, P.S. The complexities of measuring access to parks and physical activity sites in New York City: A quantitative and qualitative approach. Int. J. Health Geogr. 2009, 8, 34. [Google Scholar] [CrossRef] [Green Version]
- Xu, M.; Xin, J.; Su, S.; Weng, M.; Cai, Z. Social inequalities of park accessibility in Shenzhen, China: The role of park quality, transport modes, and hierarchical socioeconomic characteristics. J. Transp. Geogr. 2017, 62, 38–50. [Google Scholar] [CrossRef]
- Jennings, V.; Floyd, M.F.; Shanahan, D.; Coutts, C.; Sinykin, A. Emerging issues in urban ecology: Implications for research, social justice, human health, and well-being. Popul. Environ. 2017, 39, 69–86. [Google Scholar] [CrossRef]
- You, H. Characterizing the inequalities in urban public green space provision in Shenzhen, China. Habitat Int. 2016, 56, 176–180. [Google Scholar] [CrossRef]
- Rigolon, A.; Browning, M.H.; Lee, K.; Shin, S. Access to Urban Green Space in Cities of the Global South: A Systematic Literature Review. Urban Sci. 2018, 2, 67. [Google Scholar] [CrossRef] [Green Version]
- Haaland, C.; Bosch, C.K.V.D. Challenges and strategies for urban green-space planning in cities undergoing densification: A review. Urban For. Urban Green. 2015, 14, 760–771. [Google Scholar] [CrossRef]
- Dobbs, C.; Kendal, D.; Nitschke, C.R. Multiple ecosystem services and disservices of the urban forest establishing their connections with landscape structure and sociodemographics. Ecol. Indic. 2014, 43, 44–55. [Google Scholar] [CrossRef]
- Richards, D.R.; Passy, P.; Oh, R.R. Impacts of population density and wealth on the quantity and structure of urban green space in tropical Southeast Asia. Landsc. Urban Plan. 2017, 157, 553–560. [Google Scholar] [CrossRef]
- WHO. Global Urban Air Pollution Trends. Available online: https://www.who.int/en/news-room/detail/12-05-2016-air-pollution-levels-rising-in-many-of-the-world-s-poorest-cities (accessed on 30 June 2018).
- Agyeman, J.; Schlosberg, D.; Craven, L.; Matthews, C. Trends and Directions in Environmental Justice: From Inequity to Everyday Life, Community, and Just Sustainabilities. Annu. Rev. Environ. Resour. 2016, 41, 321–340. [Google Scholar] [CrossRef]
- ADB. Urban Poverty in Asia; Asian Development Bank: Manila, Philippines, 2014. [Google Scholar]
- Zérah, M.H. Conflict between green space preservation and housing needs: The case of the Sanjay Gandhi National Park in Mumbai. Cities 2007, 24, 122–132. [Google Scholar] [CrossRef]
- Monkkonen, P. Urban land-use regulations and housing markets in developing countries: Evidence from Indonesia on the importance of enforcement. Land Use Policy 2013, 34, 255–264. [Google Scholar] [CrossRef] [Green Version]
- Tratalos, J.A.; Fuller, R.; Warren, P.H.; Davies, R.G.; Gaston, K.J. Urban form, biodiversity potential and ecosystem services. Landsc. Urban Plan. 2007, 83, 308–317. [Google Scholar] [CrossRef]
- Reardon, S.F.; Bischoff, K. Income Inequality and Income Segregation. Am. J. Sociol. 2011, 116, 1092–1153. [Google Scholar] [CrossRef] [PubMed] [Green Version]
- Greenstone, M.; Hanna, R. Environmental Regulations, Air and Water Pollution, and Infant Mortality in India. Am. Econ. Rev. 2014, 104, 3038–3072. [Google Scholar] [CrossRef] [Green Version]
- Rupprecht, C.D.D.; Byrne, J. Informal urban greenspace: A typology and trilingual systematic review of its role for urban residents and trends in the literature. Urban For. Urban Green. 2014, 13, 597–611. [Google Scholar] [CrossRef] [Green Version]
- Hassan, R. India’s Rising Inequality is Taking the Shine Off Its Growth Story Even in the World’s Eyes; scroll.in 23 December 2017. Available online: https://scroll.in/article/862368/indias-rising-inequality-is-taking-the-shine-off-its-growth-story-even-in-the-worlds-eyes (accessed on 20 December 2018).
- World Bank. Indonesia: Rising Inequality Risks Long-Term Growth Slowdown; World Bank Group: Jakarta, Indonesia, 2015. [Google Scholar]
- Anand, N.; Rademacher, A. Housing in the Urban Age: Inequality and Aspiration in Mumbai. Antipode 2011, 43, 1748–1772. [Google Scholar] [CrossRef] [Green Version]
- Romero-Lankao, P.; Gnatz, D.M.; Sperling, J.B. Examining urban inequality and vulnerability to enhance resilience: Insights from Mumbai, India. Clim. Chang. 2016, 139, 351–365. [Google Scholar] [CrossRef]
- Steinberg, F. Jakarta: Environmental problems and sustainability. Habitat Int. 2007, 31, 354–365. [Google Scholar] [CrossRef]
- MCGM, Development Plan for Greater Mumbai 2014–2034. Available online: https://s3.ap-south-1.amazonaws.com/wp-gmr-assets/Mumbai_Development_Plan_DP_2034_Draft_in_English.pdf (accessed on 30 June 2018).
- Sahana, M.; Dutta, S.; Sajjad, H. Assessing land transformation and its relation with land surface temperature in Mumbai city, India using geospatial techniques. Int. J. Urban Sci. 2018, 23, 205–225. [Google Scholar] [CrossRef]
- Aldous, D.E. Planning Green Open Spaces for South East Asian Capital Cities. Citygreen 2011, 1, 10. [Google Scholar] [CrossRef]
- Badan Pusat Statistik, B. Penduduk Indonesia: Hasil Survei Penduduk Antar Sensus 2015 (Population of Indonesia: Result of the 2015 Intercensal Population Survey); Badan Pusat Statistik: Jakarta, Indonesia, 2015. [Google Scholar]
- World Bank. Jakarta: Tantangan Perkotaan Seiring Perubahan Iklim; World Bank Group: Jakarta, Indonesia, 2011. [Google Scholar]
- Setiowati, R.; Hasibuan, H.S.; Koestoer, R.H. Green open space masterplan at Jakarta Capital City, Indonesia for climate change mitigation. In Proceedings of the IOP Conference Series: Earth and Environmental Science, Banda Aceh, Indonesia, 26–27 September 2018; Volume 200, p. 012042. [Google Scholar]
- Dinas Cipta Karya Tata Ruang dan Pertanahan Provinsi DKI Jakarta (2018). SiPraJa (Sistem Informasi Penataan Ruang Jakarta). Available online: https://jakartasatu.jakarta.go.id/portal/apps/webappviewer/index.html?id=1c1bfcced2cb4852bbeaefcd968a6d04 (accessed on 30 June 2018).
- Statistik, B.B.P. Jakarta Jakarta Dalam Angka (Jakarta in Figures) 2017; Jakarta, P.D., Ed.; BPS Provinsi DKI Jakarta: Jakarta, Indonesia, 2017. [Google Scholar]
- Tan, P.Y.; Wang, J.; Sia, A.; Sia, A. Perspectives on five decades of the urban greening of Singapore. Cities 2013, 32, 24–32. [Google Scholar] [CrossRef]
- Barsi, J.A.; Lee, K.; Kvaran, G.; Markham, B.; Pedelty, J.A. The Spectral Response of the Landsat-8 Operational Land Imager. Remote Sens. 2014, 6, 10232–10251. [Google Scholar] [CrossRef] [Green Version]
- Evans, J.; Geerken, R. Classifying rangeland vegetation type and coverage using a Fourier component based similarity measure. Remote Sens. Environ. 2006, 105, 1–8. [Google Scholar] [CrossRef]
- Geerken, R.; Zaitchik, B.F.; Evans, J. Classifying rangeland vegetation type and coverage from NDVI time series using Fourier Filtered Cycle Similarity. Int. J. Remote Sens. 2005, 26, 5535–5554. [Google Scholar] [CrossRef]
- Oleson, K.W.; Emery, W.J.; Maslanik, J.A. Evaluating land surface parameters in the Biosphere-Atmosphere Transfer Scheme using remotely sensed data sets. J. Geophys. Res. Space Phys. 2000, 105, 7275–7293. [Google Scholar] [CrossRef]
- Yang, H.; Yang, Z. A modified land surface temperature split window retrieval algorithm and its applications over China. Glob. Planet. Chang. 2006, 52, 207–215. [Google Scholar] [CrossRef]
- Zeng, X.; Dickinson, R.E.; Walker, A.; Shaikh, M.; DeFries, R.S.; Qi, J. Derivation and Evaluation of Global 1-km Fractional Vegetation Cover Data for Land Modeling. J. Appl. Meteorol. 2000, 39, 826–839. [Google Scholar] [CrossRef]
- Ke, Y.; Im, J.; Lee, J.; Gong, H.; Ryu, Y. Characteristics of Landsat 8 OLI-derived NDVI by comparison with multiple satellite sensors and in-situ observations. Remote Sens. Environ. 2015, 164, 298–313. [Google Scholar] [CrossRef]
- Rees, W.G.; Pellika, P. Principles of Remote Sensing; Remote Sensing of Glaciers: London, UK, 2010. [Google Scholar]
- Liew, S.C. Image Processing and Analysis. Available online: https://crisp.nus.edu.sg/~research/tutorial/process.htm (accessed on 25 January 2019).
- Nouri, H.; Beecham, S.; Anderson, S.; Nagler, P.L. High Spatial Resolution WorldView-2 Imagery for Mapping NDVI and Its Relationship to Temporal Urban Landscape Evapotranspiration Factors. Remote Sens. 2014, 6, 580–602. [Google Scholar] [CrossRef] [Green Version]
- Gutman, G.; Ignatov, A. The derivation of the green vegetation fraction from NOAA/AVHRR data for use in numerical weather prediction models. Int. J. Remote Sens. 1998, 19, 1533–1543. [Google Scholar] [CrossRef]
- Zhu, X.D.; Yang, Y.; Liu, X. The Importance of Housing to the Accumulation of Household Net Wealth; Joint Center for Housing Studies: Harvard University: Cambridge, MA, USA, 2003. [Google Scholar]
- Li, S.; Li, J.; Ouyang, A.Y. Housing and Household Wealth Inequality: Evidence from the People’s Republic of China; ADBI Working Paper: Tokyo, Japan, 2017. [Google Scholar]
- Kolbe, J.; Schulz, R.; Wersing, M.; Werwatz, A. Identifying Berlin’s land value map using adaptive weights smoothing. Comput. Stat. 2015, 30, 767–790. [Google Scholar] [CrossRef]
- Źróbek, S.; Cellmer, R.; Kuryj, J. Land value map as a source of information about local real estate market. Geodezja/Akademia Górniczo-Hutnicza im. Stanisława Staszica w Krakowie 2005, 11, 63–73. [Google Scholar]
- Kumar, S.; Gupta, S. Stamp Duty Ready Reckoner & Market Value of Flats in Mumbai 2017; The Architects Publishing Corporation of India: Mumbai, India, 2017. [Google Scholar]
- Nambiar, N. Ready Reckoner rates to remain unchanged in 2018–19. The Times of India, 1 April 2018. [Google Scholar]
- Mcgarigal, K.; Marks, B.J. Spatial Pattern Analysis Program for Quantifying Landscape Structure; Gen. Tech. Rep. PNW-GTR-351; US Department of Agriculture, Forest Service, Pacific Northwest Research Station: Portland, OR, USA, 1995; pp. 1–122. [Google Scholar]
- Zhu, P.; Zhang, Y. Demand for urban forests in United States cities. Landsc. Urban Plan. 2008, 84, 293–300. [Google Scholar] [CrossRef]
- Schwarz, K.; Fragkias, M.; Boone, C.G.; Zhou, W.; McHale, M.; Grove, J.M.; O’Neil-Dunne, J.; McFadden, J.P.; Buckley, G.L.; Childers, D.L.; et al. Trees Grow on Money: Urban Tree Canopy Cover and Environmental Justice. PLoS ONE 2015, 10, e0122051. [Google Scholar] [CrossRef] [Green Version]
- Ouyang, W.; Wang, B.; Tian, L.; Niu, X. Spatial deprivation of urban public services in migrant enclaves under the context of a rapidly urbanizing China: An evaluation based on suburban Shanghai. Cities 2017, 60, 436–445. [Google Scholar] [CrossRef]
- Dallimer, M.; Rouquette, J.R.; Skinner, A.M.J.; Armsworth, P.R.; Maltby, L.; Warren, P.H.; Gaston, K.J. Contrasting patterns in species richness of birds, butterflies and plants along riparian corridors in an urban landscape. Divers. Distrib. 2012, 18, 742–753. [Google Scholar] [CrossRef]
- Kabisch, N.; Haase, D. Green spaces of European cities revisited for 1990–2006. Landsc. Urban Plan. 2013, 110, 113–122. [Google Scholar] [CrossRef]
- Elmqvist, T.; Fragkias, M.; Goodness, J.; Güneralp, B.; Marcotullio, P.J.; McDonald, R.I.; Parnell, S.; Schewenius, M.; Sendstad, M.; Seto, K.C. Urbanization, Biodiversity and Ecosystem Services: Challenges and Opportunities; Springer: New York, NY, USA, 2013. [Google Scholar]
- Danford, R.S.; Strohbach, M.W.; Warren, P.S.; Ryan, R.L. Active Greening or Rewilding the city: How does the intention behind small pockets of urban green affect use? Urban For. Urban Green. 2018, 29, 377–383. [Google Scholar] [CrossRef]
- Jakarta, P.P.D. RTRW Kota/Kabupaten Administrasi Provinsi DKI Jakarta 2030. Available online: https://pertamananpemakaman.jakarta.go.id/assets/data/data-peraturan/PERDA-01_TAHUN_2012-TENTANG-RTRW_2030.pdf (accessed on 30 June 2018).
- Chatterjee, B. How Mumbai saved its beach, mangroves and green spaces. Hindustan Times, 18 April 2018. [Google Scholar]
- Leitão, A.B.; Miller, J.; Ahern, J.; McGarigal, K. Measuring Landscapes: A Planner’s Handbook; Island Press: Washington, DC, USA, 2012. [Google Scholar]
- Hwang, Y.H.; Yue, Z.E.J. Intended wildness: Utilizing spontaneous growth for biodiverse green spaces in a tropical city. J. Landsc. Arch. 2019, 14, 54–63. [Google Scholar] [CrossRef]
- Breuste, J.; Rahimi, A. Many public urban parks, but who profits from them? The example of Tabriz, Iran. Ecol. Process. 2015, 4, 187. [Google Scholar] [CrossRef] [Green Version]
- Kim, M.; Rupprecht, C.D.D.; Furuya, K. Residents’ Perception of Informal Green Space—A Case Study of Ichikawa City, Japan. Land 2018, 7, 102. [Google Scholar] [CrossRef] [Green Version]
- Xiao, X.; Aultman-Hall, L.; Manning, R.E.; Voigt, B. The impact of spatial accessibility and perceived barriers on visitation to the US national park system. J. Transp. Geogr. 2018, 68, 205–214. [Google Scholar] [CrossRef]
- La Rosa, D.; Takatori, C.; Shimizu, H.; Privitera, R. A planning framework to evaluate demands and preferences by different social groups for accessibility to urban greenspaces. Sustain. Cities Soc. 2018, 36, 346–362. [Google Scholar] [CrossRef]


| Landscape Metrics | Abbreviation | Description | Formula |
|---|---|---|---|
| Area-weighted mean patch area (hectare) | AREA_AM | The average area of all patches of a given type, weighted by the proportional abundance of the patch |  |
| Area-weighted Euclidean nearest neighbor distance (meter) | ENN_MN | The shortest straight-line distance from patch to nearest neighboring patch, weighted by the relative area of patches |  |
| Largest patch index (%) | LPI | The area of the largest patch in the landscape divided by total landscape area. It is a percentage of dominant landscape. |  |
| Landscape shape index (none) | LSI | Landscape shape index provides a standardized measure of total edge or edge density that adjusts for the size of the landscape. |  |
| Number of patches (none) | NP | The number of patches in the landscape. |  |
| Patch density (Number per 100 hectare) | PD | The number of patches on a per unit area basis that facilitates comparisons among landscapes of varying size. |  |
| Patch richness (none) | PR | The number of different patch types present within the landscape boundary. |  |
| Total area | TA | The metric defines the extent of the landscape |  |
| Indicator | 620.5USD | 1697.5USD | 2881USD | 4884USD | 9960USD | R | P-Value |
|---|---|---|---|---|---|---|---|
| Total UGS (% of total city area) | 22.1% | 3.3% | 1.6% | 0.3% | 0.2% | -0.601 | 0.2842 |
| Park provision (% of total city area) | 0.13% | 0.56% | 0.52% | 0.35% | 0.08% | -0.477 | 0.4168 |
| Proportion* of vegetation cover | 66.5% | 52.5% | 46.0% | 46.7% | 42.1% | -0.759 | 0.1368 |
| Proportion* of UGS | 43.3% | 22.9% | 11.1% | 9.4% | 11.9% | -0.635 | 0.2494 |
| Proportion* of managed UGS | 3.6% | 4.2% | 4.5% | 7.9% | 6.2% | 0.651 | 0.2337 |
| Proportion* of unmanaged UGS | 39.8% | 16.7% | 6.5% | 1.5% | 5.7% | -0.651 | 0.2337 |
| High vegetation cover** | 63.5% | 42.8% | 35.2% | 37.2% | 35.4% | -0.639 | 0.2453 |
| AREA_AM | 0 | 0 | 46.0185 | 11.8295 | 17.8557 | 0.2323 | 0.7069 |
| ENN_MN | 0.0103 | 0.0089 | 506.385 | 423.0085 | 475.2216 | 0.6907 | 0.1966 |
| LPI | 53.33 | 24.05 | 39.87 | 30.48 | 36.32 | -0.255 | 0.6791 |
| LSI | 11.7193 | 16.2463 | 20.0796 | 13.8867 | 9.9737 | -0.4865 | 0.4060 |
| NP | 208 | 374 | 453 | 211 | 84 | -0.6452 | 0.2397 |
| PD | 16,008,620,026 | 83,725,095,142 | 36.1185 | 63.8663 | 72.3979 | -0.4629 | 0.4324 |
| PR | 8 | 8 | 7 | 5 | 4 | -0.9454 | 0.0152 |
| TA | 0 | 0 | 1254.204 | 330.3776 | 116.0254 | -0.0558 | 0.9290 |
| Indicator | 56.5USD | 112.5USD | 262.5USD | 562.5USD | 1125USD | 1500USD | R | P-Value |
|---|---|---|---|---|---|---|---|---|
| Total UGS (% of total city area) | 1.3% | 0.8% | 2.8% | 1.8% | 1.8% | 2.5% | 0.483 | 0.3320 |
| Park provision (% of total city area) | 0.04% | 0.10% | 0.37% | 0.35% | 0.52% | 0.74% | 0.943 | 0.0048 |
| Proportion* of vegetation cover | 49.6% | 50.9% | 32.3% | 29.6% | 29.2% | 28.8% | -0.748 | 0.0873 |
| Proportion* of UGS | 57.6% | 20.0% | 12.4% | 8.0% | 7.2% | 14.0% | -0.527 | 0.2831 |
| Proportion* of managed UGS | 53.7% | 15.2% | 8.3% | 6.3% | 6.1% | 10.9% | -0.497 | 0.3160 |
| Proportion* of unmanaged UGS | 3.9% | 4.8% | 4.1% | 1.8% | 1.2% | 3.2% | -0.597 | 0.2116 |
| High vegetation cover** | 40.7% | 40.3% | 22.0% | 19.7% | 16.5% | 18.6% | -0.763 | 0.0776 |
| AREA_AM | 609.1124 | 17.7755 | 45.4973 | 23.7772 | 9.3833 | 51.0881 | -0.4404 | 0.3821 |
| ENN_MN | 201.119 | 305.7434 | 154.1733 | 140.3546 | 126.6797 | 109.0829 | -0.7256 | 0.1026 |
| LPI | 82.1 | 72.9 | 8.68 | 8.76 | 4.33 | 9.16 | -0.689 | 0.129 |
| LSI | 7.913 | 20.5708 | 44.0504 | 49.8171 | 60.4489 | 51.6365 | 0.7749 | 0.0703 |
| NP | 105 | 361 | 2249 | 2654 | 3182 | 2668 | 0.7667 | 0.0753 |
| PD | 11.7673 | 72.9691 | 123.5477 | 217.0659 | 264.2616 | 159.9799 | 0.6896 | 0.1296 |
| PR | 5 | 6 | 7 | 7 | 6 | 6 | 0.0747 | 0.8882 |
| TA | 892.3 | 494.73 | 1820.35 | 1222.67 | 1204.11 | 1667.71 | 0.05028 | 0.3093 |
© 2020 by the authors. Licensee MDPI, Basel, Switzerland. This article is an open access article distributed under the terms and conditions of the Creative Commons Attribution (CC BY) license (http://creativecommons.org/licenses/by/4.0/).
Share and Cite
Hwang, Y.H.; Nasution, I.K.; Amonkar, D.; Hahs, A. Urban Green Space Distribution Related to Land Values in Fast-Growing Megacities, Mumbai and Jakarta–Unexploited Opportunities to Increase Access to Greenery for the Poor. Sustainability 2020, 12, 4982. https://doi.org/10.3390/su12124982
Hwang YH, Nasution IK, Amonkar D, Hahs A. Urban Green Space Distribution Related to Land Values in Fast-Growing Megacities, Mumbai and Jakarta–Unexploited Opportunities to Increase Access to Greenery for the Poor. Sustainability. 2020; 12(12):4982. https://doi.org/10.3390/su12124982
Chicago/Turabian StyleHwang, Yun Hye, Ivan Kurniawan Nasution, Deepika Amonkar, and Amy Hahs. 2020. "Urban Green Space Distribution Related to Land Values in Fast-Growing Megacities, Mumbai and Jakarta–Unexploited Opportunities to Increase Access to Greenery for the Poor" Sustainability 12, no. 12: 4982. https://doi.org/10.3390/su12124982