Using the Multilevel Random Effect Model to Analyze the Behavior of Carpool Users in Different Cities


1
Department of Civil Engineering, National Chi Nan University, Nantou County 545, Taiwan
2
Department of Civil and Architectural Engineering and Mechanics, The University of Arizona, Tucson, AZ 85721, USA
*
Author to whom correspondence should be addressed.
Sustainability 2021, 13(2), 937; https://doi.org/10.3390/su13020937
Submission received: 15 December 2020
/
Revised: 12 January 2021
/
Accepted: 13 January 2021
/
Published: 18 January 2021
(This article belongs to the Special Issue Innovations towards Greener and Smarter Mobility for Sustainable Development)
Abstract
:The purpose of this study was to offer a comprehensive econometrical framework based on a multilevel random effect logistic model that could highlight important contributors to carpool users among different cities with various attributes. The data was collected from the three cities of Tucson, AZ, USA; El Paso, TX, USA; and Austin, TX, USA and was based on register-based travel trip data from the Metropia platform and American Community Survey information from 2016 to 2017. The empirical results indicated there were statistically significant differences among carpool users in different cities due to the transportation mode, number of vehicles available, total number of males driving alone, and number of single-parent households. The individual level result showed that incentives had a significant effect on the promotion of carpool passenger and driver behavior. In addition, the time of finding the parking space at work, living situation of the household, flexibility to change departure times, gender, and age could effectively increase the possibility of carpool usage. The results of this study give a better understanding of the events in the initial factors of carpooling behavior and can be used by the government or commercial company to design an effective solution for traffic congestion.
1. Introduction
Car ownership has rapidly increased in recent years; however, road capacity is restricted due to the limitations of road space. One of the solutions for reducing congestion is to decrease the number of vehicle miles traveled (VMT). Public transit provides a service with fixed routes and schedules, making it hard to migrate travelers from private vehicles to public transit. As an alternative, carpooling has become a popular approach for traffic congestion management, as it directly reduces the number of cars participating in the transportation system. Less ownership of vehicles could become important for the environmental challenges associated with car use. A previous study indicated that the greater the number of carsharing users, the fewer vehicles owned per household [1]. Carsharing and carpooling are believed to be “a potential new pathway to sustainability” [2].
The conventional method used to investigate carpool factors is a questionnaire survey, in which participants respond to questions based on their experience. However, a questionnaire survey is inflexible, as it is impossible to conduct a resurvey when extra information is needed to support the result. Rainie and Zickuhr [3] reported that cellphones and smartphones have become a mainstay in the lives of many Americans, and that two-thirds of users complete their trips by using GPS navigation apps on their devices. The Metropia platform used in the study is an incentive-based congestion-management platform that aims to motivate travelers to change their behavior and explore new mobility options (departure times, routes, and modes) to reduce congestion. The Metropia platform provides a carpool function called DUO (drive-up occupancy). DUO is a dynamic tool that matches drivers and riders as carpoolers once they are inside a vehicle and does not require pre-matching (Metropia does the in-situ matching) or cash payments; instead, it offers incentives to spur drivers and riders to carpool daily or for special occasions. The platform observes that socio-demographic factors, the users’ travel behavior, and an incentive-based approach incrementally change behaviors by empowering and motivating travelers to explore new mobility options (departure time, route, and mode). Incentive schemes are the most common method adopted to influence people’s travel behavior. Ben-Elia and Ettema [4] mentioned that incentives are effective tools in changing commuting behavior and can reduce the number of drivers during rush-hour, shift driving to off-peak times, and increase the usage of public transport. This study also examined how extra incentive rewards could increase carpooling usage.
Furthermore, previous studies use questionnaire survey data from individuals who provide personal and travel information. However, most of them focus on the determinants of carpool choice or passengers’ behavioral intentions to carpool, and these studies usually have been conducted at the individual observations. Alternatively, few studies are concerned with geographical areas, so that the result only measures the effect of carpool probability but does not observe the effect of population on the regional characteristics of travel behavior. The comparisons of travel behavior between different cities could support governments or relevant industries such as carpool platform companies or transportation network companies (TNC) to design the right promotion strategy for a specific city. However, most of the previous studies omit city level attributes. The characteristics of a city, such as economic conditions, population composition, industrial structure, transportation facilities, and traffic conditions, can vary among different cities. Analyzing travel behavior for different cities without involving city-level factors may disregard the heterogeneity among cities.
The data in this study came from three cities (Tucson, AZ, USA; El Paso, TX, USA; and Austin, TX, USA) and consisted of a dataset with 1943 observations based on an average of 24 months of activity for each user from 2016 to 2017. City characteristics may vary in different cities over time due to their demographic and socioeconomic infrastructure (e.g., household income, public transportation, and transportation mode). Traditional logistic regression models can disaggregate macro social data (city characteristics) and travel behavior data (carpool characteristics) into a single-level model. However, this will violate the independence and homogeneity hypothesis, because logistic regression assumes that the residuals from the model are independent across subjects [5]. A multilevel model relaxes the above assumption and allows the effects of these variables to vary across groups. Multilevel logistic regression can account for the lack of independence across levels of nested data (i.e., individuals nested within groups) and is appropriate when there is a correlation among clusters of subjects.
The data hierarchy of user carpooling was postulated as follows: Returning carpool users represent the lowest level of the hierarchy, while the change in cities over time represents the higher-level hierarchy or cluster. Hence, it was reasonable to claim that correlation exists among travel behavior occurring in the same city, because these travel behaviors may share unobserved and/or unrecorded characteristics of the city.
Therefore, this study aimed to develop a model for analyzing the determinants of travelers becoming habitual carpool users in different cities. This study had two specific objectives: (1) to explore the effect factor on the individual level and city level; and (2) to evaluate the effect of incentive awards on making travelers become habitual carpool users. The remainder of this paper is structured as follows: Section 2 is the literature review; Section 3 describes the construction of the conventional logistic regression and multilevel random effect logistic regression model; Section 4 introduces the data and analysis; and Section 5 presents the results and estimations given by the proposed model. Finally, Section 6 provides the conclusions and recommendations.
2. Literature Review
Making travelers use carpooling as their habitual travel mode presents some challenges. It is necessary to understand the behavior of carpool users who continuously use such a service and the factors in the success of reaching ways to improve carpooling usage [6].
Neoh et al. [7] summarizes the scheme of carpooling, divided into three kinds of classification, including demographic-related variables, situational-related variables (economic and transportation characteristics of the county), and situational-related variables (the attractiveness of share a ride). Men usually are more flexible in arranging car trips through peer-to-peer platforms, and having children is also an important control variable [8]. Carpool commuting trips are generally longer than single-occupant travel trips, but there is no significant evidence that shows the commute distance and travel time is an encouraged [8,9] or discouraged factor [10]. The trip of commuting to work and characteristics of daily commuting trips differ from long-distance trips [11] and carpoolers also have a positive attitude towards public transport and more environmental awareness [12]. Some indicators are expected to capture the carpool, such as reducing congestion, which influences carpooling [7], and due to the environmental concerns, intention to carpool to reduce the adverse impacts of air pollution is rising [13]. Olsson et al. [14] found that judgmental factors (psychological factors) and external third-party interventions (e.g., incentive programs or parking policy) are still very important for an individual’s decision to carpool or not. When using judgmental factors to promote carpooling, it is crucial to pay attention to demographic characteristics, such as the number of cars in a household and parking availability in future research.
As [8,15] pointed out, considering the characteristics of the geographical areas will be more meaningful for the policy implications for traffic management, city resilience, and local economic development. The diversity of economic development [16] and the spatial distribution of jobs and residences [15] are well-known important factors of carpooling. Benita [17] indicated that the spatial autoregressive models show that the demographics variables of agglomeration (population of density) and car ownership (the percentage of a household with no car) related to demographics do the best job of explaining the rates of carpooling.
To sum up, the previous studies have investigated the motivations, trip attributes, socio-demographics, and incentives to understand which of these factors are the critical successful carpool factors. Therefore, this study incorporates the factors and aims to develop a model for analyzing the determinants of travelers becoming carpool users in different cities.
3. Model Methodology
The traditional logistic model is generally used to analyze the binary response function, as shown below:
where is the value of the independent variable, is the corresponding coefficient, is the random effects of and , , is the number of independent variables, and represents the event of success. The possibility of choice is as below:
The maximum likelihood method is employed to measure the associations by constructing the likelihood function as follows:
In the multilevel model, supposing the existence of two-level structure data, three different equations can be formulated: an individual-level model (level 1 model), a city-level model (level 2 model), and a combined model. Assuming the errors are distributed normally, for subject ij of this study, the level 1 model is as follows:
where β0j is the intercept, β1j is the regression coefficient associated with predictor βij, and the slope coefficient β1j is assumed to vary across districts depending on their effects at the city level. γij is the residual accounting for the level 1 random effects. The formulation is similar to a traditional regression model; however, there is an important difference, in that both the intercept and regression coefficients have subscript j, indicating that intercept β0j and slope coefficient β1j are permitted to vary across the level 2 administrative area.
According to Yannis, Papadimitriou, Antoniou, Kreft and de Leeuw [18,19], corresponding with a defined random intercept and random slope model, the level 2 model shown below has a subscript, because they are assumed to vary across administrative areas.
To consider the binominal variables as continuous variables, a logit transformation is required. In this study, the dependent variable Pij denotes the possibility of carpool users, and Pij = (0,1). To be more precise, to predict the possibility of carpool users, considering a binomial Yij = (0,1) outcome, and Pij = [exp(Yij)/(1+exp(Yij))], substitute this with Formulas (4) and (5), as shown below:
where Yij is the logit prediction for the subject at level 1 and the jth unit at level 2, γ00 is the intercept denoting the grand mean, Wj, the regional (city) level characteristic, Xij the individual (carpool user) level characteristic, and γq0 is the regression coefficient associated with the regional level characteristic and individual level characteristic. In other words, the fixed effects determined by the regression coefficients of γqs, which are associated with the slope variance for each variable at the individual level, are explained by a variable at the city level. μqj is a random effect accounting for the random variation at level 2, where μj~(0, τ00), and γij is the individual-level random effect, where γij~(0, σ2).
It is necessary to determine the proportion of the total variability that can be accounted for by differences among cities. The ratio of the between-group variance to the total variance, termed the intra-city correlation, ICC, is also denoted by ρ:
where σ2 is the within-group variance in level 1 and is the between-group variance. In the applied logistic model, the level 1 residuals are assumed to follow the standard logistic distribution, which has a mean of 0 and a variance of σ2 = π/3 = 3.29. If the ICC is sufficiently close to zero, then there is effectively no variation in the violation carpool user between the level 2 regions, suggesting that the standard subject level models are adequate for such data. However, a significant value of ρ implies that the multilevel random effect logistic model should be used.
4. Data
4.1. Data Description
DUO matches drivers and riders (passengers) as carpoolers once they are inside a vehicle and offers incentives to spur drivers and riders to carpool on a daily basis or a special occasion. During data collection, Metropia users are able to select among three alternative mobility options; driving alone, being a carpool driver, and being a carpool passenger.
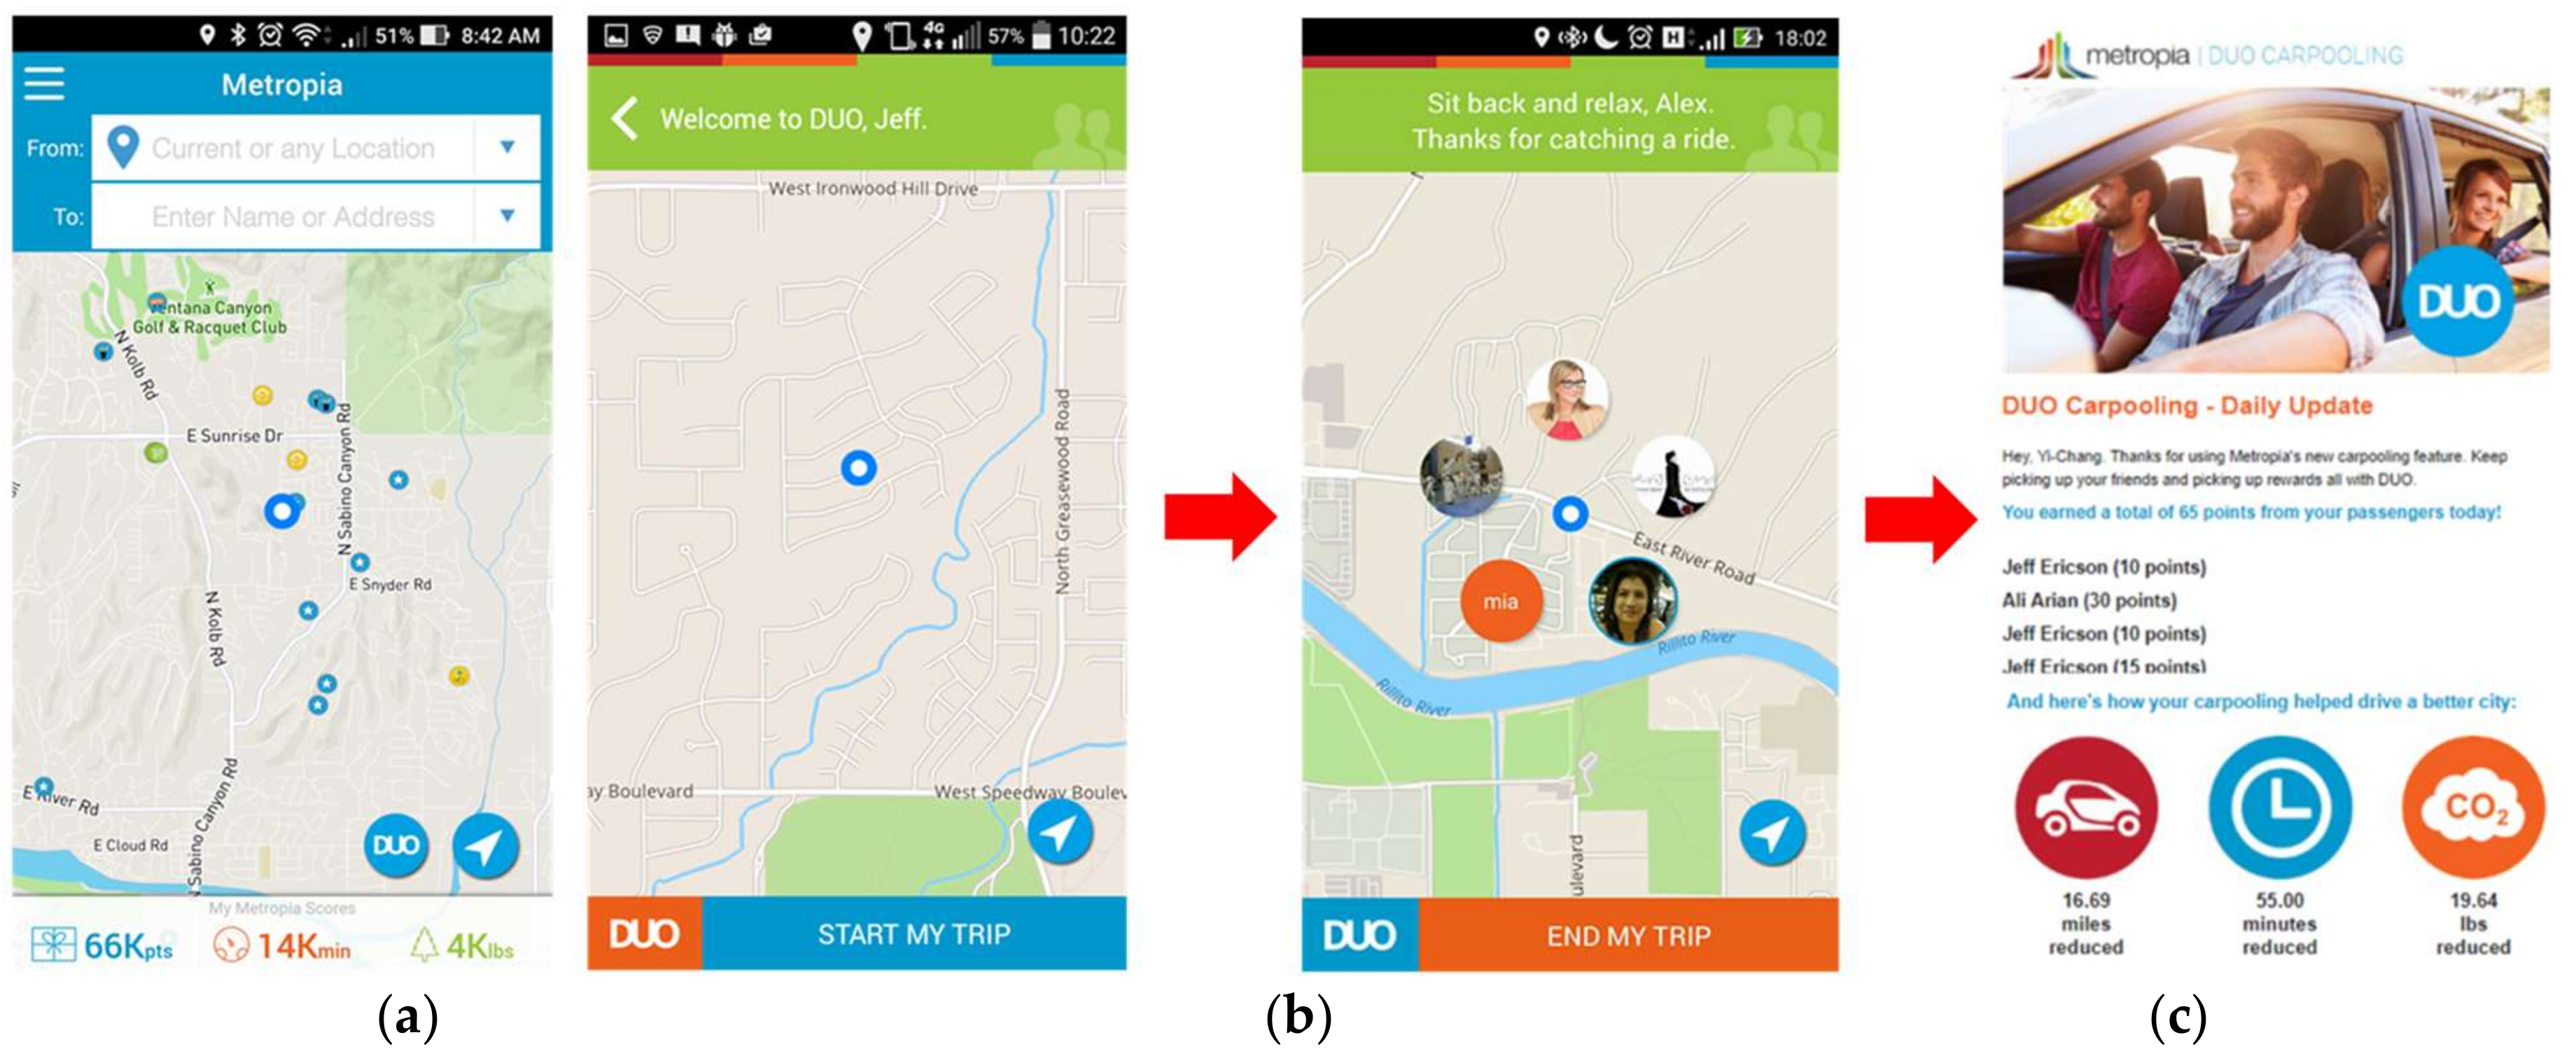
The Metropia driver will be paired and identified as a driver by comparing the user’s GPS trajectories in real-time. The other passengers are also paired and identified as a DUO passenger, as shown in Figure 1a. When a DUO passenger arrives at the destination (if the trip is valid), the DUO passenger will earn a base trekpoint incentive and a chance to win additional points by spinning a “prize wheel” in the app, as shown in Figure 1b. In other words, the pairings of DUO passengers and drivers are performed automatically. Once the pairing is complete for a specific DUO passenger, the driver app will give an audio cue to the driver that the pairing with a specific DUO passenger has been successful. Finally, the passenger is given an additional bonus of half from the prize wheel by each driver receives, and the driver gets an email record, as shown in Figure 1c.
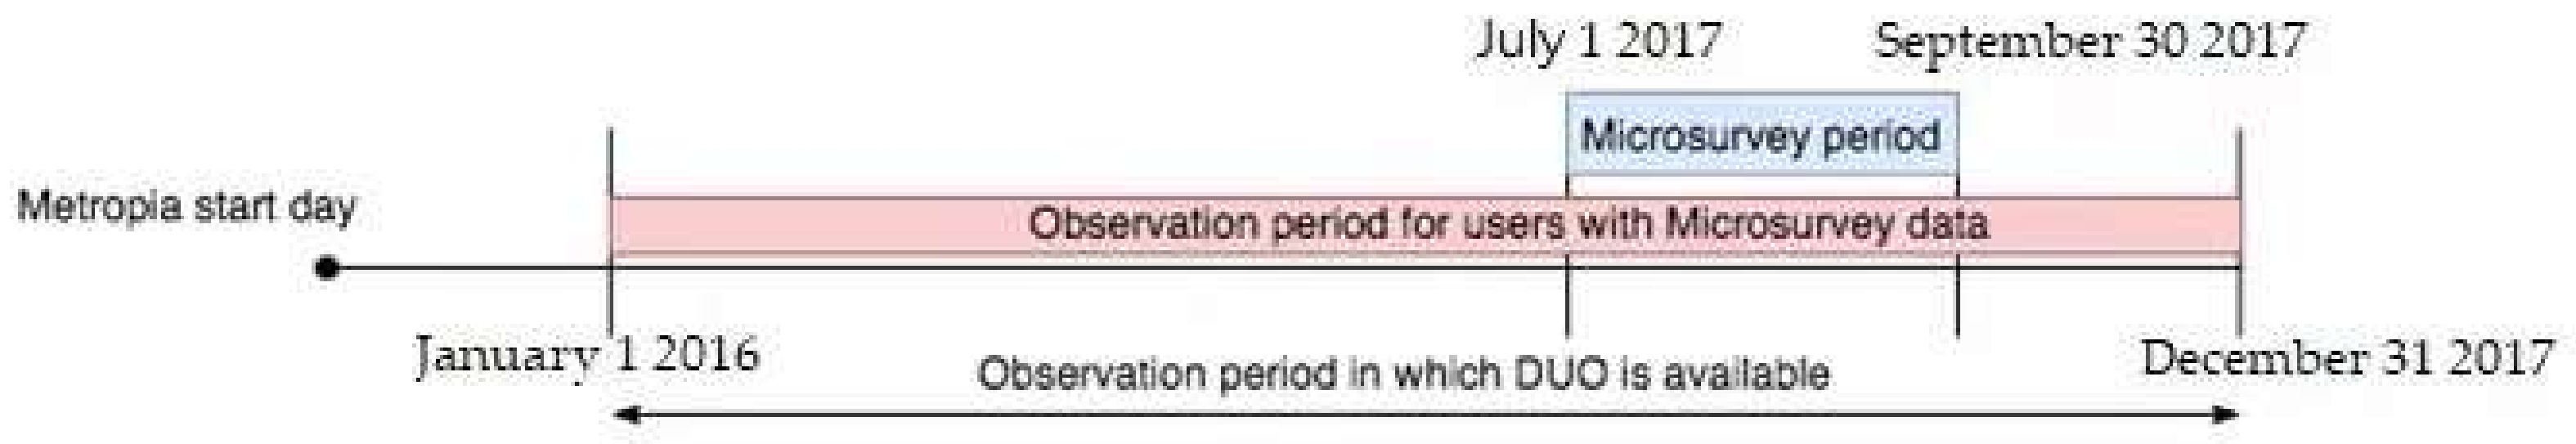
Three cities were included in this study (Tucson, El Paso, and Austin), and the data were collected through the Metropia platform. The data consisted of probe data such as detailed positioning, trajectory, and velocity derived from the user trajectories formed by GPS points. Beyond passively collecting data, the Metropia platform includes a micro-survey tool, which allows questions to be asked directly to the users to understand their behavior and travel patterns better, as well as to obtain pertinent socio-demographic information. The use of this tool provides response rates that are significantly higher than the response rates from traditional surveys. The DUO service was initiated in these three cities in January 2016, and Metropia’s micro-survey feature was deployed from 1 July 2017 to 30 September 2017, and Figure 2 illustrates the timeframes. Since not all users answered all questions, during data processing, this study only adopted user data consisting of complete answers. There were a total of 69 users investigated in this study, resulting in a dataset of 1943 observations based on an average of 14.3 months of activity for each user.
4.2. Data Analysis
This study summarized the commuter trip attributes, as shown in Table 1. The user who has more than one-time carpool experience has a higher number of total trips in one month, and the same result on the following variables, such as the average frequency of using APP per day, the number of carpooling experiences compared to the driver, the average frequency of using APP per day, and the average points during every trip for being a carpool driver and passenger. We speculate that a no carpool experience user is higher on the average travel speed and the percentage of peak hour trips than a more than one-time carpool experience user.
The socio-demographic variables were collected using a micro-survey and summarized as shown in Table 2. It shows that the carpool users were more prevalent among male drivers (59.9%) than female drivers (48.3). A majority of carpool users was those aged 35–45 (37.0%), followed by those aged 26–34 (26.0%). The smallest number was between 56 and 65 years of age (8.9%). However, the percentage of carpool users renting a house/townhouse or living with friends/family was higher than that of non-carpool users (20.6% vs. 18.5% and 6.8% vs. 3.3%). Obviously carpooling was more preferred in the 26–34 years old group (28.0% vs. 18.3%) than in the 18–25 years old group (9.3% vs. 6.1%). The user who lives with a family of more than three people has a higher percentage of choosing carpool (54.6% vs. 44.8% and 16.5% vs. 9.2%). More than half of carpool users are flexible to change their departure time by about one to fifteen minutes, and relative to users who never carpool, the percentage of carpool users (54.4% vs. 48.3%) was much higher. More than 90% of the carpool users could find parking in less than five minutes; however, Table 2 also indicates that there were a higher percentage of carpool users who needed more than five minutes to find parking.
Table 3 summarizes the basic statistical analysis of the aggregate variables for the different cities’ characteristics in this study. All of the variables were collected by the American Community Survey (ACS). The principal mode of government workers to get from home to work is public transportation (GOVTPT), which continued to increase from 2016 to 2017 in Tucson. We analyze the statistics of the number of available vehicles (including passenger cars, vans, and pickup or panel trucks) at home for the household members, one is less than one vehicle (LTVEH), and the other is three or more vehicles available (GTVEH). In Austin, the number of available vehicles is less than one for the use of household members, which rose from 161,222 in 2016 to 164,358 in 2017, but the other cities showed a decreasing trend. In contrast, the number of available vehicles are three or more for the use of household members in the three cities, increased from 2016 to 2017. The commuter worker is male, the primary travel type is driving alone (DRALONE), and the most significant number of people in this category was in Austin in 2017 (204,468 people), and the lowest was in Tucson in 2016 (88,348 people), and in all cities, the number of males driving alone increased from 2016 to 2017. Considering the effect of school enrollment on each household, this study collected the statistical data of children aged three to 17 and then divided the data into children from married-couple households (CHCPLHH) and children from single-parent family households (CHSGLHH). As shown in Table 4, the greatest number of school-aged children in married-couple family households were in Tucson (91,469 and 94,680) and the total population increased each year; however, in Austin there were only 43,636 and 42,179 school-aged children in married-couple family households. The median reported wage or salary income (SALAINCO) was used as a measure of affluence, and the average annual income per household was found to be between 25,275 (in Tucson) and 38,867 (in Austin). The highest median age of workers over the age of 16 was 40.0 in El Paso in 2016.
5. Model Estimation Results
Table 4 shows the variables in the multilevel structure, including the individual-level characteristics of the drivers using the Metropia app (level 1) and the city-level features (level 2) used in this research. There is the list for all considered as primary factors affecting carpool behavior within cities. Level 2 included natural logarithmic values such as “the total worker population of government workers’ principal mode to get from home to work is public transportation in each city”, “the total worker population in which the number of available vehicles at home and household members’ use is less than one vehicle in each city”, and “the total worker population that are single-parent households that have children between the age of three and 17 who are enrolled in school in each city”, we assume a positive effect on the carpool user. In other words, “the total worker population of the commuter worker is male, and the primary travel type of working is driving alone in each city” has a negative correlation to the carpool user.
For level 1, only those individual variables with significant estimation results were listed and discussed in this study. We supposed that the increase in the number of total trips per month, starting a trip in the morning, the average travel time, the average travel speed, the average earned points per trip, and the percentage of average earned points as a DUO user would present a significant positive effect in the model. According to the previous data analysis, it was found that “male”, “the age between 26 and 45 years old”, “living with family, the users are the flexibility to change the departure time”, and “more than 5 min to find parking”; we assume positive correlation to the carpool user in the study.
The first column result in Table 5 summarizes the logistic regressions and multilevel logistic random-effect model estimated by the maximum likelihood in the three cities over two years (from 1 January 2016 to 31 December 2017). The response variable was a dichotomy that distinguished the Metropia app user, who is a carpool user (1) or not (0). In this study, three types of drink driving models were tested: standard logistic regression and random-effects logistic regression. The McFadden’s pseudo-R2 were 0.328 and 0.370 at two models calculated as a standard measure of the model fit. Next, it can be seen that, the AIC value of the multilevel logistic model is 1194.909, much smaller than that of the single-level model. This means that models including the city feature as a higher-level predictor via multilevel logistic regression have better goodness of fit than the standard logistic model, which set city features as an individual-level parameter. At last, the random-effect logistic regression model was chosen as the final model.
In the study, we assume that the structure of the behavior of carpool users’ data is hierarchical, with users clustered within cities. The assumptions of such clustering are that users in a given city tend to behave more like one another than the users in different cities. In order to determine whether the multilevel modeling is superior to standard logistic regression, the multilevel random effects logistic regression model is characterized with an important statistic (), which is often referred to as the residual intra-group correlation coefficient [20]. is also called the ICC value. When the multilevel logistic random-effect model was applied, the level 1 residuals were assumed to follow the standard logistic distribution, which had a mean of 0 and a variance () of . This variance represented the within-group variance for the ICC calculations for dichotomous data, and the ICC could be similarly defined for ordinal outcomes [21]. In this study, the intra-city correlation was 0.109 and was statistically significant (). This means that 10.90% of unexplained variations in carpool users resulted from between-cities variance, which strongly suggests the usefulness of the model specification of hierarchical structure. If the model was implemented without considering the random effects between cities, the results will be biased and inaccurate. Then, the sigma_u = 0.634 (Z-value = 2.297) to represent the random effects across the cities. The result indicates that the variance in the individual level is predicted by different cities. That is, the behavior of carpool users level varies by cities, even after controlling for the effects of individual variables. It is also implied that the consideration of multilevel factors leads to a better understanding of the complex urban environment affection index for cities. This means that higher-level (aggregate level) factors have either direct or indirect impacts on the behavior of the carpooling of cities. Because of this, it was determined that the random effect logistic model was superior to standard logistic regression.
The aggregate level showed that the coefficient was 0.280, suggesting that total worker population of government workers’ principal mode to get from home to work is public transportation in each city have a positive significant effect on the model. As a result, we supposed that interurban public transport users may be significantly attracted to carpooling. Similar to the results of [22], the statistics report indicated that the attractive features of carsharing were more appealing when closely integrated with public transit. [23] mentioned that a public transport subscription can be interpreted as people who are not completely dependent on their private car but also use other mobility options and are more likely to use carpools. Having less than one passenger vehicle available for the use of household members was positively related to car sharing. This result was obvious, because with only a single vehicle in the household, there could occasionally be a need for a second vehicle. Stillwater and Mokhtarian [24] also showed that the proportion of single-vehicle households is positively related to carsharing. As the level of car sharing service increases, so does the proportion of households with low vehicle ownership [25]. Martin et al. [1] also suggested that as carshare users increase, the average number of vehicles owned in a household decreases. Being male and driving alone was negatively related to carsharing, which was expected, given that these individuals would generally already be vehicle owners. The result of driving alone of the user in this study may be the same as the [24] study result, which also supports the notion. The coefficient value of lnCHSGLHH was 8.879, suggesting that the total worker population that belong to a single-parent household that has children between the age of three and 17 who are enrolled in school in each city would have increased carpool usage. Before bringing in the variable of lnCHSGLHH, the model showed that the variable of having children in married-couple family households (lnCHCPLHH) had a negative but insignificant effect on carpool behavior. The reason for the result might be that households with children will undertake more complex activities in general; thus, it is more challenging to accomplish all activities and trips using carsharing [26]. However, in single-parent households, the father or mother might have sole responsibility for all aspects of day-to-day childcare. Thus, the need for a support system such as a carpool is even more vital.
On an individual level of travel behavior, the most positive effect of the results obtained, with respect to carpool users, were more likely to be the number of the total trip (coef. = 5.209). As [27] indicated, as the number of trips increased, the carpooling advantages began to be noticed from social support to play a significant role. The awareness regarding environmental issues increases, and the users begin to engage in actions to relieve these threats, following the percentage of average earned points as a DUO driver or passenger (coef. = 3.486). The determinants of carpooling behavior could be different between t carpooling passengers and drivers, because drivers may need to spend additional time making detours or experience uncertainty regarding road conditions. This is reasonable for a significant positive effect (coef. = 0.119) on the average earned points per trip as a DUO driver. The results implied that similar incentives could be used to promote carpool passenger or driver behavior. On the other hand, the most significant socio-demographic variable according to the micro-survey was time needed to find a parking spot (coef. = 1.487). Parking conditions were a positive and significant factor. The respondents were more likely to choose one-way carsharing if they perceived parking conditions to be good. Burkhardt and Millard-Ball [28] indicated that the main reason to choose carsharing is the lack of parking hassles, while [29] stated that one of the factors of successful carsharing is the reduction of parking pressure. Living with friends/family had a significant positive effect (coef. = 1.326) on carpool users. DeLoach and Tiemann [30] indicated that carpools among family or friends living in the same household are easier to initiate as the participants share the same origin and are familiar with one another. However, Tiemann [31] indicated that carpools, which are organized within households, are affected by additional travel and waiting times to accommodate each member. The coefficient of the flexibility of commuters to change the departure time was 0.299 for carpool users, suggesting that this variable had a positive impact on the model. The results of [32] also suggested that commuters who have flexible working hours could indirectly encourage commuters to carpool. The average frequency of using the Metropia app per day had a negative significant effect (coef. = −5.166) on carpool users due to the users being too inflexible to seek carpooling partners. Similar to the results of this study, other studies have found that males are generally stated to have a positive influence [8,33,34,35].
6. Conclusions
This research was performed by collecting datasets showing the travel behavior of Metropia users who are carpool passengers, carpool drivers, and drive-alone drivers from the three American cities of Tucson, El Paso, and Austin from 2016 to 2017, as well as by estimating the factors and city characteristics that could affect the usage of carpools through a multi-level analysis that enabled the simultaneous consideration of hierarchical datasets.
Specifically, in the model result, the relationship between different city characteristics and users had statistical significance. A hierarchical model incorporating the between-city variance was used to identify the significant factors used to predict carpool usage. It is important to plan policies based on city characteristics to increase the use of carpooling and identify the potential characteristics of carpool usage. Decreasing the possibility that the total worker population of the commuter worker is male and the primary travel type of working is driving alone in each city should be a priority in cities with carpool usage, and developing public transportation will raise carpool usage. For example, specific to the male worker population, developing strategies and decreasing total commute trips by different cities is one of the most important policies. Additionally, developing public transportation and carpooling are functioning mutually. Therefore, the government should prioritize actions that can improve the public transportation system, which has become an inevitable tendency. Additionally, considering the population of transportation demands of single-parent households and how to decrease the total worker population, the number of available vehicles at home is important for increasing carpool usage. In conclusion, when multilevel factors are incorporated during urban transportation planning and management, to grasp the primary influence of urban carpool, controlling users’ mode use and private car management allocation will be more accurate. Furthermore, the processing registry data at the aggregate level typically takes at least one year, rather than data that only considers the individual effect, and would be more appropriate to apply to predict cities’ performance in the future.
Based on what the model estimation result of the individual level characteristics shows, the average earned points per trip as a DUO driver and the percentage of average earned points as either a DUO driver or passenger increased the participation of carpool passengers and drivers; this result implied that incentives could be used to promote carpool passenger or driver behavior. As such, incentives may be useful tools for increasing carpool users. The model of this study also determined that the time needed to find parking, household living characteristics, having the flexibility to change departure times, being between 26 and 45 years of age, and being male could effectively increase the possibility of carpool usage.
The results of this study could help governments or commercial companies provide a better understanding of the events and initial factors of carpooling behavior. Moreover, the study results could help governments provide a better public transportation service using strategies that are more effectively constructed and more efficiently targeted to city characteristics. The limitation in the study is that the number of usages and the travel distance both can be used as the dependent variable. However, it is not our intention to investigate these issues due to the fact that a handful of data and modeling framework that we had.
Author Contributions
T.-Y.C. made substantial contributions to the conception and design, acquisition of data analysis, interpretation of data, and participation in writing the article. R.-C.J. participated in revising the manuscript critically for important intellectual content and gave final approval of the version to be submitted. Y.-C.C. contributed to sample preparation and critical feedback, and helped to shape the research. All authors have read and agreed to the published version of the manuscript.
Funding
This research was funded by Ministry of Science and Technology grant number 108-108-2221-E-260-002-MY3 and 108-2811-E-260-500.
Institutional Review Board Statement
The study did not require ethical approval.
Informed Consent Statement
Not applicable.
Data Availability Statement
Not applicable.
Acknowledgments
This study was sponsored by the Ministry of Science and Technology (contract numbers: 108-108-2221-E-260-002-MY3 and 108-2811-E-260-500). The authors would like to thank Metropia, Inc. for providing the user behavior and Micro-Survey data.
Conflicts of Interest
The authors declare no conflict of interest.
References
- Martin, E.; Shaheen, S.; Lidicker, J. Impact of carsharing on household vehicle holdings. Transp. Res. Record. 2010, 2143, 150–158. [Google Scholar] [CrossRef]
- Heinrichs, H. Sharing economy: A potential new pathway to sustainability. GAIA 2013, 22, 228–231. [Google Scholar] [CrossRef]
- Rainie, L.; Zickuhr, K. Americans’ Views on Mobile Etiquette. Available online: https://www.pewresearch.org/internet/2015/08/26/americans-views-on-mobile-etiquette/ (accessed on 10 January 2021).
- Ben-Elia, E.; Ettema, D. Changing commuters’ behavior using rewards: A study of rush-hour avoidance. Transp. Res. Part F Traffic Psychol. Behav. 2011, 14, 354–368. [Google Scholar] [CrossRef]
- Jones, A.P.; Jørgensen, S.H. The use of multilevel models for the prediction of road accident outcomes. Accid. Anal. Prev. 2003, 35, 59–69. [Google Scholar] [CrossRef]
- Correia, G.; Viegas, J.M. Carpooling and carpool clubs: Clarifying concepts and assessing value enhancement possibilities through a Stated Preference web survey in Lisbon, Portugal. Transp. Res. Part A Policy Pract. 2011, 45, 81–90. [Google Scholar] [CrossRef]
- Neoh, J.G.; Chipulu, M.; Marshall, A. What encourages people to carpool? An evaluation of factors with meta-analysis. Transportation 2017, 44, 423–447. [Google Scholar] [CrossRef]
- Prieto, M.; Baltas, G.; Stan, V. Car sharing adoption intention in urban areas: What are the key sociodemographic drivers? Transp. Res. Part A Policy Pract. 2017, 101, 218–227. [Google Scholar] [CrossRef]
- Jacobson, S.H.; King, D.M. Fuel saving and ridesharing in the US: Motivations, limitations, and opportunities. Transp. Res. Part D Transp. Environ. 2009, 14, 14–21. [Google Scholar] [CrossRef]
- Buliung, R.N.; Soltys, K.; Bui, R.; Habel, C.; Lanyon, R. Catching a ride on the information super-highway: Toward an understanding of internet-based carpool formation and use. Transportation 2010, 37, 849–873. [Google Scholar] [CrossRef]
- Dargay, J.M.; Clark, S. The determinants of long distance travel in Great Britain. Transp. Res. Part A Policy Pract. 2012, 46, 576–587. [Google Scholar] [CrossRef]
- Delhomme, P.; Gheorghiu, A. Comparing French carpoolers and non-carpoolers: Which factors contribute the most to carpooling? Transp. Res. Part D Trans. Environ. 2016, 42, 1–15. [Google Scholar] [CrossRef]
- Canning, P.E.; Hughes, S.J.; Hellawell, E.E.; Gatersleben, B.C.M.; Fairhead, C.J. Reasons for participating in formal employer-led carpool schemes as perceived by their users. Transp. Plan. Technol. 2010, 33, 733–745. [Google Scholar] [CrossRef]
- Olsson, L.E.; Maier, R.; Friman, M. Why Do They Ride with Others? Meta-Analysis of Factors Influencing Travelers to Carpool. Sustainability 2019, 11, 2414. [Google Scholar] [CrossRef] [Green Version]
- Vanoutrive, T.; Van De Vijver, E.; Van Malderen, L.; Jourquin, B.; Thomas, I.; Verhetsel, A.; Witlox, F. What determines carpooling to workplaces in Belgium: Location, organisation, or promotion? J. Trans. Geogr. 2012, 22, 77–86. [Google Scholar] [CrossRef] [Green Version]
- Blumenberg, E.; Smart, M. Brother can you spare a ride? Carpooling in immigrant neighbourhoods. Urban Stud. 2014, 51, 1871–1890. [Google Scholar] [CrossRef]
- Benita, F. Carpool to work: Determinants at the county-level in the United States. J. Trans. Geogr. 2020, 87, 102791. [Google Scholar] [CrossRef]
- Yannis, G.; Papadimitriou, E.; Antoniou, C. Impact of enforcement on traffic accidents and fatalities: A multivariate multilevel analysis. Saf. Sci. 2008, 46, 738–750. [Google Scholar] [CrossRef]
- Kreft, I.; de Leeuw, J. Introducing Multilevel Modeling; SAGE Publications, Ltd.: Thousand Oaks, CA, USA, 1998. [Google Scholar]
- Hilbe, J.M. Logistic regression. In The International Encyclopedia of Statistical Science; Springer: Berlin/Heidelberg, Germany, 2011; pp. 755–758. [Google Scholar]
- Snijders, A.B.; Bosker, J. Multilevel Analysis: An Introduction to Basic and Advanced Multilevel Modeling; SAGE: Thousand Oaks, CA, USA, 1999. [Google Scholar]
- Millard-Ball, A.; Murray, G.; Schure, J.T.; Fox, C.; Burkhardt, J. Car-Sharing: Where and How It Succeeds. In The Transit Cooperative Research Program (TCRP) Report 108; The National Academies Press: Washington, DC, USA, 2005. [Google Scholar]
- Münzel, K.; Piscicelli, L.; Boon, W.; Frenken, K. Different business models-different users? Uncovering the motives and characteristics of business-to-consumer and peer-topeer carsharing adopters in The Netherlands. Transp. Res. D Trans. Environ. 2019, 73, 276–306. [Google Scholar] [CrossRef] [Green Version]
- Stillwater, T.; Mokhtarian, P.L. Carsharing and the Built Environment. Trans. Res. Rec. 2009, 2110, 27–34. [Google Scholar] [CrossRef] [Green Version]
- Celsor, C.; Millard-Ball, A. Where Does Carsharing Work? Using Geographic Information Systems to Assess Market Potential. Trans. Res. Record. 2007, 61–69. [Google Scholar] [CrossRef]
- Dias, F.F.; Lavieri1, P.S.; Garikapati, V.M. A behavioral choice model of the use of car-sharing and ride-sourcing services. Transportation 2017, 44, 1307–1323. [Google Scholar] [CrossRef]
- Gheorghiu, A.; Delhomme, P. For which types of trips do French drivers carpool? Motivations underlying carpooling for different types of trips. Transp. Res. Part A Policy Pract. 2018, 113, 460–475. [Google Scholar] [CrossRef]
- Burkhardt, J.E.; Millard-Ball, A. Who Is Attracted to Carsharing? Trans. Res. Rec. 2006, 1986, 98–105. [Google Scholar] [CrossRef]
- Hampshire, R.; Gaites, C. Peer-to-peer carsharing: Market analysis and potential growth. Trans. Res. Rec. 2011, 2217, 119–126. [Google Scholar] [CrossRef]
- DeLoach, S.B.; Tiemann, T.K. Not driving alone? American commuting in the twenty-first century. Transportation 2011, 39, 521–537. [Google Scholar] [CrossRef]
- Ferguson, E. The rise and fall of the American carpool: 1970–1990. Transportation 1997, 24, 349–376. [Google Scholar] [CrossRef]
- Neoh, J.G.; Chipulu, M.; Marshall, A.; Tewkesbury, A. How commuters’ motivations to drive relate to propensity to carpool: Evidence from the United Kingdom and the United States. Transp. Res. Part A Policy Pract. 2018, 110, 128–148. [Google Scholar] [CrossRef] [Green Version]
- Habib, K.M.N.; Morency, C.; Islam, M.T.; Grasset, V. Modelling users’ behaviour of a carsharing program: Application of a joint hazard and zero inflated dynamic ordered probability model. Transp. Res. Part A Policy Pract. 2012, 46, 241–254. [Google Scholar] [CrossRef]
- Becker, H.; Ciari, F.; Axhausen, K.W. Comparing car-sharing schemes in Switzerland: User groups and usage patterns. Transp. Res. Part A Policy Pract. 2017, 97, 17–29. [Google Scholar] [CrossRef] [Green Version]
- Juschten, M.; Ohnmacht, T.; Thao, V.T.; Gerike, R.; Hössinger, R. Carsharing in Switzerland: Identifying new markets by predicting membership based on data on supply and demand. Transportation 2017, 46, 1–24. [Google Scholar] [CrossRef]
Figure 1.
The DUO driver/passenger experience. The Metropia driver will be paired and identified as a driver by comparing the us-er’s GPS trajectories in real-time. The other passengers are also paired and identified as a DUO passenger, as shown in (a). When a DUO passenger arrives at the destination (if the trip is valid), the DUO passenger will earn a base trekpoint incentive and a chance to win additional points by spinning a “prize wheel” in the app, as shown in (b). In other words, the pairings of DUO passengers and drivers are performed automatically. Once the pairing is complete for a specific DUO passenger, the driver app will give an audio cue to the driver that the pairing with a specific DUO passenger has been successful. Finally, the passenger is given an additional bonus of half from the prize wheel by each driver receives, and the driver gets an email record, as shown in (c).

Figure 2.
Illustration of the timeline of data collection.


Table 1.
Summary of descriptive statistics of travel trip attributes.
| Variables | No Carpool Experience | More Than One-Time Carpool Experience |
|---|---|---|
| The average number of total trips in one month | 42 | 59 |
| The average of travel speed (mile/h) | 30.7 | 28.6 |
| The percentage of peak hour trips (6 a.m.–10 a.m.) | 33.3 | 31.9 |
| The average frequency of using APP per day | 1.4 | 2.0 |
| The average number of carpooling as the driver | 1.7 | 9.9 |
| The average frequency of using APP per day | 2.1 | 13.6 |
| The average points during every trip for being a carpool driver | 12.0 | 37.1 |
| The average points during every trip for being a carpool passenger | 21.7 | 68.0 |
Table 2.
Summary of descriptive statistics of socio-demographic variables.
| Variables | No Carpool Experience | More than One-Time Carpool Experience | Total | |||
|---|---|---|---|---|---|---|
| Number | % | Number | % | Number | % | |
| gender | ||||||
| Male | 190 | 48.3 | 928 | 59.9 | 1118 | 57.5 |
| Female | 195 | 49.6 | 584 | 37.7 | 779 | 40.1 |
| Other | 8 | 2.0 | 38 | 2.5 | 46 | 2.4 |
| Age | ||||||
| 18–25 | 24 | 6.1 | 144 | 9.3 | 168 | 8.6 |
| 26–34 | 72 | 18.3 | 434 | 28.0 | 506 | 26.0 |
| 35–45 | 148 | 37.7 | 570 | 36.8 | 718 | 37.0 |
| 46–55 | 75 | 19.1 | 264 | 17.0 | 339 | 17.4 |
| 56–65 | 74 | 18.8 | 138 | 8.9 | 212 | 10.9 |
| Living situation | ||||||
| Own house | 307 | 78.1 | 1,1250 | 72.6 | 1432 | 73.7 |
| Rental house | 73 | 18.5 | 319 | 20.6 | 392 | 20.1 |
| Live with friends/family | 13 | 3.3 | 106 | 6.8 | 119 | 6.1 |
| How much flexibility to change the departure time | ||||||
| No flexibility | 203 | 51.7 | 706 | 45.5 | 909 | 46.8 |
| 1–15 min | 190 | 48.3 | 844 | 54.5 | 1034 | 53.2 |
| How long to find a parking | ||||||
| Less than 5 min | 376 | 95.7 | 1416 | 91.4 | 1792 | 92.2 |
| 5–15 min | 16 | 4.1 | 120 | 7.7 | 136 | 7.0 |
| Over 15 min | 1 | 0.3 | 14 | 0.9 | 15 | 0.8 |
Table 3.
The statistics of city level variables.
| Variable | 2016 Austin | 2017 Austin | 2016 El Paso | 2017 El Paso | 2016 Tucson | 2017 Tucson |
|---|---|---|---|---|---|---|
| GOVTPT | 4875 | 4670 | 580 | 461 | 1186 | 1258 |
| LTVEH | 161,222 | 164,358 | 69,242 | 69,033 | 82,880 | 82,389 |
| GTVEH | 109,150 | 113,315 | 102,865 | 105,427 | 54,636 | 56,966 |
| DRALONE | 199,626 | 204,468 | 126,921 | 128,741 | 88,348 | 90,617 |
| CHCPLHH | 43,636 | 42,179 | 86,020 | 85,287 | 91,469 | 94,680 |
| CHSGLHH | 38,405 | 39,268 | 52,735 | 52,377 | 46,762 | 44,247 |
| SALAINCO | 36,782 | 38,867 | 26,676 | 27,380 | 25,275 | 26,224 |
| MEDAGE | 36.9 | 36.9 | 40.0 | 39.9 | 38.5 | 37.4 |
Table 4.
Variables Used in the Analysis.
| Variable | Description and Unit | Mean | S.E. | Min. | Max. |
|---|---|---|---|---|---|
| Dependent variable | |||||
| REPUSER | Carpool user = 1; Non-carpool user = 0 | ||||
| Area level characteristics (Level 2) | |||||
| lnGOVTPT | ln (The total worker population of government workers’ principal mode to get from home to work is public transportation in each city) | 7.28 | 0.85 | 6.13 | 8.50 |
| lnLTVEH | ln (The total worker population that the number of available vehicles at home and household members’ use is less than one vehicle in each city) | 11.45 | 0.33 | 11.14 | 12.01 |
| lnDRALONE | ln (The total worker population of the commuter worker is male, and the primary travel type of working is driving alone in each city) | 11.09 | 0.35 | 10.73 | 11.62 |
| lnCHSGLHH | ln (The total worker population that single-parent household that has children between the age of three and 17 who are enrolled in school in each city) | 10.72 | 0.11 | 10.56 | 10.87 |
| Individual level characteristics (Level 1) | |||||
| lnTotalTrip | ln (The number of total trips per month) | 3.58 | 1.09 | 0 | 5.67 |
| Morning | The percentage of users starting a trip in the morning (6 a.m.–10 a.m.) during the observation month. | 0.32 | 0.18 | 0 | 1 |
| DuoTimes | The number of times the user takes a trip as either a carpool passenger or driver during the observation month. | 19.51 | 29.88 | 0 | 264 |
| lnTravelTime | ln (The average travel time of the user during the observation month) | 2.42 | 0.42 | 0.90 | 3.74 |
| lnTravelSpeed | ln (The average travel speed of the user during the observation month) | 3.29 | 0.43 | 0.03 | 4.24 |
| lnFreq | ln (The average frequency of using the Metropia app per day) | 0.17 | 1.09 | −3.43 | 2.27 |
| lnDuodreward | ln (The average earned points per trip as a DUO driver during the observation month) | 0.03 | 5.87 | −9.21 | 5.16 |
| DuoPct | The percentage of average earned points as either a DUO driver or passenger during the observation month. | 0.34 | 0.32 | 0 | 1 |
| Male | Male = 1; others = 0 | 0.58 | 0.49 | 0 | 1 |
| Age | Between 26 and 45 years old = 1; others = 0 | 0.46 | 0.50 | 0 | 1 |
| Live | Living with friends/family = 1; others = 0 | 0.06 | 0.24 | 0 | 1 |
| Flexibility | Do you have flexibility to change your departure time? 1 = Yes; 0 = No | 0.53 | 0.50 | 0 | 1 |
| Parking | How long does it typically take you to find a parking? 1 = More than 5 min; 0 = Less than 5 min. | 0.08 | 0.27 | 0 | 1 |
Table 5.
Logistic Regression and RE Model Estimation Results.
| Variables | Logistic Model | Multilevel Logistic Random-Effect Model | |||||
|---|---|---|---|---|---|---|---|
| Coef. | p-Value | S.E. | Coef. | p-Value | S.E. | ||
| Aggregate level | lnGOVTPT | 0.275 | 0.076 * | 0.155 | 0.280 | 0.075 * | 0.158 |
| lnLTVEH | 2.624 | 0.053 * | 1.356 | 2.627 | 0.057 * | 1.381 | |
| lnDRALONE | −1.045 | 0.074 * | 0.584 | −0.990 | 0.096 * | 0.595 | |
| lnCHSGLHH | 8.926 | 0.003 *** | 3.006 | 8.879 | 0.004 *** | 3.058 | |
| Individual level | lnTotalTrip | 4.685 | 0.066 * | 2.548 | 5.209 | 0.046 ** | 2.614 |
| Morning | 0.815 | 0.030 ** | 0.375 | 0.666 | 0.089 * | 0.391 | |
| DuoTimes | 0.015 | 0.059 * | 0.008 | 0.023 | 0.009 ** | 0.009 | |
| lnTravelTime | −0.402 | 0.023 ** | 0.177 | −0.500 | 0.006 ** | 0.182 | |
| lnTravelSpeed | 0.952 | 0.000 *** | 0.237 | 1.439 | 0.000 *** | 0.257 | |
| lnFreq | −4.674 | 0.067 * | 2.550 | −5.166 | 0.048 ** | 2.616 | |
| lnDuodreward | 0.136 | 0.000 *** | 0.014 | 0.119 | 0.000 *** | 0.014 | |
| DuoPct | 2.554 | 0.000 *** | 0.538 | 3.486 | 0.000 *** | 0.601 | |
| Male | 0.219 | 0.135 | 0.146 | 0.320 | 0.033 ** | 0.150 | |
| Age | 0.330 | 0.024 ** | 0.146 | 0.291 | 0.054 * | 0.151 | |
| Live | 0.965 | 0.011 ** | 0.379 | 1.326 | 0.001 *** | 0.388 | |
| Flexibility | 0.243 | 0.091 * | 0.144 | 0.299 | 0.053 * | 0.155 | |
| Parking | 1.449 | 0.000 *** | 0.315 | 1.487 | 0.000 *** | 0.322 | |
| Intercept | −13.424 | 0.001 *** | 4.200 | −13.810 | 0.001 *** | 4.280 | |
| sigma_u | - | 0.634 | 0.027 ** | 0.276 | |||
| rho | - | 0.109 | 0.002 ** | 0.045 | |||
| N | 1943 | 1943 | |||||
| AIC | 1492.879 | 1194.909 | |||||
| BIC | 1693.204 | 1300.777 | |||||
| Log-likelihood | −658.564 | −679.234 | |||||
| McFadden’s pseudo-R2 | 0.328 | 0.370 | |||||
* p < 0.10; ** p < 0.05; *** p < 0.01.
Publisher’s Note: MDPI stays neutral with regard to jurisdictional claims in published maps and institutional affiliations. |
© 2021 by the authors. Licensee MDPI, Basel, Switzerland. This article is an open access article distributed under the terms and conditions of the Creative Commons Attribution (CC BY) license (http://creativecommons.org/licenses/by/4.0/).
Share and Cite
MDPI and ACS Style
Chen, T.-Y.; Jou, R.-C.; Chiu, Y.-C. Using the Multilevel Random Effect Model to Analyze the Behavior of Carpool Users in Different Cities. Sustainability 2021, 13, 937. https://doi.org/10.3390/su13020937
AMA Style
Chen T-Y, Jou R-C, Chiu Y-C. Using the Multilevel Random Effect Model to Analyze the Behavior of Carpool Users in Different Cities. Sustainability. 2021; 13(2):937. https://doi.org/10.3390/su13020937
Chicago/Turabian StyleChen, Tzu-Ying, Rong-Chang Jou, and Yi-Chang Chiu. 2021. "Using the Multilevel Random Effect Model to Analyze the Behavior of Carpool Users in Different Cities" Sustainability 13, no. 2: 937. https://doi.org/10.3390/su13020937
Note that from the first issue of 2016, this journal uses article numbers instead of page numbers. See further details here.