
Do Walking-Friendly Built Environments Influence Frailty and Long-Term Care Insurance Service Needs?

 , , ,
, , ,
Abstract
:1. Introduction
2. Materials and Methods
2.1. Study Setting and Data Source
2.2. Independent Variable: Neighborhood Walkability
2.3. Outcome Variables: Frailty and the Incidence of LTCI Service Needs
2.4. Covariates
2.5. Statistical Analyses
3. Results
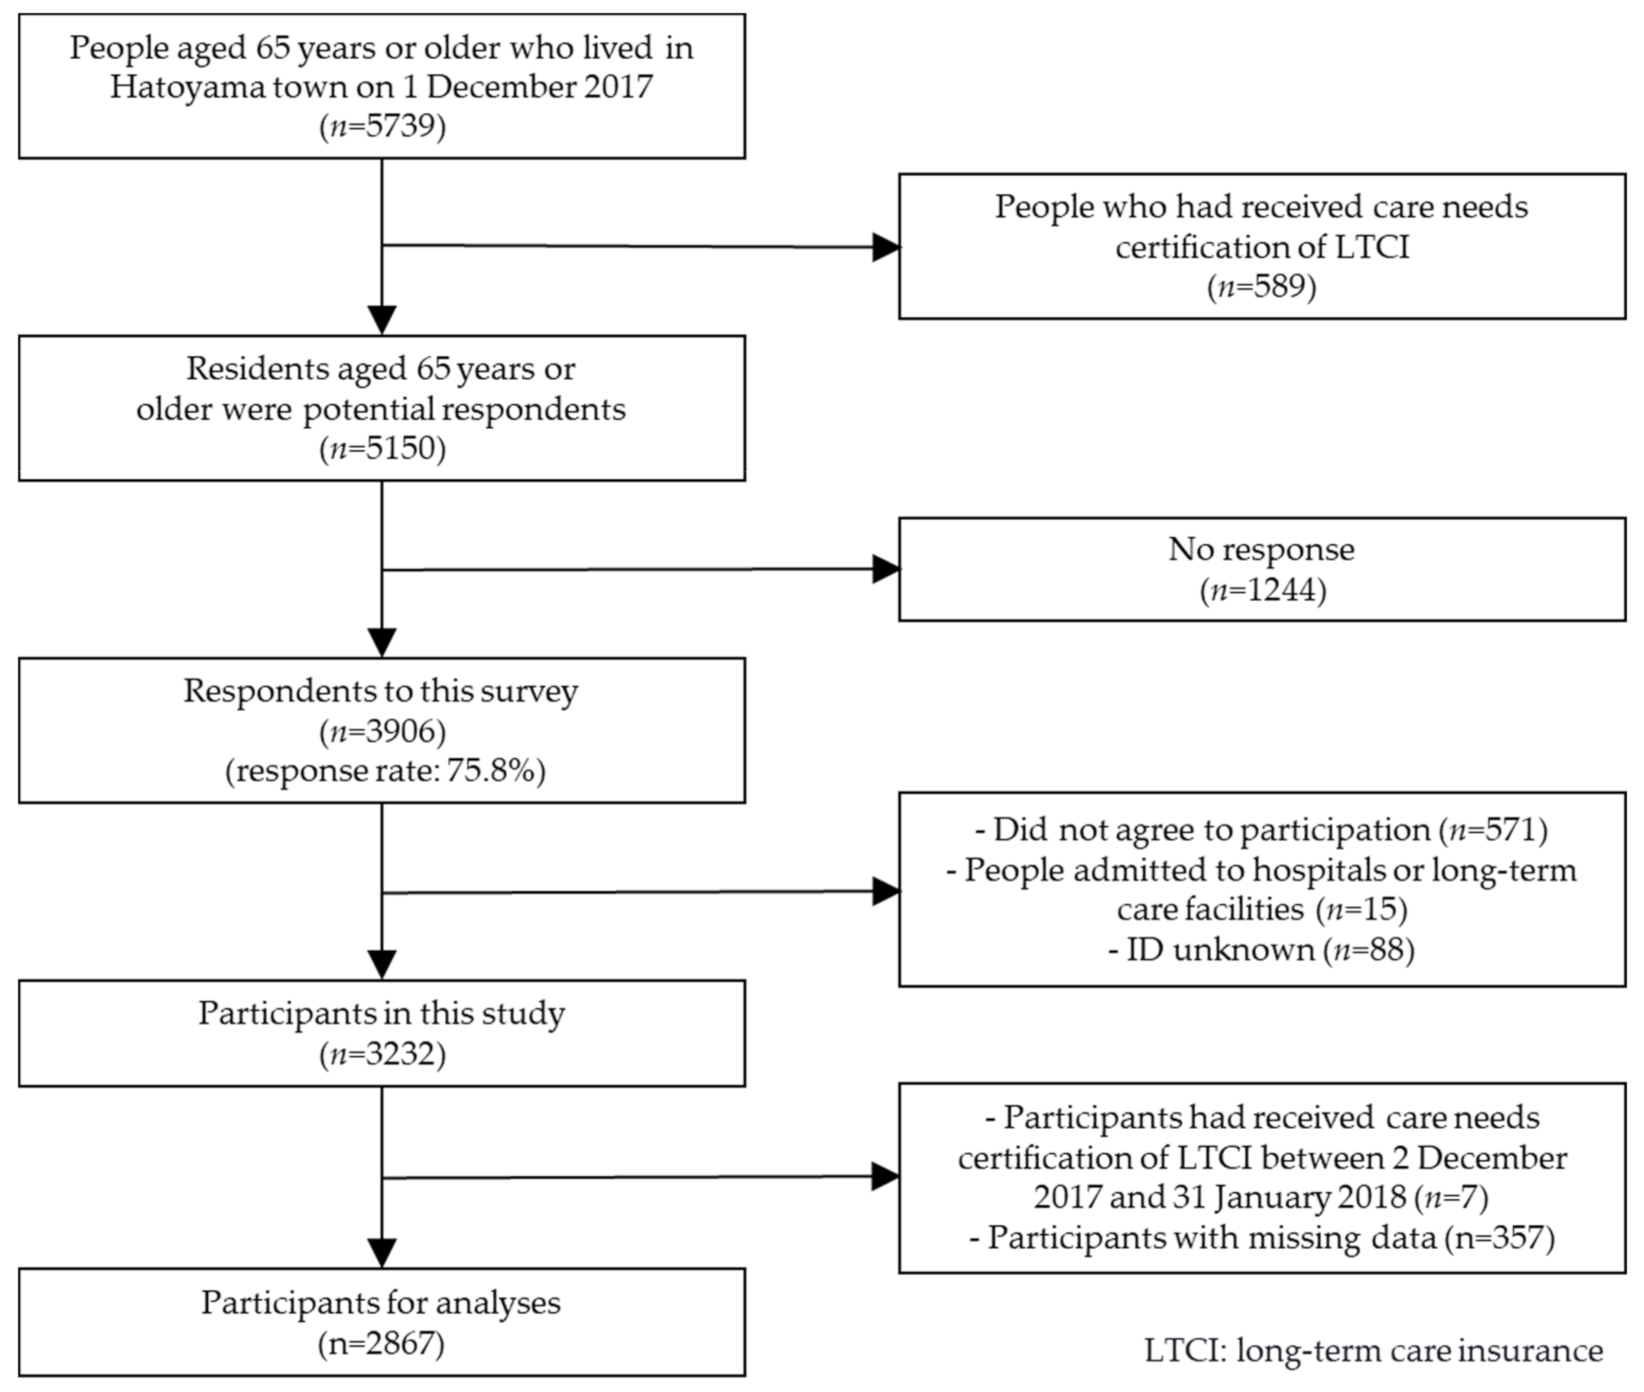
3.1. Participant
3.2. Association between Neighborhood Walkability and Frailty
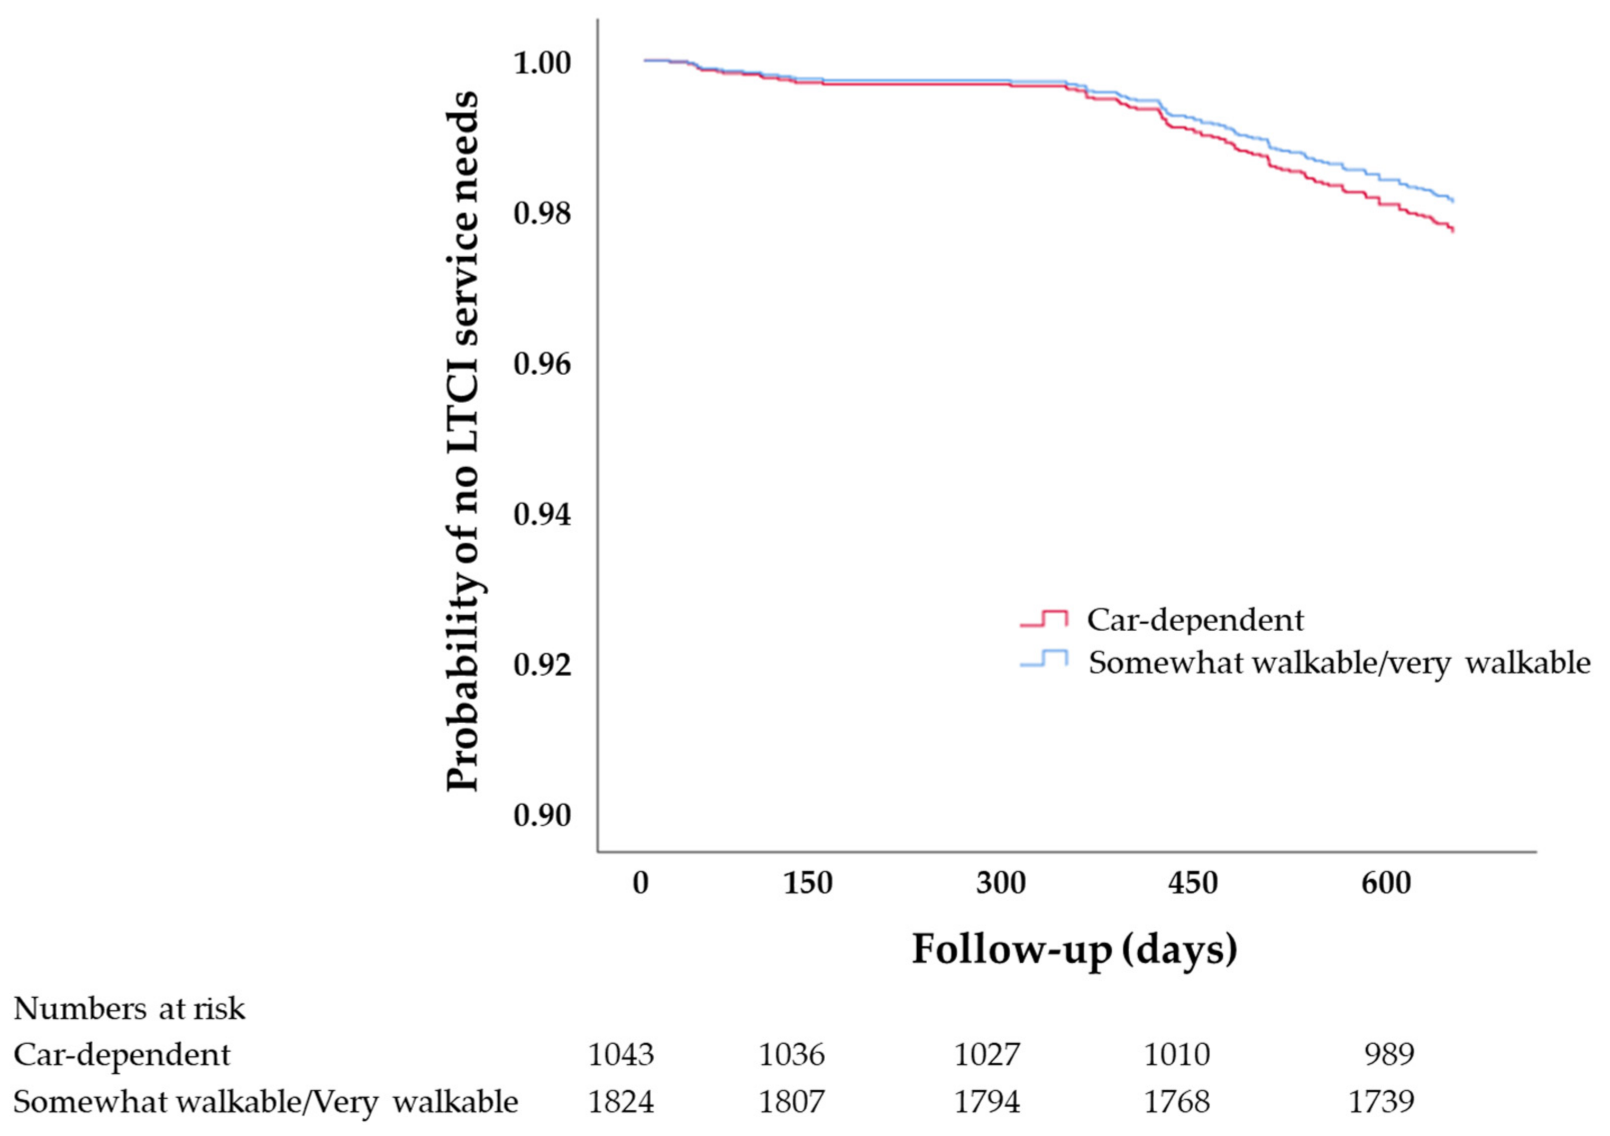
3.3. Association between Neighborhood Walkability and LTCI Service Needs
4. Discussion
5. Conclusions
Supplementary Materials
Author Contributions
Funding
Institutional Review Board Statement
Informed Consent Statement
Data Availability Statement
Acknowledgments
Conflicts of Interest
References
- Zeglinski-Spinney, A.; Wai, D.C.; Phan, P.; Tsai, E.C.; Stratton, A.; Kingwell, S.P.; Roffey, D.M.; Wai, E.K. Increased Prevalence of Chronic Disease in Back Pain Patients Living in Car-dependent Neighbourhoods in Canada: A Cross-sectional Analysis. J. Prev. Med. Public Health 2018, 51, 227–233. [Google Scholar] [CrossRef] [PubMed]
- World Health Organization. Shanghai declaration on promoting health in the 2030 Agenda for Sustainable Development. Health Promot. Int. 2017, 32, 7–8. [Google Scholar] [CrossRef] [PubMed] [Green Version]
- Ferrucci, L.; Fabbri, E.; Walston, J.D. Frailty. In Hazzard’s Geriatric Medicine and Gerontology, 7th ed.; Ouslander, J.G., Studenski, S., High, K.P., Asthana, S., Supiano, M.A., Ritchie, C.S., Eds.; McGraw-Hill Education: New York, NY, USA, 2017; pp. 691–708. [Google Scholar]
- Buta, B.J.; Walston, J.D.; Godino, J.G.; Park, M.; Kalyani, R.R.; Xue, Q.L.; Bandeen-Roche, K.; Varadhan, R. Frailty assessment instruments: Systematic characterization of the uses and contexts of highly-cited instruments. Ageing Res. Rev. 2016, 26, 53–61. [Google Scholar] [CrossRef] [PubMed] [Green Version]
- Bandeen-Roche, K.; Seplaki, C.L.; Huang, J.; Buta, B.; Kalyani, R.R.; Varadhan, R.; Xue, Q.L.; Walston, J.D.; Kasper, J.D. Frailty in Older Adults: A Nationally Representative Profile in the United States. J. Gerontol. A Biol. Sci. Med. Sci. 2015, 70, 1427–1434. [Google Scholar] [CrossRef] [Green Version]
- Murayama, H.; Kobayashi, E.; Okamoto, S.; Fukaya, T.; Ishizaki, T.; Liang, J.; Shinkai, S. National prevalence of frailty in the older Japanese population: Findings from a nationally representative survey. Arch. Gerontol. Geriatr. 2020, 91, 104220. [Google Scholar] [CrossRef]
- Abe, T.; Kitamura, A.; Seino, S.; Yokoyama, Y.; Amano, H.; Taniguchi, Y.; Nishi, M.; Narita, M.; Ikeuchi, T.; Tomine, Y.; et al. Differences in the Prevalence of and Factors Associated with Frailty in Five Japanese Residential Areas. Int. J. Environ. Res. Public Health 2019, 16, 3974. [Google Scholar] [CrossRef] [Green Version]
- Thompson, P.D.; Eijsvogels, T.M. New physical activity guidelines: A call to activity for clinicians and patients. JAMA 2018, 320, 1983–1984. [Google Scholar] [CrossRef]
- Hildreth, K.L.; Melanson, E.L.; Moreau, K.L. Exercise: Pysiologin and functional effects. In Hazzard’s Geriatric Medicine and Gerontology, 7th ed.; Ouslander, J.G., Studenski, S., High, K.P., Asthana, S., Supiano, M.A., Ritchie, C.S., Eds.; McGraw-Hill Education: New York, NY, USA, 2017; pp. 1755–1774. [Google Scholar]
- Cervero, R.; Duncan, M. Walking, bicycling, and urban landscapes: Evidence from the San Francisco Bay Area. Am. J. Public Health 2003, 93, 1478–1483. [Google Scholar] [CrossRef]
- Sallis, J.F.; Floyd, M.F.; Rodríguez, D.A.; Saelens, B.E. Role of built environments in physical activity, obesity, and cardiovascular disease. Circulation 2012, 125, 729–737. [Google Scholar] [CrossRef]
- Saelens, B.E.; Sallis, J.F.; Frank, L.D. Environmental correlates of walking and cycling: Findings from the transportation, urban design, and planning literatures. Ann. Behav. Med. 2003, 25, 80–91. [Google Scholar] [CrossRef]
- Kärmeniemi, M.; Lankila, T.; Ikäheimo, T.; Koivumaa-Honkanen, H.; Korpelainen, R. The Built Environment as a Determinant of Physical Activity: A Systematic Review of Longitudinal Studies and Natural Experiments. Ann. Behav. Med. 2018, 52, 239–251. [Google Scholar] [CrossRef] [Green Version]
- Hajna, S.; Ross, N.A.; Brazeau, A.S.; Bélisle, P.; Joseph, L.; Dasgupta, K. Associations between neighbourhood walkability and daily steps in adults: A systematic review and meta-analysis. BMC Public Health 2015, 15, 768. [Google Scholar] [CrossRef] [Green Version]
- Tao, Y.; Zhang, W.; Gou, Z.; Jiang, B.; Qi, Y. Planning walkable neighborhoods for “aging in place”: Lessons from five aging-friendly districts in Singapore. Sustainability 2021, 13, 1742. [Google Scholar] [CrossRef]
- Sallis, J.F.; Owen, N.; Fisher, E. Ecological models of health behavior. In Health Behavior: Theory, Research, and Practice; Jossey-Bass Inc.: San Francisco, CA, USA, 2015; Volume 5. [Google Scholar]
- Balfour, J.L.; Kaplan, G.A. Neighborhood Environment and Loss of Physical Function in Older Adults: Evidence from the Alameda County Study. Am. J. Epidemiol. 2002, 155, 507–515. [Google Scholar] [CrossRef] [Green Version]
- Fogal, A.S.; Pessoa, M.C.; Fernandes Filho, E.I.; Ribeiro, A.Q. Built urban environment and functional incapacity: Enabling healthy aging. J. Transp. Health 2019, 14, 100574. [Google Scholar] [CrossRef]
- de Keijzer, C.; Tonne, C.; Sabia, S.; Basagana, X.; Valentin, A.; Singh-Manoux, A.; Anto, J.M.; Alonso, J.; Nieuwenhuijsen, M.J.; Sunyer, J.; et al. Green and blue spaces and physical functioning in older adults: Longitudinal analyses of the Whitehall II study. Environ. Int. 2019, 122, 346–356. [Google Scholar] [CrossRef]
- Arakawa Martins, B.; Taylor, D.; Barrie, H.; Lange, J.; Sok Fun Kho, K.; Visvanathan, R. Objective and subjective measures of the neighbourhood environment: Associations with frailty levels. Arch. Gerontol. Geriatr. 2020, 92, 104257. [Google Scholar] [CrossRef]
- Michael, Y.L.; Gold, R.; Perrin, N.A.; Hillier, T.A. Built environment and lower extremity physical performance: Prospective findings from the study of osteoporotic fractures in women. J. Aging Health 2011, 23, 1246–1262. [Google Scholar] [CrossRef] [Green Version]
- Clarke, P.J. The role of the built environment and assistive devices for outdoor mobility in later life. J. Gerontol. B Psychol. Sci. Soc. Sci. 2014, 69, S8–S15. [Google Scholar] [CrossRef] [Green Version]
- Brenner, A.B.; Clarke, P.J. Understanding Socioenvironmental Contributors to Racial and Ethnic Disparities in Disability Among Older Americans. Res. Aging 2018, 40, 103–130. [Google Scholar] [CrossRef]
- Koohsari, M.J.; Sugiyama, T.; Hanibuchi, T.; Shibata, A.; Ishii, K.; Liao, Y.; Oka, K. Validity of Walk Score(R) as a measure of neighborhood walkability in Japan. Prev. Med. Rep. 2018, 9, 114–117. [Google Scholar] [CrossRef] [PubMed]
- Koohsari, M.J.; Sugiyama, T.; Shibata, A.; Ishii, K.; Hanibuchi, T.; Liao, Y.; Owen, N.; Oka, K. Walk Score® and Japanese adults’ physically-active and sedentary behaviors. Cities 2018, 74, 151–155. [Google Scholar] [CrossRef]
- Martins, B.A.; Visvanathan, R.; Barrie, H.R.; Huang, C.H.; Matsushita, E.; Okada, K.; Satake, S.; Edwards, S.; Uno, C.; Kuzuya, M. Built Environment and Frailty: Neighborhood Perceptions and Associations with Frailty, Experience From the Nagoya Longitudinal Study. J. Appl. Gerontol. 2020, 733464820912663. [Google Scholar] [CrossRef] [PubMed]
- Soma, Y.; Tsunoda, K.; Kitano, N.; Jindo, T.; Tsuji, T.; Saghazadeh, M.; Okura, T. Relationship between built environment attributes and physical function in Japanese community-dwelling older adults. Geriatr. Gerontol. Int. 2017, 17, 382–390. [Google Scholar] [CrossRef]
- Koohsari, M.J.; Nakaya, T.; Oka, K. Activity-Friendly Built Environments in a Super-Aged Society, Japan: Current Challenges and toward a Research Agenda. Int. J. Environ. Res. Public Health 2018, 15, 2054. [Google Scholar] [CrossRef] [Green Version]
- Telega, A.; Telega, I.; Bieda, A. Measuring walkability with GIS—Methods overview and new approach proposal. Sustainability 2021, 13, 1883. [Google Scholar] [CrossRef]
- Sallis, J.F. Measuring physical activity environments: A brief history. Am. J. Prev. Med. 2009, 36, S86–S92. [Google Scholar] [CrossRef] [Green Version]
- Brownson, R.C.; Hoehner, C.M.; Day, K.; Forsyth, A.; Sallis, J.F. Measuring the built environment for physical activity: State of the science. Am. J. Prev. Med. 2009, 36, S99–S123.e112. [Google Scholar] [CrossRef] [Green Version]
- Frank, L.D.; Sallis, J.F.; Saelens, B.E.; Leary, L.; Cain, K.; Conway, T.L.; Hess, P.M. The development of a walkability index: Application to the Neighborhood Quality of Life Study. Br. J. Sports Med. 2010, 44, 924–933. [Google Scholar] [CrossRef]
- Duncan, D.T. What’s your Walk Score(R)? Web-based neighborhood walkability assessment for health promotion and disease prevention. Am. J. Prev. Med. 2013, 45, 244–245. [Google Scholar] [CrossRef]
- Walkscore®. Walk Score Methodology. Available online: https://www.walkscore.com/ (accessed on 20 November 2020).
- Nykiforuk, C.I.; McGetrick, J.A.; Crick, K.; Johnson, J.A. Check the score: Field validation of street smart walk score in Alberta, Canada. Prev. Med. Rep. 2016, 4, 532–539. [Google Scholar] [CrossRef] [Green Version]
- Carr, L.J.; Dunsiger, S.I.; Marcus, B.H. Walk score as a global estimate of neighborhood walkability. Am. J. Prev. Med. 2010, 39, 460–463. [Google Scholar] [CrossRef] [Green Version]
- Carr, L.J.; Dunsiger, S.I.; Marcus, B.H. Validation of Walk Score for estimating access to walkable amenities. Br. J. Sports Med. 2011, 45, 1144–1148. [Google Scholar] [CrossRef]
- Hirsch, J.A.; Moore, K.A.; Evenson, K.R.; Rodriguez, D.A.; Diez Roux, A.V. Walk Score(R) and Transit Score(R) and walking in the multi-ethnic study of atherosclerosis. Am. J. Prev. Med. 2013, 45, 158–166. [Google Scholar] [CrossRef] [Green Version]
- Cole, R.; Dunn, P.; Hunter, I.; Owen, N.; Sugiyama, T. Walk Score and Australian adults’ home-based walking for transport. Health Place 2015, 35, 60–65. [Google Scholar] [CrossRef]
- Chudyk, A.M.; McKay, H.A.; Winters, M.; Sims-Gould, J.; Ashe, M.C. Neighborhood walkability, physical activity, and walking for transportation: A cross-sectional study of older adults living on low income. BMC Geriatr. 2017, 17, 82. [Google Scholar] [CrossRef]
- Meline, J.; Chaix, B.; Pannier, B.; Ogedegbe, G.; Trasande, L.; Athens, J.; Duncan, D.T. Neighborhood walk score and selected Cardiometabolic factors in the French RECORD cohort study. BMC Public Health 2017, 17, 960. [Google Scholar] [CrossRef] [Green Version]
- Hirsch, J.A.; Diez Roux, A.V.; Moore, K.A.; Evenson, K.R.; Rodriguez, D.A. Change in walking and body mass index following residential relocation: The multi-ethnic study of atherosclerosis. Am. J. Public Health 2014, 104, e49–e56. [Google Scholar] [CrossRef]
- Mazumdar, S.; Learnihan, V.; Cochrane, T.; Phung, H.; O’Connor, B.; Davey, R. Is Walk Score associated with hospital admissions from chronic diseases? Evidence from a cross-sectional study in a high socioeconomic status Australian city-state. BMJ Open 2016, 6, e012548. [Google Scholar] [CrossRef] [Green Version]
- Koohsari, M.J.; McCormack, G.R.; Nakaya, T.; Shibata, A.; Ishii, K.; Yasunaga, A.; Liao, Y.; Oka, K. Walking-friendly built environments and objectively measured physical function in older adults: Urban design and older adults’ physical function. J. Sport Health Sci. 2020, 9, 651–656. [Google Scholar] [CrossRef]
- Liao, Y.; Lin, C.Y.; Lai, T.F.; Chen, Y.J.; Kim, B.; Park, J.H. Walk Score((R)) and Its Associations with Older Adults’ Health Behaviors and Outcomes. Int. J. Environ. Res. Public Health 2019, 16, 622. [Google Scholar] [CrossRef] [Green Version]
- Shinkai, S.; Watanabe, N.; Yoshida, H.; Fujiwara, Y.; Nishi, M.; Fukaya, T.; Lee, S.; Kim, M.J.; Ogawa, K.; Murayama, H.; et al. Validity of the “Kaigo-Yobo Check-List” as a frailty index. Nihon Koshu Eisei Zasshi 2013, 60, 262–274. [Google Scholar]
- Shinkai, S.; Yoshida, H.; Taniguchi, Y.; Murayama, H.; Nishi, M.; Amano, H.; Nofuji, Y.; Seino, S.; Fujiwara, Y. Public health approach to preventing frailty in the community and its effect on healthy aging in Japan. Geriatr. Gerontol. Int. 2016, 16, 87–97. [Google Scholar] [CrossRef]
- Ministry of Health, Labour and Welfare. Long-Term Care Insurance System of Japan. Available online: https://www.mhlw.go.jp/english/policy/care-welfare/care-welfare-elderly/dl/ltcisj_e.pdf (accessed on 5 April 2021).
- Tsutsui, T.; Muramatsu, N. Care-needs certification in the long-term care insurance system of Japan. J. Am. Geriatr. Soc. 2005, 53, 522–527. [Google Scholar] [CrossRef]
- Rogers, S.; Gardner, K.; Carlson, C. Social Capital and Walkability as Social Aspects of Sustainability. Sustainability 2013, 5, 3473–3483. [Google Scholar] [CrossRef] [Green Version]
- Rogers, S.H.; Halstead, J.M.; Gardner, K.H.; Carlson, C.H. Examining Walkability and Social Capital as Indicators of Quality of Life at the Municipal and Neighborhood Scales. Appl. Res. Qual. Life 2011, 6, 201–213. [Google Scholar] [CrossRef]
- Zhu, X.; Yu, C.Y.; Lee, C.; Lu, Z.; Mann, G. A retrospective study on changes in residents’ physical activities, social interactions, and neighborhood cohesion after moving to a walkable community. Prev. Med. 2014, 69, S93–S97. [Google Scholar] [CrossRef] [Green Version]
- Hwang, E.; Brossoie, N.; Jeong, J.W.; Song, K. The impacts of the neighborhood built environment on social capital for middle-aged and elderly Koreans. Sustainability 2021, 13, 756. [Google Scholar] [CrossRef]
- Valtorta, N.K.; Kanaan, M.; Gilbody, S.; Ronzi, S.; Hanratty, B. Loneliness and social isolation as risk factors for coronary heart disease and stroke: Systematic review and meta-analysis of longitudinal observational studies. Heart 2016, 102, 1009–1016. [Google Scholar] [CrossRef] [Green Version]
- Shankar, A.; McMunn, A.; Banks, J.; Steptoe, A. Loneliness, social isolation, and behavioral and biological health indicators in older adults. Health Psychol. 2011, 30, 377–385. [Google Scholar] [CrossRef] [PubMed] [Green Version]
- Fujita, K.; Fujiwara, Y.; Chaves, P.H.; Motohashi, Y.; Shinkai, S. Frequency of going outdoors as a good predictors for incident disability of physical function as well as disability recovery in community-dwelling older adults in rural Japan. J. Epidemiol. 2006, 16, 261–270. [Google Scholar] [CrossRef] [PubMed] [Green Version]
- Carlson, J.A.; Sallis, J.F.; Conway, T.L.; Saelens, B.E.; Frank, L.D.; Kerr, J.; Cain, K.L.; King, A.C. Interactions between psychosocial and built environment factors in explaining older adults’ physical activity. Prev. Med. 2012, 54, 68–73. [Google Scholar] [CrossRef] [PubMed] [Green Version]


| Characteristics | N | Frailty (%) | p-Value a | |
|---|---|---|---|---|
| Walk Score® category | Car-dependent | 1043 | 15.4 | 0.022 |
| Somewhat walkable/very walkable | 1824 | 12.4 | ||
| Sex | Men | 1451 | 14.3 | 0.223 |
| Women | 1416 | 12.7 | ||
| Age groups | 65–74 year | 1849 | 10.3 | <0.001 |
| 75–79 year | 616 | 14.1 | ||
| ≥80 year | 402 | 27.4 | ||
| Educational status | High school or lower | 1748 | 15.0 | 0.014 |
| Two-year college or vocational college | 407 | 10.8 | ||
| University or higher | 712 | 11.4 | ||
| Marital status | Unmarried | 553 | 18.3 | <0.001 |
| Married | 2314 | 12.4 | ||
| Residential status | Living with others | 2568 | 13.4 | 0.515 |
| Living alone | 299 | 14.7 | ||
| Employment status | Unemployed | 2045 | 16.1 | <0.001 |
| Employed | 822 | 7.1 | ||
| Subjective economic status | Not poor | 2159 | 11.6 | <0.001 |
| Poor | 708 | 19.2 | ||
| Characteristics | OR (95%CI) | p-Value a | aOR (95%CI) | p-Value b |
|---|---|---|---|---|
| Walk Score® category | ||||
| Car-dependent | Reference | Reference | ||
| Somewhat walkable/very walkable | 0.775 (0.623–0.964) | 0.022 | 0.750 (0.597–0.943) | 0.014 |
| Walk Score® (continuous values), per 1 unit increase | 0.989 (0.983–0.995) | <0.001 | 0.989 (0.982–0.995) | 0.001 |
| HR (95% CI) | p-Value a | aHR (95% CI) | p-Value b | |
|---|---|---|---|---|
| Walk Score® category | ||||
| Car-dependent | Reference | Reference | ||
| Somewhat walkable/Very walkable | 0.849 (0.572–1.262) | 0.419 | 0.827 (0.553–1.239) | 0.357 |
| Walk Score® (continuous values), per 1 unit increase | 0.991 (0.981–1.002) | 0.123 | 0.993 (0.982–1.004) | 0.225 |
Publisher’s Note: MDPI stays neutral with regard to jurisdictional claims in published maps and institutional affiliations. |
© 2021 by the authors. Licensee MDPI, Basel, Switzerland. This article is an open access article distributed under the terms and conditions of the Creative Commons Attribution (CC BY) license (https://creativecommons.org/licenses/by/4.0/).
Share and Cite
Mitsutake, S.; Ishizaki, T.; Yokoyama, Y.; Nishi, M.; Koohsari, M.J.; Oka, K.; Yano, S.; Abe, T.; Kitamura, A. Do Walking-Friendly Built Environments Influence Frailty and Long-Term Care Insurance Service Needs? Sustainability 2021, 13, 5632. https://doi.org/10.3390/su13105632
Mitsutake S, Ishizaki T, Yokoyama Y, Nishi M, Koohsari MJ, Oka K, Yano S, Abe T, Kitamura A. Do Walking-Friendly Built Environments Influence Frailty and Long-Term Care Insurance Service Needs? Sustainability. 2021; 13(10):5632. https://doi.org/10.3390/su13105632
Chicago/Turabian StyleMitsutake, Seigo, Tatsuro Ishizaki, Yuri Yokoyama, Mariko Nishi, Mohammad Javad Koohsari, Koichiro Oka, Shohei Yano, Takumi Abe, and Akihiko Kitamura. 2021. "Do Walking-Friendly Built Environments Influence Frailty and Long-Term Care Insurance Service Needs?" Sustainability 13, no. 10: 5632. https://doi.org/10.3390/su13105632