Article

Closer to Carrying Capacity: Analysis of the Internal Demographic Structure Associated with the Management and Density Dependence of a Controlled Wolf Population in Latvia

Latvian State Forest Research Institute Silava, Rigas Street 111, LV–2169 Salaspils, Latvia
*
Author to whom correspondence should be addressed.
Sustainability 2021, 13(17), 9783; https://doi.org/10.3390/su13179783
Submission received: 12 July 2021 / Revised: 16 August 2021 / Accepted: 24 August 2021 / Published: 31 August 2021
(This article belongs to the Special Issue Mammal Status: Diversity, Abundance and Dynamics)

Abstract

:
Large carnivores are essential components of natural ecosystems. In populated areas, their conservation depends on preserving a favorable status in coexistence with humans, which may require the elimination of excess carnivores to minimize public concerns. As the Baltic region currently hosts a thriving wolf population, locally sustainable management of wolves is important for preserving biodiversity at a European scale. In this paper, we provide a dynamic assessment of the Latvian wolf subpopulation from 1998 until 2020. This study is based on age composition and fecundity data from teeth, uteri, and ovaria inspections obtained from samples of legally culled or accidentally killed individuals. The abundance estimates indicated population growth that exceeded the previously predicted carrying capacity. The proportion of juveniles among the culled individuals increased in recent years, but the mean age of culled adults exhibited a stable trend. In presumably nonselective hunting, the juveniles and individuals older than 3 years had greater culling mortality estimates in comparison with other age classes, and the culling rates for adult females of particular age classes were higher than for males of the same age. While creating significant hunting pressure, wolf management in Latvia may have contributed to the population growth by affecting its demographic processes.

1. Introduction

In modern human-dominated landscapes where large carnivores coexist with people in relatively close proximity, their future conservation as key wildlife components depends on sharing the same landscape, which requires public understanding and supportive participation in terms of sustainable management, protective legislation, and damage prevention or compensation [1,2,3,4]. Historically, gray wolves (Canis lupus L., 1758), regarded as competitors for game, pests in livestock breeding, and threats to public safety, have been persecuted and even locally eradicated throughout Europe and North America. However, their recolonization in previously inhabited areas and their population growth have been achieved by conservation efforts such as legal protection favoring natural population re-establishment and sometimes deliberate translocation of individuals [5,6,7,8,9,10,11,12]. Meanwhile, conflicts with human interests have also emerged or intensified [13,14,15,16], bringing serious challenges in the eyes of the general public for the protection of this species and wildlife conservation in general [17]. Today, wolves are hunted mainly to decrease real or perceived threats to human safety and the livestock industry, preserve wild game species, or control the spread of diseases. Sometimes, wolves are hunted for sport or to obtain trophies. Human attitudes and perception can have a considerable effect on the intensity of wolf persecution [18,19], and reasons for wolf hunting are not always sufficiently justified in following sustainable species management.
The so-called Baltic population of gray wolves, consisting of ca. 3600 individuals and inhabiting territories of Estonia, Latvia, Lithuania, Belarus, northeastern Poland, northern Ukraine, and the western regions of the Russian Federation, is considered to be one of the most viable wolf populations in Europe [17,20,21]. In previous studies, the carrying capacities for Latvian and Lithuanian wolf subpopulations were estimated [22,23]. According to these studies, the assessed carrying capacity for wolves in Latvia ranged between 1066 and 1092 individuals [22]. In Latvia, despite persecution to various extents, the species has never been totally exterminated unlike in other parts of Europe, although the wolf number was reduced close to extinction twice: before WWII and then in the 1960s [24,25]. Before Latvia became a European Union member state in 2004, wolves in Latvia were legally harvested or culled all year round. After joining the EU, a closed season and an annual culling quota were introduced in compliance with the Habitat Directive of the European Council [26]. The species management plan [25] does not prescribe any target size for wolf abundance in Latvia. Hence, the goal is to maintain a favorable status according to the criteria set by the EU Habitat Directive, including the viability of the species within its natural habitat, nondecreasing distribution range, and availability of habitats [17,21,26]. To ensure a favorable population status and species conservation, especially in the situation where restricted harvesting is allowed, the population management system should be adapted to any changes in the population status.
Knowledge on abundance, demographic structure, and reproduction should guide further actions of wolf population management [27]. Such information is relevant both locally and internationally if populations of protected species inhabit areas shared by several states [4,17,28]. Therefore, the aim of this paper was to provide a dynamic assessment of the Latvian wolf subpopulation during the last two decades. We based the analysis on our most reliable data on demographic structure and female fecundity obtained from inspected carcasses of culled wolves. Wolf abundance estimates were analyzed concerning previously determined carrying capacity, investigating whether discovered trends, such as stabilization of abundance or changes in reproductive parameters, were associated with negative effects of density dependence, as the wolf subpopulation may have reached its temporal limits, determined by a combination of ecological and socioeconomic factors. To assess the culling impact, we also investigated potential differences in exploitation rates of various sex and age groups.

2. Methods

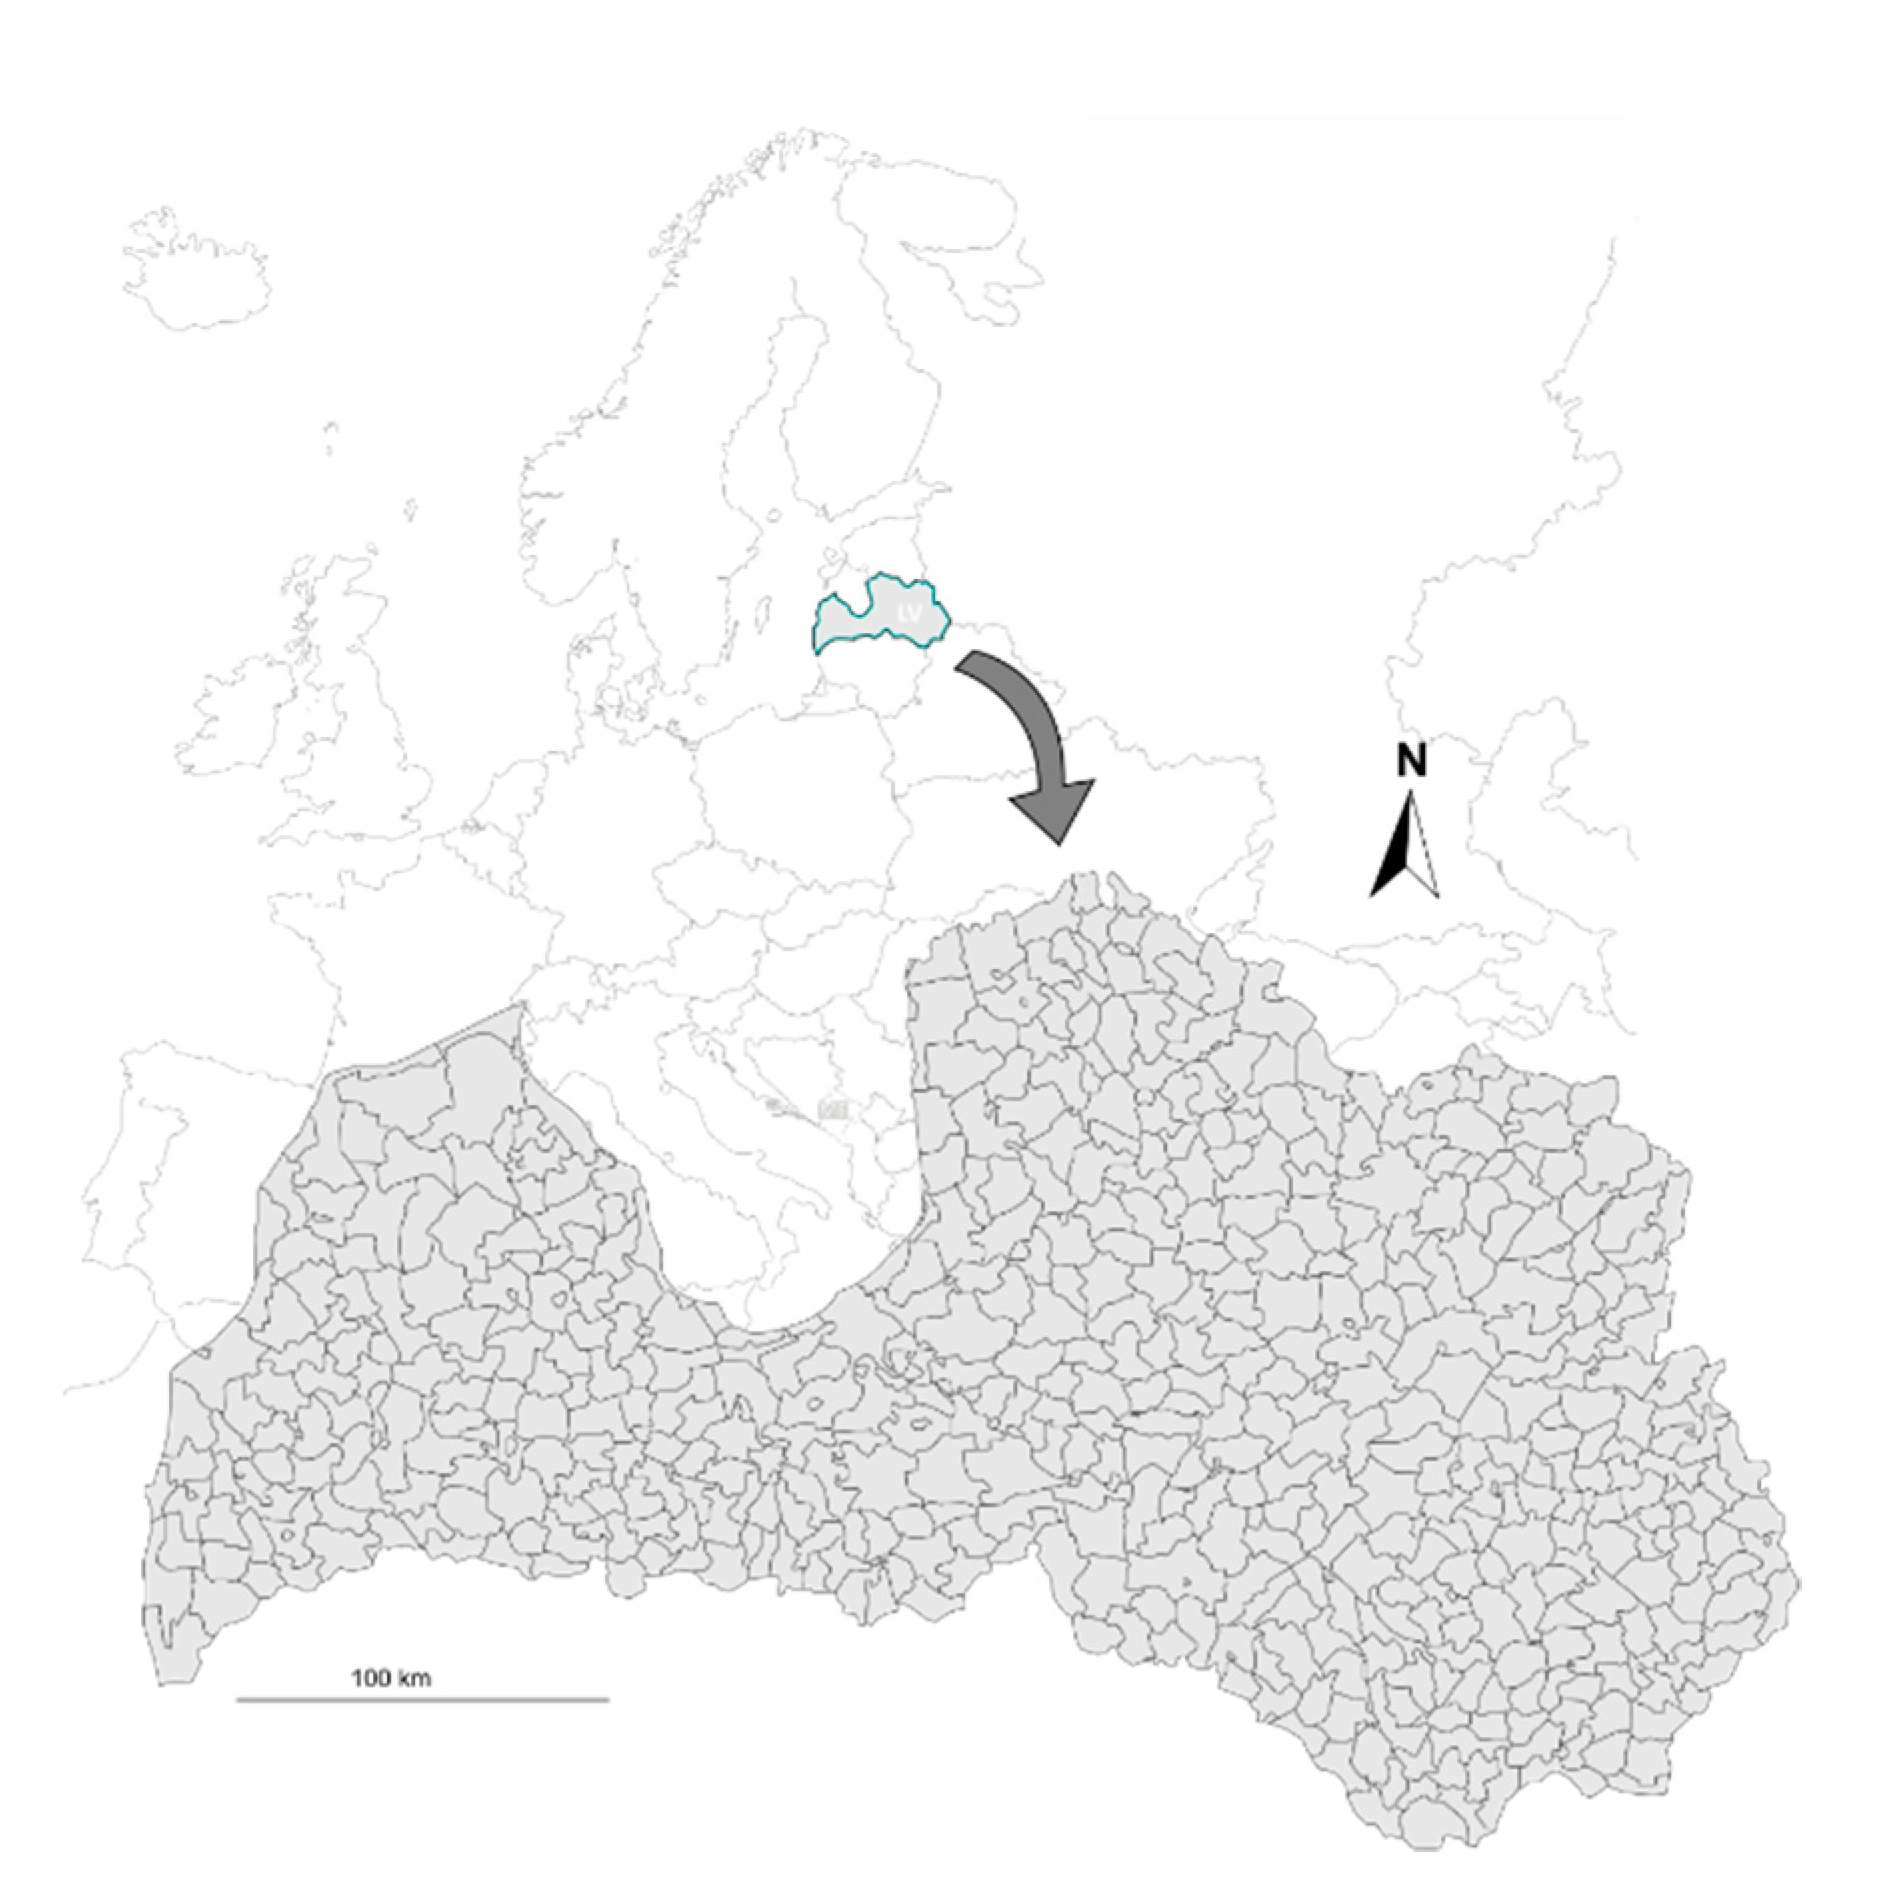
2.1. Study Area and Culling Practice

The study was conducted where wolf culling occurs across the whole territory of Latvia, which occupies ~64,600 km2 along the eastern coast of the Baltic Sea (Figure 1). The population consists of 1.9 million inhabitants, and the mean density is 31 persons per km2 [29]. About 1.8% of the population owns a hunting licence, and recreational hunting is regularly applied to approximately 80% of the terrestrial land cover. Approximately 50% of the region is covered by woodland, specifically mixed boreal forest dominated by Scots pine (Pinus sylvestris), Norway spruce (Picea abies), and birch (Betula spp.).
Until 1999, the state paid a bounty for each killed wolf regardless of its sex or age. Sometimes, searches for dens with pups were performed, and entire litters were destroyed. Culled animal reports were, therefore, presumed to be accurate. Meanwhile, carcass sampling was highly opportunistic and comparatively scarce because the hunters were asked to provide material voluntarily; however, support for the research initiative was low. In 2004, a closed season from 1 April to 14 July was introduced, and an annual quota for wolves was established in Latvia for the first time. The quota was negotiated among species conservation experts, the game surveillance authority (i.e., the State Forest Service (SFS)), and representatives of hunter associations. It was set annually for the whole country on the basis of the population trend, number of culled individuals in the previous season, and livestock depredation. These regulations motivated the hunters to report hunted wolves and collaborate with the research program, since knowledge of the population status is a prerequisite for culling and enables setting the quota for the following season. For illustrative purposes, the number of culled wolves per hunting season in Latvia during the last three decades is given in Figure 2.
The wolf hunting methods in Latvia have not been affected as much by the different policies as by the traditions of the hunters. In winter, the main hunting method is tracking wolves in fresh snow to surround the pack in its resting site and then drive it toward the shooters. Sometimes, a fladry line (i.e., a rope with little flags at the height of animal heads) is used to minimize wolf escapes from the surrounded spot. In a snowless period, wolves are discovered using simulations of howling and lured to a hunter. However, more than half of the harvested wolves are taken incidentally during hunts for other game. Wolf culling is not intentionally selective for a certain size or appearance of the animals.

2.2. Sample Collection

Carcasses of legally hunted or accidentally killed wolves (mostly in vehicle collisions) from 1998 until 2020 were available for investigation upon request. Due to time and logistic constraints, 20–70% of the harvested individuals were examined every year. These surveys of culled wolves provided dental material for age determination (n = 1822) and samples of uteri and ovaria from adult females (n = 206) to determine the number of marks from placental attachments or embryos and the presence of corpora lutea, which were used as indicators of prenatal litter size and confirmation of previous pregnancy.
The techniques described by Klevezal [31] and Kirkpatrick [32] were used to prepare tooth samples and examine the female reproductive organs, respectively. The age was determined by counting the cement increment lines in the root of an extracted canine. A sample for microscopic inspection was prepared by sawing off a 1.5-cm long tip from the canine root. Female fecundity was assessed by counting marks of previous placental attachment and embryos in uteri samples obtained from March until December. For samples obtained in January and February (i.e., during wolf rutting time), previous pregnancy was determined according to the presence or absence of corpora lutea in ovaria samples, but these samples were excluded from fecundity analysis as neither the number of placental attachments nor the number of freshly implanted embryos could be distinguished.
The data used in this study are given in Appendix A (Table A1 and Table A2). To improve sample representability to a size of at least 20, data on fecundity and reproduction rates from three and, in one instance, four consecutive years were pooled together (e.g., 1998–2001 (4 years) or 2002–2004 (3 years)).

2.3. Estimating Abundance and Culling Impact

The SFS conducts local monitoring of some internationally protected species, including wolves. Game abundance is estimated at the closure of the hunting season, and these estimates are publicly available on the SFS website [30]. For wolves, these estimates might be attributed to post-harvest and prior breeding abundance. In this study, we also referred to the previously determined carrying capacity of wolves in Latvia, which was calculated using SFS abundance and harvest data from 1958 until 2004 [22]. However, the official level of wolf abundance in Latvia is prone to overestimation [25]. For example, the wolf home ranges are likely to encompass several adjacent hunting districts, for which separate game abundance estimates are provided. Hence, members of the same pack may actually have been accounted for more than once. Therefore, we used the estimated wolf abundances from the SFS as the maximum abundance estimates.
To provide more realistic wolf abundance estimates, three factors were considered:
(1)
Despite increasing efforts of noninvasive monitoring by the SFS, harvest data are currently the only robust and comparable information on the wolf population. Neither countrywide surveys for dens nor counts of packs and their sizes have been regularly conducted.
(2)
Due to a considerably large quota, harvesting is believed to be the main source of wolf mortality. Natural wolf mortality at various age classes in Latvia is not known but is believed to be considerably lower than (and perhaps partially compensated for by) harvest mortality [33].
(3)
A lack of reliable data on local hunting efforts (e.g., duration and number of hunters involved) forbids using harvest-based population estimation methods that incorporate catch per unit of effort.
Taking into account the previous factors, age-structured population reconstruction methods [34,35,36,37,38], summarized and demonstrated by Skalski et al. [39], were considered. All of these methods use age-at-harvest data to back-calculate cohort sizes before harvesting. However, due to a current lack of reliable data on local age-specific natural mortality, we restricted our virtual population analysis (VPA) to provide minimum abundance estimates, assessing the part of the population which was ultimately harvested. All statistical analyses were conducted using the software R [40], except the VPA, which was conducted using a spreadsheet (Microsoft Excel 2013).
An age-structured matrix H = (ĥij ± ∆hij) was compiled as follows and used for further calculations:
h ^ i j = s i j h i j = 1 J s i j = s i j h i s i ,
where ĥij is the estimated number of harvested individuals in the i-th hunting season of the j-th age class (henceforth, capital letter indices I and J denote the final represented hunting season and the maximum age class, respectively), sij is the number of sampled individuals, and hi and si are the total numbers of harvested and sampled individuals during the i-th hunting season, respectively. Taking into account that sampling was conducted without replacement, the uncertainty in the estimated age-specific harvest ∆hij was calculated as follows:
Δ h i j = { t α , s i 1 h i s i ( s i s i j s i j 2 ) ( h i s i ) s i ( h i 1 ) ,   s i j > 0 t α , s i 1 h i s i + 2 ( s i + 1 ) ( h i s i ) ( s i + 3 ) ( h i 1 ) ,   s i j = 0 ,
where t α , s i 1 is the t statistic at a confidence level of α = 0.95 and si 1 degrees of freedom. Minimum cohort abundance estimates ( N ^ i j ) were then back-calculated using the following equation and contained in the matrix N   =   ( N ^ i j ± Δ N i j ) :
N ^ i j = { k = 0 min ( I i , J j ) h ^ i + k , j + k | i < I m a x ( j + k ) = J k = 0 I i 1 h ^ i + k , j + k + h ^ I , j + k + 1 E ^ j + k + 1 | i < I m a x ( j + k + 1 ) < J h ^ i j E ^ j | i = I ,
where Êj is the estimated mean exploitation or harvest mortality rate for the j-th age class, calculated from harvest data and abundance estimates of the cohorts that passed through the age-at-harvest matrix and reached the maximum age class:
E ^ j = i h ^ i j i N ^ i j .
Uncertainty in the abundance estimates ∆Nij was calculated according to the principles of error propagation, taking into account the ∆hij values and estimating the expected variance in Êj by treating it as a proportion (i.e., Var(Êj) = Êj(1 − Êj)). Minimum wolf abundance of the i-th hunting season Ni was calculated as follows from the matrix N:
N ^ i = j = 1 J N ^ i j .
To assess the culling impact according to sex and age and to predict the minimum annual number of offspring for the whole subpopulation, separate cohort abundance estimates were also calculated for males and females. Estimated numbers of males and females in particular age classes were then used in relevant calculations.
The exploitation rate can be regarded as a ratio between the number of individuals of a particular group that is harvested at the focal stage and the total number of individuals of that group, including those that avoid culling at the focal stage but are harvested at later stages. Hence, the culling impact was analyzed by comparing sex- and age-specific exploitation rates.

3. Results

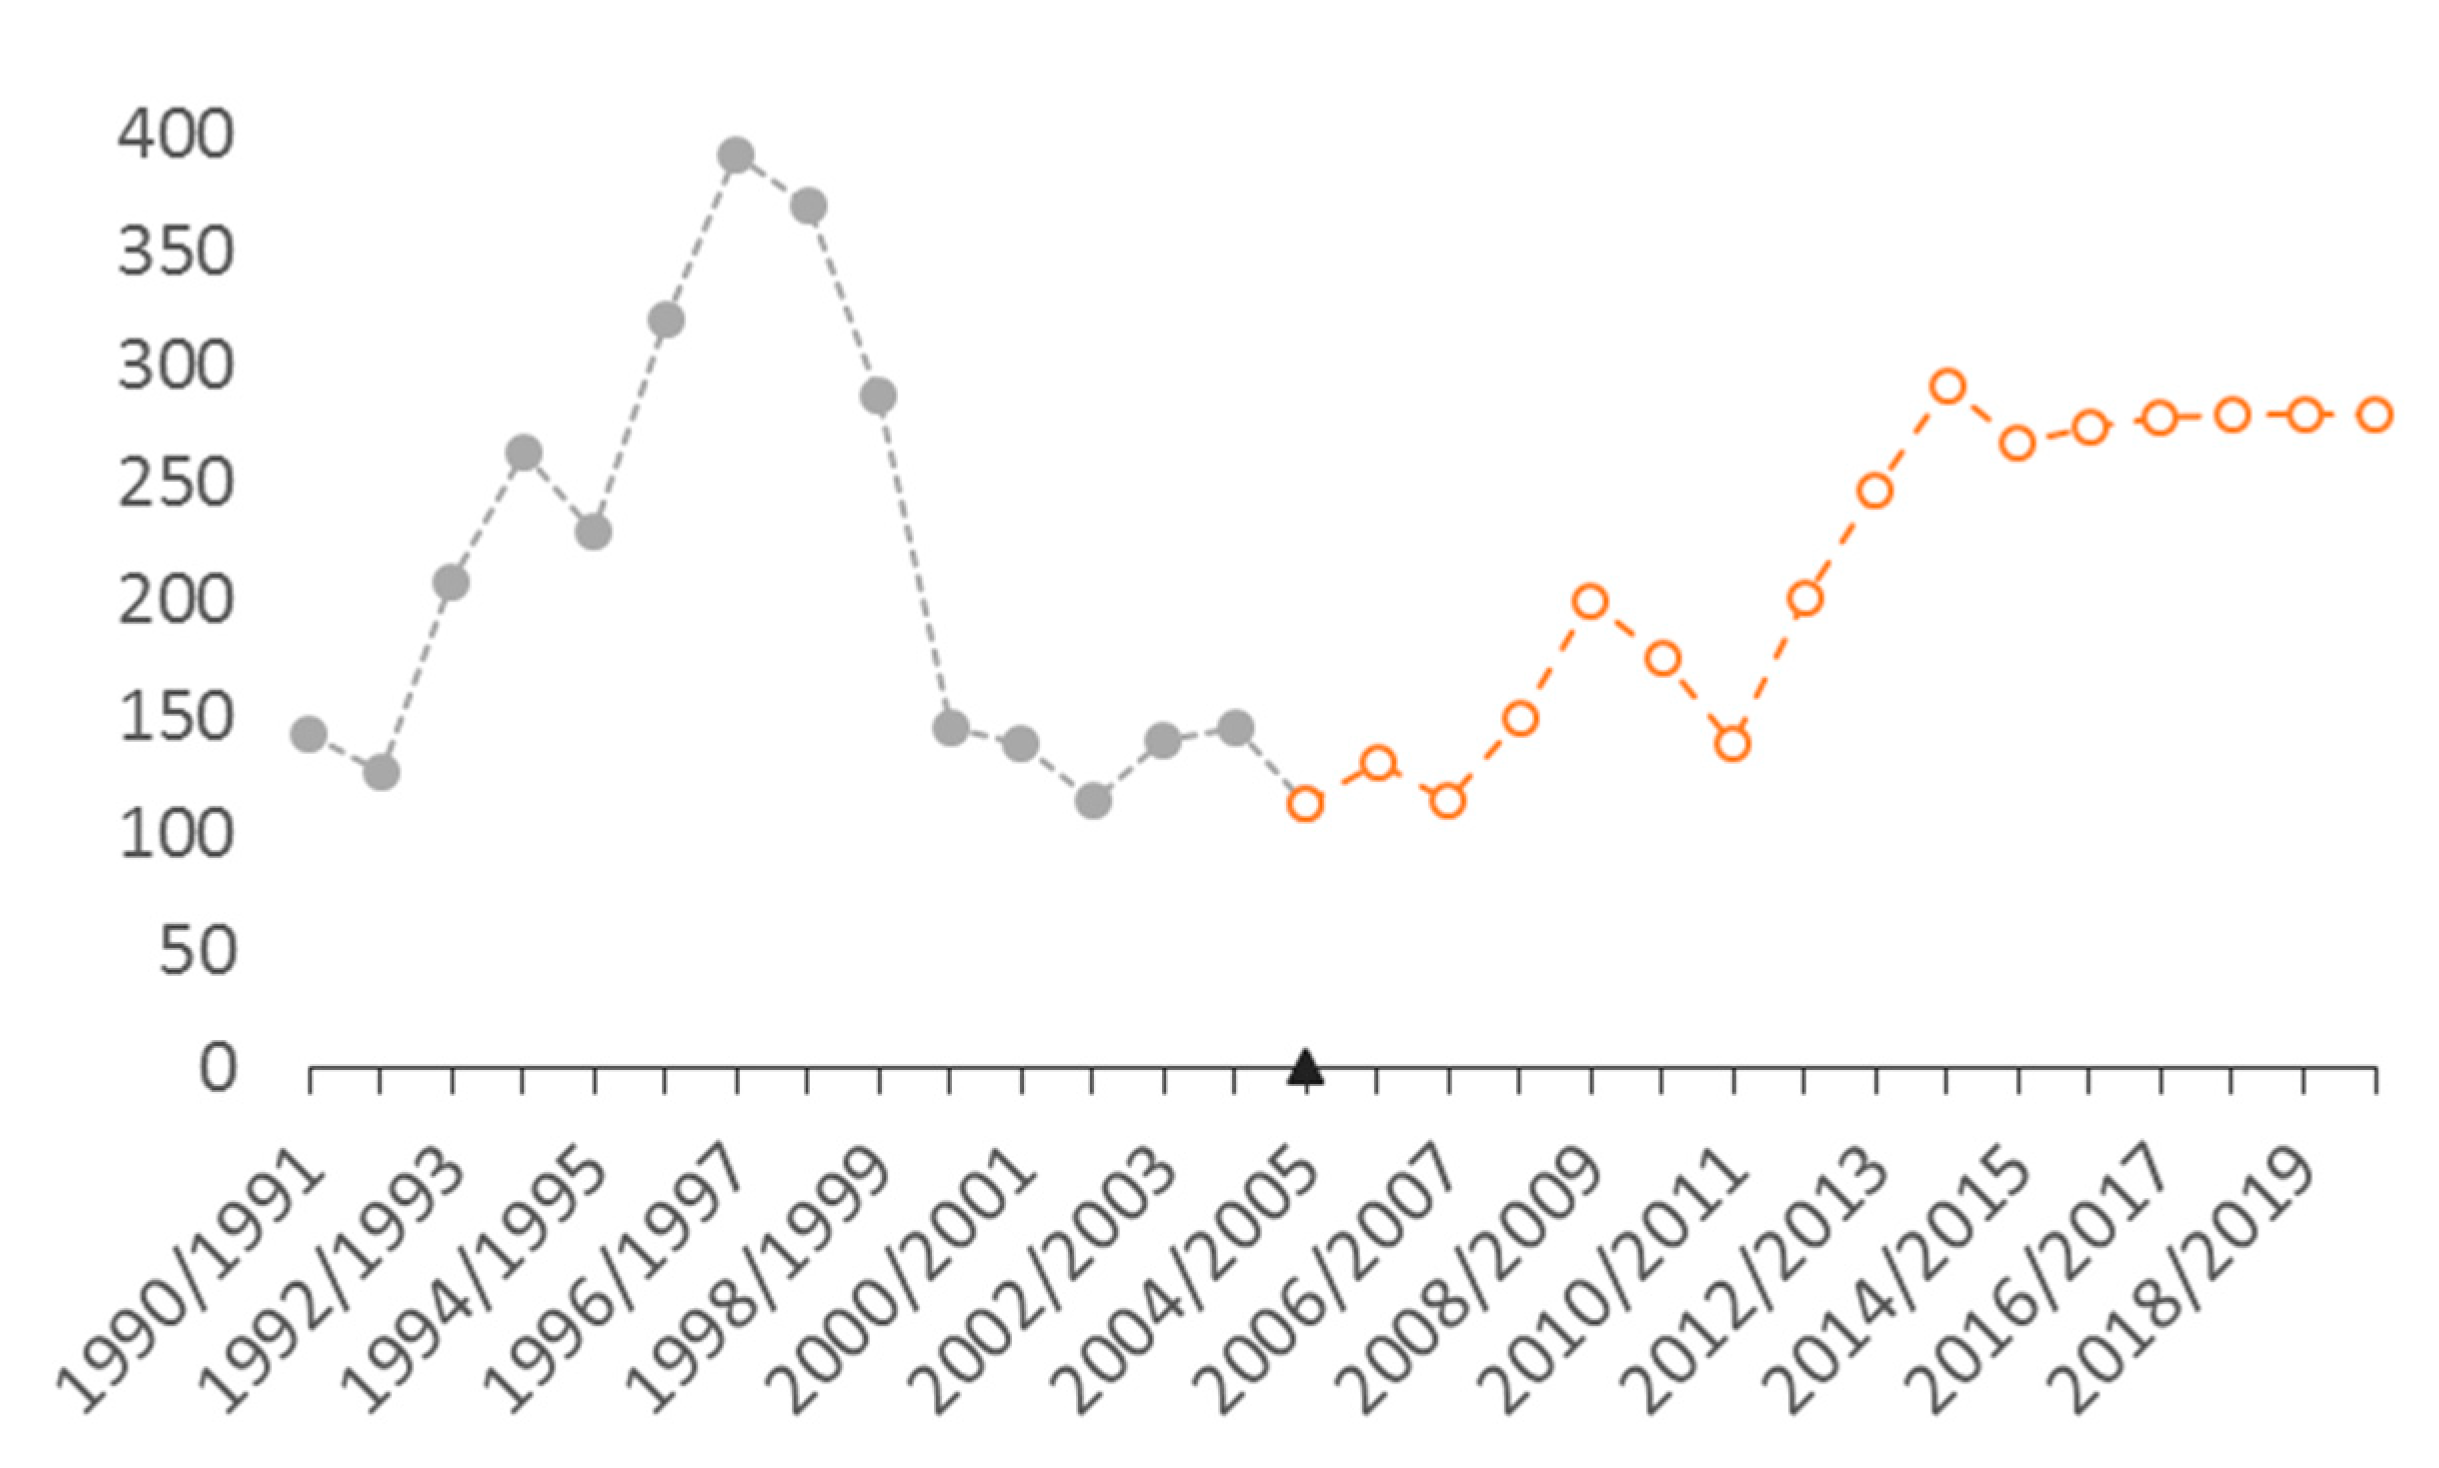
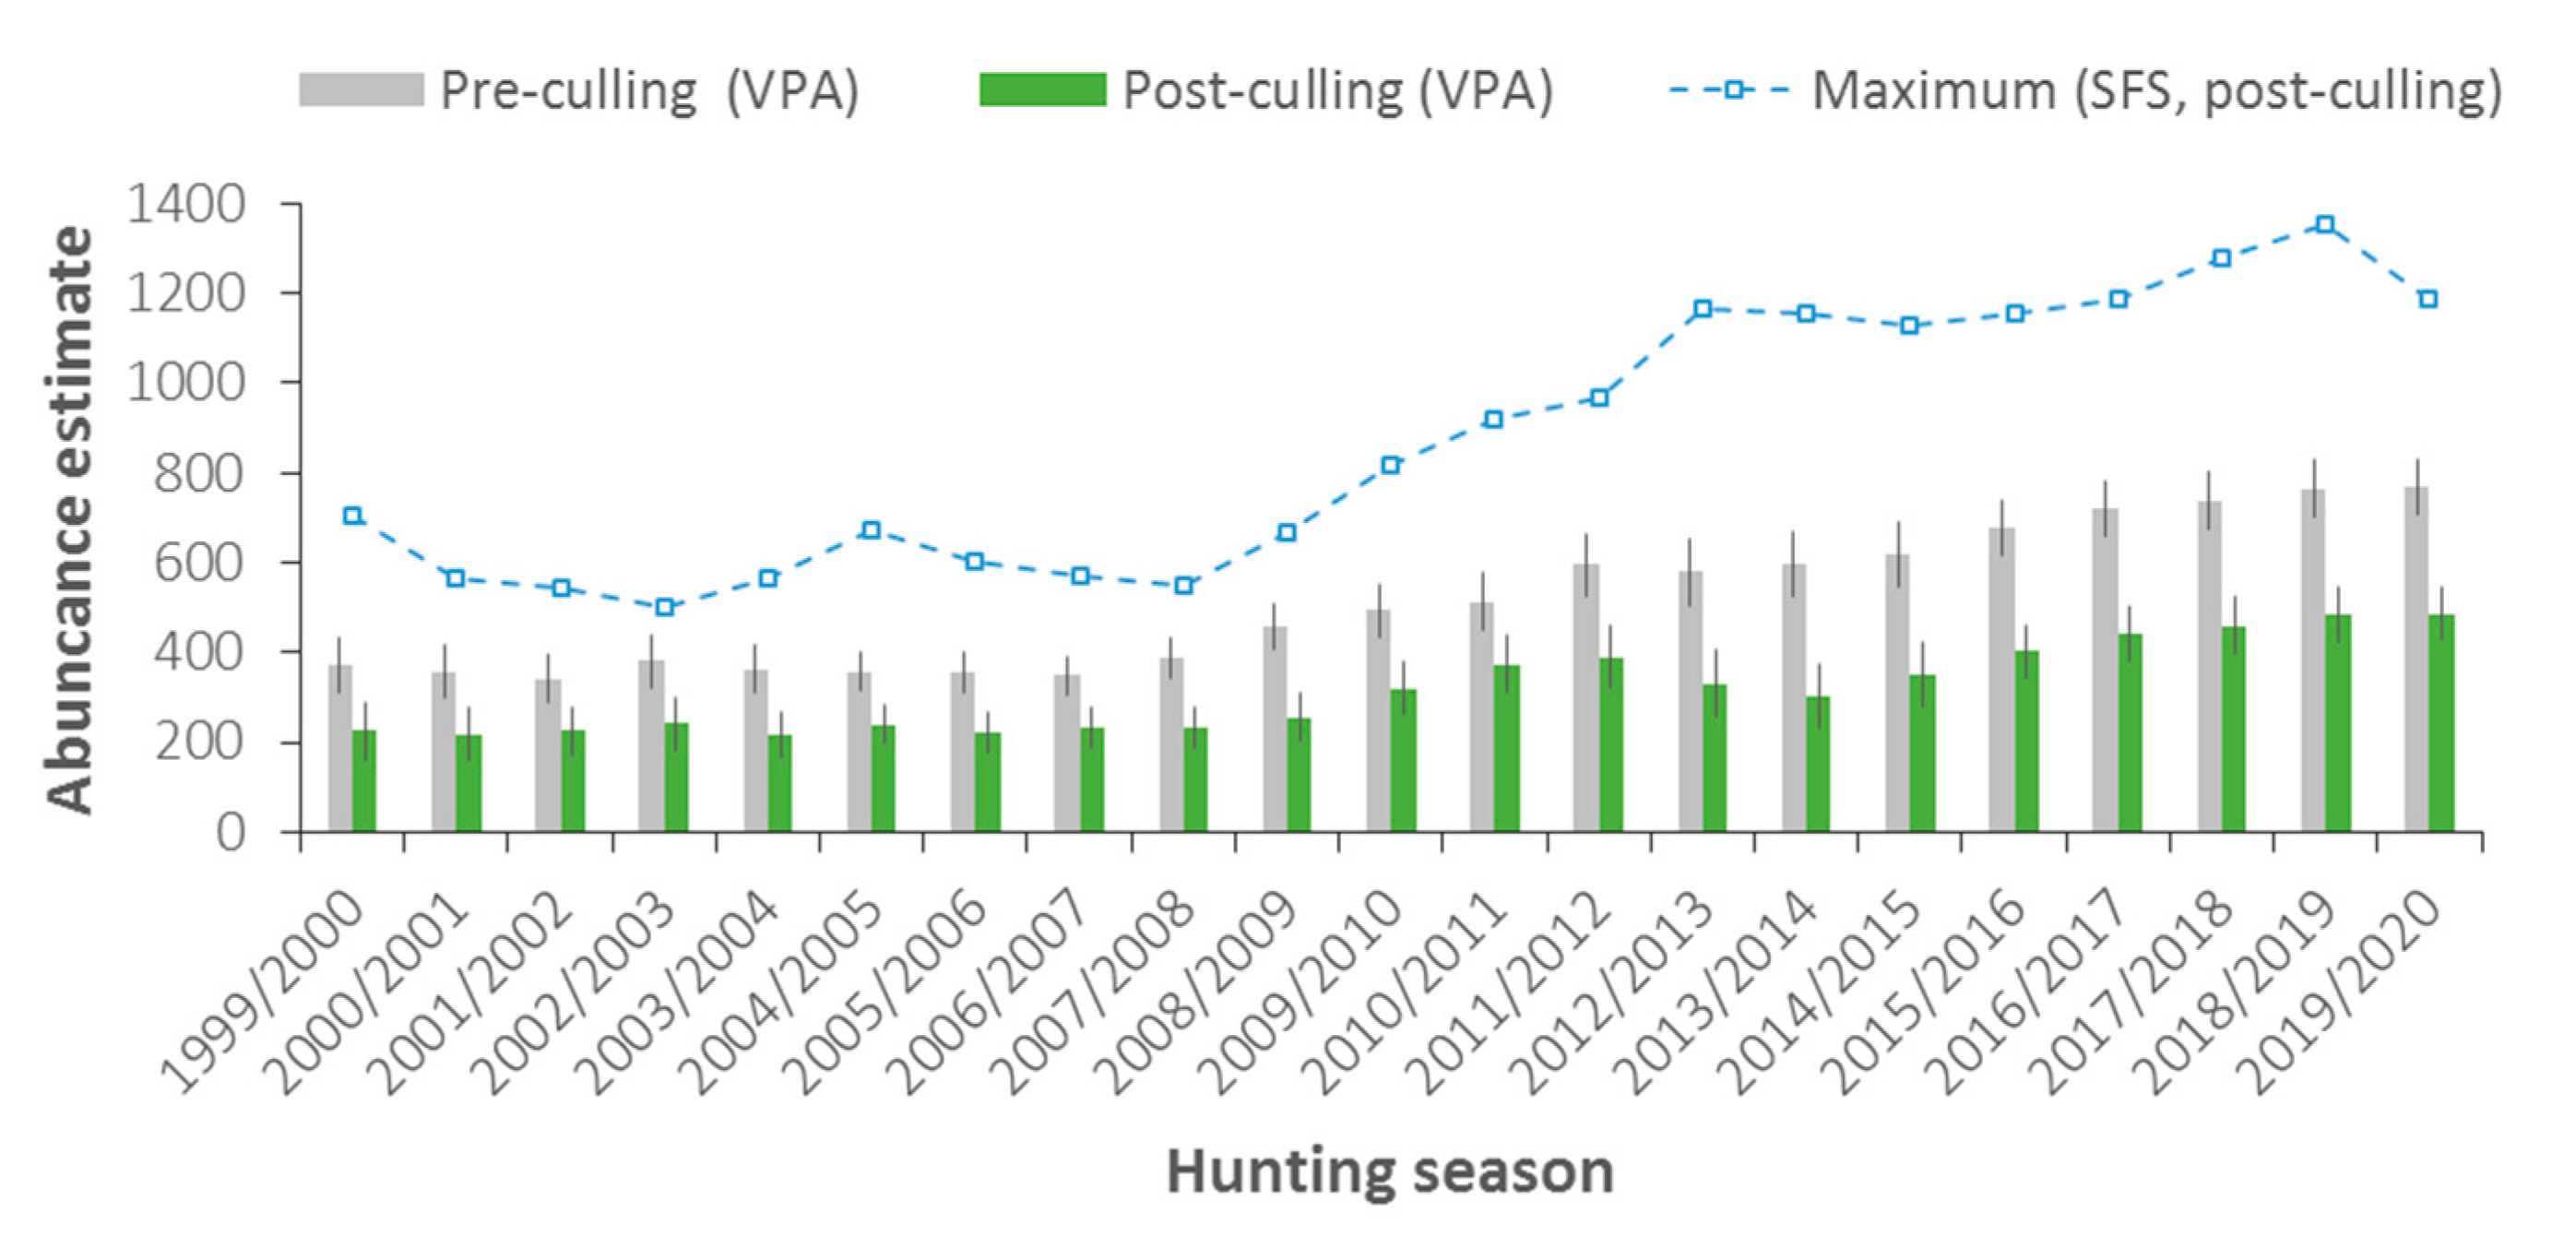
3.1. Abundance and Population Dynamics

Wolf abundance estimates by the SFS and our virtual population analysis demonstrated an increasing trend in wolf population dynamics during the past two decades (Figure 3). Post-harvest and pre-breeding estimates by the SFS indicated an increase from 703 individuals in 1999 to 1185 individuals in 2019. Our VPA estimates of minimum wolf abundance for the same period increased from 372 ± 63 to 767 ± 61 individuals (or 226 ± 63 to 487 ± 61, excluding harvested individuals). The results of both methods were temporally correlated (Pearson’s product-moment correlation, r = 0.9557, t = 14.157, df = 19, p < 0.001).
The SFS abundance estimates suggested three stages in Latvian wolf population dynamics during the study period (Figure 3), namely (1) relative stability (1999/2000–2008/2009), (2) increase (2009/2010–2012/2013), and (3) relative stability (2013/2014–2019/2020). The estimated carrying capacity (1066–1092 individuals [22]) was exceeded in 2012 when the estimated wolf abundance by the SFS was 1166 individuals. This coincided with a subsequent relative stability period in wolf population dynamics, as mentioned previously. The virtual population analysis suggested only two phases: relative stability from 1999/2000 to 2007/2008 and an increase from 2008/2009 to 2019/2020.

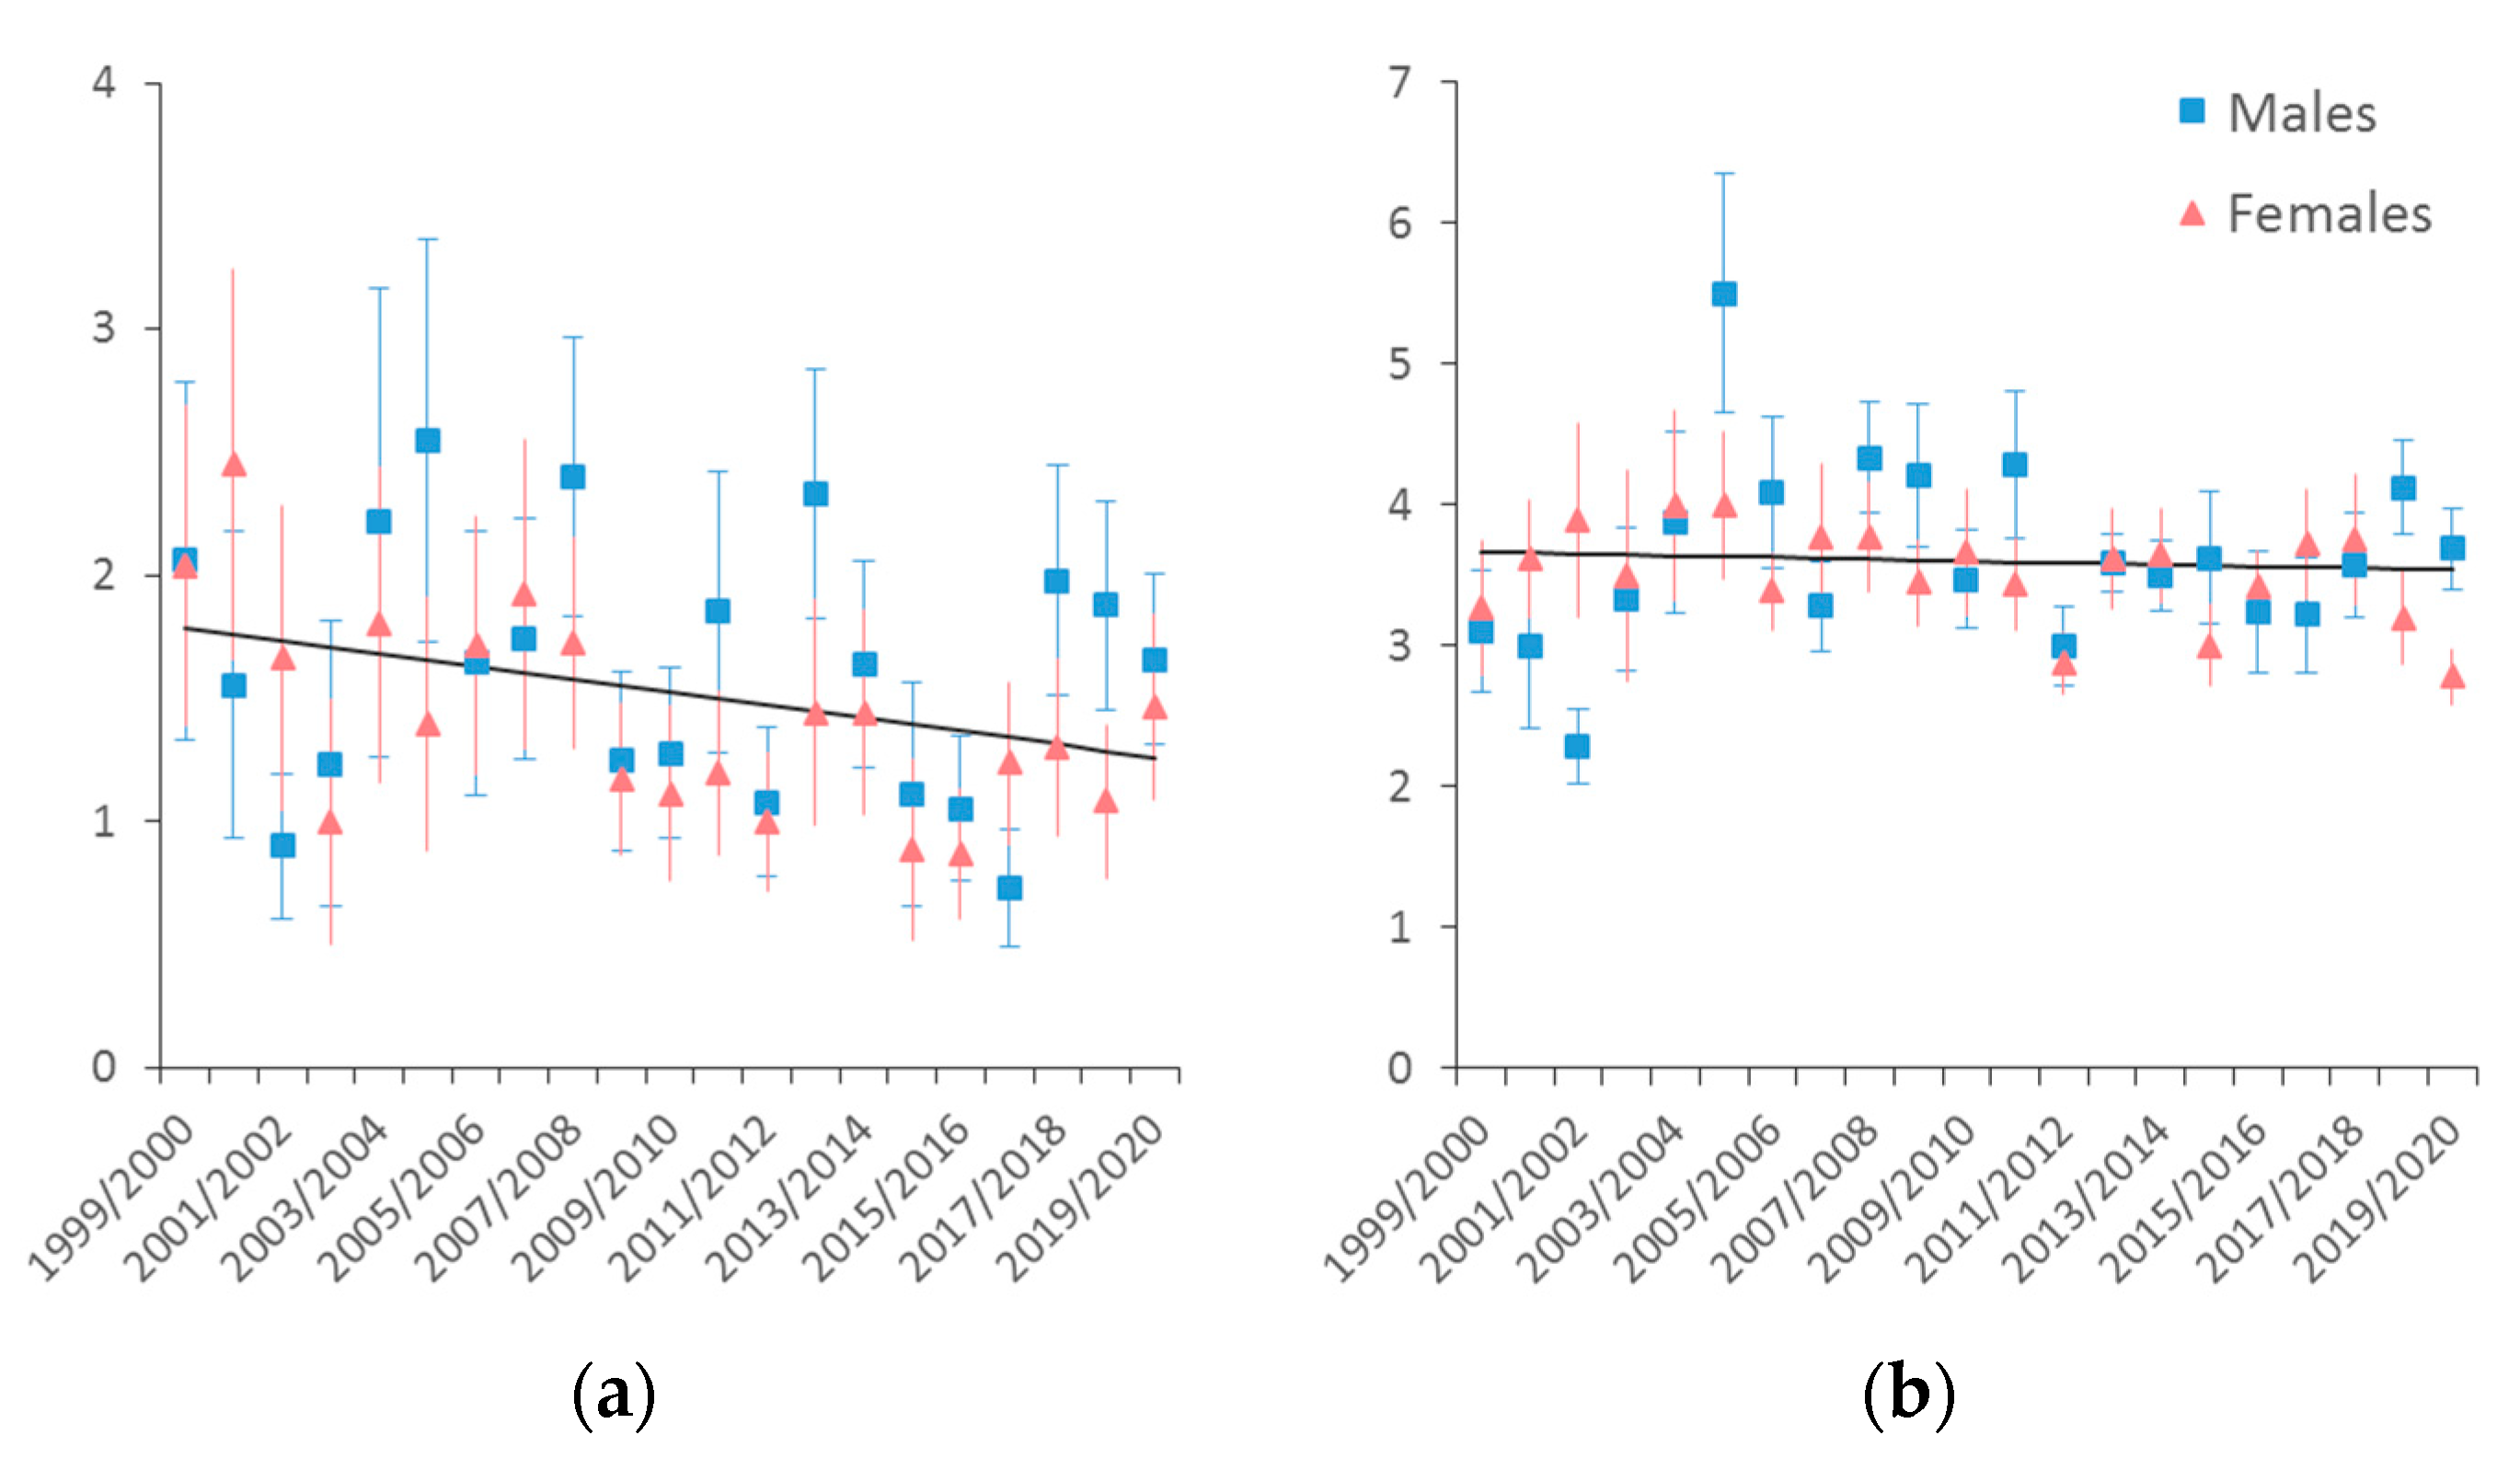
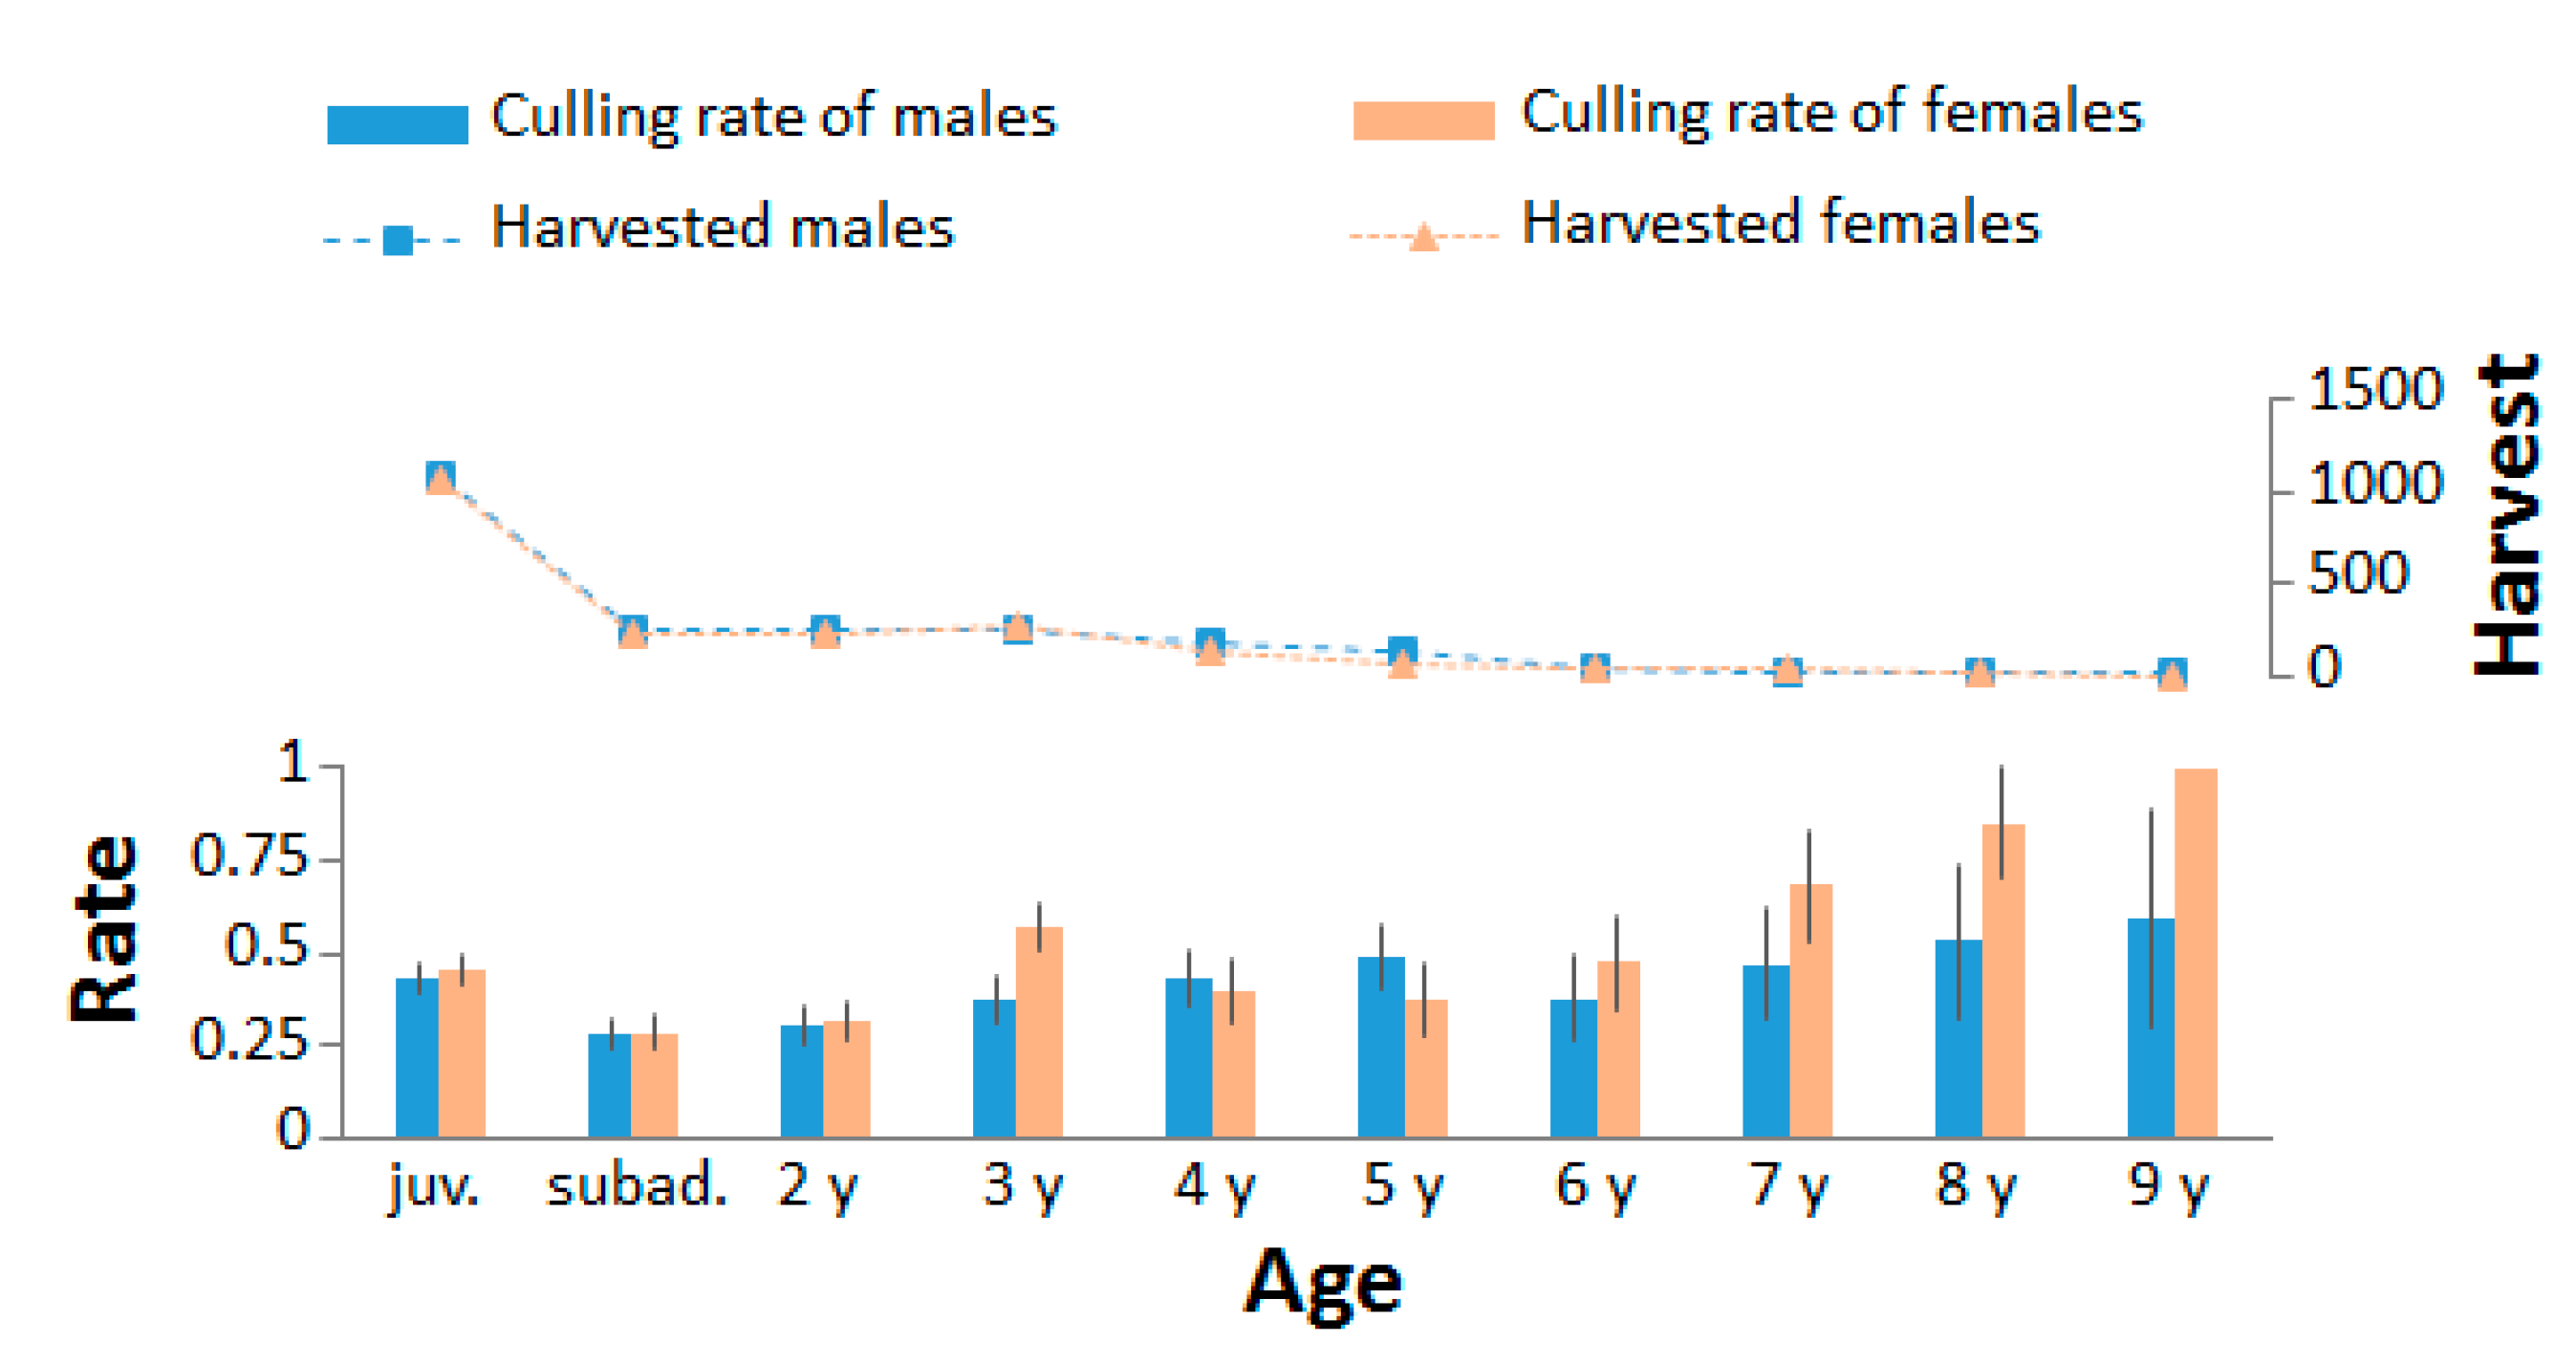
3.2. Sex and Age Structure and Culling Rate

The pooled sample from 1998 to 2020 indicated a slight female prevalence (0.99:1.01) among the culled or accidentally killed wolves, but without significant deviance from the expected ratio of 1:1 (Pearson’s chi-squared test, χ2 = 24.54, df = 21, p = 0.2674). A similar conclusion was made after taking into account information about harvested but unsampled individuals, for which the information on sex was provided by hunters (0.93:1.07, χ2 = 16.94, df = 15, p = 0.3225). Therefore, we conclude that the wolf sex ratio in Latvia during the past two decades remained practically equal.
The most frequently encountered age class was juveniles (i.e., born in spring before the opening of hunting season), which comprised 47.1% of all the sampled individuals. A considerable increase in the juvenile proportion was observed during the study period (Figure 4). The percentage of subadults (i.e., yearlings) and adults was 10.2% and 42.7%, respectively. The maximum observed age was 13 years, sampled once in 1998, while two individuals aged 12 years were encountered in 2005. Since then, no individuals older than 9 years were represented in the samples. As the ages of all the sampled individuals were considered, the mean age of the culled wolves was 1.47 years (SD = 1.98), but the mean age of the culled adults, taking into account individuals aged 2 years and older, was 3.61 years (SD = 1.67). When all the individuals were considered, a decreasing trend in the mean age was observed (slope = −0.0263; likelihood ratio test, p = 0.045), which was probably affected by the increasing frequency of juveniles (Figure 4 and Figure 5a). When only adults were concerned, the trend in the observed mean age was not significant (slope = −0.0065; p = 0.652) (Figure 5b).
The estimated mean culling mortality was 0.3728 (i.e., 37.3%), but it differed according to age (Figure 6). The culling mortality rate for juveniles was 0.4196, that for yearlings was 0.2563, and that for 2-year-old individuals was 0.3119. For older age classes from 3 to 9 years, the estimated culling rate gradually increased from 0.3982 to 0.7119. Significant differences were found in estimated age-specific culling rates for males and females (χ2 = 168.96, df = 27, p < 0.001).

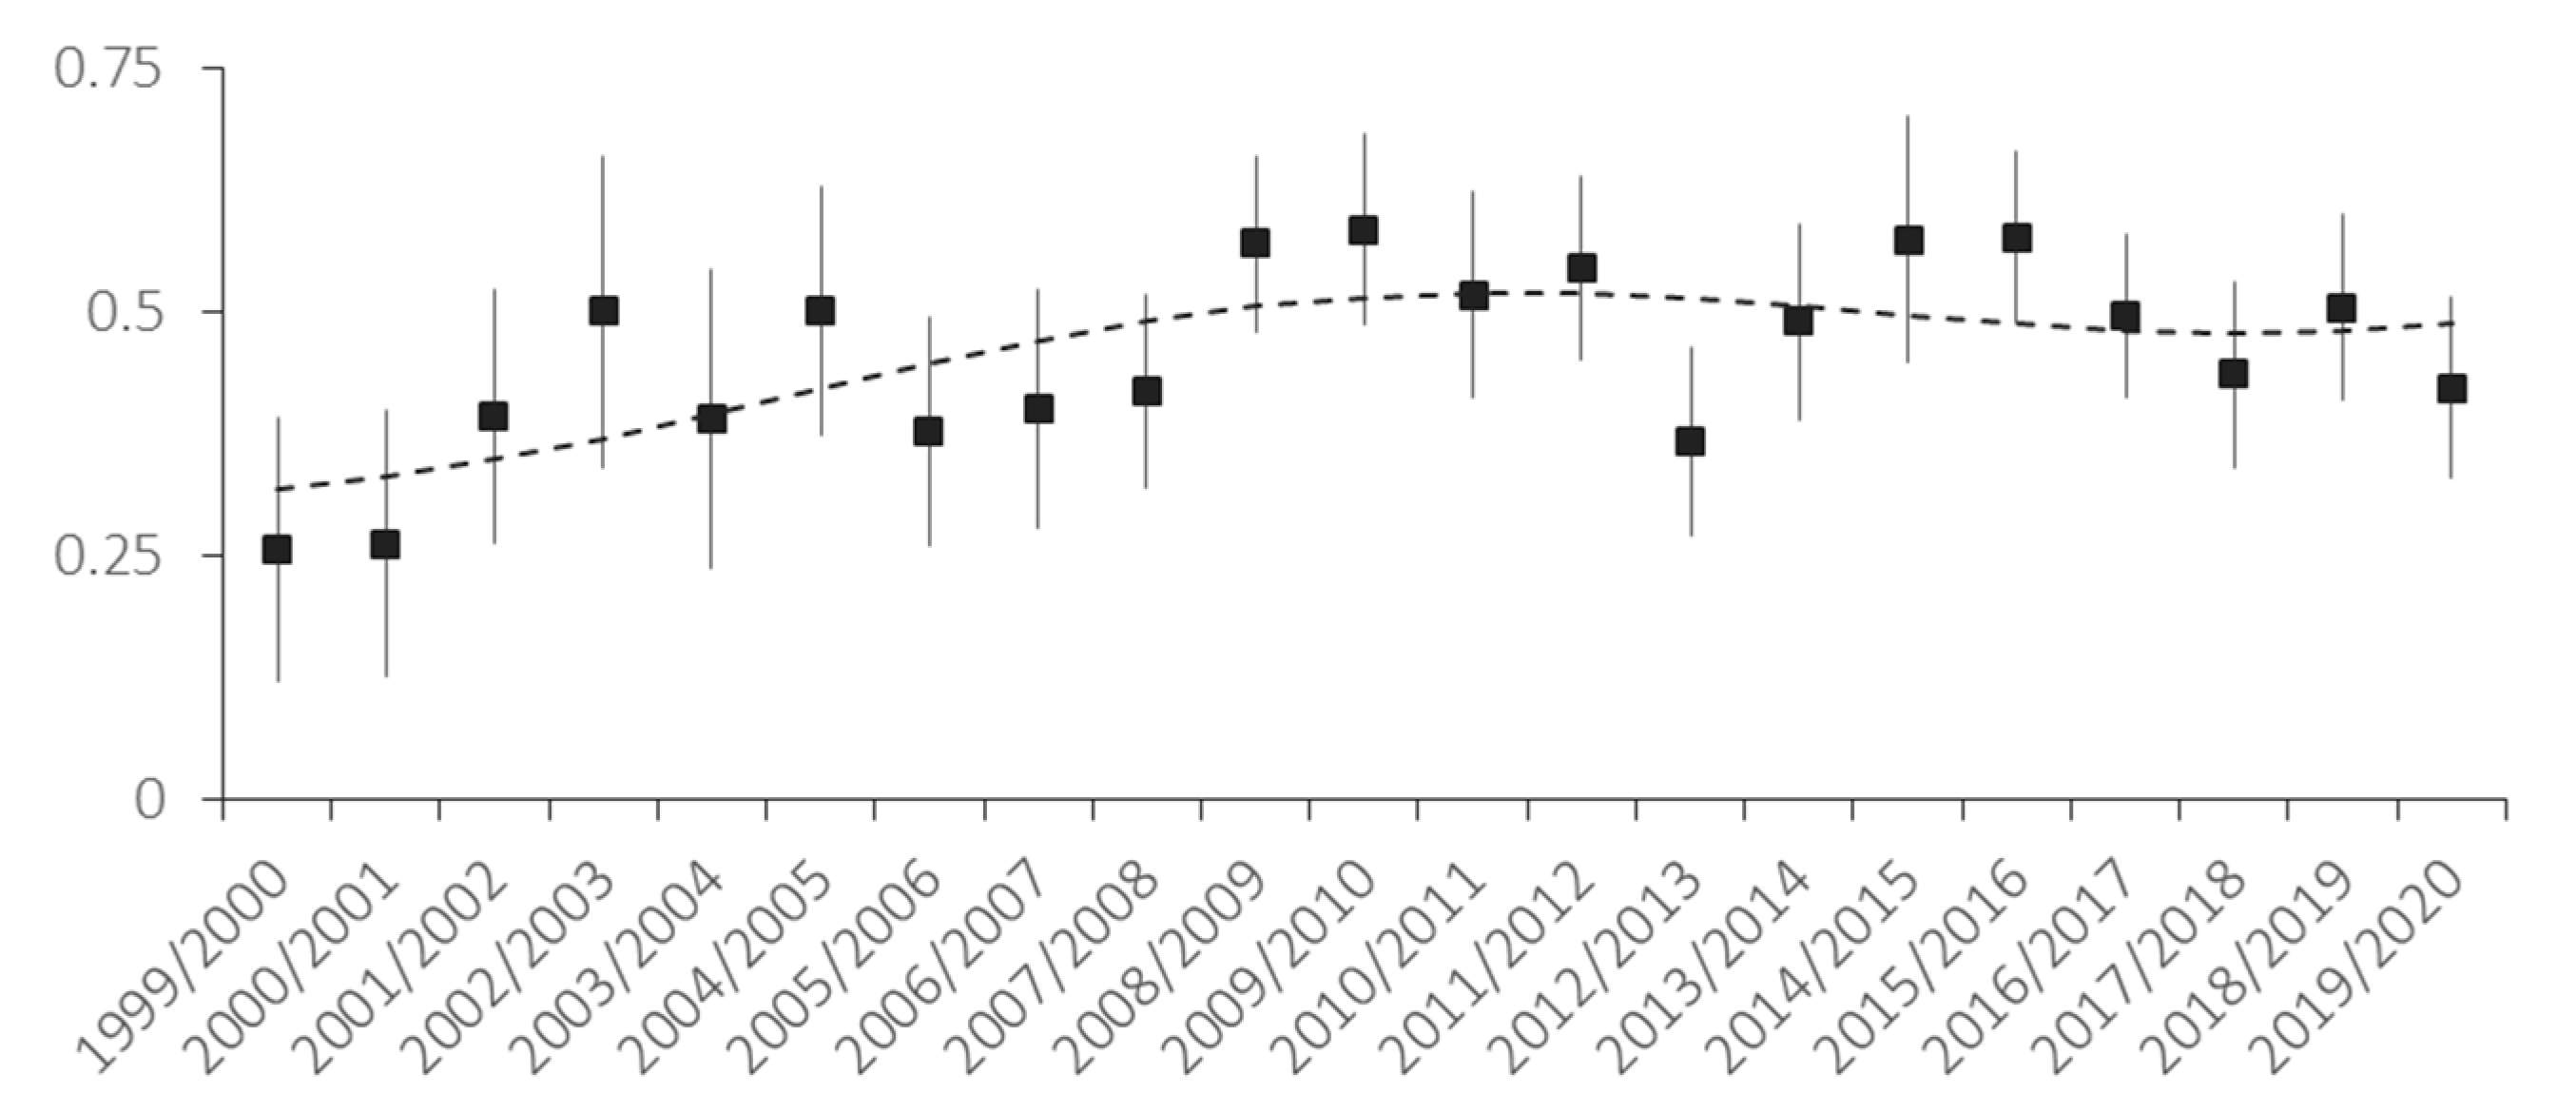
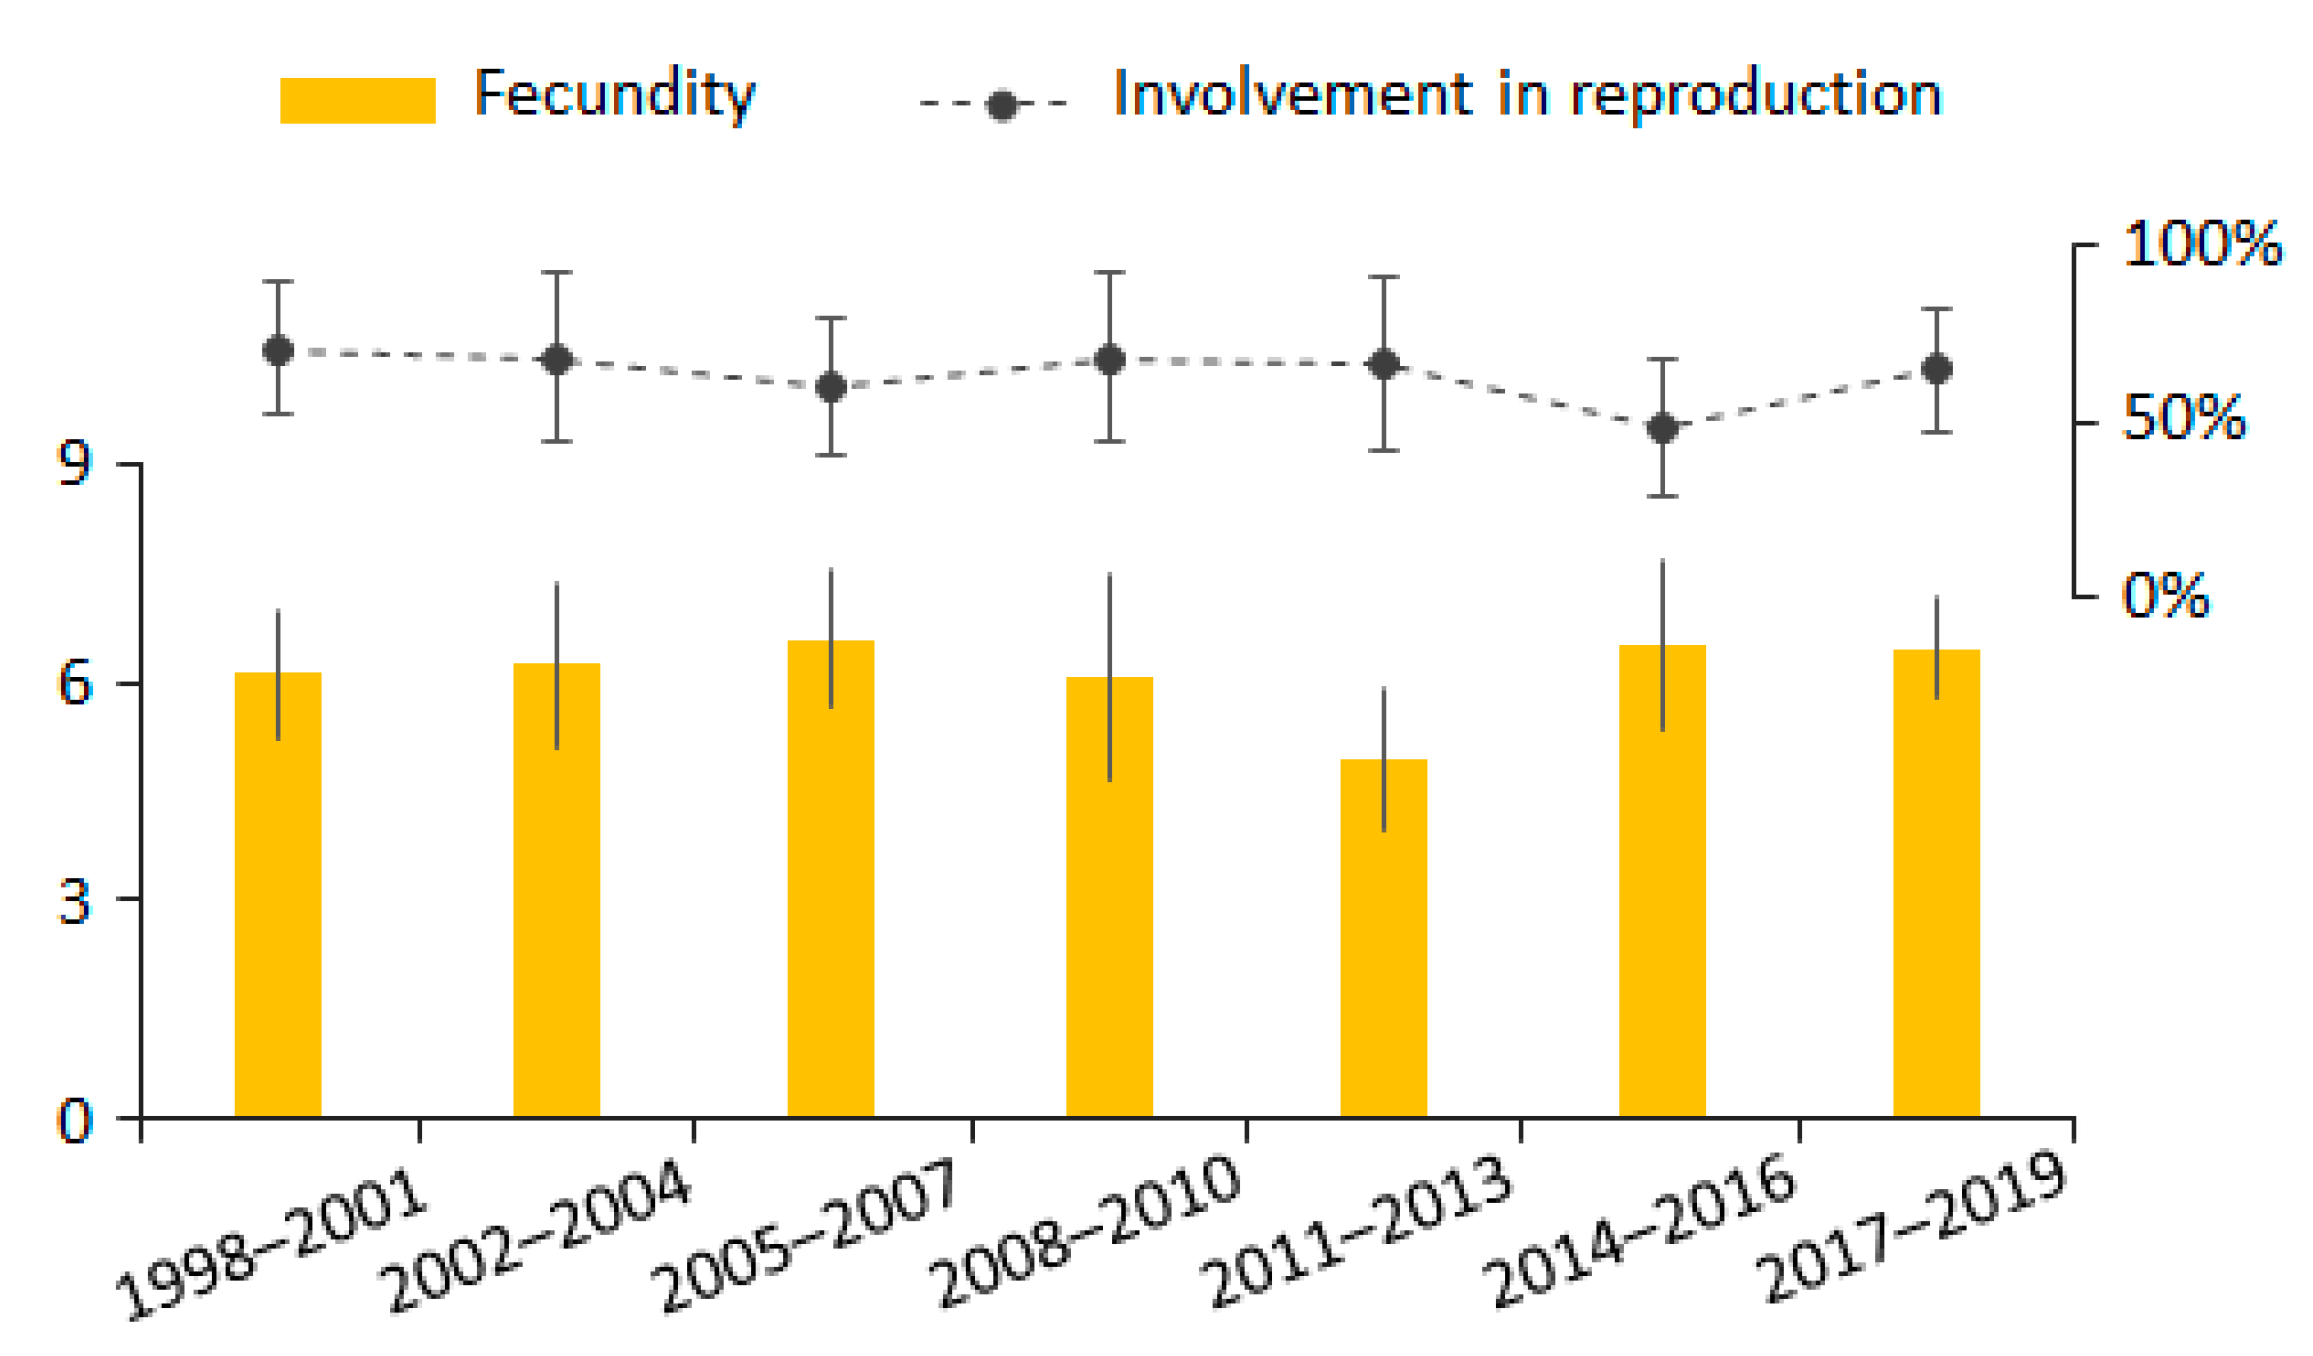
3.3. Female Reproduction Rate and Fecundity

The percentage of uteri and ovaria samples from adult females that contained traces of actual breeding (scars from previous placental attachment and corpora lutea) was 63.1% ± 7.6% (n = 206). The variation of this fraction was not significant during the study period (χ2 = 4.81, df = 6, p = 0.5688). Furthermore, no significant differences in prenatal litter size were found (single-factor ANOVA, F6,148 = 1.647, p = 0.128). An insignificant decrease in mean annual fecundity was detected in 2011–2013 (Figure 7), as the average number of uterine marks was 4.97 ± 0.98 (n = 31). In other periods, the mean annual fecundity was 6.4 ± 0.46 (n = 124).

4. Discussion

4.1. Abundance, Population Dynamics, and Carrying Capacity

More than a decade has passed since adaptive management of wolves in the Baltic countries was introduced and applied. Unlike in Estonia and Lithuania, the target population size in Latvia has not been set and maintained [21,25], thus theoretically allowing population growth. The official wolf abundance estimates by the SFS and our virtual population analysis indicated that the Latvian wolf subpopulation increased during the last two decades despite continuous culling. Considerable population growth has been evident for other species of large mammals as well, including prey species [30,41,42]. The number of reported livestock depredation cases during the last 10 years has slightly increased as well, albeit without statistical significance [30]. A reliable wolf census has not been continuously applied; hence, the actual wolf abundance in Latvia remains unknown, and the extent of the population growth has to be interpreted with caution. Several factors can contribute to local population increases despite the actual removal of individuals. For example, the harvested population is still expected to grow if the harvest is below the limit of sustainable yield, determined by the growth rate and the carrying capacity, or if under specific circumstances, the harvest replaces natural mortality in a way that reduces the overall mortality [27]. Apparent growth may have resulted from immigration from neighboring countries [20,43,44].
Continuous data on wolf abundance and harvesting from 1958 until 2004 allowed to evaluate the carrying capacity for the Latvian wolf subpopulation as a parameter in an autoregressive model [22], which can now be compared with the current abundance estimates. According to SFS data presented in this study, the predicted value of the carrying capacity (1066–1092 individuals [22]) was exceeded in 2012. Afterward, apparent stability in the estimated wolf abundance was observed, which is to be expected due to density regulation processes [27]. Another potential indicator, which may have resulted from a negative density dependence, was the observed decrease in litter size in 2011–2013. Plausible alternative explanations, however, are to be considered.
First, both the abundance estimates and the culling quotas are interdependent. The quota is decided according to the official abundance estimate by the SFS, but the results of virtual population analysis depend on the number of culled individuals per age class. Hence, the abundance estimates are proportional to the culling quota which, in 2012, was raised to 250 individuals, but has since been kept between 250 and 300 individuals (Figure 2). Therefore, apparent trend in the abundance estimates may have resulted from variation in the culling quotas. Additional information, such as culling success per unit of effort, would reflect actual density [39]; however, in our case, data on hunters’ efforts dedicated to wolf culling were lacking.
Second, the autoregressive approach in evaluating the parameters of a mechanistic model that describes population dynamics [22,23] is attributable to a carrying capacity, which results from a combination of ecological and socioeconomic limitations on the potential abundance. Due to the prevailing attitude of the society that the wolf population in Latvia has to be regulated [45,46], it is not expected to grow beyond socially acceptable limits up to its ecological carrying capacity, determined by the availability of prey, shelter, and other resources. Moreover, as suggested by Ozoliņš et al. [21,42], greater prey abundance, deliberate and nondeliberate human interference, and other factors may have contributed to an increase in the carrying capacity of wolves in Latvia, but the value of the carrying capacity used in this study was originally estimated as a constant [22,23]. Therefore, in light of recent findings, additional hypotheses, and a greater dataset, the carrying capacity of the Latvian wolf subpopulation must be re-evaluated. Such knowledge is relevant for planning and implementing sustainable management of wolves (and large carnivores in general).
Third, a smaller litter size may result from optimal population growth with lower reproductive input or limited prey resources per pack [18,33,47]. From 2009 until 2012, when lower fecundity was observed, the estimated number of roe deer Capreolus capreolus in Latvia dropped from ca. 240,000 individuals to ca. 137,000 individuals [30]. Other prey species, however, such as wild boar Sus scrofa, did not exhibit a decline and would have been available for a dietary shift [48,49]. Moreover, younger females tend to have smaller litters [50,51,52]. Therefore, observations reported in this study are currently insufficient for drawing a valid conclusion regarding the relationship between wolf abundance and the carrying capacity in Latvia.

4.2. Culling Rate Assessment and Impact on Demography and Reproduction

Our results indicated a mean annual culling mortality of 37.3%, suggesting that 62.7% of individuals are spared. Wolf populations may withstand rather high culling rates (around 40–60%) without declining in numbers [47,53], especially if the effects of hunting are mitigated by immigration or a rich prey base that supports high reproduction rates [33]. However, numerically sustainable culling can still have detrimental effects on the social structure, demography, and genetic viability of the population [54,55,56].
During the last two decades, the mean age of wolves culled in Latvia, considering only adult individuals, was 3.6 years. Wolves older than 7 years comprised 7.4% of the culled individuals (Table A1). The maximum age that a wolf can reach in the wild is 15–16 years [50,57,58]. In populations that experience no or moderate persecution, wolves can live 7–10 years, while in heavily affected populations, wolves rarely live past 5–7 years [54,59]. As the mean age of adult individuals did not exhibit a significant decline and wolves aged 8 or 9 years were regularly encountered, albeit not in every season, our results suggest that the culling impact on adult wolves in the Latvian subpopulation was stable during the last decade. However, due to the increased culling rate for older age classes, a raise in the culling quota or a relatively greater culling impact would likely advance the removal of older individuals from the population. A shorter lifespan due to high hunting pressure can cause higher breeder turnover in the population, thus reducing social and spatial stability. Disrupted population structure can lead to changes in animal behavior and dispersal patterns, reproduction rates, and genetic parameters, as well as the demographic and kinship structure of the population [18,60,61,62], which in turn can have negative effects on species long-term fitness, conservation, and sustainability [27,56,63]. Additionally, younger animals may lack knowledge and experience to be proficient hunters and therefore resort to livestock depredation [18].
Another age group susceptible to a relatively high culling impact was the juveniles. The estimated culling mortality for the juveniles was 42%, which was greater than that for yearlings (25.6%) and individuals aged 2 years (31.2%). Moreover, an increasing trend in the juvenile proportion among the culled wolves was observed as the quota was gradually increased. Mortality due to culling for young and inexperienced individuals is expected to be high [7,33,64]. However, the juvenile proportion tends to be greater in harvested than unmanaged populations [50,64,65,66]. This may result from differences in breeding rates and the resulting reproductive input. For example, studies from North America indicated that, in protected populations, a rather low proportion of reproducing females was observed (33–36%), whereas in controlled populations, up to 58% of females took part in reproduction [52].
The investigation of the sexual structure in culled wolves revealed an insignificant female bias. The wolf is a classic example of a monogamous species with a long-term bond and biparental care of the offspring [50,65]. In such species, slight female bias may result according to the advantage daughter hypothesis, which predicts the likely transfer of social rank (or other beneficial quality) from mothers to daughters [65,67], and rank takeover from culled mothers by daughters has indeed been found in a regulated wolf population [68]. However, we also observed significantly higher culling rates for particular female age classes, which might have also affected the sex ratio. To our knowledge, this observation is contrary to conclusions of other studies, which found higher culling mortality for males [69] or no differences in male and female survival [33]. From a hunter’s perspective, wolf culling in Latvia is considered to be unselective because of difficulties in distinguishing the sex (and, from autumn, also age) of a wolf in a hunting situation and a tendency to use every available opportunity to kill a wolf. Therefore, more vulnerable or less fit individuals are more likely to be culled [60].
Apart from temporarily reduced fecundity in 2011–2013, we observed a stable average litter size (6.1) and proportion of females that had offspring (63.1%). In Europe, the mean litter size of wolves varies between 4.4 and 7.7 (mean: 5.9 [70]), and similar litter sizes have been observed in North America [33]. Several exploited wolf populations have exhibited larger litter sizes, as well as a high proportion of reproducing females and early breeding [18,33,47,52,55]. In this study, we did not attempt to investigate female reproduction concerning age, but we encountered at least three females that had offspring before reaching two full years, eight females rutting before reaching two full years, and one female rutting before reaching a full year [71]. In general, wolf females begin to reproduce at 2–4 years of age. Reproduction at an earlier age is rare and usually enabled by easily available vacant territories due to wolf culling and abundant prey resources [33,52]. Thus, the observed reproduction rates (49–71%), several cases of early reproduction (under 2 full years), comparatively large litter size (~6 pups), and high juvenile proportion may indicate that the Latvian wolf subpopulation is compensating for the culling loss, which is facilitated by high prey abundance.

4.3. Implications for Conservation and Management

The so-called Baltic population of wolves is one of the most viable wolf populations in Europe [17]. Therefore, its role in sustaining the genetic diversity of this species at a European scale is significant. Nevertheless, the management approaches in each of the countries that share the Baltic wolf population are different, ranging from strict protection in Poland to intensive exploitation in Russia [21]. International cooperation and awareness with regard to species conservation status and management goals at a local scale are needed.
Species conservation requires not only numerically and spatially sustainable population, but also the social, behavioral, and genetic integrity of the population to ensure species long-term existence and the ability to perform its ecological functions. Therefore, to better understand the responses of the Latvian wolf subpopulation to current management actions and its long-term impact, an investigation also has to be conducted beyond monitoring wolf density and reproduction rates. As immigration from the east due to the present lack of physical barriers along the EU–Russian border may be one of the reasons for the Latvian wolf subpopulation showing an increasing trend despite the current harvest rate, its possible sink effect within the wolf metapopulation network of the Baltic region should be assessed in future studies. Genetic samples are now routinely obtained from culled individuals, which will allow an estimation of genetic diversity and the number of packs, as well as a determination of diachronic interindividual kinship, dispersal patterns, and potential relationships with neighboring wolf populations [25].
However, wolves, as wild carnivores living close to humans in populated landscapes, are associated with real or perceived threats to the safety of the society as well as economic loss due to livestock depredation and availability of wild game species to the hunters. In areas where the wolf conservation status permits, their lethal control has been applied to mitigate these problems. Nevertheless, we have argued that culling may stimulate wolf breeding and litter sizes. Moreover, inappropriately motivated and executed culling may fail in its goal to reduce livestock depredation damages [72]. In a scientific sense, legal culling can be appreciated for providing the researchers with valuable and reliable information (e.g., data on age structure and reproductive status), which are difficult to obtain otherwise. Ultimately, its effectiveness in sustainable wolf management must be continuously evaluated.

5. Conclusions

Our results indicate that during the last two decades, the Latvian wolf subpopulation has been under moderate hunting pressure, which preserved the stable sex ratio (despite unequal culling mortality) and adult age structure of the population and allowed its growth due to high breeding rates and litter sizes (the role of immigration, however, remains unknown). The apparent stabilization in recent population dynamics in relation to the previously estimated carrying capacity could not be definitively associated with the negative effects of density dependence, and reaching the natural limitations of wolf abundance in Latvia due to competing interests is considered unrealistic. The population status should be evaluated on the basis of not only abundance but also data on population structure obtained using various methods. In this respect, legal culling provides valuable and reliable information; therefore, its coupling with species monitoring efforts is advisable.

Author Contributions

Conceptualization, G.B., G.D., M.L., A.O., J.O., D.P., A.S., J.Š. and A.Ž.; methodology, G.B., G.D., M.L., A.O., J.O., D.P., A.S. and A.Ž.; software, J.Š.; validation, J.Š. and AŽ; formal analysis, J.Š. and A.Ž.; investigation, G.B., G.D., M.L., A.O., J.O., D.P., A.S., J.Š. and A.Ž.; resources, G.B., G.D., M.L., A.O., J.O., D.P., A.S. and A.Ž.; data curation, G.B., G.D., M.L., A.O., J.O. and A.Ž.; writing—original draft preparation, J.Š., J.O. and A.Ž.; writing—review and editing, J.Š. and A.Ž.; visualization, J.Š.; supervision, J.O.; project administration, J.O.; funding acquisition, J.O. and J.Š. All authors have read and agreed to the published version of the manuscript.

Funding

This study was conducted as part of the postdoctoral research project “Sub-population dynamics of grey wolf Canis lupus and Eurasian lynx Lynx lynx in Latvia and identification of depredation risk on livestock” (No. 1.1.1.2/VIAA/3/19/511), funded by the European Regional Development Fund. Prior research, “Developing of genetic monitoring for wildlife in Latvia”, was funded by the European Social Fund (project no. 2014/0002/1DP/1.1.1.2.0/13/APIA/VIAA/053). The investigation of variations in the large carnivore population in Latvia depending on hunting pressure was supported by the Game Management Development Fund of the Ministry of Agriculture of the Republic of Latvia.

Institutional Review Board Statement

Not applicable.

Informed Consent Statement

Not applicable.

Data Availability Statement

A summary of the data presented in this study is included in Appendix A (Table A1 and Table A2). Official data on game statistics in Latvia are available from the State Forest Service website: https://www.vmd.gov.lv/valsts-meza-dienests/statiskas-lapas/medibas/valsts-meza-dienests/statiskas-lapas/skaitli-un-fakti?id=766 (accessed on 13 June 2020) [30].

Acknowledgments

We are grateful to all who provided sample material for this study and contributed to preparation and improvement of the manuscript.

Conflicts of Interest

The authors declare no conflict of interest. The funders had no role in the design of the study; in the collection, analyses, or interpretation of data; in the writing of the manuscript; or in the decision to publish the results.

Appendix A. Data Used in the Study

Table A1. Data used in the virtual population analysis (VPA).
Hunting SeasonTotal Harvest (Number of Culled and Otherwise Recovered Individuals)Ratio of Males to FemalesEstimated Number of Individuals in the Harvest According
to Age
JuvenilesYearlings2 Years3 Years
1999/20001460.82538.24 ± 19.5220.86 ± 15.5341.71 ± 20.0524.33 ± 16.54
2000/20011390.85340.24 ± 20.4421.95 ± 16.4329.26 ± 18.3721.95 ± 16.43
2001/20021140.946.44 ± 12.8133.78 ± 11.9121.11 ± 10.132.11 ± 3.52
2002/20031400.86780 ± 23.8720 ± 16.8812 ± 13.516 ± 15.35
2003/20041460.82559.9 ± 23.0518.72 ± 15.6718.72 ± 15.6718.72 ± 15.67
2004/20051191.44762.53 ± 12.6910.08 ± 7.088.07 ± 6.398.07 ± 6.39
2005/20061341.12957.11 ± 14.4521.97 ± 10.828.79 ± 7.2317.57 ± 9.86
2006/20071161.548.65 ± 11.459.35 ± 6.3214.97 ± 7.7826.19 ± 9.7
2007/20081550.98766.2 ± 11.0314.53 ± 6.516.15 ± 6.8122.6 ± 7.87
2008/20092020.922120.11 ± 14.3923.66 ± 9.4316.38 ± 812.74 ± 7.13
2009/20101721.25103.55 ± 12.7414.04 ± 7.1214.04 ± 7.1219.31 ± 8.21
2010/20111410.98676.31 ± 1114.93 ± 6.7914.93 ± 6.798.29 ± 5.19
2011/20122061.138123.6 ± 16.5214.42 ± 8.628.84 ± 11.720.6 ± 10.11
2012/20132481.157110.22 ± 25.729.19 ± 9.7724.49 ± 15.4442.86 ± 19.57
2013/20142941.014162.21 ± 30.066.76 ± 9.0627.03 ± 17.4637.17 ± 20.09
2014/20152671.153176.32 ± 35.9615.11 ± 17.5520.15 ± 20.0625.19 ± 22.19
2015/20162751.116173.68 ± 21.6331.36 ± 14.2624.12 ± 12.6919.3 ± 11.46
2016/20172791.182173.43 ± 22.6937.7 ± 15.9925.14 ± 13.3912.57 ± 9.7
2017/20182801127.77 ± 24.938.06 ± 17.1335.34 ± 16.635.34 ± 16.6
2018/20192801.345146.54 ± 24.2128.79 ± 14.7223.55 ± 13.4534.02 ± 15.83
2019/20202801.5118.17 ± 23.5741.1 ± 16.8943.67 ± 17.3233.39 ± 15.47
Hunting SeasonEstimated Number of Individuals in the Harvest According to Age
4 Years5 Years6 Years7 Years8 Years9 Years
1999/20003.48 ± 6.776.95 ± 9.453.48 ± 6.773.48 ± 6.773.48 ± 6.770 ± 6.39
2000/200110.97 ± 12.153.66 ± 7.213.66 ± 7.217.32 ± 10.060 ± 6.770 ± 6.77
2001/20024.22 ± 4.920 ± 3.362.11 ± 3.524.22 ± 4.920 ± 3.360 ± 3.36
2002/20030 ± 7.518 ± 11.24 ± 8.040 ± 7.510 ± 7.510 ± 7.51
2003/200411.23 ± 12.493.74 ± 7.413.74 ± 7.417.49 ± 10.340 ± 6.973.74 ± 7.41
2004/200510.08 ± 7.086.05 ± 5.586.05 ± 5.580 ± 3.154.03 ± 4.60 ± 3.15
2005/200615.38 ± 9.318.79 ± 7.230 ± 3.572.2 ± 3.710 ± 3.572.2 ± 3.71
2006/20075.61 ± 4.985.61 ± 4.980 ± 2.811.87 ± 2.923.74 ± 4.10 ± 2.81
2007/200811.3 ± 5.86.46 ± 4.466.46 ± 4.466.46 ± 4.463.23 ± 3.191.61 ± 2.26
2008/200912.74 ± 7.135.46 ± 4.757.28 ± 5.461.82 ± 2.771.82 ± 2.770 ± 2.71
2009/201012.29 ± 6.71.76 ± 2.620 ± 2.557.02 ± 5.150 ± 2.550 ± 2.55
2010/201111.61 ± 6.076.64 ± 4.674.98 ± 4.070 ± 2.313.32 ± 3.350 ± 2.31
2011/201214.42 ± 8.62.06 ± 3.352.06 ± 3.350 ± 3.270 ± 3.270 ± 3.27
2012/201330.62 ± 17.0321.43 ± 14.549.19 ± 9.770 ± 5.550 ± 5.550 ± 5.55
2013/201437.17 ± 20.0913.52 ± 12.666.76 ± 9.063.38 ± 6.440 ± 6.260 ± 6.26
2014/201520.15 ± 20.065.04 ± 10.335.04 ± 10.330 ± 9.870 ± 9.870 ± 9.87
2015/201616.89 ± 10.777.24 ± 7.180 ± 4.090 ± 4.090 ± 4.092.41 ± 4.18
2016/20177.54 ± 7.5915.08 ± 10.585.03 ± 6.222.51 ± 4.420 ± 4.320 ± 4.32
2017/201819.03 ± 12.5810.87 ± 9.660 ± 4.795.44 ± 6.92.72 ± 4.95.44 ± 6.9
2018/201918.32 ± 11.9810.47 ± 9.1910.47 ± 9.195.23 ± 6.562.62 ± 4.660 ± 4.56
2019/202017.98 ± 11.712.84 ± 9.9810.28 ± 8.972.57 ± 4.550 ± 4.450 ± 4.45
Table A2. Pooled dataset used in the analysis of female reproduction rate and fecundity.
PeriodNo Traces of BreedingConfirmed PregnancyMean Number of Placental Marks or Embryos
1998–20019226.1 (SD = 1.6, n = 16)
2002−20047156.3 (SD = 2.1, n = 16)
2005–200714216.6 (SD = 2.2, n = 23)
2008–20107156.1 (SD = 2.3, n = 13)
2011–20137145 (SD = 2.7, n = 31)
2014–201618176.5 (SD = 3, n = 27)
2017–201914266.5 (SD = 1.9, n = 29)
Total/mean761306.1 (SD = 2.4, n = 155)

References

  1. Breitenmoser, U. Large predators in the Alps: The fall and rise of man’s competitors. Biol. Conserv. 1998, 83, 279–289. [Google Scholar] [CrossRef]
  2. Linnell, J.D.C.; Andersen, R.; Kvam, T.O.R.; Andren, H.; Liberg, O.; Odden, J.; Moa, P.F. Home range size and choice of management strategy for lynx in Scandinavia. Environ. Manag. 2001, 27, 869–879. [Google Scholar] [CrossRef]
  3. Fritts, S.H.; Stephenson, R.O.; Hayes, R.D.; Boitani, L. Wolves and humans. In Wolves: Behavior, Ecology, and Conservation; Mech, D.L., Boitani, L., Eds.; University of Chicago Press: Chicago, IL, USA, 2003; pp. 289–316. [Google Scholar] [CrossRef]
  4. Chapron, G.; Kaczensky, P.; Linnell, J.D.C.; Von Arx, M.; Huber, D.; Andrén, H.; López-Bao, J.V.; Adamec, M.; Álvares, F.; Anders, O.; et al. Recovery of large carnivores in Europe’s modern human-dominated landscapes. Science 2014, 346, 1517–1519. [Google Scholar] [CrossRef] [Green Version]
  5. Pletscher, D.H.; Ream, R.R.; Boyd, D.K.; Fairchild, M.W.; Kunkel, K.E. Population dynamics of a recolonizing wolf population. J. Wildl. Manag. 1997, 61, 459–465. [Google Scholar] [CrossRef]
  6. Boitani, L. Action Plan for the Conservation of Wolves in Europe (Canis Lupus); Council of Europe: Strasbourg, France, 2000. [Google Scholar]
  7. Hayes, R.D.; Harestad, A.S. Demography of a recovering wolf population in the Yukon. Can. J. Zool. 2000, 78, 36–48. [Google Scholar] [CrossRef]
  8. Smith, D.W.; Peterson, R.O.; Houston, D.B. Yellowstone after wolves. BioScience 2003, 53, 330–340. [Google Scholar] [CrossRef]
  9. Vilà, C.; Sundqvist, A.K.; Flagstad, Ø.; Seddon, J.; Björnerfeldt, S.B.; Kojola, I.; Casulli, A.; Sand, H.; Wabakken, P.; Ellegren, H. Rescue of a severely bottlenecked wolf (Canis lupus) population by a single immigrant. Proc. R. Soc. Lond. B Biol. Sci. 2003, 270, 91–97. [Google Scholar] [CrossRef] [Green Version]
  10. Linnell, J.D.C.; Brøseth, H.; Solberg, E.J.; Brainerd, S.M. The origins of the southern Scandinavian wolf Canis lupus population: Potential for natural immigration in relation to dispersal distances, geography and Baltic ice. Wildl. Biol. 2005, 11, 383–391. [Google Scholar] [CrossRef]
  11. Reinhardt, I.; Kluth, G.; Nowak, C.; Szentiks, C.A.; Krone, O.; Ansorge, H.; Mueller, T. Military training areas facilitate the recolonization of wolves in Germany. Conserv. Lett. 2019, 12, e12635. [Google Scholar] [CrossRef]
  12. Szewczyk, M.; Nowak, S.; Niedźwiecka, N.; Hulva, P.; Špinkytė-Bačkaitienė, R.; Demjanovičová, K.; Bolfíková, B.Č.; Antal, V.; Fenchuk, V.; Figura, M.; et al. Dynamic range expansion leads to establishment of a new, genetically distinct wolf population in Central Europe. Sci. Rep. 2019, 9, 19003. [Google Scholar] [CrossRef]
  13. Kaczensky, P. Large carnivore depredation on livestock in Europe. Ursus 1999, 11, 59–71. [Google Scholar]
  14. Skogen, K. Adapting adaptive management to a cultural understanding of land use conflicts. Soc. Nat. Resour. 2003, 16, 435–450. [Google Scholar] [CrossRef]
  15. Mech, L.D. Where can wolves live and how can we live with them? Biol. Conserv. 2017, 210, 310–317. [Google Scholar] [CrossRef] [Green Version]
  16. Kouřilová, J.; Lososová, J.; Dohnalová, A. Discussion of the Issue of Wolf Expansion with an Impact on Landscape Management and Farming. Acta Univ. Bohem. Merid. 2019, 22, 1–12. [Google Scholar] [CrossRef] [Green Version]
  17. Linnell, J.; Salvatori, V.; Boitani, L. Guidelines for population level management plans for large carnivores in Europe. In A LCIE Report Prepared for the European Commission (Contract 070501/2005/424162/MAR/B2); Large Carnivore Initiative for Europe; IUCN/SSC Working Group: Rome, Italy, 2008. [Google Scholar]
  18. Frank, L.G.; Woodroffe, R. Behaviour of carnivores in exploited and controlled populations. In Carnivore Conservation; Gittleman, J.L., Funk, S.M., Macdonald, D.W., Wayne, R.K., Eds.; Cambridge University Press: Cambridge, UK, 2001; pp. 419–442. [Google Scholar]
  19. Ginsberg, J.R. Setting priorities for carnivore conservation: What makes carnivores different? In Carnivore Conservation; Gittleman, J.L., Funk, S.M., Macdonald, D.W., Wayne, R.K., Eds.; Cambridge University Press: Cambridge, UK, 2001; pp. 498–523. [Google Scholar]
  20. Ozoliņš, J.; Stepanova, A.; Žunna, A.; Bagrade, G.; Ornicāns, A. Wolf hunting in Latvia in the light of population continuity in the Baltics. In Beiträge zur Jagd-und Wildforschung; Bd., 36; Stubbe, M., Ed.; Gesellschaft für Wildtier- und Jagdforschung e.V.: Halle, Germany, 2011; pp. 93–104. [Google Scholar]
  21. Ozoliņš, J.; Männil, P.; Balčiauskas, L. Ecological, social and economic justification of wolf population management in the Baltic region. In Beiträge zur Jagd-und Wildforschung; Bd., 39; Stubbe, M., Ed.; Gesellschaft für Wildtier- und Jagdforschung e.V.: Halle, Germany, 2014; pp. 215–224. [Google Scholar]
  22. Kawata, Y. Estimation of carrying capacities of large carnivores in Latvia. Acta Zool. Litu. 2008, 18, 3–9. [Google Scholar] [CrossRef]
  23. Balčiauskas, L.; Kawata, Y. Estimation of carrying capacity and growth rate of wolf in Lithuania. Acta Zool. Litu. 2009, 19, 79–84. [Google Scholar] [CrossRef]
  24. Ozoliņš, J.; Andersone, Z.; Pupila, A. Status and management prospects of the wolf Canis lupus L. in Latvia. Balt. For. 2001, 7, 63–69. [Google Scholar]
  25. Ozoliņš, J.; Žunna, A.; Ornicāns, A.; Done, G.; Stepanova, A.; Pilāte, D.; Šuba, J.; Lūkins, M.; Howlett, S.J.; Bagrade, G. Action Plan for Grey Wolf Canis lupus Conservation and Management; LSFRI Silava: Salaspils, Latvia, 2017. [Google Scholar]
  26. Council Directive 92/43/EEC of 21 May 1992 on the Conservation of Natural Habitats and of Wild Fauna and Flora. Available online: https://eur-lex.europa.eu/legal-content/EN/TXT/?uri=CELEX:31992L0043 (accessed on 24 June 2021).
  27. Mills, L.S. Conservation of Wildlife Populations: Demography, Genetics, and Management, 2nd ed.; John Wiley & Sons, Ltd.: West Sussex, UK, 2013. [Google Scholar]
  28. Mason, N.; Ward, M.; Watson, J.E.M.; Venter, O.; Runting, R.K. Global opportunities and challenges for transboundary conservation. Nat. Ecol. Evol. 2020, 4, 694–701. [Google Scholar] [CrossRef]
  29. Central Statistical Bureau of Latvia. Latvia Statistics in Brief 2020; Central Statistical Bureau of Latvia: Riga, Latvia, 2020. [Google Scholar]
  30. State Forest Service. Population of Game Species. Available online: https://www.vmd.gov.lv/valsts-meza-dienests/statiskas-lapas/medibas/valsts-meza-dienests/statiskas-lapas/skaitli-un-fakti?id=766 (accessed on 13 June 2020).
  31. Klevezal, G.A. Age-Related Structures in Zoological Studies of Mammals; Nauka: Moscow, Russia, 1988. (In Russian) [Google Scholar]
  32. Kirkpatrick, R.L. Physiological indices in wildlife management. In Wildlife Management Techniques Manual, 4th ed.; Shemnitz, S.D., Ed.; The Wildlife Society: Washington, DC, USA, 1980; pp. 99–112. [Google Scholar]
  33. Fuller, T.K. Wolf population dynamics. In Wolves: Behavior, Ecology, and Conservation; Mech, D.L., Boitani, L., Eds.; University of Chicago Press: Chicago, IL, USA, 2003; pp. 161–191. [Google Scholar]
  34. Fry, F.E.J. Statistics of a lake trout fishery. Biometrics 1949, 5, 27–67. [Google Scholar] [CrossRef]
  35. Fry, F.E.J. Assessment of mortalities by use of the virtual population. In Proceedings of the Joint Scientific Meeting of the ICNAF (International Commission for Northwest Atlantic Fisheries), ICES (International Council for the Exploration of the Sea), and FAO (Food and Agriculture Organization of the United Nations) on Fishing Effort, the Effects of Fishing on Resources and the Selectivity of Fishing Gear, Lisbon, Portugal, 27 May–3 June 1957. [Google Scholar]
  36. Gulland, J.A. Estimation of Mortality Rates. In Annex to Arctic Fisheries Working Group Report; Document No. 3.; International Council for the Exploration of the Sea: Copenhagen, Denmark, 1965. [Google Scholar]
  37. Pope, J.G. An investigation of the accuracy of virtual population analysis using cohort analysis. ICNAF Res. Bull. 1972, 9, 65–74. [Google Scholar]
  38. MacCall, A.D. Virtual population analysis (VPA) equations for nonhomogeneous populations, and a family of approximations including improvements on Pope’s cohort analysis. Can. J. Fish. Aquat. Sci. 1986, 43, 2406–2409. [Google Scholar] [CrossRef]
  39. Skalski, J.R.; Ryding, K.E.; Millspaugh, J. Wildlife Demography: Analysis of Sex, Age, and Count Data; Elsevier Academic Press: Amsterdam, The Netherlands, 2005. [Google Scholar]
  40. R Core Team. A Language and Environment for Statistical Computing; R Foundation for Statistical Computing: Vienna, Austria, 2018; Available online: https://www.R-project.org/ (accessed on 23 April 2019).
  41. Kawata, Y.; Ozoliņš, J.; Baumanis, J. Analysis of wildlife population dynamics using a connected scatter plot: Latvian wild animals as an example. Res. Opin Anim. Vet. Sci. 2013, 3, 50–59. [Google Scholar]
  42. Ozoliņš, J.; Žunna, A.; Howlett, S.J.; Bagrade, G.; Pilāte, D.; Ornicāns, A. Pēterhofs, Population dynamics of large mammals in Latvia with an emphasis on prey-predator interactions. In Beiträge zur Jagd- und Wildforschung; Bd., 41; Stubbe, M., Ed.; Gesellschaft für Wildtier- und Jagdforschung e.V.: Halle, Germany, 2016; pp. 59–73. [Google Scholar]
  43. Andersone, Ž. Wolves in Latvia: Past and present. Wolf Print 2003, 16, 13–14. [Google Scholar]
  44. Andersone-Lilley, Ž.; Balciauskas, L.; Ozolinš, J.; Valdmann, H. Would Baltic wolves vote for the EU? Wolf Print 2005, 23, 9. [Google Scholar]
  45. Andersone, Ž.; Ozolinš, J. Public perception of large carnivores in Latvia. Ursus 2004, 15, 181–187. [Google Scholar] [CrossRef]
  46. Žunna, A.; Bagrade, G.; Ozoliņš, J. Attitudes of the General Public and Hunters Towards Wolves in Latvia; Its Predictors and Changes Over Time. Proc. Latv. Acad. Sci. B Nat. Exact Appl. Sci. 2020, 74, 280–286. [Google Scholar] [CrossRef]
  47. Ballard, W.B.; Whitman, J.S.; Gardner, C.L. Ecology of an exploited wolf population in south-central Alaska. Wildl. Monogr. 1987, 98, 1–54. [Google Scholar]
  48. Andersone, Ž. Beaver: A new prey of wolves in Latvia? In Beaver Protection, Management, and Utilization in Europe and North America; Busher, P.E., Dzięciołowski, R.M., Eds.; Springer: Boston, MA, USA, 1999; pp. 103–108. [Google Scholar] [CrossRef]
  49. Žunna, A.; Ozoliņš, J.; Pupila, A. Food habits of the wolf Canis lupus in Latvia based on stomach analyses. Est. J. Ecol. 2009, 58, 141–152. [Google Scholar] [CrossRef] [Green Version]
  50. Mech, L.D. Canis lupus. Mamm. Species 1974, 37, 1–6. [Google Scholar] [CrossRef]
  51. Kojola, I. Status and development of wolf population in Finland. In Management Plan for the Wolf Population in Finland; Ministry of Agriculture and Forestry: Helsinki, Finland, 2005; pp. 8–14. [Google Scholar]
  52. Mech, L.D.; Barber-Meyer, S.M.; Erb, J. Wolf (Canis lupus) generation time and proportion of current breeding females by age. PLoS ONE 2016, 11, e0156682. [Google Scholar] [CrossRef]
  53. Creel, S.; Rotella, J.J. Meta-analysis of relationships between human offtake, total mortality and population dynamics of gray wolves (Canis lupus). PLoS ONE 2010, 5, e12918. [Google Scholar] [CrossRef]
  54. Haber, G.C. Biological, conservation, and ethical implications of exploiting and controlling wolves. Conserv. Biol. 1996, 10, 1068–1081. [Google Scholar] [CrossRef] [Green Version]
  55. Johnson, W.E.; Eizirik, E.; Roelke-Parker, M.; Brien, S.J.O. Applications of genetic concepts and molecular methods to carnivore conservation. In Conservation Biology Series; Gittleman, J.L., Funk, S.M., Macdonald, D.W., Wayne, R.K., Eds.; Cambridge University Press: Cambridge, UK, 2001; pp. 335–358. [Google Scholar]
  56. Rutledge, L.Y.; Patterson, B.R.; Mills, K.J.; Loveless, K.M.; Murray, D.L.; White, B.N. Protection from harvesting restores the natural social structure of eastern wolf packs. Biol. Conserv. 2010, 143, 332–339. [Google Scholar] [CrossRef]
  57. Young, S. The Wolves of North America, 1st ed.; American Wildlife Institute: Washington, DC, USA, 1944. [Google Scholar]
  58. Theberge, J.; Theberge, M. Wolf Country: Eleven Years Tracking the Algonquin Wolves; McClelland & Stewart: Toronto, ON, Canada, 1998. [Google Scholar]
  59. Jędrzejewska, B.; Jędrzejewski, W. Predation in Vertebrate Communities: The Białowieża Primeval Forest as a Case Study; Springer: Berlin/Heidelberg, Germany, 1998; Volume 135. [Google Scholar]
  60. Adams, L.G.; Stephenson, R.O.; Dale, B.W.; Ahgook, R.T.; Demma, D.J. Population dynamics and harvest characteristics of wolves in the central Brooks Range, Alaska. Wildl. Monogr. 2008, 170, 1–25. [Google Scholar] [CrossRef]
  61. Brainerd, S.M.; Andrén, H.; Bangs, E.E.; Bradley, E.H.; Fontaine, J.A.; Hall, W.; Iliopoulos, Y.; Jimenez, M.D.; Jozwiak, E.A.; Liberg, O. The effects of breeder loss on wolves. J. Wildl. Manag. 2008, 72, 89–98. [Google Scholar] [CrossRef]
  62. Rick, J.A.; Moen, R.A.; Erb, J.D.; Strasburg, J.L. Population structure and gene flow in a newly harvested gray wolf (Canis lupus) population. Conserv. Genet. 2017, 18, 1091–1104. [Google Scholar] [CrossRef]
  63. Allendorf, F.W.; Ryman, N. The role of genetics in population viability analysis. In Population Viability Analysis; Beissinger, S.R., McCullough, D.R., Eds.; The University of Chicago Press: Chicago, IL, USA, 2002; pp. 50–80. [Google Scholar]
  64. Smith, D.W.; Bangs, E.E.; Oakleaf, J.K.; Mack, C.; Fontaine, J.; Boyd, D.; Jimenez, M.; Pletscher, D.H.; Niemeyer, C.C.; Meier, T.J. Survival of colonizing wolves in the northern Rocky Mountains of the United States, 1982–2004. J. Wildl. Manag. 2010, 74, 620–634. [Google Scholar] [CrossRef]
  65. Sidorovich, V.E.; Stolyarov, V.P.; Vorobei, N.N.; Ivanova, N.V.; Jędrzejewska, B. Litter size, sex ratio, and age structure of gray wolves, Canis lupus, in relation to population fluctuations in northern Belarus. Can. J. Zool. 2007, 85, 295–300. [Google Scholar] [CrossRef]
  66. Webb, N.F.; Allen, J.R.; Merrill, E.H. Demography of a harvested population of wolves (Canis lupus) in west-central Alberta, Canada. Can. J. Zool. 2011, 89, 744–752. [Google Scholar] [CrossRef]
  67. Hiraiwa-Hasegawa, M. Skewed birth sex ratios in primates: Should high-ranking mothers have daughters or sons? Trends Ecol. Evol. 1993, 8, 395–2400. [Google Scholar] [CrossRef]
  68. Jędrzejewski, W.; Branicki, W.; Veit, C.; Međugorac, I.; Pilot, M.; Bunevich, A.N.; Jędrzejewska, B.; Schmidt, K.; Theuerkauf, J.; Okarma, H. Genetic diversity and relatedness within packs in an intensely hunted population of wolves Canis lupus. Acta Theriol. 2005, 50, 3–22. [Google Scholar] [CrossRef]
  69. Pavlov, M.P. Wolf; Agropomizdat: Moscow, Russia, 1990. (In Russian) [Google Scholar]
  70. Jędrzejewska, B.; Jędrzejewski, W.; Bunevich, A.N.; Minkowski, L.; Okarma, H. Population dynamics of Wolves Canis lupus in Białowieża Primeval Forest (Poland and Belarus) in relation to hunting by humans, 1847–1993. Mamm. Rev. 1996, 26, 103–126. [Google Scholar] [CrossRef]
  71. Ozoliņš, J.; Žunna, A.; (Latvian State Foresth Research Institute Silava, Salaspils, Latvia). Personal communication, 2021.
  72. Fernández-Gil, A.; Naves, J.; Ordiz, A.; Quevedo, M.; Revilla, E.; Delibes, M. Conflict Misleads Large Carnivore Management and Conservation: Brown Bears and Wolves in Spain. PLoS ONE 2016, 11, e0151541. [Google Scholar] [CrossRef] [PubMed] [Green Version]
Figure 1. Location of the study area.
Sustainability 13 09783 g001
Figure 2. The number of culled wolves per hunting season in Latvia (SFS data [30]). Different markers and coloring signify periods of different management (see details in the text); the point of transition is marked by a triangle.
Sustainability 13 09783 g002
Figure 3. Wolf abundance estimates and number of harvested individuals in Latvia from 1999/2000 to 2019/2020. The minimum abundance (with 95% confidence intervals indicated by whiskers) was estimated according to virtual population analysis (VPA), whereas estimates by the State Forest Service [30] were used as the maximum post-harvest and pre-breeding estimates.
Sustainability 13 09783 g003
Figure 4. The proportion of juveniles (i.e., individuals younger than 1 year born before the opening of the current hunting season) among culled wolves in Latvia from 1999/2000 to 2019/2020 (whiskers and dashed line indicate 95% confidence intervals and a trend according to periodical regression of the best fit, respectively).
Sustainability 13 09783 g004
Figure 5. Mean age of wolves (±SE) in Latvia (full years) culled during the last two decades. (a) All individuals taken into account. (b) Only adult individuals (i.e., aged 2 years and older) considered.
Sustainability 13 09783 g005
Figure 6. Estimated annual culling mortality of wolves in Latvia according to sex and age (for comparison, the absolute number of harvested individuals is given as well; whiskers indicate 95% confidence intervals).
Sustainability 13 09783 g006
Figure 7. Mean annual fecundity (i.e., average litter size) and involvement in the reproduction of adult wolf females from 1998 to 2019 (data from subsequent years were pooled together to increase sample size; whiskers indicate 95% confidence intervals; see also Table A2).
Sustainability 13 09783 g007
Publisher’s Note: MDPI stays neutral with regard to jurisdictional claims in published maps and institutional affiliations.

