
Assessment of Water-Induced Soil Erosion as a Threat to Natura 2000 Protected Areas in Crete Island, Greece


1
Laboratory of Mountainous Water Management and Control, Faculty of Forestry and Natural Environment, Aristotle University of Thessaloniki, 54124 Thessaloniki, Greece
2
Independent Researcher, 54621 Thessaloniki, Greece
3
Department of Mining Engineering, Indian Institute of Engineering Science and Technology, Howrah 711103, India
*
Author to whom correspondence should be addressed.
Sustainability 2022, 14(5), 2738; https://doi.org/10.3390/su14052738
Submission received: 8 February 2022
/
Revised: 21 February 2022
/
Accepted: 22 February 2022
/
Published: 25 February 2022
(This article belongs to the Special Issue Land and Water Degradation in Catchments: The Role of Remote Sensing for Assessment and Management)
Abstract
:Water erosion is a major threat to biodiversity, according to the European Commission’s Soil Thematic Strategy, as it negatively affects soil structure, soil fertility and water availability for plants. The island of Crete (Southern Greece) has been characterized as a biodiversity hotspot including several Natura 2000 (N2K)-protected areas. The aim of this study was to model the soil loss rate in Crete regarding species richness, habitat types and their conservation status, as well as the MAES (Mapping and Assessment of Ecosystem and their Services) ecosystem types. To this end, the RUSLE soil erosion prediction model was implemented, using freely available geospatial data and cloud-computing processes. The estimated average soil loss in the study area was 6.15 t ha−1 y−1, while there was no significant difference between the terrestrial N2K (6.06 t ha−1 y−1) and non-N2K (6.19 t ha−1 y−1) areas. Notably, the natural habitats of principal importance for the conservation of biodiversity (referred to as “priority” areas), according to Annex I to Directive 92/43/EEC, are threatened by soil erosion with an estimated mean annual soil loss equal to 8.58 t ha−1 y−1. It is also notable that grasslands, heathland and shrubs and sparsely vegetated areas experienced the highest erosion rates among the identified MAES ecosystem types. The results showed that soil erosion is a serious threat to biodiversity in N2K-protected areas. Therefore, there is a need for systematic spatiotemporal monitoring and the implementation of erosion mitigation measures.
1. Introduction
Soil genesis is an extremely slow process, and thus, soil is classified as a nonrenewable natural resource. It provides goods and services and has been recognized as being vital to human well-being and ecosystem sustainability. However, in recent decades, soils have been threatened by accelerated erosion. Despite the fact that soil erosion is a natural process over geological time-scales, accelerated erosion is a major form of land degradation [1,2] with negative impacts on ecosystem services, crop production, water resources, carbon stocking, cultural heritage and biodiversity [3,4,5,6,7,8,9].
Water-induced erosion accounts for the greatest loss of soil in Europe, causing significantly more than other processes such as wind. The processes of soil loss by water involve the detachment of soil particles by raindrops and flowing water, their transportation though surface runoff and, lastly, the accumulation of eroded material in depositional areas. The main natural factors affecting the rates of soil erosion by water are precipitation [10,11,12], topography [13,14], soil texture [15,16] and land use/cover [17,18,19]. On the other hand, human activities such as intensive ploughing [20], unsuitable agricultural practices [21], overgrazing [22,23] and deforestation [24] and related land use changes significantly accelerate soil erosion rates. In the Mediterranean region, repeated wildfires events and associated landscape changes have led to a severe increase in soil loss and land degradation [25,26,27,28,29].
The importance of soil conservation is well recognized at both international and European Union levels [30,31,32]. The United Nations Sustainable Development Goals (SDGs) acknowledge the significance of soil resources for sustainable development and advocate their protection in order to meet the ambitious goal of zero land degradation by 2030 [33]. Notably, soil erosion was included among the eight soil threats listed in the Soil Thematic Strategy of the European Commission [34] and became part of the environmental agenda in the European Union (EU) in the last decade [35]. The requirements for Good Agricultural and Environmental Conditions (GAEC) introduced by the EU’s Common Agricultural Policy (CAP) promote policies and practices intended to reduce soil erosion.
The Mediterranean basin is considered a climate change and biodiversity hotspot, and is expected to face increased environmental pressure due to the climate crisis [36,37]. The maintenance of biodiversity in the entire EU is promoted by Directive 92/43/EEC, which relates to the conservation of natural habitats, as well as wild flora and fauna. This Directive established the Natura 2000 (N2K) ecological network and was intended to ensure the long-term viability of biodiversity. The successful protection and conservation of biodiversity presupposes the minimization of the foremost threats along with soil loss [38]. Accelerated soil loss due to water erosion can degrade soil quality and threaten ecosystem sustainability, with negative impacts on protected species diversity.
Soil erosion modeling is challenging and has raised concerns among the scientific community and policymakers [39,40]. In contrast with in situ measurements, erosion prediction models can be used to provide large-scale quantitative assessments of soil loss rates. This is mainly due to the fact that measurements on experimental plots are time-consuming and require significant human and technological resources, and there are limitations in terms of extrapolating the obtained results to larger scales and different areas [41,42,43,44,45]. In this context, the Plenary Assembly of the Global Soil Partnership (GSP) supports the new UN global soil erosion map being based on modeling, unlike to prior evaluations that were based on expert opinions. It is well-accepted that erosion prediction models play a primary role in erosion mitigation strategies [46,47,48]. The increasing use of geoinformatics technologies, as well as the ever-growing availability of high-resolution geospatial data, has increased the efficiency and accuracy of the output of erosion models [26,49,50,51,52], and has facilitated quantitative assessments of soil loss rates in large areas [48,53,54].
There are plenty of water erosion models with different geospatial characteristics and levels of complexity [55]. These models use mathematical expressions to describe the relationship between various factors (climate, vegetation, soil type, topography, etc.) and the erosion process [56]. They range from simple empirical to more complicated physical and conceptual models. This categorization is based on their complexity, input data requirements, simulation process and the algorithms they use [57,58]. Empirical models are based on statistical analyses of field measurements and require the least data. Physical-based models are founded on the fundamental process of mass and energy conservation, as well as an understanding of the mechanisms involved in these phenomena. Finally, conceptual hybrid models may be placed between empirical and physical-based models. Empirical models have been extensively applied, particularly in data-scarce environments, due to their simplicity, the limited requirements to input data and their reduced computational cost [59].
The most widely used model is the Universal Soil Loss Equation (USLE) [60] and its revised version, (R)USLE [61]. The main advantages of these models are their transferability to different environments due to the availability of the required data and their extensive literature documentation [62]. Hence, these models can be applied to any region despite the significant diversity of their factors [63]. The results obtained using the RUSLE model have been validated in Mediterranean conditions, where it was found that they accurately represented soil loss rates [64,65,66].
To the best of the author’s knowledge, there are limited studies assessing water-induced soil erosion in N2K-protected areas [67]. It has to be noted that even these studies simply present the soil loss rate in different habitats type.
This study aims to evaluate soil loss by water erosion as a threat to the N2K network’s protected areas in a typical semi-arid Mediterranean island (Crete, Greece). The investigation focused on terrestrial Sites of Community Interest (SCIs). Subsequently, soil erosion rate was assessed regarding the habitat types, their conservation priorities, the species richness and the MAES ecosystem types. To this end, the RUSLE model was applied using satellite imageries, cloud-computing platforms and reanalysis precipitation datasets.
2. Materials and Methods
2.1. Study Area
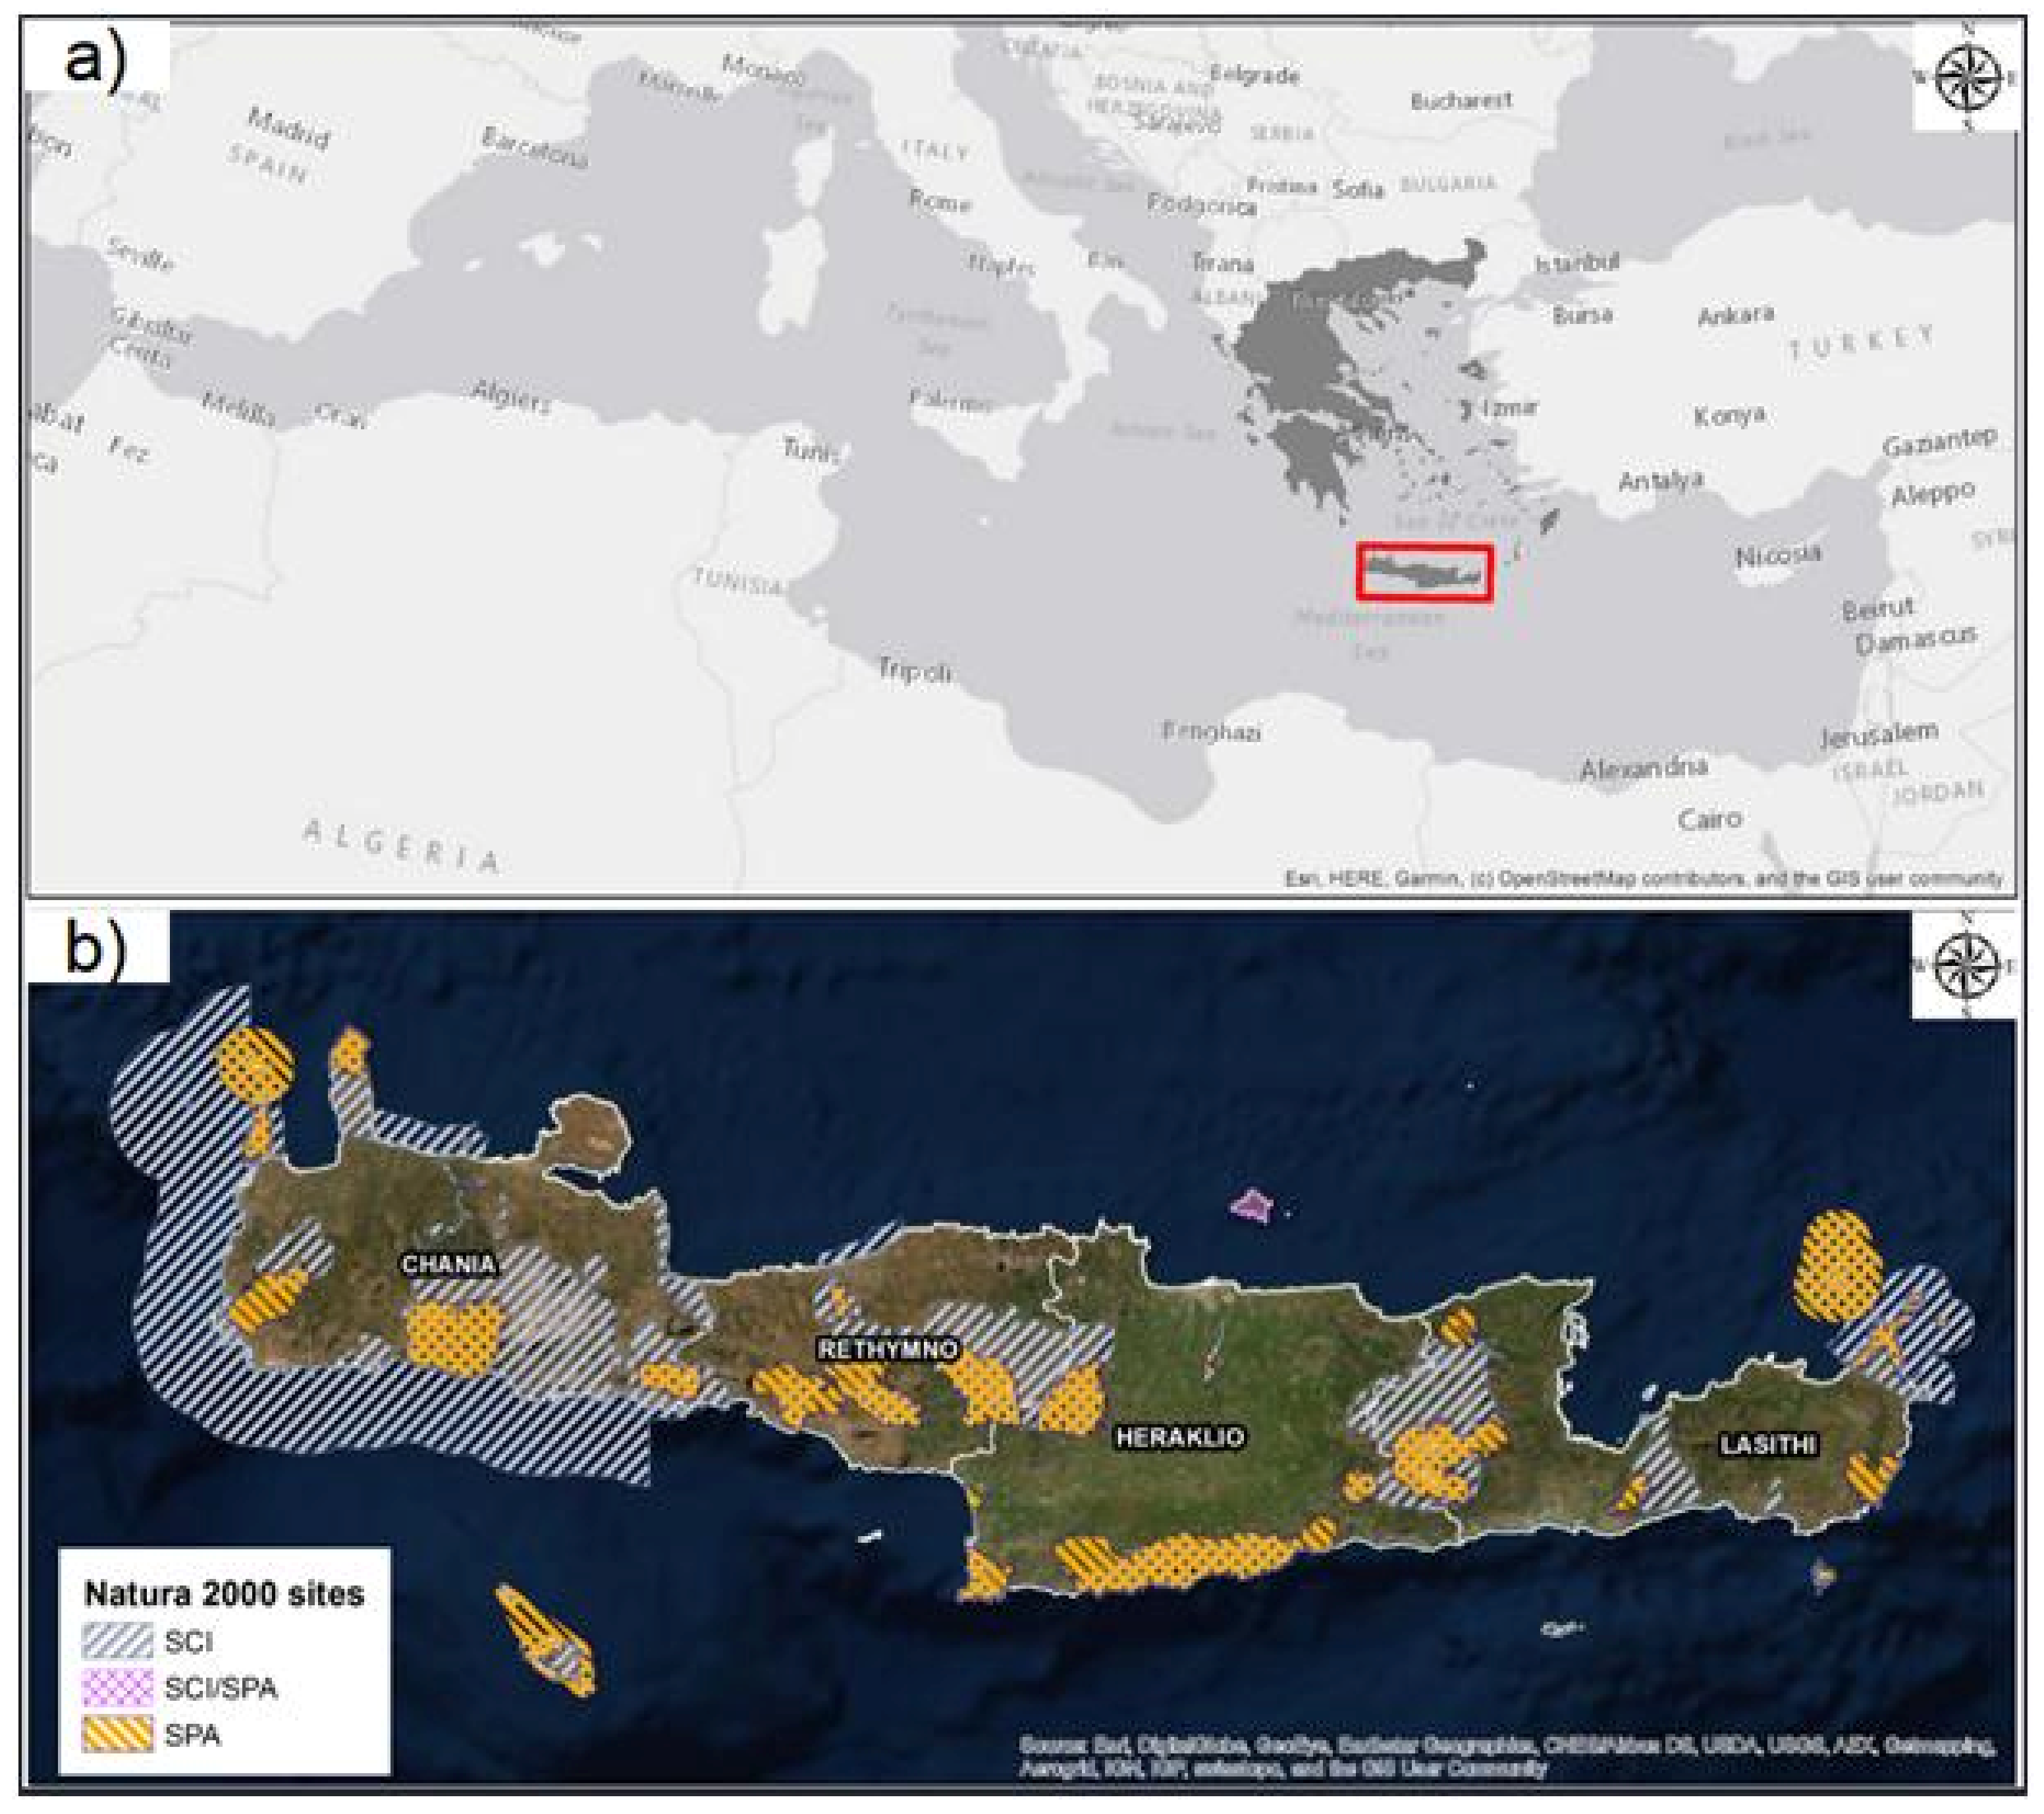
The study was conducted in Crete Island (Southern Greece), located between the Aegean and the Libyan Sea and has an area of 8.336 km2 and a coastline of 1.046 km. It is the larger and most populous of the Greek islands, the fifth-largest island in the Mediterranean Sea, and the richest island hotspot of Europe in terms of endemic plant species [68] with 2240 native plant species, 183 of which are single island epidemic (SIE) [69]. On the island, 53 Natura 2000 sites have been designated, of which 25 have been characterized as Special Protection Areas (SPAs) and 27 as Sites of Community Importance (SCIs) (Figure 1).
Administratively, it is divided into four prefectures from west to east: Chania, Rethymno, Heraklio and Lasithi. The most densely populated areas are nearby the northern coastal zone, where the homonymous capitals of the aforementioned prefectures are located. The island is mostly mountainous with a mean elevation of 482 m above sea level (a.s.l) and a highest peak of 2.456 m a.s.l. (Psiloritis Mountain). It presents complex terrain with sharp topography and interchanges between mountains and lowlands.
The position of the island between the Mediterranean and North Africa and its geomorphological characteristics has influenced its climate. The climate is characterized as Mediterranean dry sub-humid, with dry and warm summers and slightly cold and humid winters. Precipitation and temperature present great spatial and temporal variation. The mean annual precipitation is about 750 mm and ranges from 440 mm in the east to 2188 mm in west, while the average temperature ranges from 10 °C in winter to 30 °C in summer [70]. It is also reported that rainfall in western Crete’s mountains is eight times higher than in the island’s coastal parts [71]. The orographic precipitation effects tend to increase extreme events and favor the occurrence of hydro-meteorological disasters in winter. [72,73]. Additionally, it is notable that 95% of the precipitation falls between October and May [74].
From a geological perspective, the island is composed of pre-Alpine and Alpine carbonate rocks and Neogene and Quaternary (alluvial) sediments. The predominant geological formations include limestones, dolomites and marbles, while phyllites flysch and alluvial deposits also exist to a smaller extent [50,75].
In terms of vegetation, Crete is mainly covered by sclerophyllous shrublands and natural grasslands. Permanent crops cover a significant part of the island, with olive grove being the most extensive crop follow by vineyard and fruit plantation. Heterogeneous agricultural areas mixed with natural vegetation are also detected with reasonable cover [76].
2.2. Data
In order to accomplish the goals of the current research, several spatial datasets were collected and analyzed. These datasets contained satellite imagery, topographical and soil data, rainfall data, support conservation practices, Natura 2000 (N2K)-protected areas and species distributions.
In particular, cloud-free Sentinel-2 Level 2A optical data for the summer period of 2020 (from 1 June 2020 to 31 August 2020) were accessed on Google Earth Engine (GEE) provided by the European Space Agency (ESA). The Sentinel-2 multispectral instrument (MSI) provide 13 spectral bands ranging from the Visible (VNIR) and Near Infra-Red (NIR) to the Short Wave Infra-Red (SWIR) with spatial resolution up to 10 m and a revisit time of 5 days. Level-2A data are bottom-of-atmosphere (BOA) reflectance ortho-image products. A time series of daily rainfall data for the period 1991–2020 was obtained from the ERA5-Land, the last reanalysis produced by European Centre for Medium-Range Weather Forecasts (ECMWF) through Google Earth Engine (GEE). The spatial resolution of the ERA5-Land is 0.1° × 0.1° (~9 km). The Advanced Land Observing Satellite (ALOS) (AW3D30 v.2.2) DEM developed by the Japan Aerospace Exploration Agency (JAXA), with spatial resolution of 30 m, was exploited to represent the topographical characteristics of study area. Soil data (parent material) were derived from the national Soil Map provided by the Greek Ministry of the Environment and Energy. The support practice factor of the RUSLE model has been estimated for the EU and detailed described in a recent publication [77], while the associate dataset is available from the European Soil Data Centre [78]. The mapped terrestrial habitat types of the SCIs N2K protected area was derived from the Greek Ministry of the Environment and Energy and the species distribution, as reported under the Article 17 of the Directive 92/43/EEC, from the European Environment Information and Observation Network (EIONET) repository. A summary of the data described above is illustrated in the following table (Table 1).
2.3. RUSLE Model Description
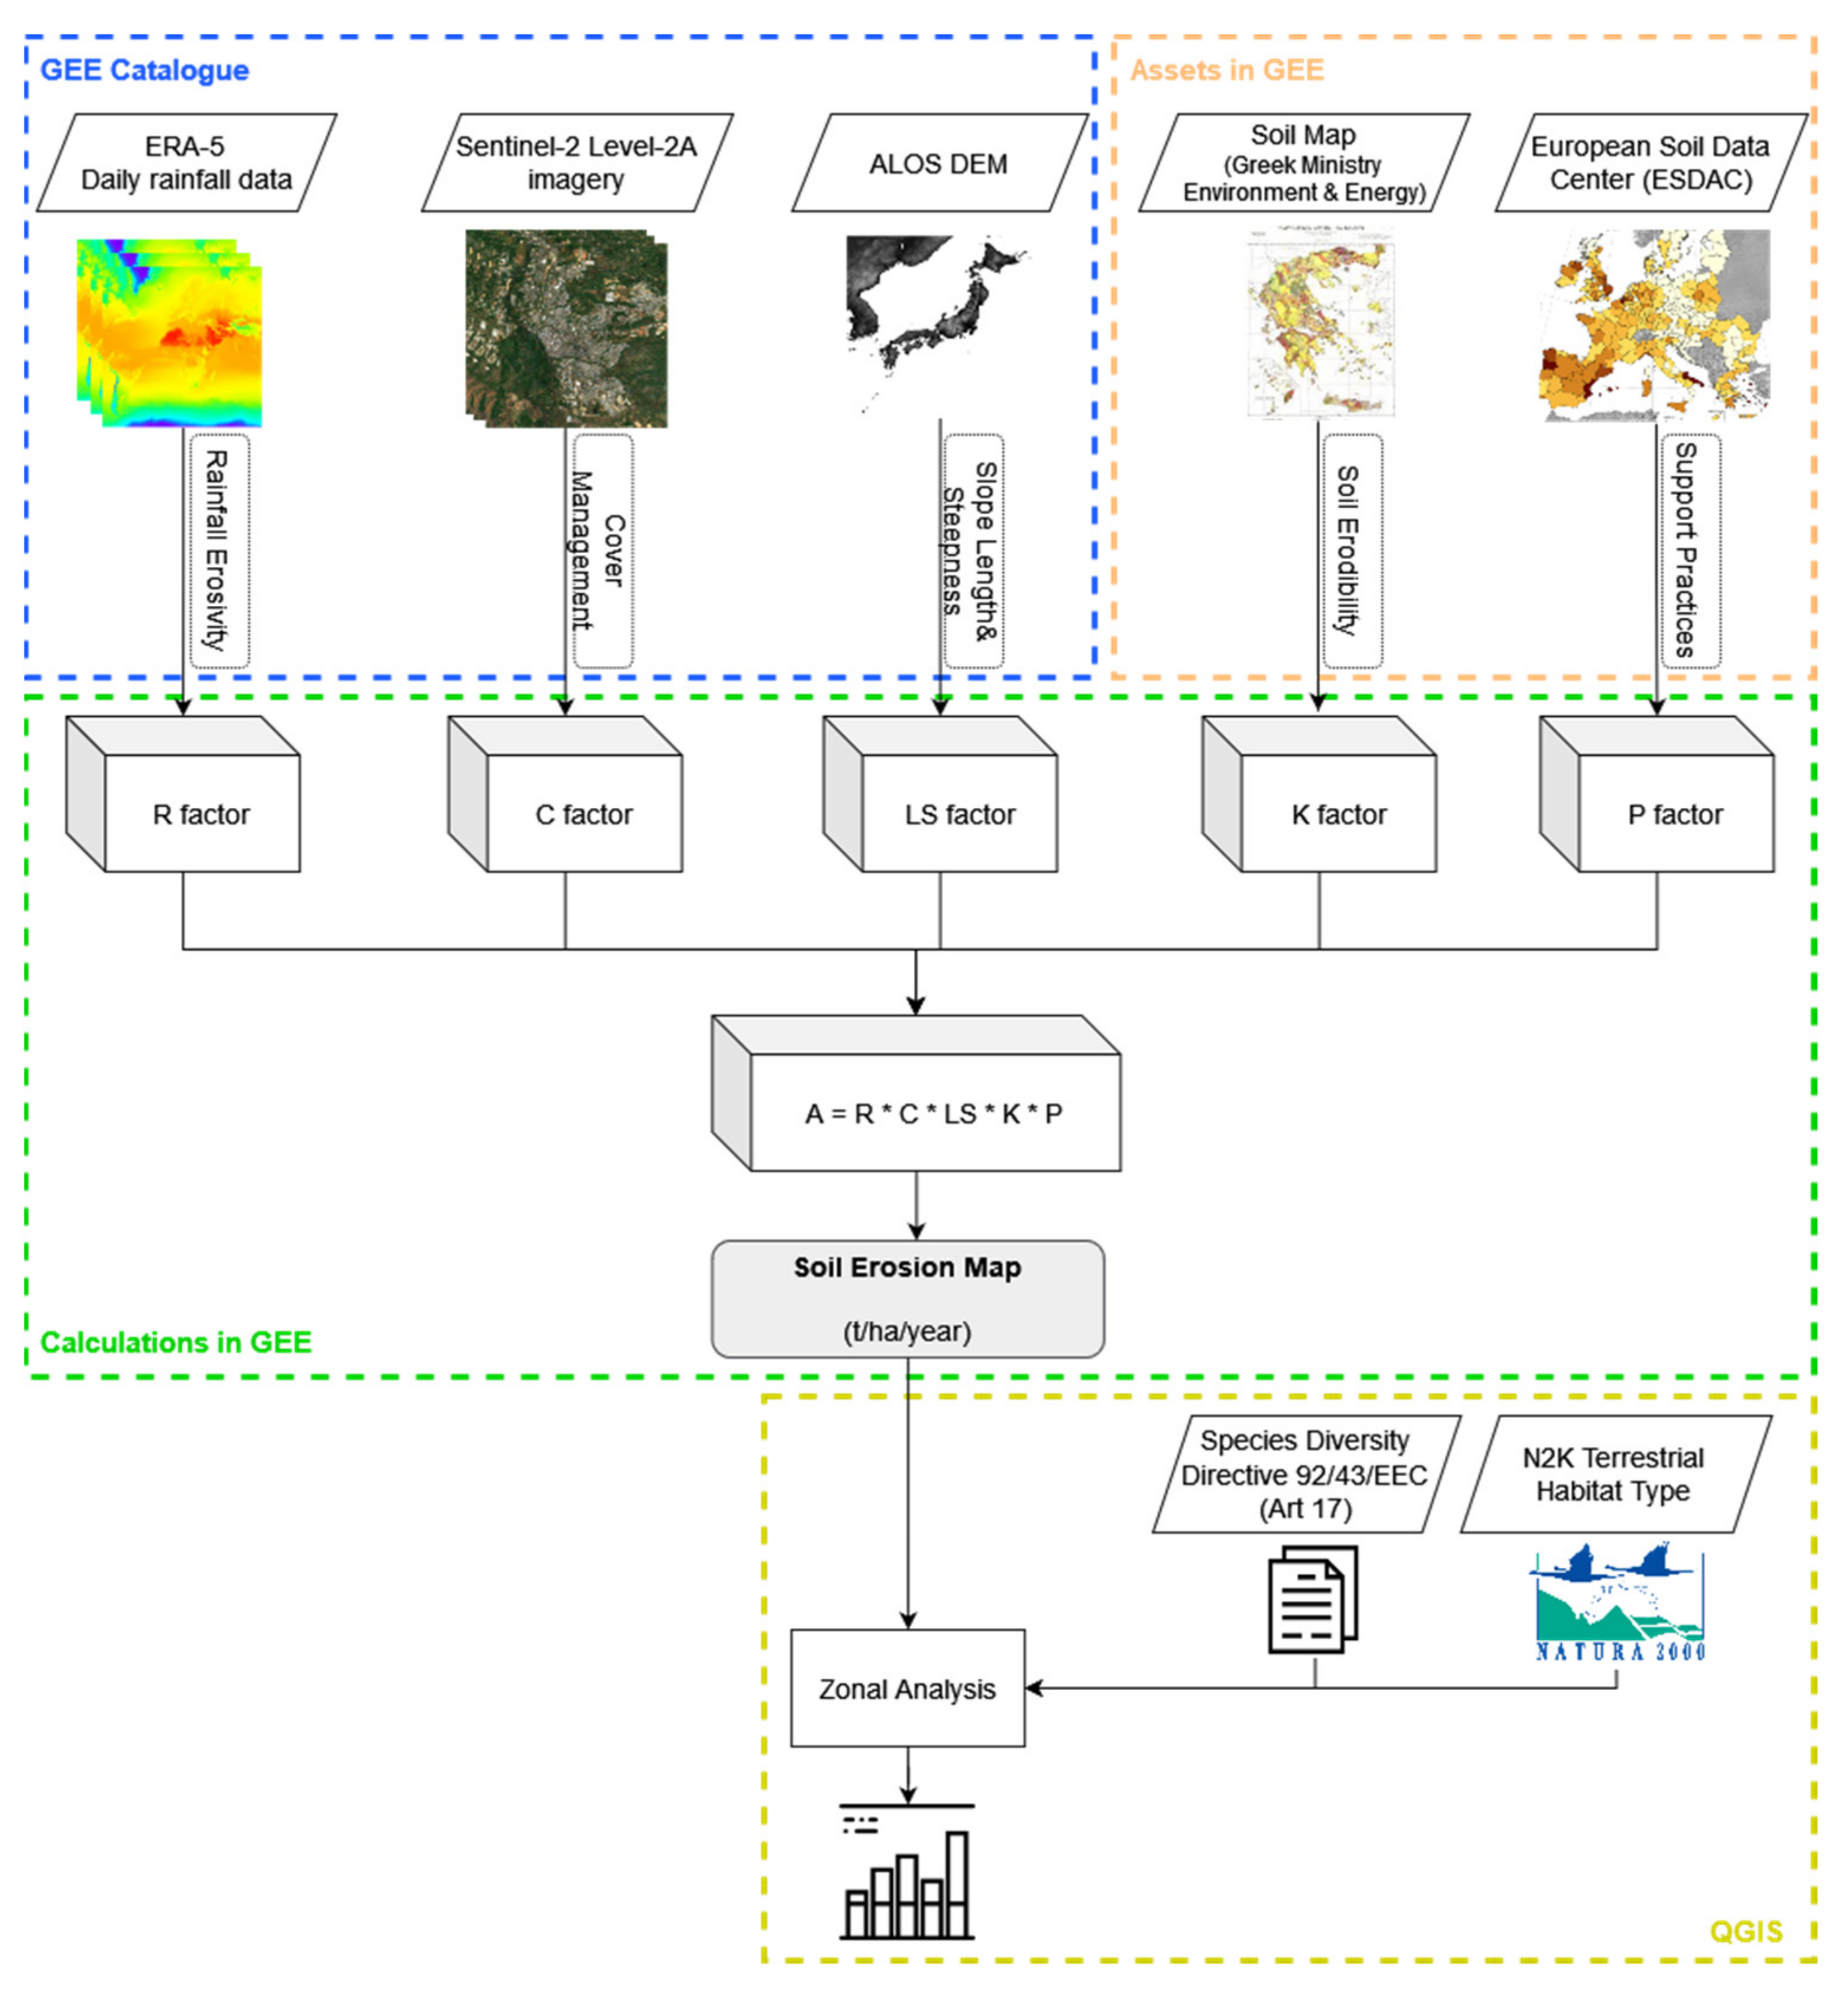
The revised (R) Universal Soil Loss Equations, called RUSLE, is an empirical model that computes mean annual soil loss by sheet and rill water erosion. The mathematical description of the model expressed as a linear combination of five factors [60]:
where A is the soil loss (t ha−1 y−1), R is the rainfall erosivity factor (MJ mm ha h−1 y−1), K is the soil erodibility factor (t ha h ha−1 MJ−1 mm−1), LS is the topographic factor (dimensionless) derived from slope length (L) and slope steepness (S), C is the cover management factor (dimensionless) and P is the support practice factor (dimensionless).
The rainfall erosivity factor (R) is the model’s climate component, accounting for the effect of rainfall amount and intensity on soil loss. It is defined as the ability of rain to induce erosion and given by the average annual sum of the kinetic energy of storm events with, maximum, 30-min rainfall intensity. Unfortunately, sub-hourly rainfall rate records from ground-based meteorological stations are rarely available in the Greek territory. Therefore, simplified mathematical equations have been developed in order to estimate rainfall erosivity based on daily or monthly rainfall data derived from gridded satellite and reanalysis products [79,80,81]. The higher the rainfall intensity, the greater the magnitude of soil loss.
The soil erodibility factor (K) reflects the susceptibility of soil types to detachment and transport by the rainfall–runoff process. It depends on physical and chemical soil properties such as soil texture (contents of silt, sand, clay and organic carbon), permeability, shear strength, organic matter and chemical composition [16]. The K factor is rated on a scale from 0 to 1, where lower values indicate soils less prone to erosion.
The combination of slope length (L) and slope steepness (S) individual factors describe the effect of topography on the erosion process. The slope length is the distance from the origin of overland flow along its flow path to the location of either concentrated flow or deposition, while slope steepness is the segment or site gradient slope, expressed as a percentage. The LS-factor has the greatest influence on soil loss at the European scale as reported by Panagos [13]. Increases in LS-factor values lead to higher flow velocity and, consequently, higher erosion rate. It can be estimated using as input dataset a digital elevation model (DEM) and processing in a GIS environment, based on well-known mathematical formulas [82].
The cover management (C) factor is used to reflect the effect of cropping and management practices on erosion rates. It is defined as the ratio of soil loss from a certain area with specific vegetation coverage to a constantly barren region. The C-factor ranges between 0 and 1, while the lowest values indicate the well-protected land. During the last decades, the ever-growing use of remote sensing led to the development of several empirical formulas so as to relate spectral vegetation indices to the factor estimation [83].
The support practice (P) factor defines the effect of different conservation practices, such as contour farming, stone walls, terracing and grass margins over a specific site, on the mitigation of soil erosion. These practices change the direction and the erosive power of the surface runoff, thus reducing the potential soil loss. The values of the P-factor range from 0 to 1. The lower the P-factor value, the more successful the support practice, whereas the value of 1 indicates the lack of conservation practice. It is noteworthy that studies carried out at European level include Greece among the countries where support practices have the greatest impact [77].
2.4. Methodology Outline
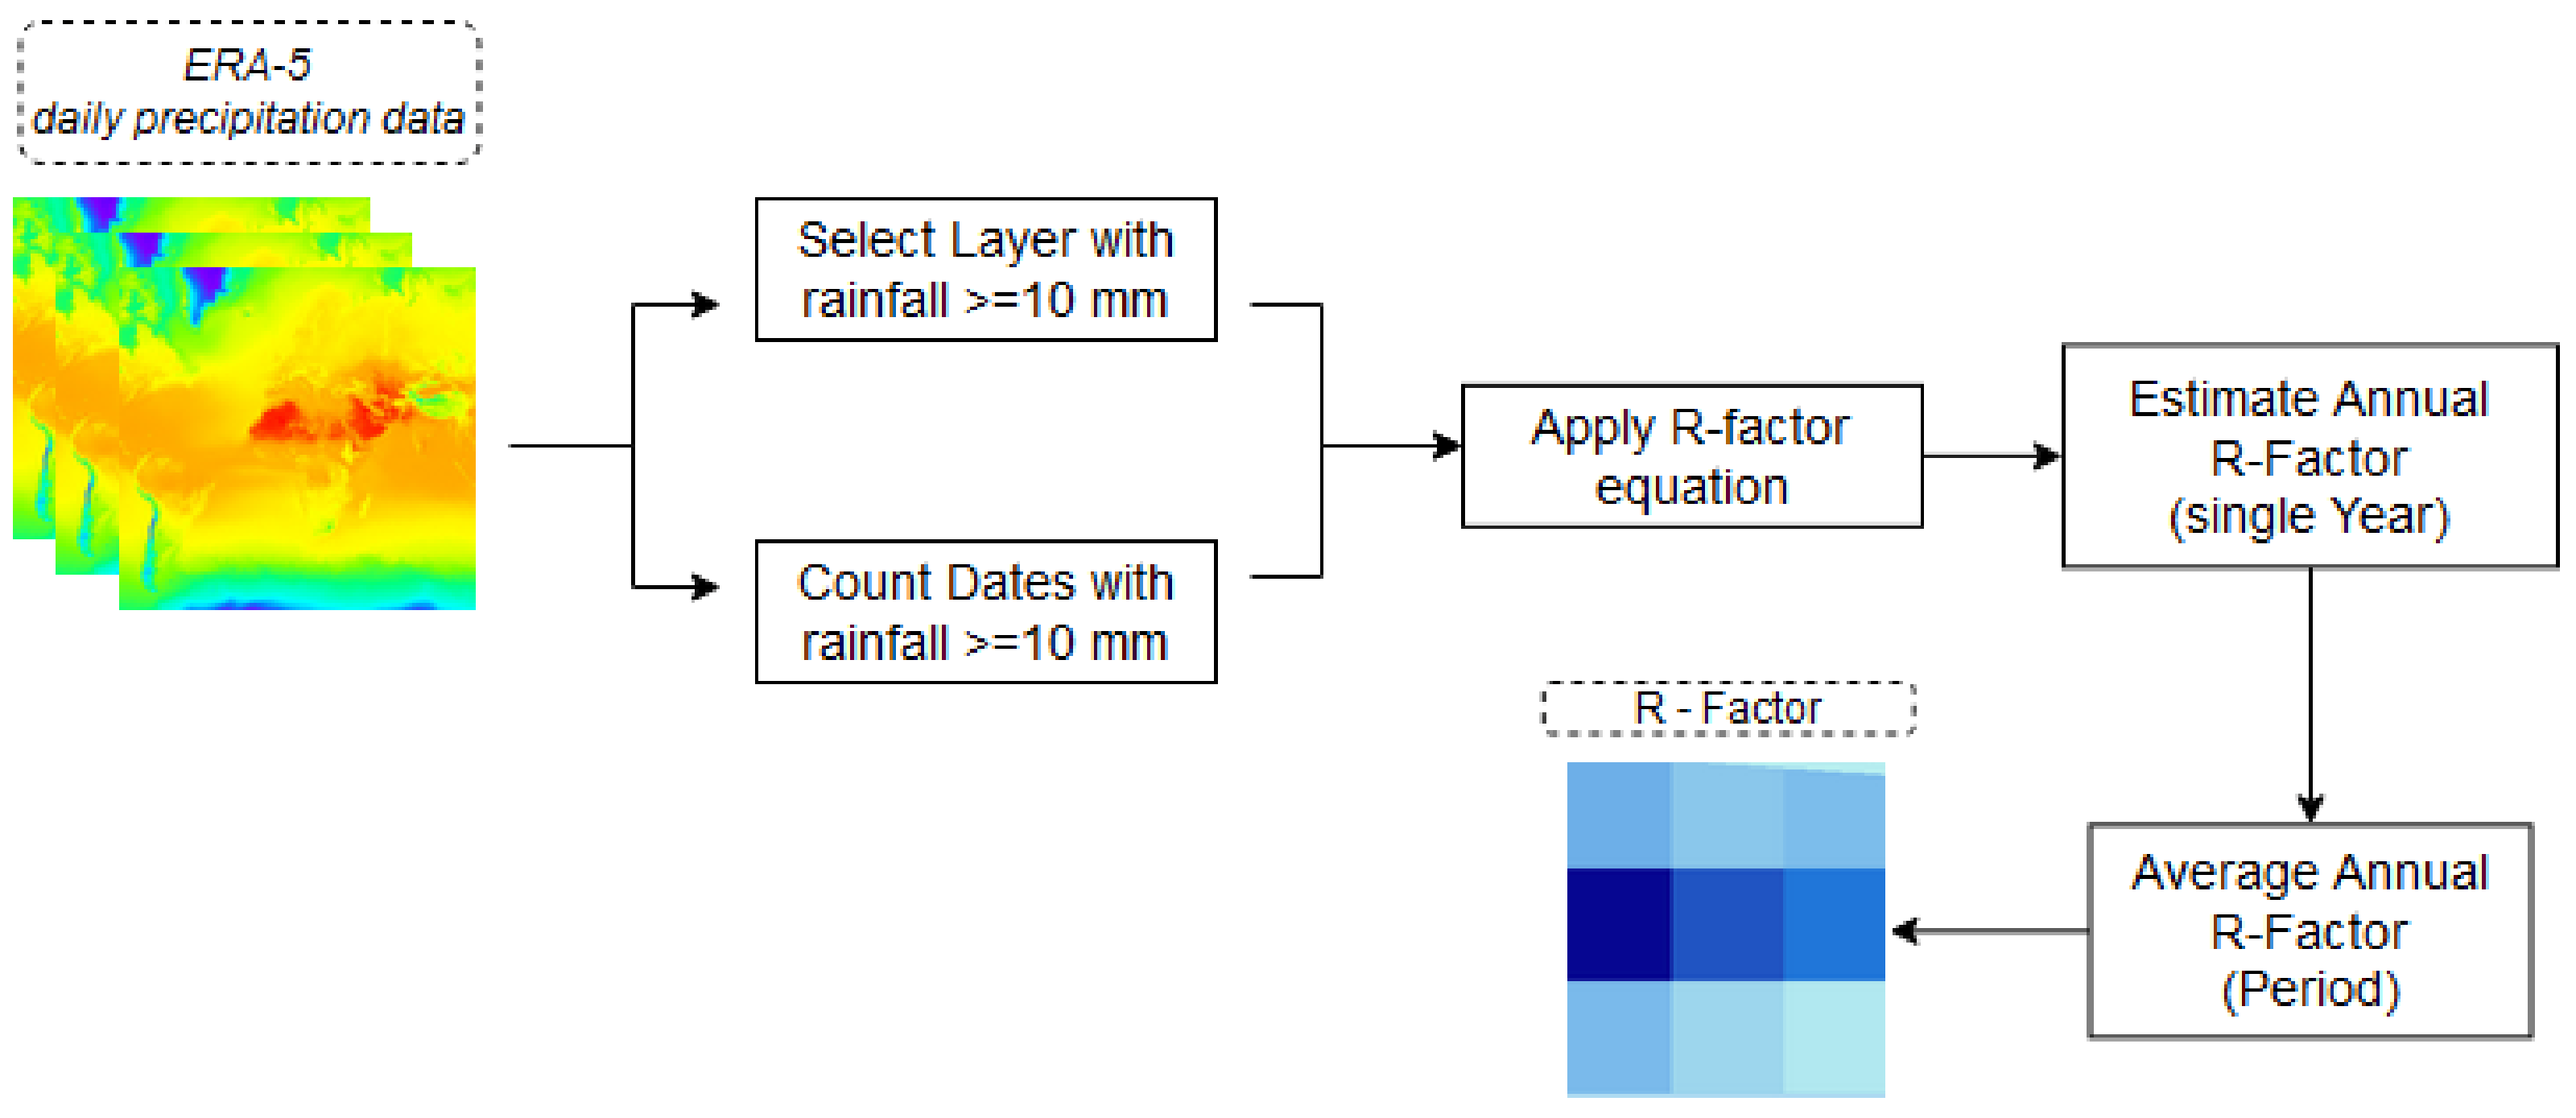
The implementation of the RUSLE model was performed with the combined use of freely available geospatial data and cloud-computing processing. The R-factor was estimated based on a simplified linear regression model originally developed in Portugal [84] and calibrated for the island of Crete’s condition [85]. This approach uses daily rainfall data to estimate monthly rainfall erosivity. The required daily rainfall datasets were retrieved from ERA-5 land datasets via GEE. Therefore, the average annual rainfall is estimated using the following formula:
where N is the number of years covered by rainfall data; R10 is the total rainfall (mm) within a month, only for the days with rainfall greater than 10 mm (otherwise set to zero); and D10 is the number of days that recorded rainfall greater that 10 mm. The annual R-factor is computed for each 30-year time period (1991–2020), and then produces the total average annual R-factor for the examined period. The methodology for the R-factor estimation was applied in GEE environment and is briefly presented in the following figure (Figure 2).
Due to the fact that estimating K-factor by field measurements is a time-consuming and costly process, an empirical approach has been adopted. This approach is based on the parent material of soil from a national-scale soil map. According to the relevant literature [86,87,88] an appropriate value was assigned to each parent material regarding their erodibility, as presented in the following table [Table 2].
The spatial distribution of the soil parent material was extracted from a national scale vector map. The vector data combined with the assigned values were converted to raster using GDAL rasterize tool in QGIS software.
The estimation of the LS-factor was based on DEM, where the ALOS DEM by JAXA with a spatial resolution of 30 m was selected. This choice also emerged from the literature review, as it was found to be more accurate both in Greece [89,90] and the Mediterranean Basin [91,92] in comparison with other freely available DEMs with similar resolution.
The mathematical equation provided by McCool et al. [93] was applied in order to calculate the S-factor based on the slope gradient) in degrees:
Additionally, the L-factor was calculated using the proposed equation of by Desmet and Govers [94], as it was found reliable in areas with complex terrain [82]. The formula of this approach is given below:
where Ai,j–in is the contributing area (m2) at the inlet of grid pixel (i,j), D is the grid pixel size (m), xi,j is the summation of the sine and cosine of aspect direction (αi,j) of grid pixel (xi,j = sin αi,j + cos αi,j) and m is a coefficient related to the ratio β of the rill to inter-rill erosion. The m values range between 0 and 1, and ϑ is the angle of slope in degrees. Τhe equation for the m coefficient is:
The above-mentioned procedure was implement using the System for Automated Geoscientific Analyses (SAGA) GIS software package which incorporates the multiple flow algorithm [95].
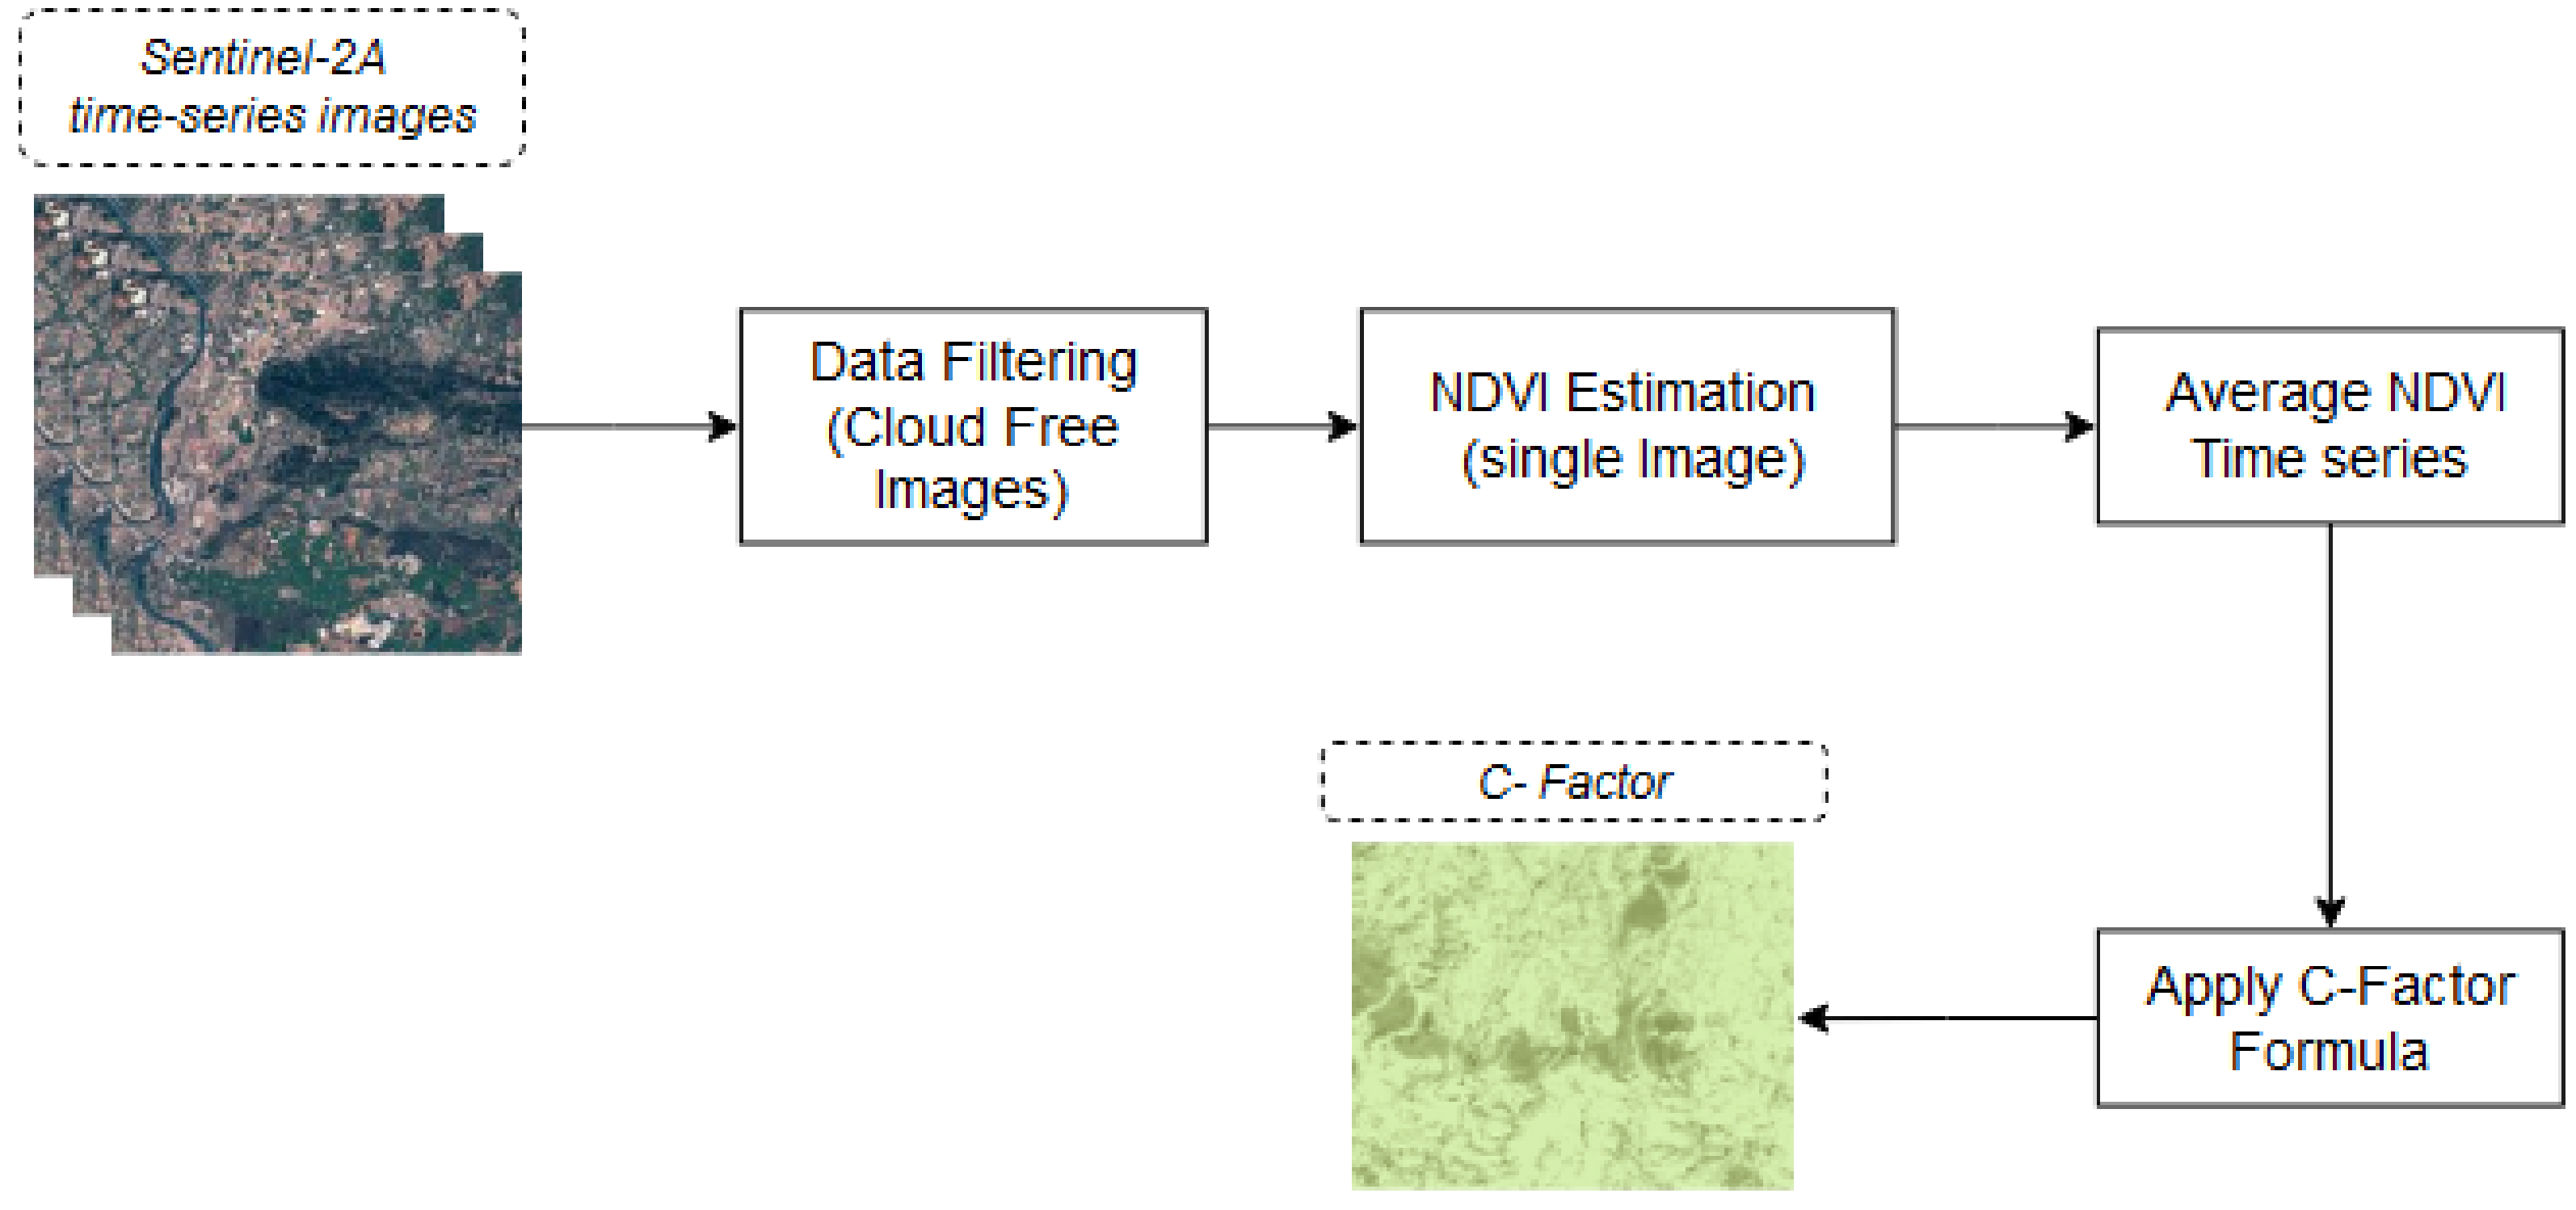
The estimation of the C-factor can be accomplished by using vegetation indices derived from satellite imageries. Among the most popular indices used during the last decades is the normalized difference vegetation index (NDVI). This index was found to better detect the land cover in the study area in comparison with other indices [96]. The NDVI was calculated using the following mathematical formula:
where NIR and Red are the near-infrared and red spectrum of a multispectral satellite image, respectively.
The C-factor calculation was implemented using an average NDVI index of Sentinel-2A images obtained in the summer period of 2020 using the following equation [97]:
where a and b are unitless parameters and equal to 2 and 1, respectively, and specify the relationship between C and NDVI.
Many studies report the effect of seasonality in C-factor estimations due to the temporal changes of vegetation phenology [50,98]. Nevertheless, in the current approach, the images from the summer period were selected, as many cloud-free images are available compare to the other seasons, and also the effect of precipitation on surface reflectance and NDVI values are low. Additionally, as already mentioned, the main LULCs in the Crete Island are permanent (sclerophyllous shrublands, natural grasslands, olive groove), so their canopy characteristics remain stable through the year.
The entire process for the C-factor estimation was applied in the GEE platform. All the Sentinel 2A images, covering the period between 1 June 2020 and 31 August 2020, (approximately revisit time 5 days) were collected though the GEE data catalog. Afterwards, the cloud-free images were selected, and the overall mosaic was created. In cases of overlapping images, the mean value of NDVI was considered. Then, the C-Factor was estimated using the above-mentioned equation (Equation (8) and the associate spatial distribution map was produced. A brief description of the methodology applied in GEE for the estimation of the C-factor can be seen in Figure 3. Additionally, the P-factor was directly derived in raster format from the ESDAC dataset [78].
Finally, the threat of soil loss to species richness and natural habitat types was performed using zonal statistics. The overall outline of the methodology presented in the following figure (Figure 4).
3. Results
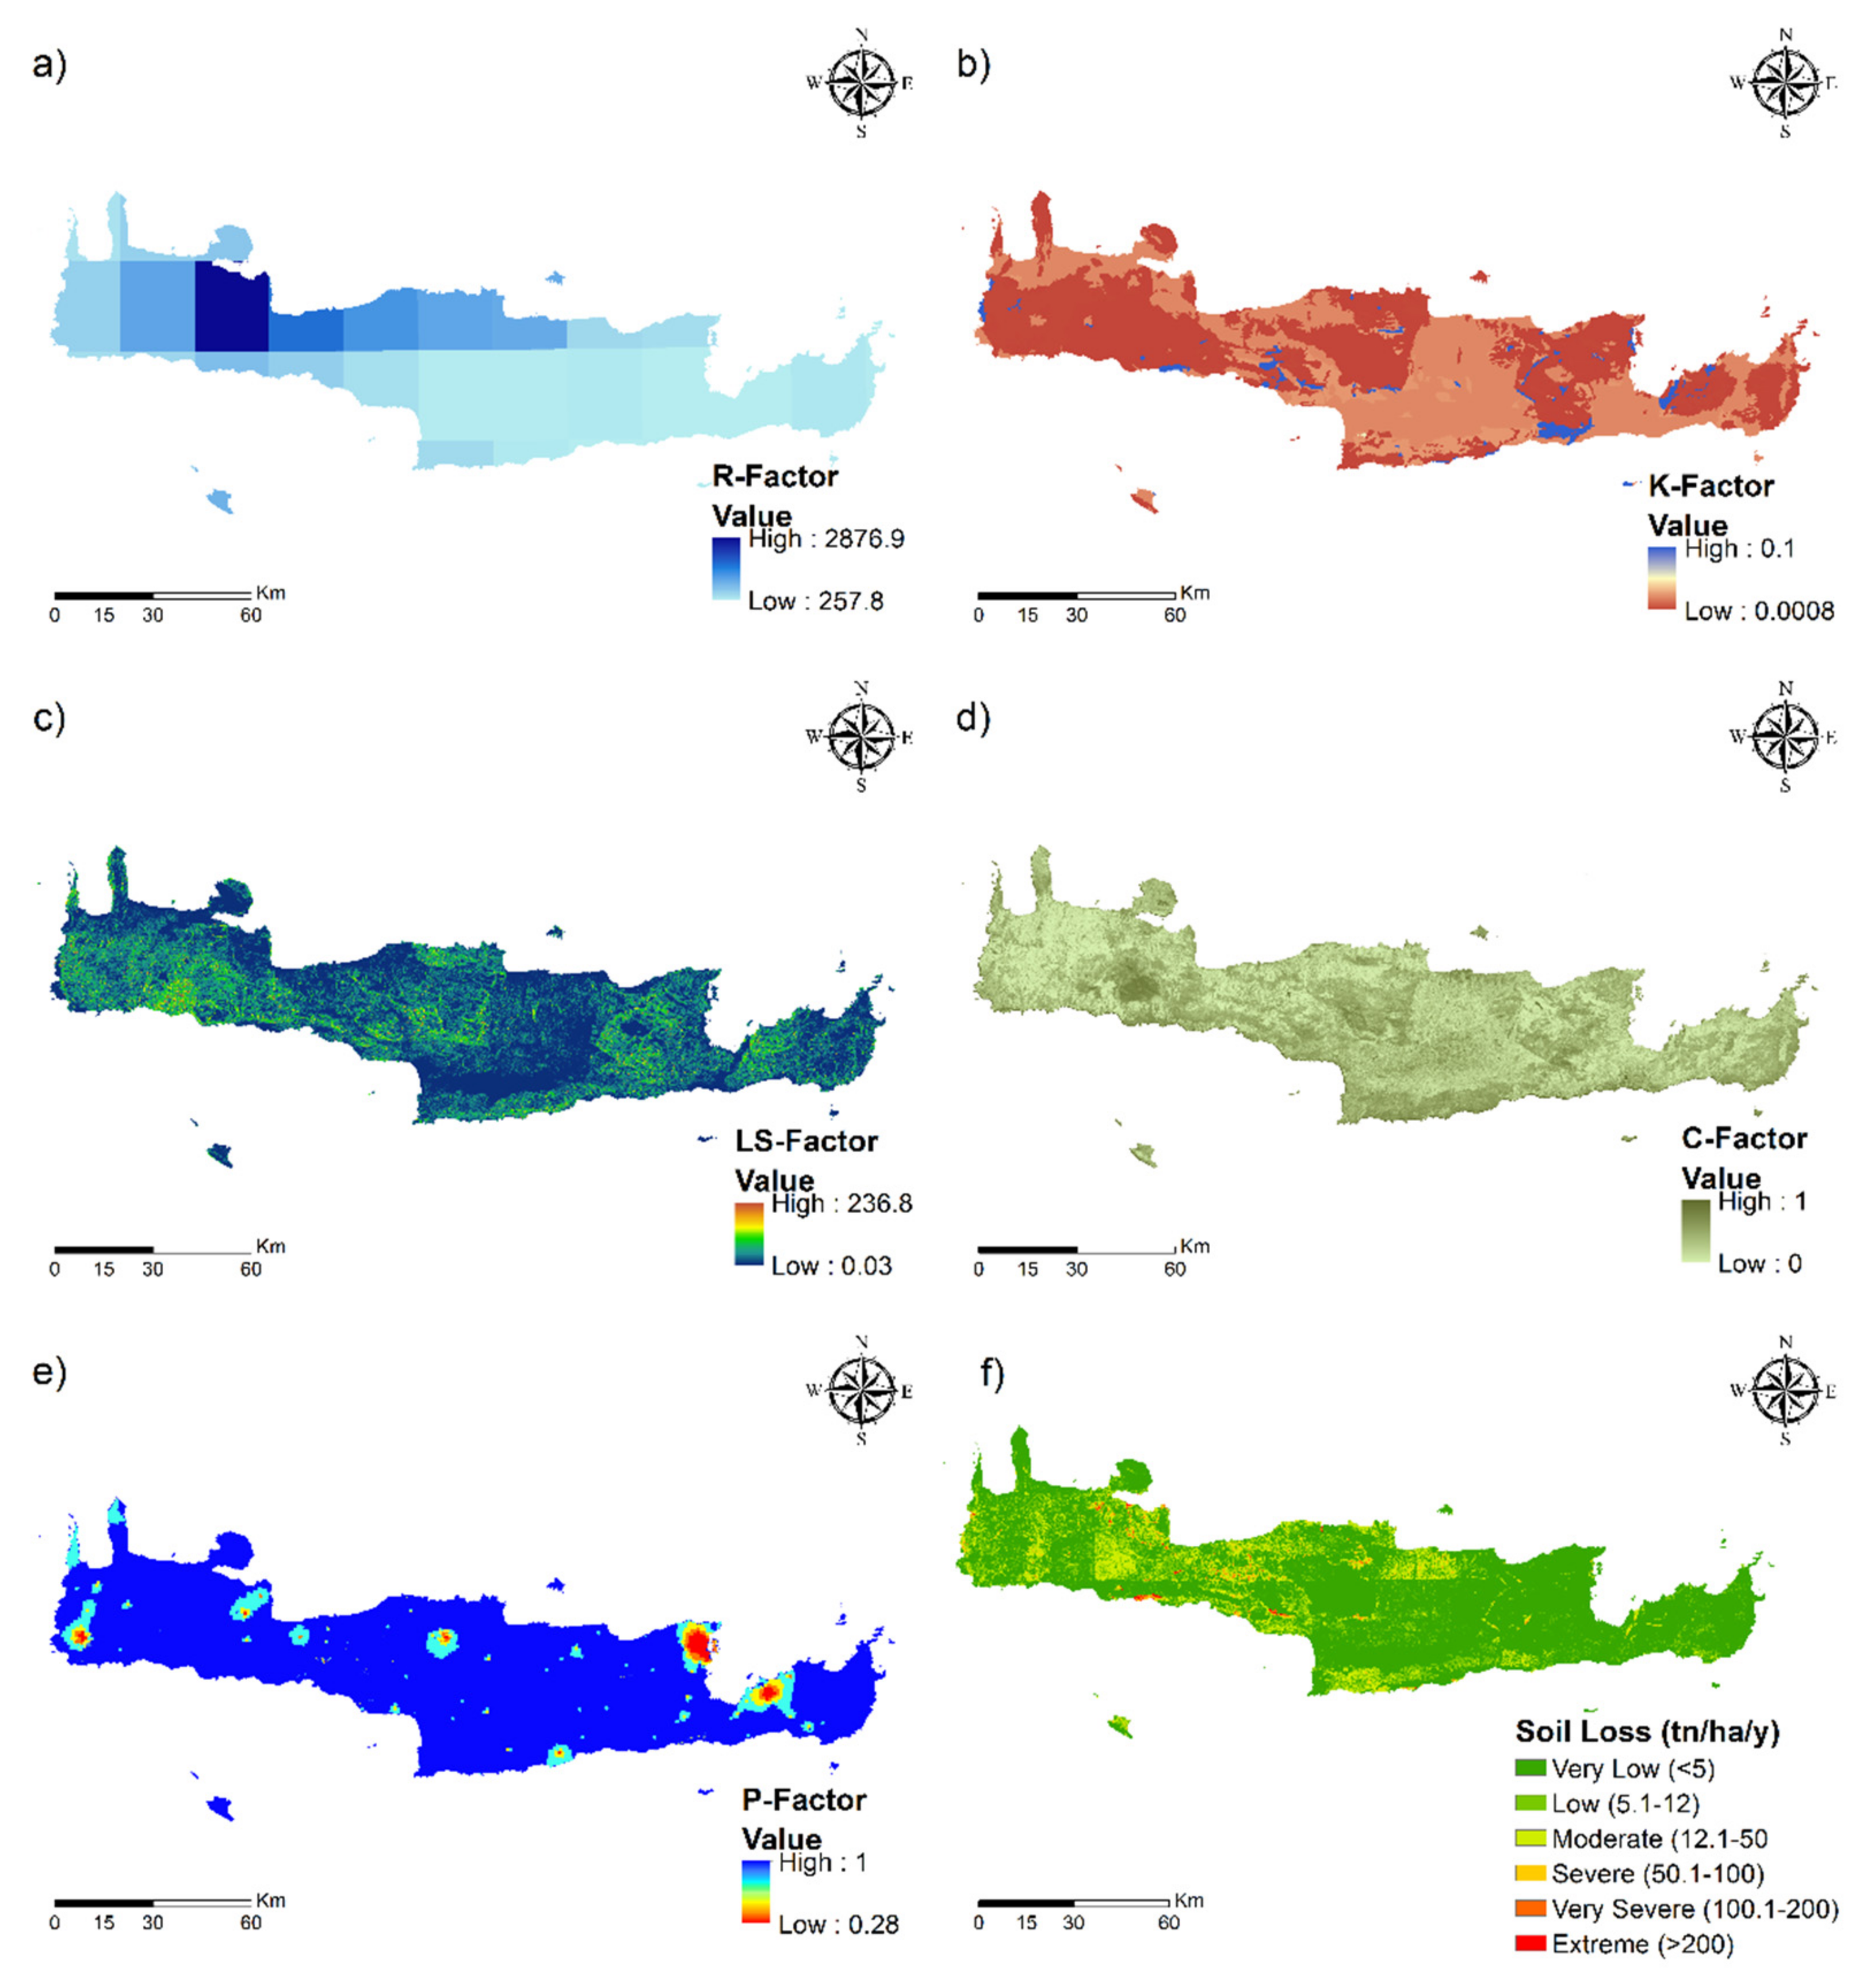
The rainfall’s erosivity presents great variability in the study area. It ranged from 257.8 to 2876.9 MJ mm ha h−1 y−1 with a mean value of 1337.7 MJ mm ha h−1 y−1. The spatial distribution of the R-factor shows a clear distinction between the western (higher values) and eastern parts of the island (Figure 5a). On the other hand, the eastern part of Crete includes soils more susceptible to erosion. The K-factor values ranged from 0.0008 to 0.1 t ha h ha−1 MJ−1 mm−1 with a mean value equal to 0.01 t ha h ha−1 MJ−1 mm−1 (Figure 5b). In terms of topography, it was found that the values of the LS-factor ranged from 0.03 to 238.8, with a mean value of 5.9. The values of the LS-factor were higher, as expected, over the mountainous ranges of the island (Figure 5c). The cover management (C) values ranged from 0 to 1 with a mean value of 0.37. In particular, the mean C-factor values for the main land cover classes defined by the CORINE: CORINE Land Cover 2018 (CLC 2018) database in the study area presented in the following table (Table 3). The spatial distribution of the C-factor can be seen in the Figure 5d.
Additionally, there are no extensive support (conservation) practices in the study area, as revealed from the European dataset used herein, with limited exceptions. The mean P value is equal to 0.96 and ranges from 0.28 to 1 (see Figure 5e).
The computation of the potential mean annual soil loss and the creation of the associated map were derived by multiplying the above-mentioned factors. The mean annual soil loss in Crete Island was found to be equal to 6.15 t ha−1 y−1. The higher values, regarding the CLC 2018 level 2 categories, were found in pastures (12.14 t ha−1 y−1) and open space with little or no vegetation (10.52 t ha−1 y−1), while higher erosion values estimated with RUSLE than the area’s mean average were also present in heterogeneous agricultural areas (7.11 t ha−1 y−1) and shrubland and herbaceous vegetation (6.32 t ha−1 y−1). On the contrary, lower values of soil loss than the area’s average mean were found in permanent crops (4.81 t ha−1 y−1), forests (4.65 t ha−1 y−1) and, lastly, arable lands (3.50 t ha−1 y−1).
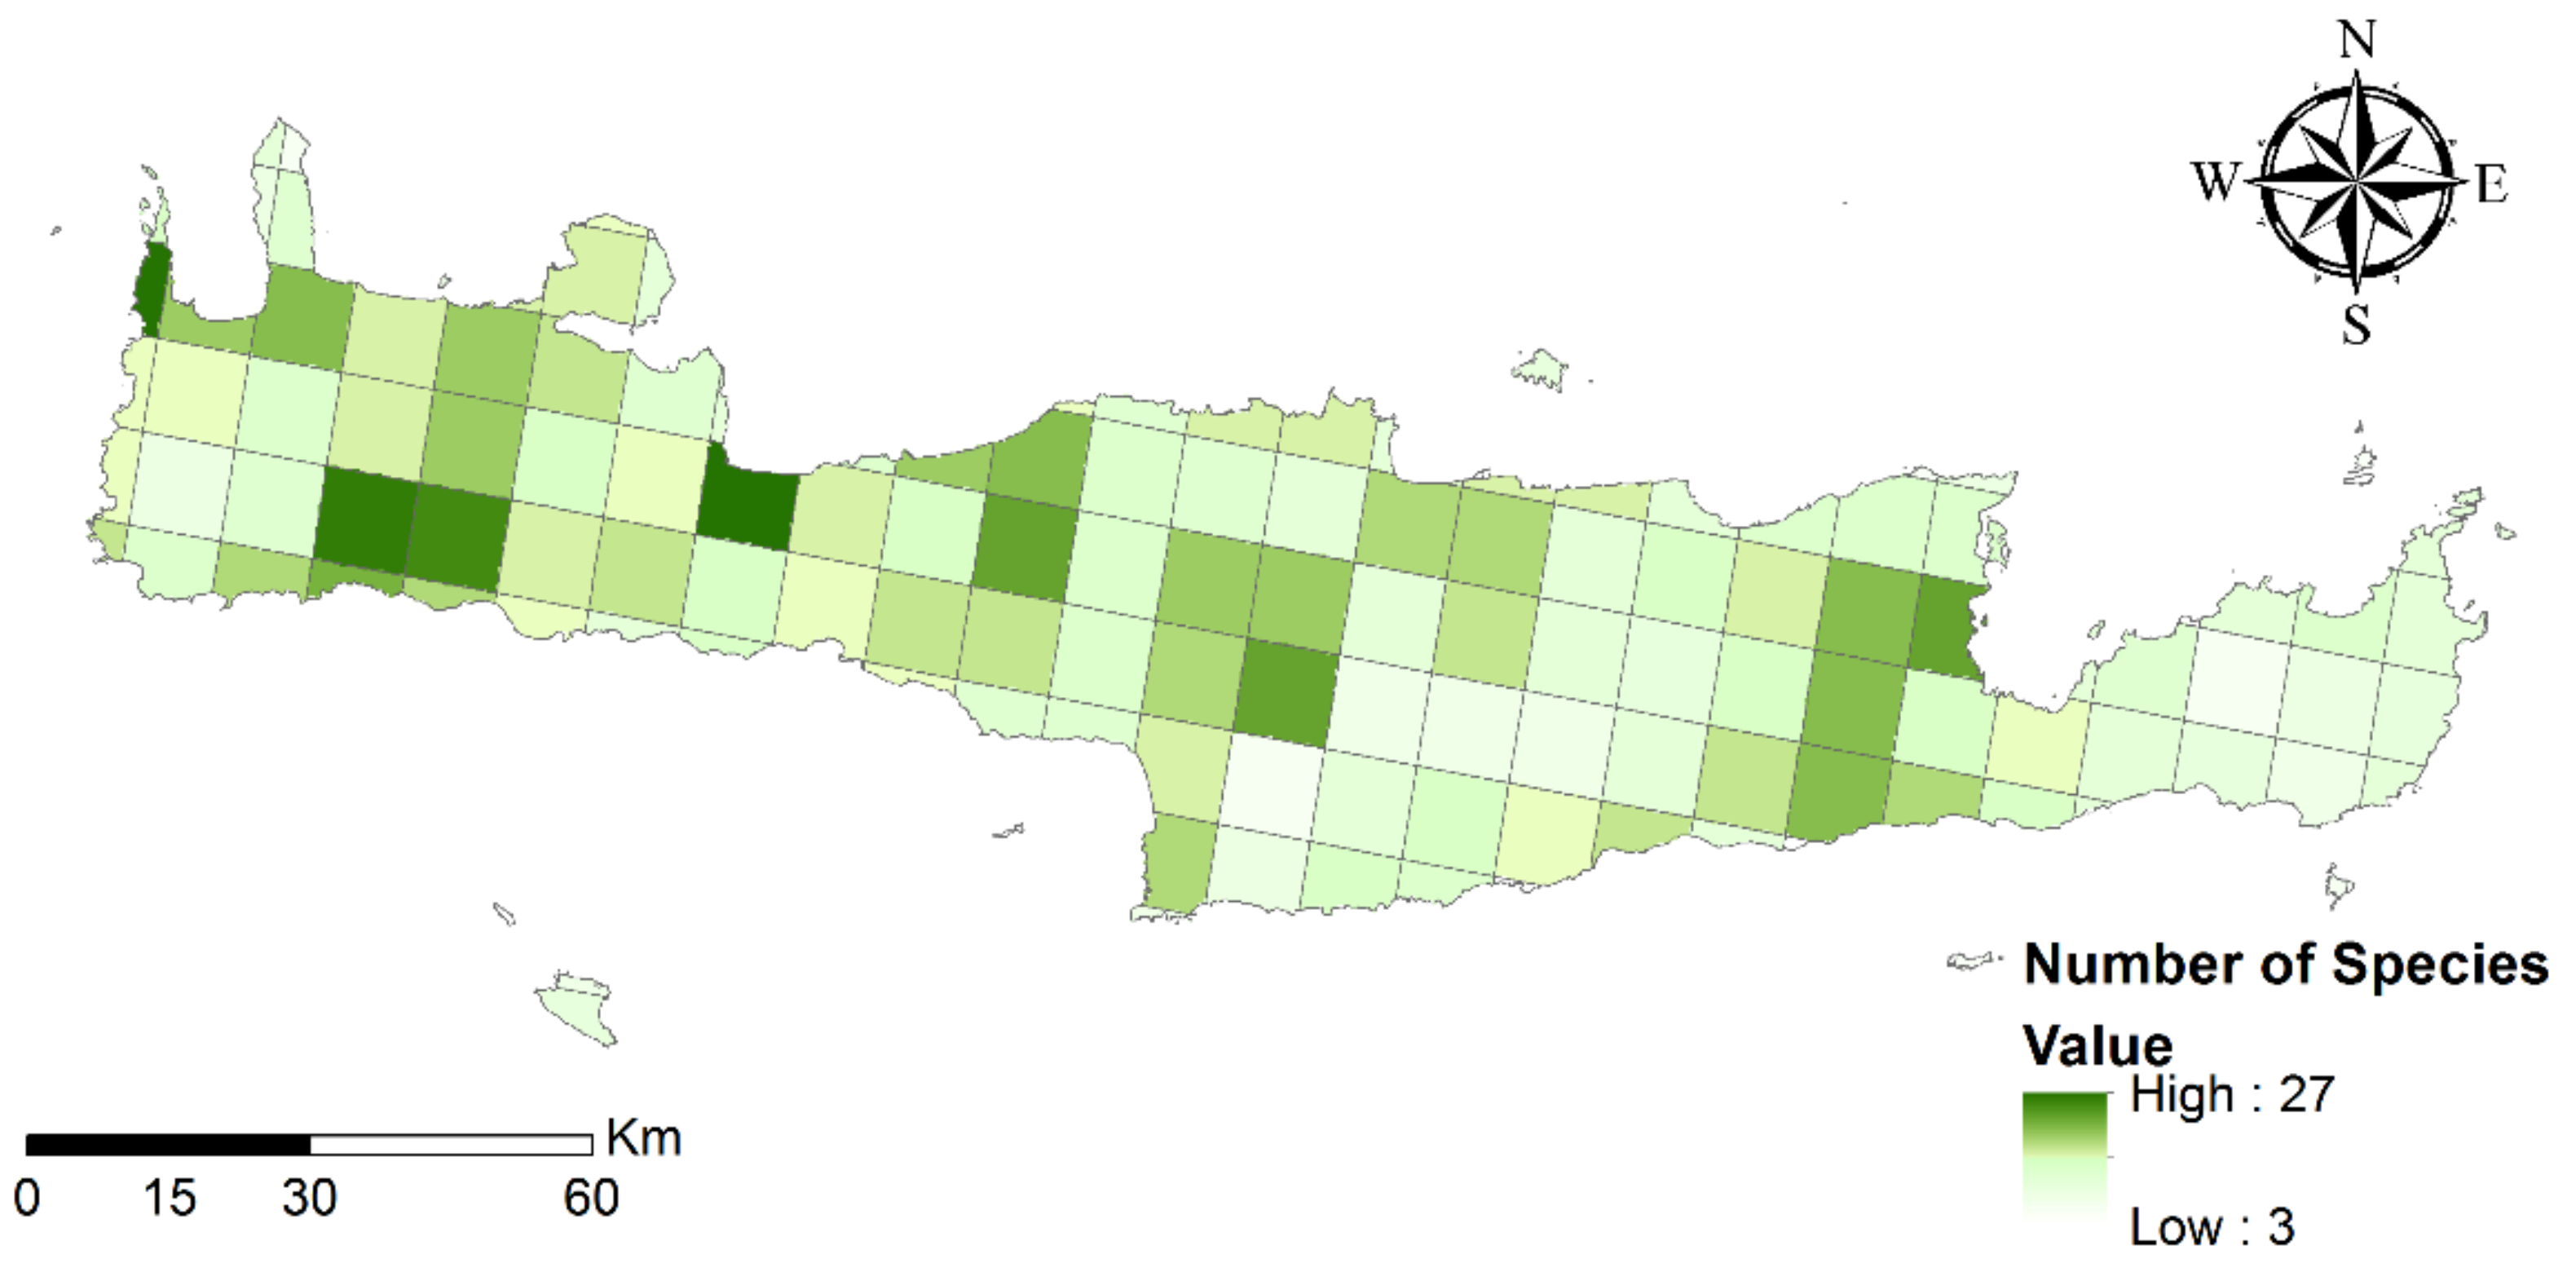
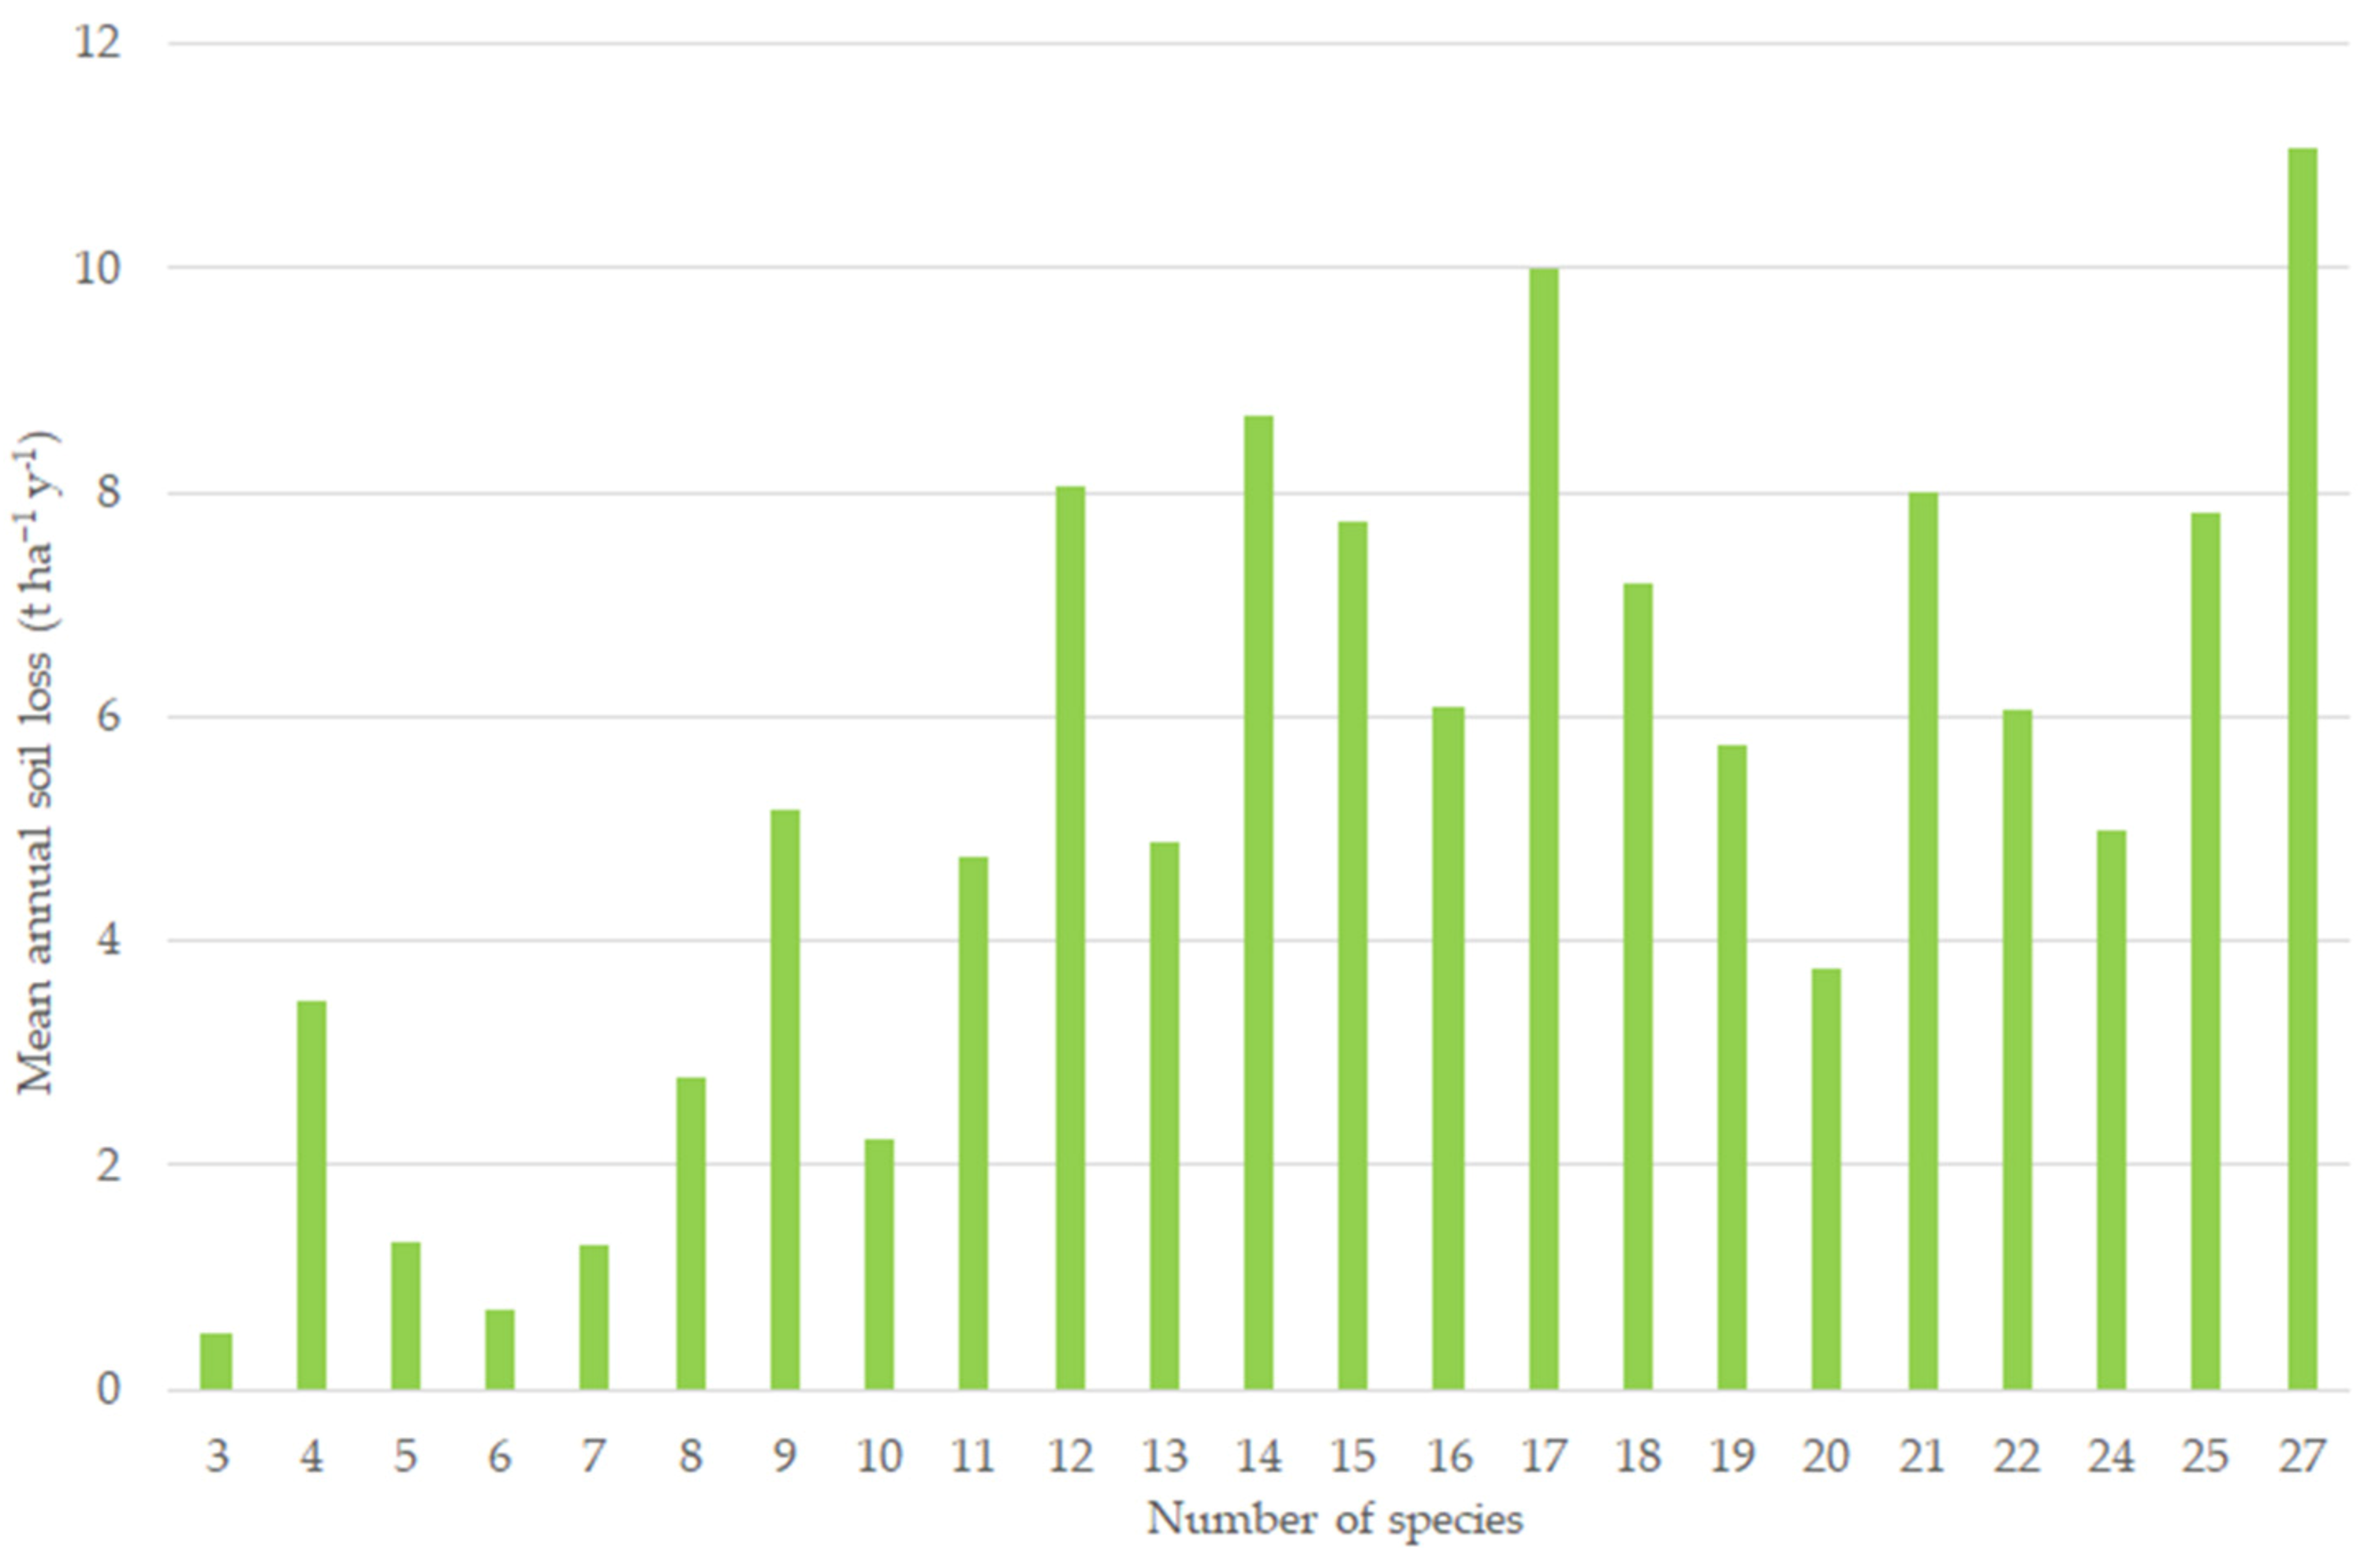
From a biodiversity point of view, the geospatial data of species distribution according the national report on the implementation of the Directive 92/43/EEC (Art 17), for the reference period 2013–2018, were analyzed. The Article 17 reporting covers the species in the whole territory of the Member State concerned, not only those within Natura 2000 sites. Based on these data, a map representing the number of species in a 10 × 10 km grid was constructed (Figure 6), and zonal statistics for the calculation of soil loss rate in each grid was performed (Figure 7). The results indicate that the number of protected species reported in the grids of the Crete Island greatly varies and ranges from 3 to 27. Moreover, the soil loss rate is high in grids where species richness is higher. The protection of soil erosion should be a priority in these areas and part of the biodiversity conservation strategy.
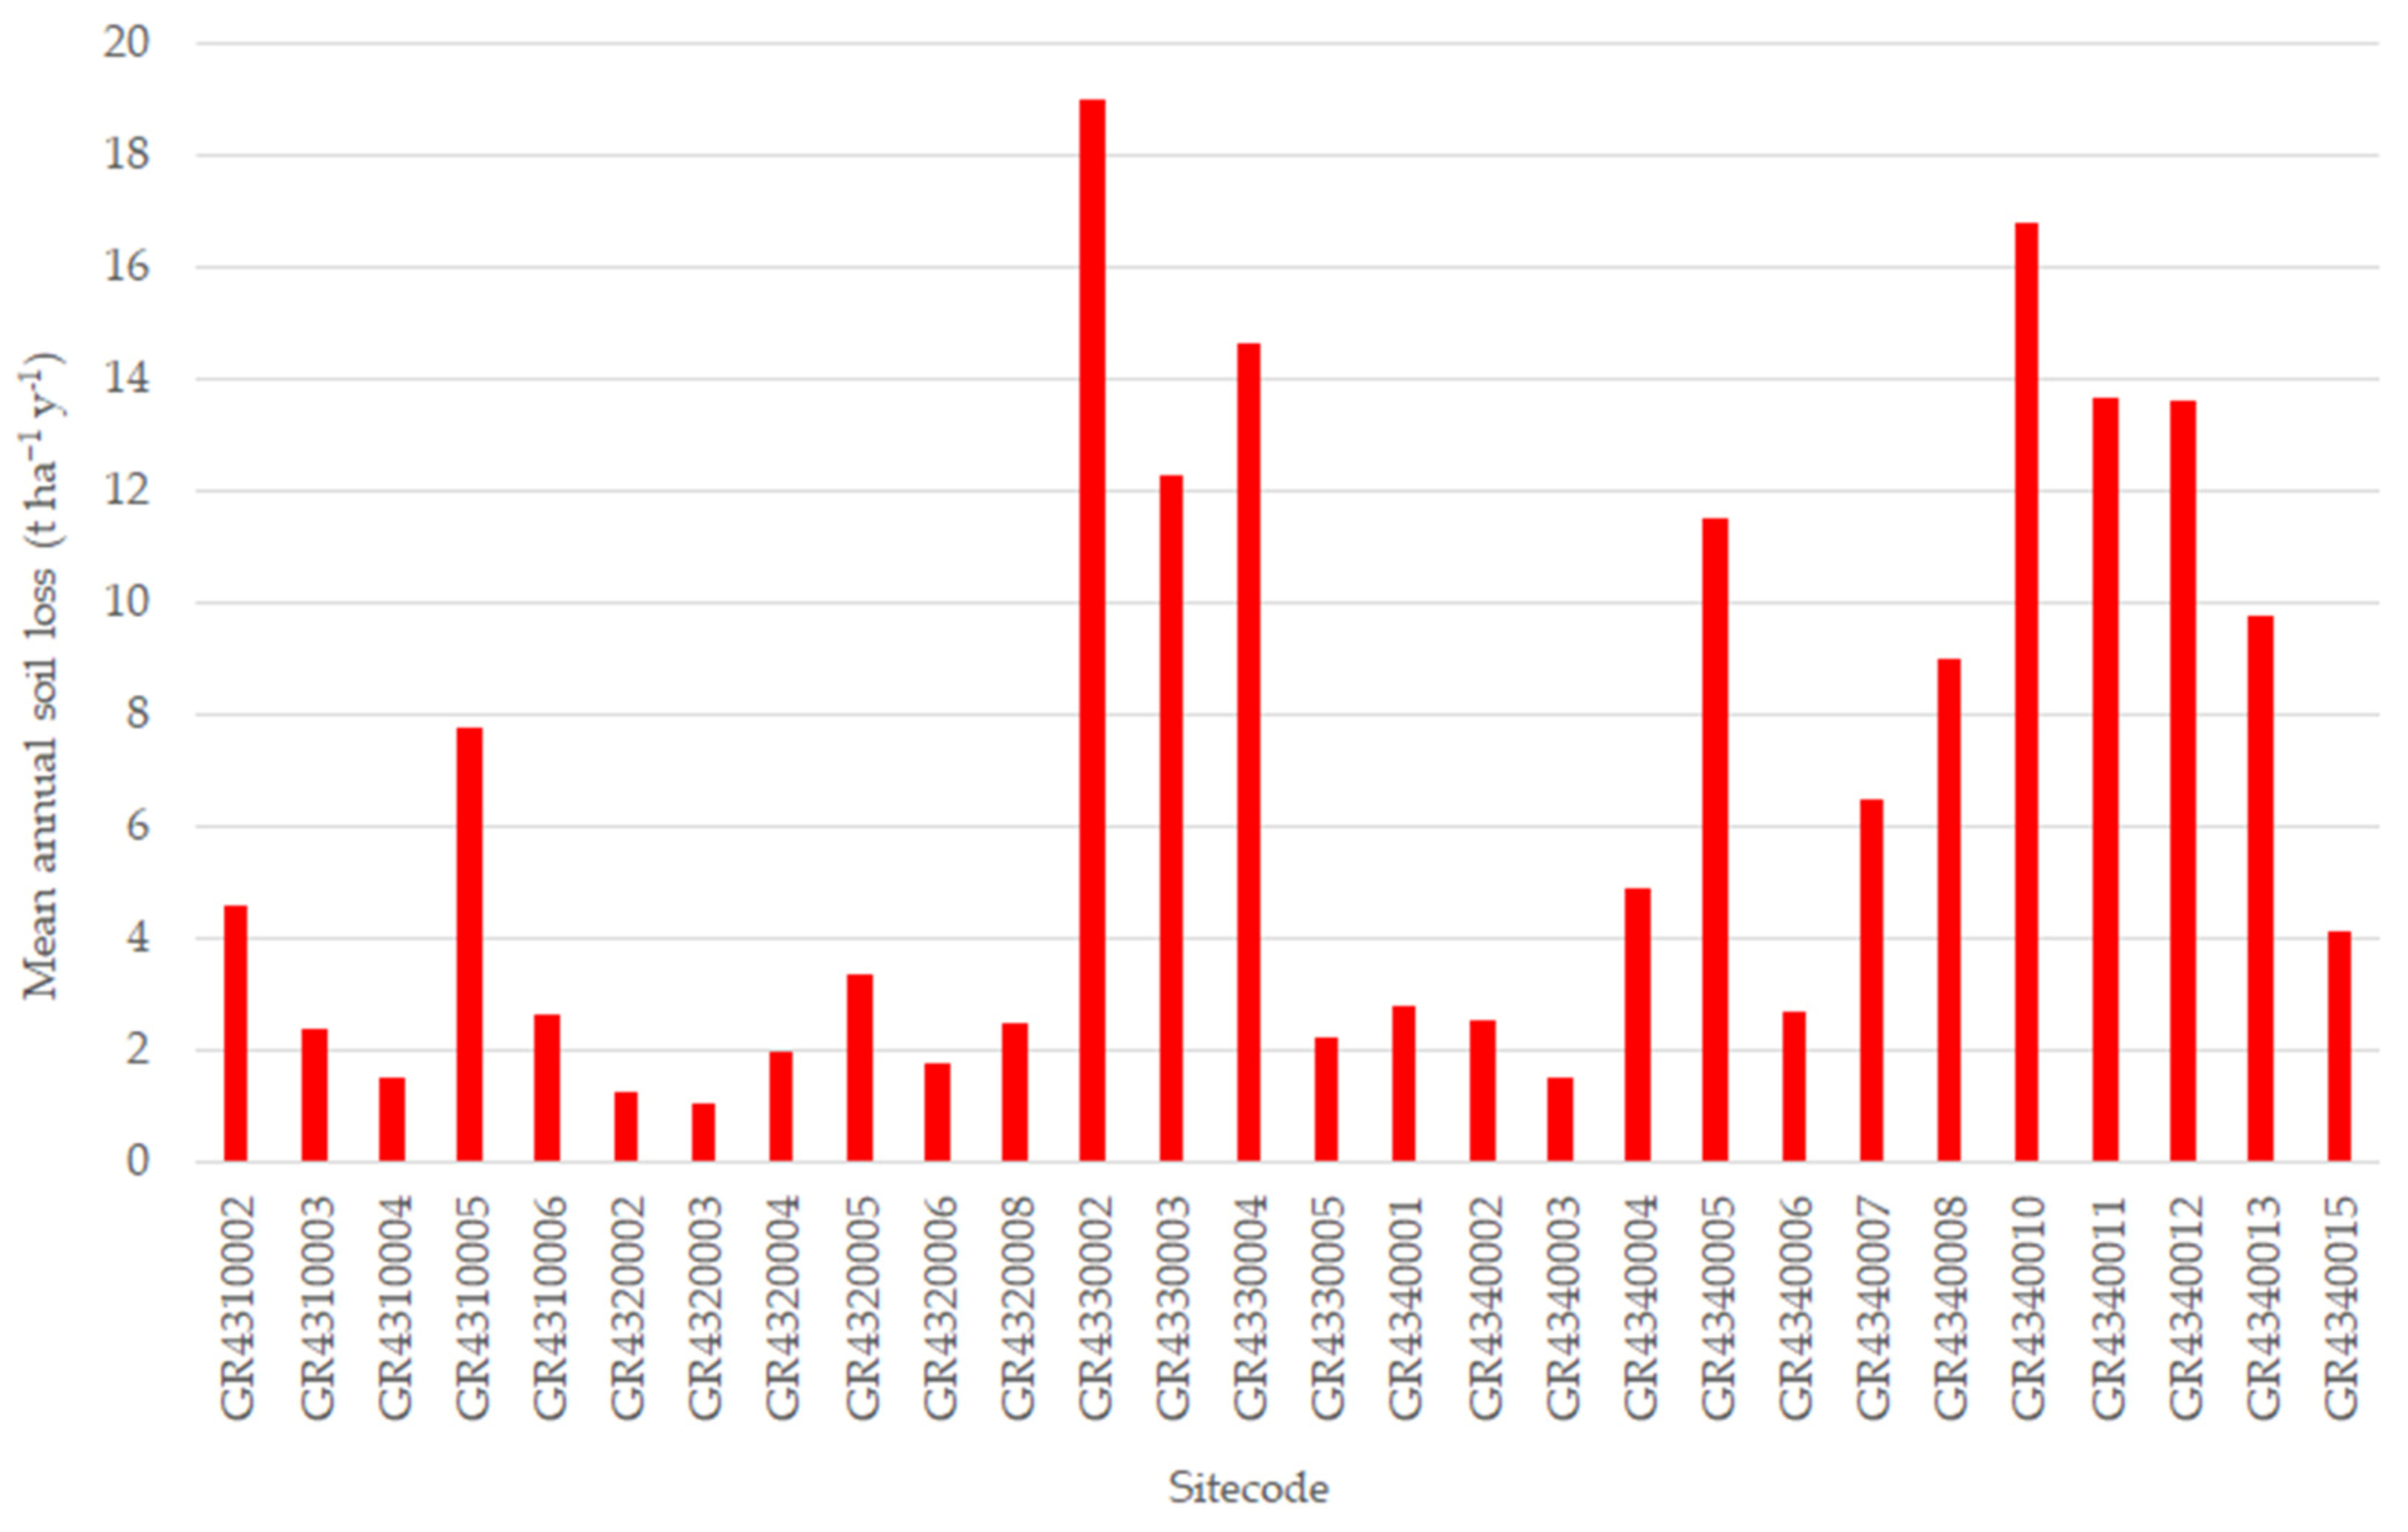
Regarding the erosion in N2K-protected areas, it emerged that there is no significant difference between the designated terrestrial SCIs areas (6.06 t ha−1 y−1) and the other nonprotected areas (6.19 t ha−1 y−1). There are also great differences in soil loss rates among the sitecodes, as illustrated in Figure 8. This is due to the higher rainfall erosivity values in the eastern part of the island and the steeper relief in mountainous ranges and canyons that favor the erosional process.
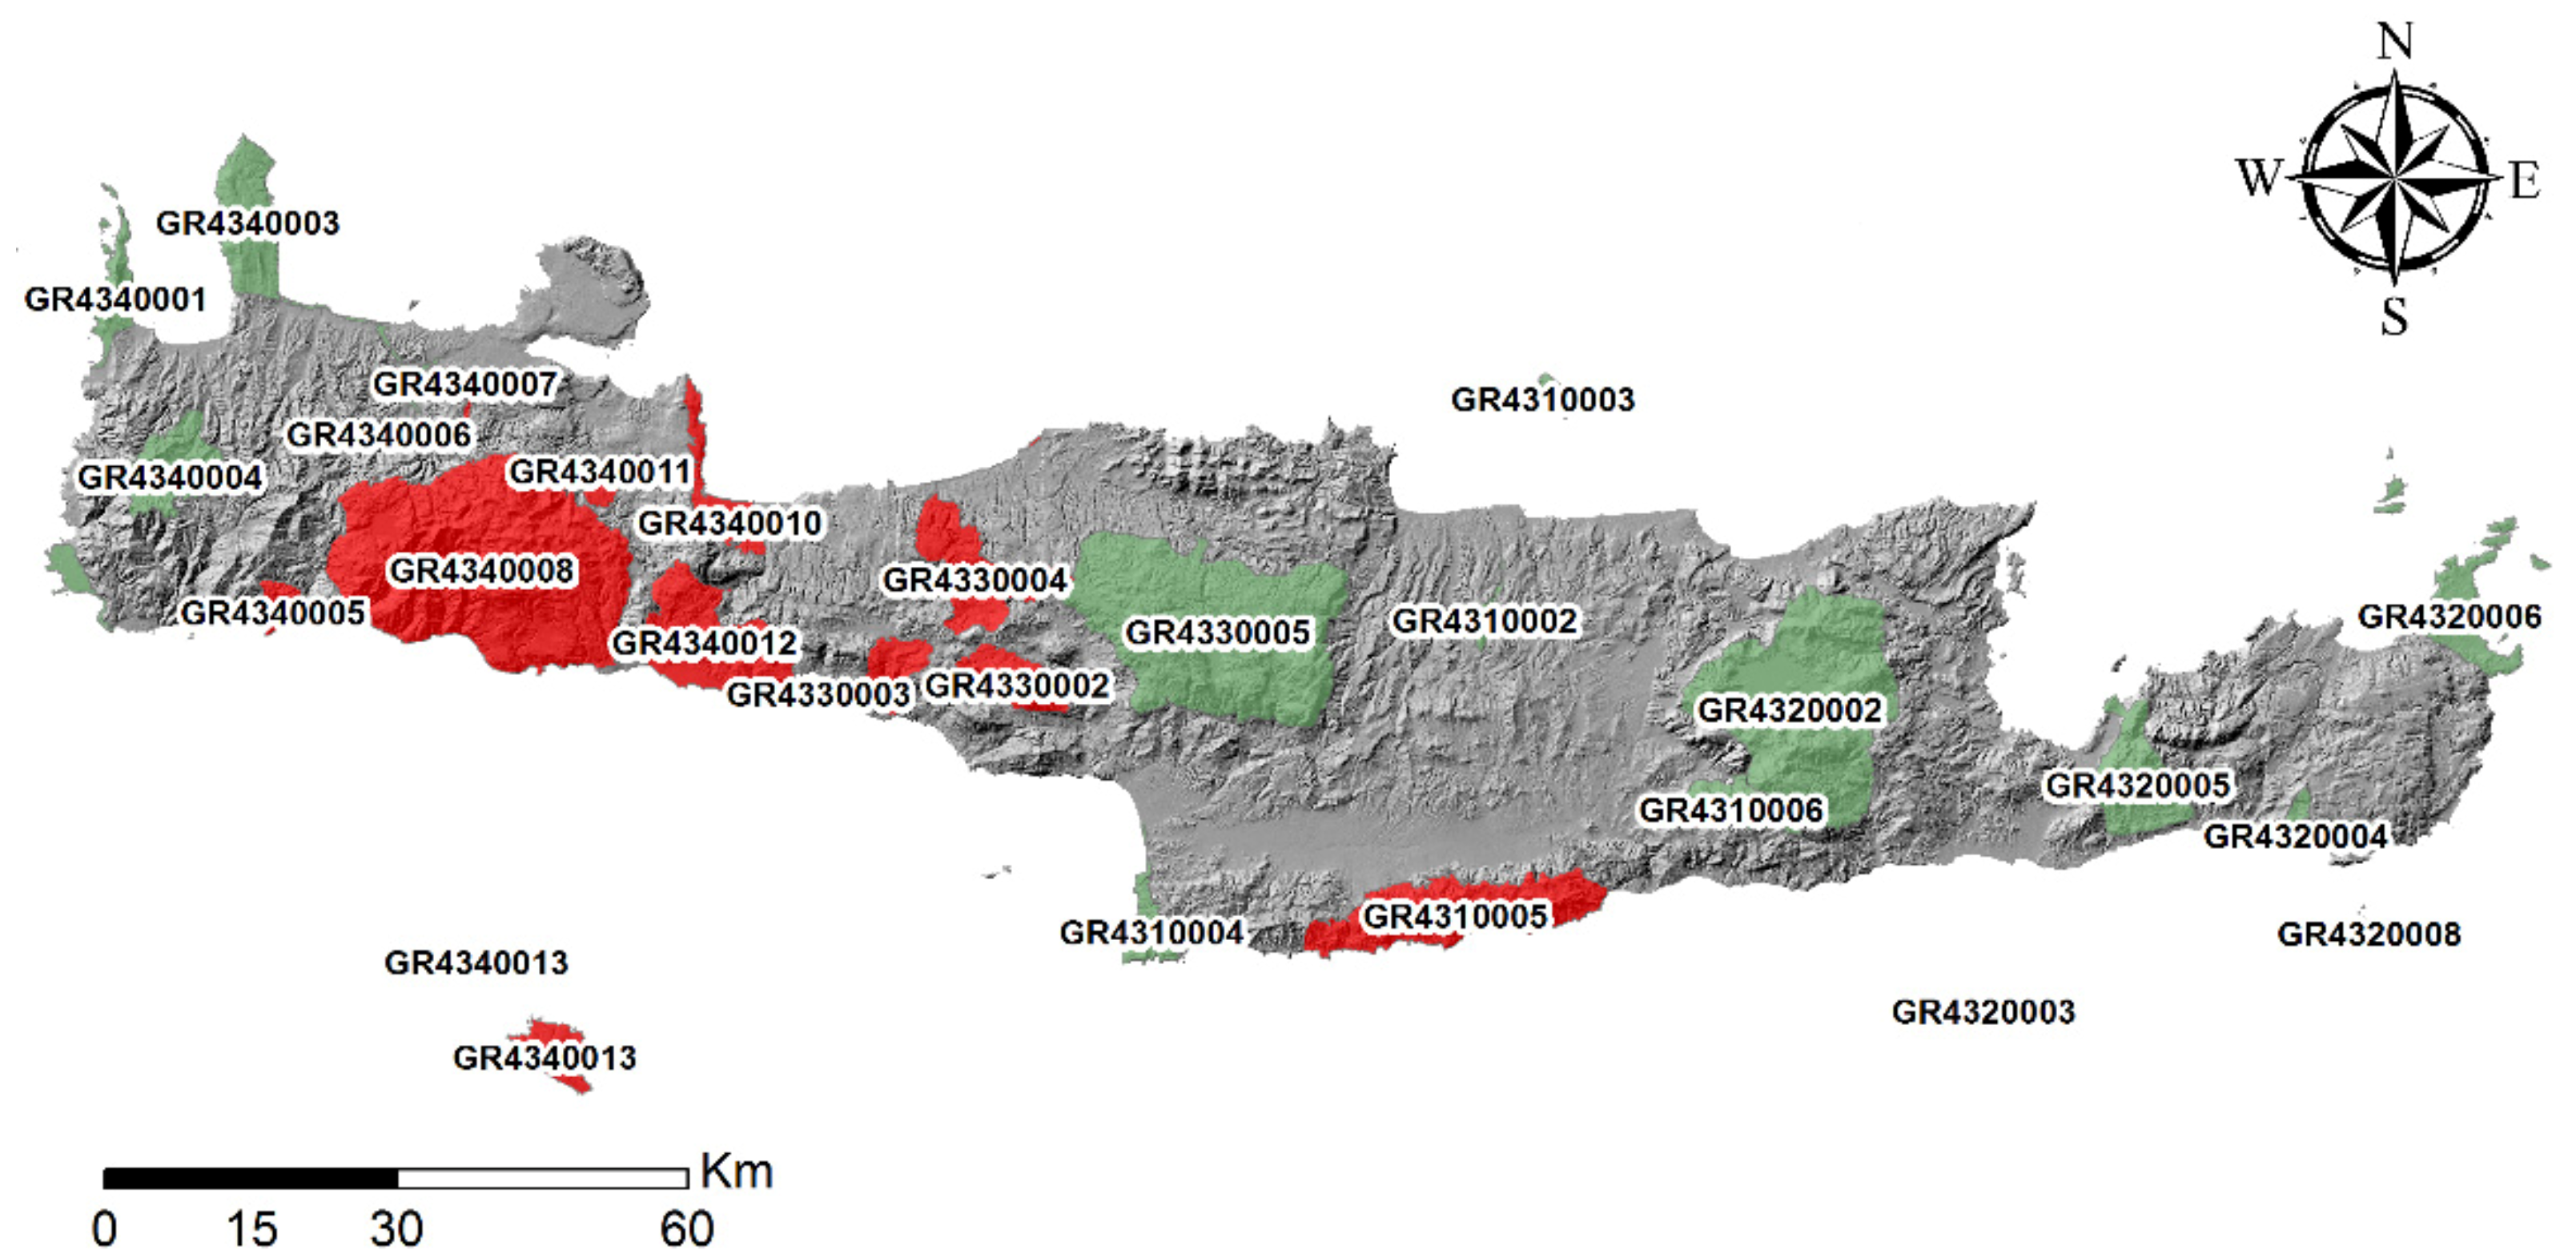
It is noteworthy that 11 out of 28 SCI areas present higher annual soil loss potential than the study area’s average (Figure 9). Particularly, the more susceptible SCIs to erosion in descending order are GR4330002 (18.98 t ha−1 y−1), GR4340010 (16.79 t ha−1 y−1), GR4330004 (14.63 t ha−1 y−1), GR4340011 (13.69 t ha−1 y−1) and GR4340012 (13.61 t ha−1 y−1).
Subsequently, the analysis was conducted based on the natural habitat types and their conservation status, as depicted from the Council Directive 92/43/EEC and the national environmental protection framework.
Regarding the conservation status of the natural habitats, three categories emerged. The habitat types in Annex I to Directive 92/43/EEC are indicated by an asterisk (*) in Annex I and characterized as priority natural habitat and the certain national importance habitat types. The “Annex I” habitat types refer to natural habitat types of Community interest whose conservation requires the designation of Special Areas of Conservation (SAC). The “priority” habitat types include habitats of principal importance for the conservation of biodiversity (also listed in Annex I), while the “national importance” habitat types refer to natural habitat types whose need for protection has been recognized from a national perspective.
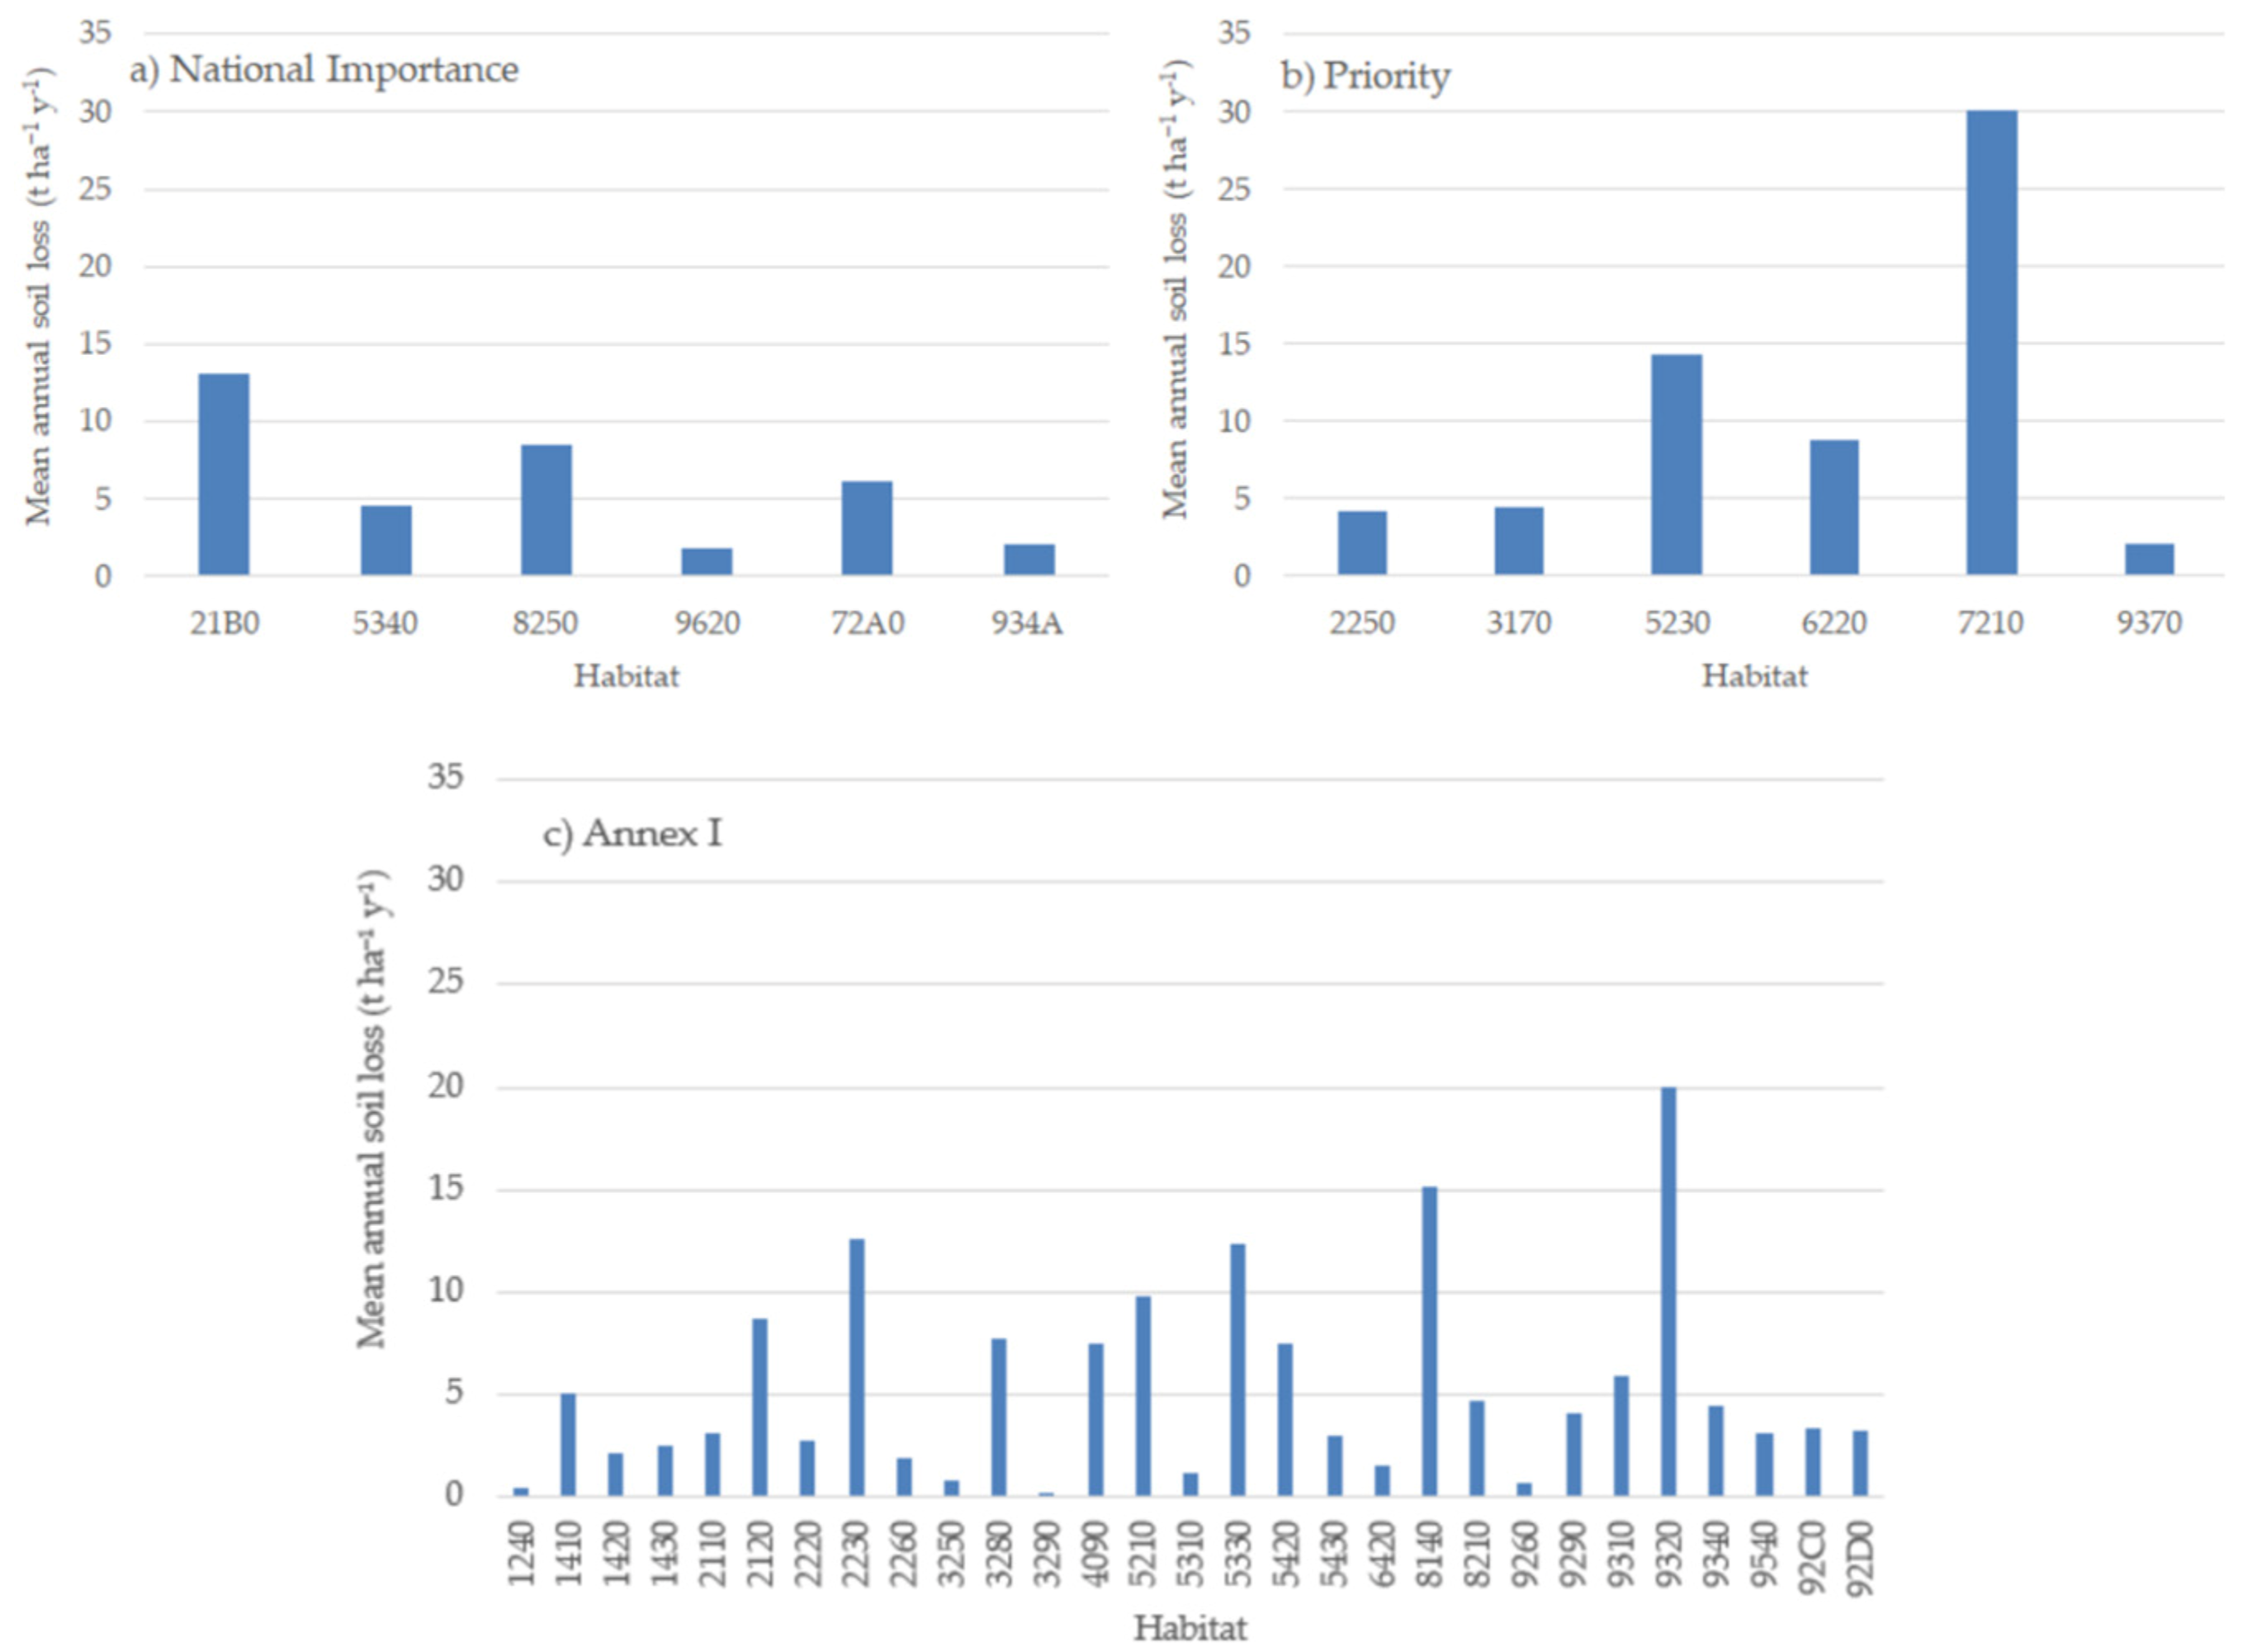
In the Crete Island, there are 30 habitat types from the category “Annex I”, covering an area of 1807.1 km2; 6 habitat types from the category “national importance”, covering an area of 245.4 km2; and 6 habitat types from the category “priority”, covering an area of 7.26 km2. In general, the soil loss rate is higher in the “priority” habitats (8.58 t ha−1 y−1), followed by “Annex I” habitats (6.02 t ha−1 y−1) and “national importance” habitats (2.31 t ha−1 y−1).
The following figure (Figure 10) illustrates the mean annual soil loss in each habitat type by category of conservation status. For the habitats of national importance, the higher values of soil loss rate were found within the habitat type with code 21B0 (13.08 t ha−1 y−1) namely “Unvegetated sandy beaches”, 8250 (8.46 t ha−1 y−1), namely, “Unvegetated bedrock”, and 72A0 (6.18 t ha−1 y−1), namely, “Greek reedbeds”. In terms of priority habitats, the mean soil loss was found equal to 30.06 t ha−1 y−1 for the coded habitat type 7210 (Calcareous fens with Cladium mariscus and species of the Caricion davallianae), 14.36 t ha−1 y−1 for the coded habitat type 5230 (Arborescent matorral with Laurus nobilis) and 8.85 t ha−1 y−1 for the coded habitat type 6220 (Pseudo-steppe with grasses and annuals of the Thero-Brachypodietea). Concerning the analysis of the mean annual soil loss among habitats types of the category Annex I, it was pointed out that the highest values (19.94 t ha−1 y−1) were found in Olea and Ceratonia forests (9320), followed by Eastern Mediterranean screes (8140), Malcolmietalia dune grasslands (2230) and Thermo-Mediterranean and pre-desert scrub (5330), with values of 15.13, 12.61 and 12.35 t ha−1 y−1, respectively.
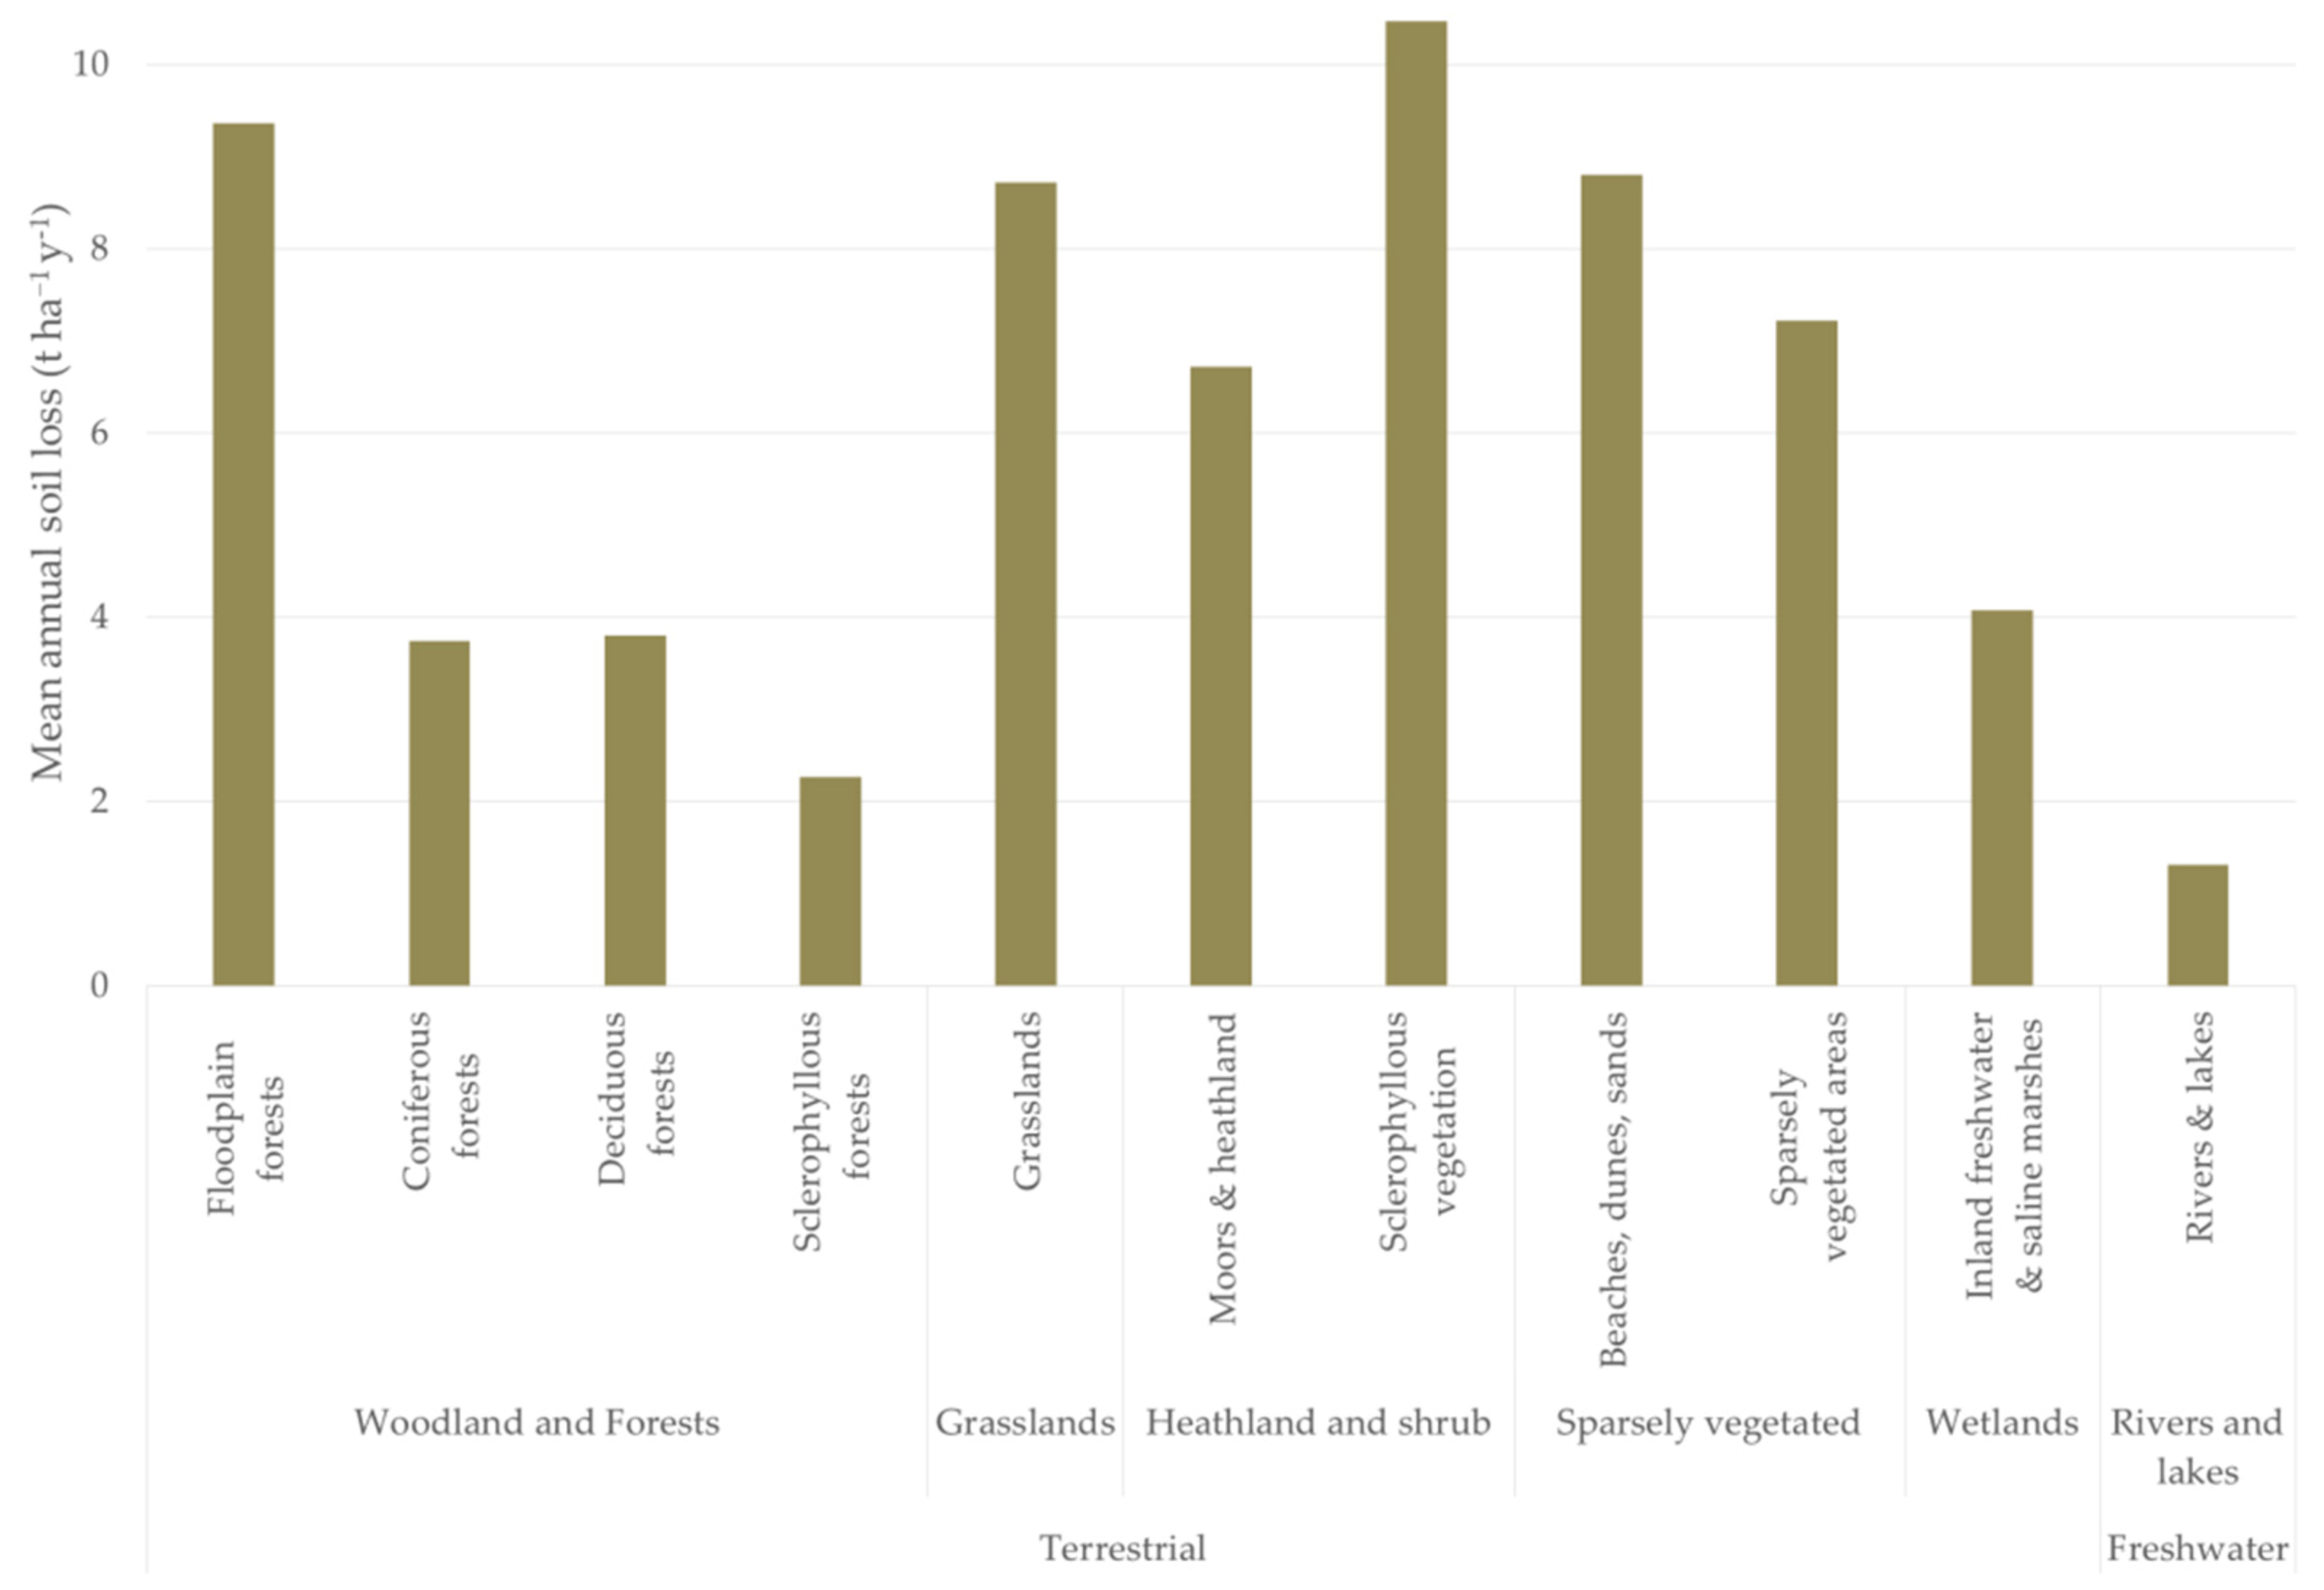
Afterwards, a typology allowing the correspondence of all habitat types to the MAES Level 3 ecosystem type categories was applied based on the habitat types’ interpretation [99,100,101]. In the SCIs areas of Crete’s Island, the main MAES are heathland and shrubs (1332.2 km2), followed by woodland and forests (661.1 km2) and sparsely vegetated areas (49.4 km2). Smaller areas occupied by grassland, wetlands and rivers and lakes equal to 4.9 km2, 1.3 km2 and 0.3 km2, respectively (Table 4).
The soil loss rate values in each MAES ecosystem category are also presented in Figure 11. From the aforementioned figure, it can be seen that the higher values area presented in Sclerophyllous vegetation (10.46 t ha−1 y−1) and floodplain forests (9.37 t ha−1 y−1), while higher values than the estimated average annual soil loss of the study area were found in beaches, dunes, sands (8.81 t ha−1 y−1); grasslands (8.72 t ha−1 y−1); sparsely vegetated areas (7.22 t ha−1 y−1); and moors and heathland (6.72 t ha−1 y−1).
4. Discussion
A cloud-based mapping approach for assessing soil erosion was performed in this paper. Particularly, the empirical erosion prediction model of RUSLE was implemented in the GEE cloud-computing platform provided by Google. Cloud-computing platforms, such as GEE, are quite popular and provide efficient ways to store, access and analyze datasets on powerful servers. The availability of large amount of data that can be used for time series analysis in combination with the fast availability and processing time makes GEE a successful tool [102].
Unfortunately, there are no actual soil loss measurements over the study area to validate and calibrate the model outputs. However, the efficiency of the RUSLE in quantifying the rate of soil loss has been validated under Mediterranean conditions, leading to an increased efficiency in estimating the soil loss rate [65,66].
In our approach, the RUSLE predictions estimated that the average soil loss on Crete Island was of 6.15 t ha−1 y−1. The results are in line with soil loss estimates for the entire island, as derived from a previous study, using the G2 model [103]. In this study, Panagos et al. estimated the soil erosion of Crete Island focusing on agricultural land uses, where the average annual soil erosion rate was at 8.12 t ha−1 y−1. They have also identified that the soil erosion rate was higher in the western part of Crete than the eastern region. However, they have excluded areas covered by winter clouds (15% of total Crete area), regions with slopes of more than 140 (8% of total Crete area) and bare rocky areas (0.5% of total Crete area) [103]. In addition, some studies have been carried out for the assessment of soil erosion in selected areas of Crete Island based on the RUSLE model. Karydas et al. [104] estimated soil erosion on a small olive farming area in the northwestern side of Crete Island, using high-resolution QuickBird images. Their results indicate that in most of the examined area, the soil erosion rate is very severe, with a mean value equal to 106 t ha−1 y−1. Another case study by Kouli et al. [105] assessed the soil erosion in nine major watersheds of northwestern Crete. Their research shows the means of these nine (9) watersheds range from 77.17 to 205.467 t ha−1 y−1. This analysis presents that the watersheds are prone to severe soil erosion. However, both of the aforementioned studies were limited to northwestern Crete, which is already stated in our analysis that there is a particularly high rainfall erosivity compared to the rest of the area. Their abnormal results can be attributed to the coarse resolution of the data sources used for the soil erodibility [105], the estimation of soil erodibility derived from expert opinion’s based on geological maps and the unconditioned estimation of the topographic parameters in a very undulating relief [104].
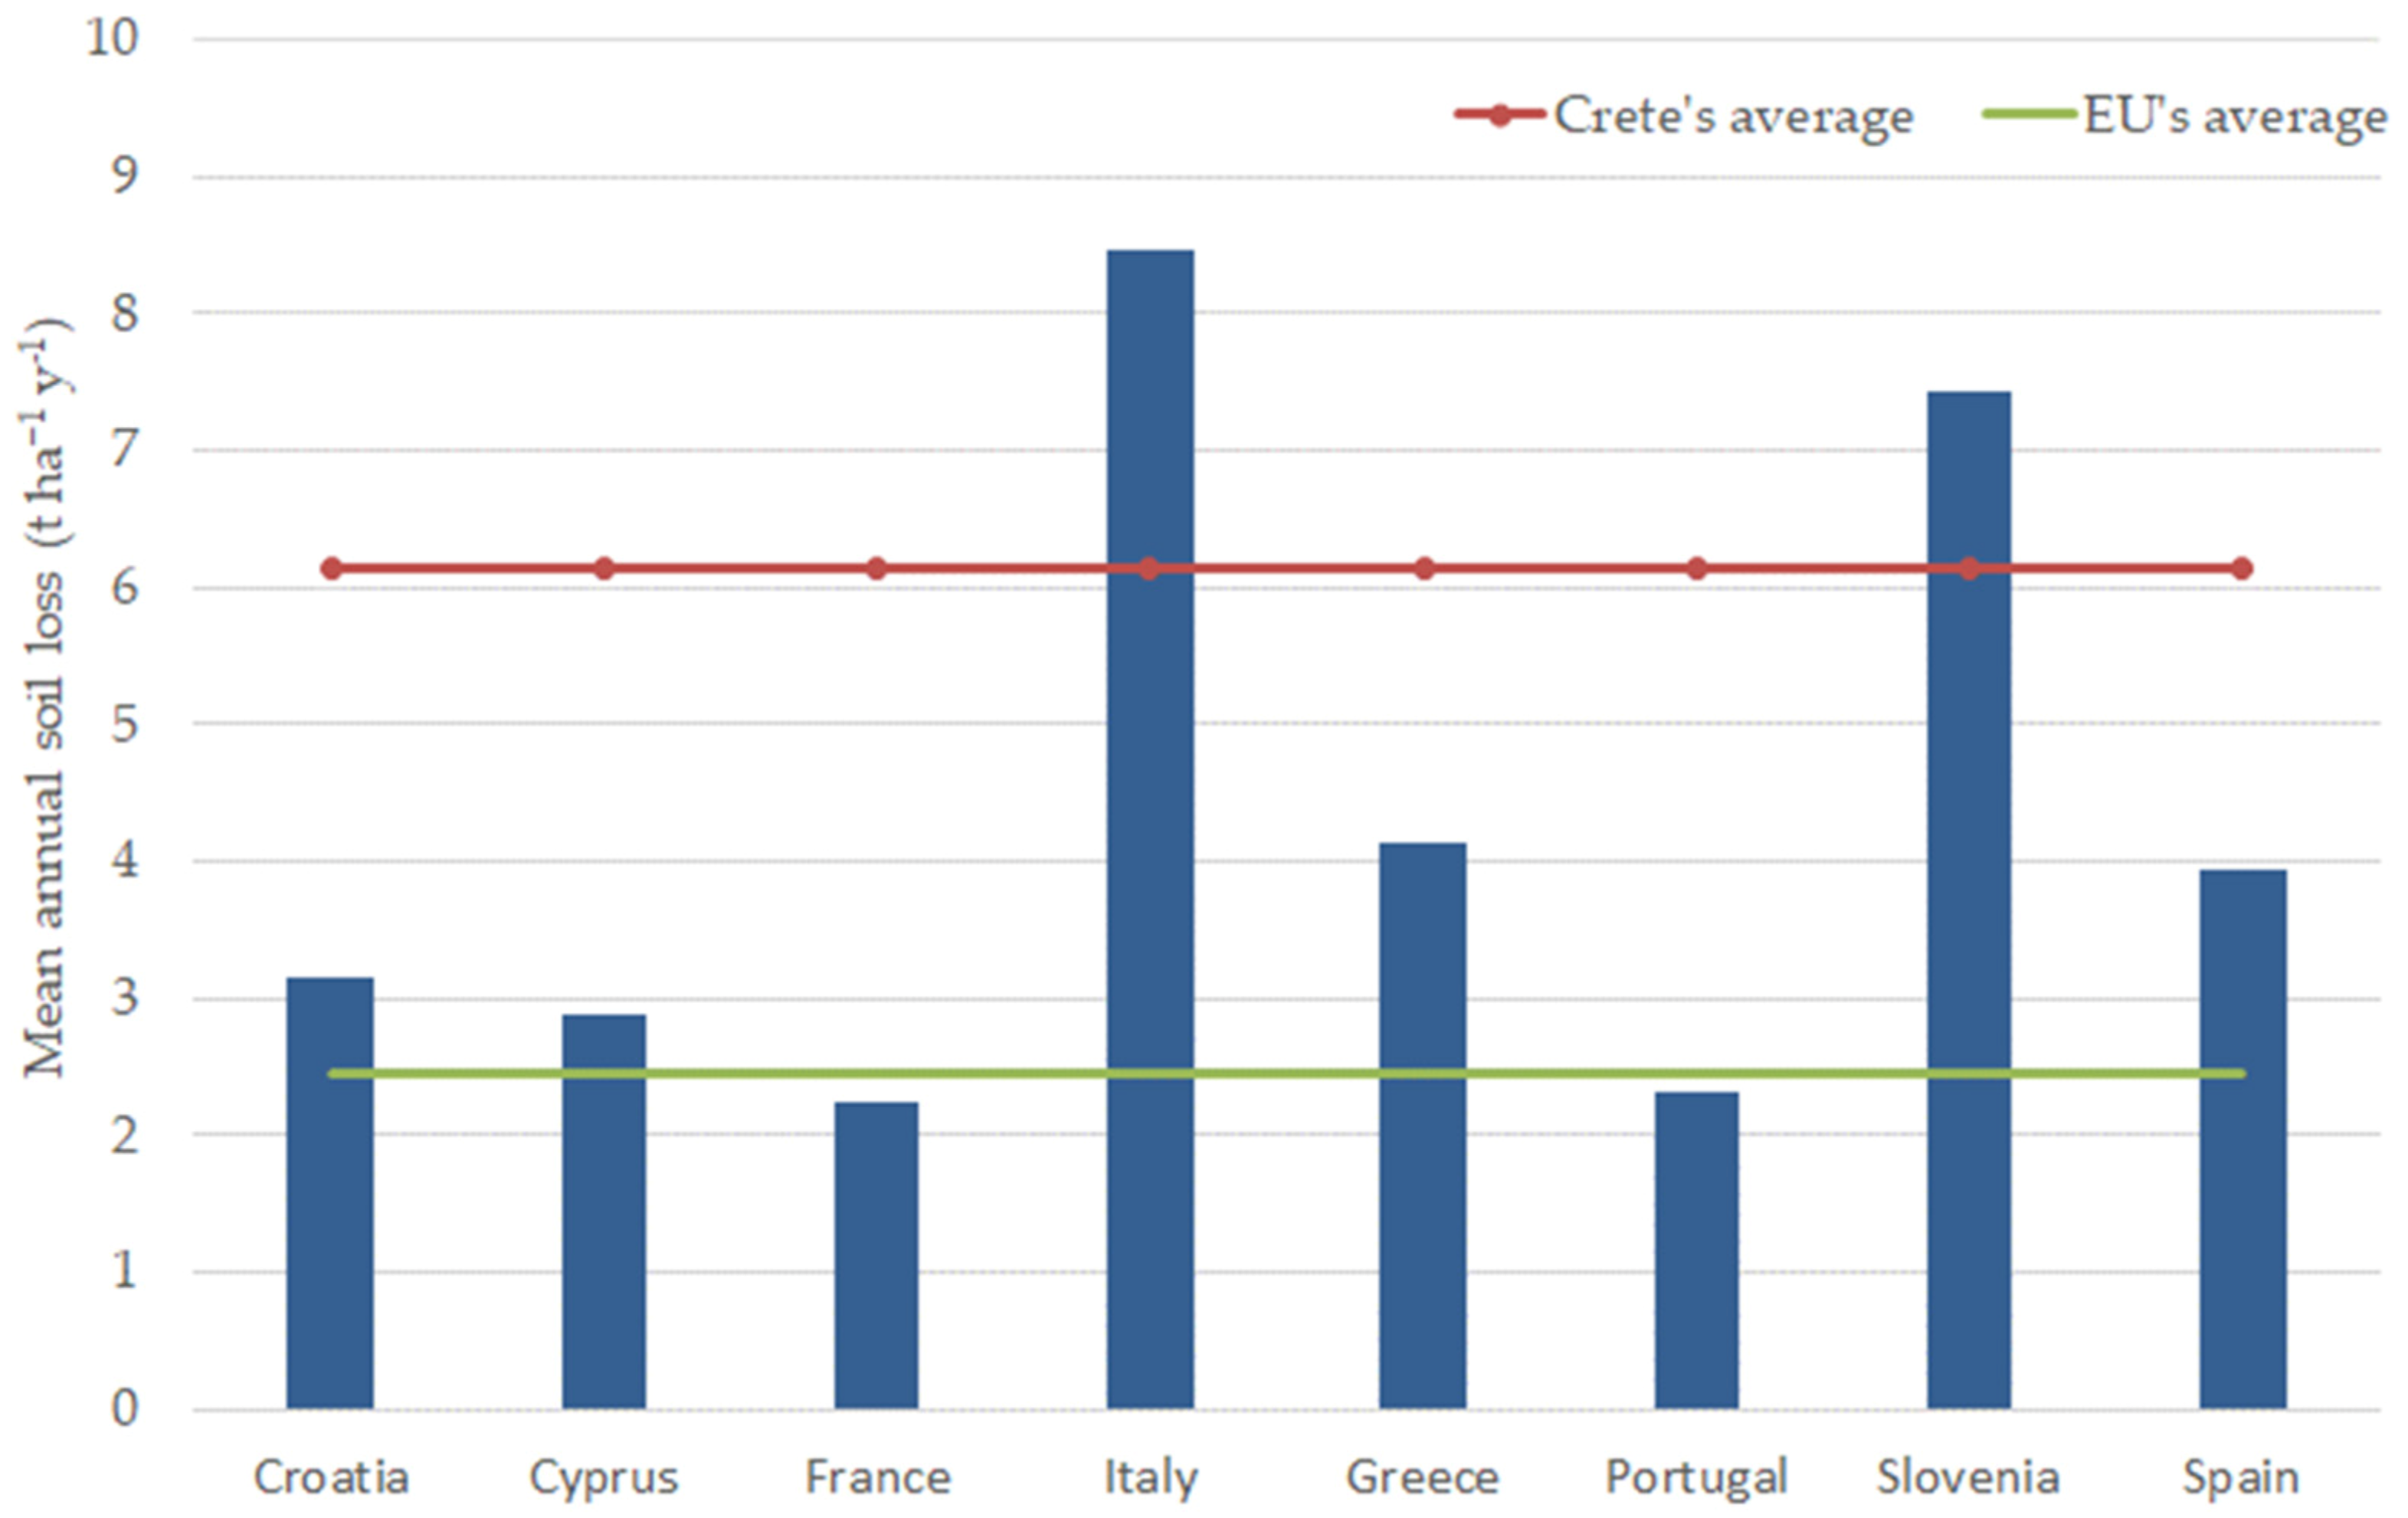
Concerning a pan-European study [48], it was highlighted that soil loss rate varies greatly among EU Member States due to the variety of geomorphological, climatological and land use conditions in the EU. It is noteworthy that the mean annual rate of soil loss across the EU is estimated at 2.46 t ha−1 y−1, while the estimated total soil loss of 8 of the Mediterranean EU Member States is 67% of the total soil loss in the EU [48] (Figure 12).
As shown in Figure 12, the island of Crete is among the regions with the highest erosion rates in Mediterranean and is above the average of Greek territory. This is also confirmed by a national scale erosion assessment study [106], which characterizes Crete as one of the most erosion-prone administrative regions of Greece. Furthermore, recent research has highlighted that the projected changes in Crete’s rainfall regime will increase rainfall erosivity and are expected to intensify water erosion in the near and far future [85,107]. Thus, the demand for high-level spatial-temporal monitoring of soil loss is increasing rapidly.
Erosion is a major threat to soils that need to be managed for biodiversity conservation, especially within the established ecological network of European protected areas (N2K). Crete is the richest island of Europe in terms of endemic plant species [68] and includes several designated N2K sites. The erosion modeling outputs could provide stakeholders and decision makers baseline information for future conservation management actions.
The results demonstrate an increase in soil erosion rates in relation to species richness in contrast to a study by Allen et al. [108]. On the other hand, the protection framework seems to have a slight effect on erosion dynamic as an insignificant difference reported between the N2K and non-N2K areas. Furthermore, natural ecosystems that are of the greatest importance for biodiversity conservation, according to Annex I of Directive 92/43/EEC, have rather significant soil loss rates, posing a threat to their preservation. The above elements reinforce the scientific community’s call for erosion regulation measures in environmentally important areas [109,110].
The outcomes of a conducted research over three semi-arid Mediterranean islands mentioned that shrublands had the highest soil losses at 5–13 times more than forest and vineyards [67]. Regarding the identified MAES ecosystem types in the study area, it emerged that higher erosion rate values are found in grasslands, heathland and shrubs and sparsely vegetated areas. Grassland habitats can be found all over Europe, in places where the climate or soil conditions are too harsh for trees or other dense vegetation to thrive. Many species-rich grassland areas have sustained significant losses in terms of extent and species over the recent decades, despite their protection under Natura 2000. The high soil loss in grasslands may further degrade their status. All the above-mentioned MAES ecosystem types with the estimated highest soil loss rates are potential rangelands. It is well documented, especially in the Mediterranean basin, that overgrazing is a major pressure on natural habitats that directly and indirectly affects the erosion process [22,23]. Therefore, establishing a regulatory framework for grazing could be an effective erosion mitigation measure that also improves its quality. The degraded rangelands can be restored by moderating grazing pressures rather than completely banning livestock grazing [111,112].
Additionally, a sustainable erosion mitigation plan should be elaborated in areas with little or no vegetation, including the employment of bioengineering measures to arrest soil loss [47]. The establishment of contour earth bunds and ditches is an efficient method to control overland flow and the associated soil transportation in these areas [113]. In addition, the management of shrublands should incorporate silvicultural treatments that promote the increase in the shrub canopy for effective control of surface runoff. Finally, the reforestation of areas with sparse vegetation should be a priority. However, to ensure reforestation success, additional measures need to be taken. To ensure a stable environment for the development of the forest, it is necessary to construct Mediterranean style terraces and protect the planting terracing through light mulching [114,115].
Erosion modeling outcomes could provide stakeholders and decision-makers with baseline information for future conservation management actions. All the EU Member States conduct surveillance and monitoring programs for the conservation of natural habitats and wild fauna and flora to maintain biodiversity. Therefore, spatial-temporal monitoring of soil loss within the protected areas based on remote sensing should be introduced as a part of the forthcoming Biodiversity Strategy. The evaluation of the ecosystem services supplies and threats in protected areas of the East Mediterranean basin needs to be a target for future research.
5. Conclusions
This study evaluated the impact of soil loss rate by water erosion on N2K-network-protected areas of Crete, Greece: an island with a semi-arid Mediterranean climate. Specifically, this estimation aimed to investigate the influence of erosion on biodiversity attributes, habitat types and conservation practices. To fulfill this goal, the RUSLE model was calculated using freely available satellite imageries (Sentinel-2A), the reanalysis of precipitation data (ERA-5) and by combining external geospatial datasets.
Our approach integrates cloud-based analysis by taking advantage of the availability and quick retrieval of data and the speed and processing time of the GEE platform. External source data derived from the national authorities such as the habitats of the SCIs N2K protected areas and the species distributions from EIONET repository were subsequently used for the soil loss estimation on Crete Island.
The MAES Level 3 ecosystem-type categories have been corresponded to the habitat types according to proposed classification schema (including the habitats of Hellenic importance not listed in Annex I of the Dir. 92/43/EEC). Especially in the protected areas of the island, the MAES types are covered mainly by heathland and shrubs. The phryganic and marquis shrubland areas have been subject to various types of anthropogenic disturbances, including grazing. The soil loss rate values differ between the various categories, with the highest ones presented on potential rangelands such as Sclerophyllous vegetation, grasslands and sparsely vegetated areas. A proper combination of bioengineering techniques and management measures (such as overgrazing regulation) should significantly reduce the soil loss rate in environmentally important areas with low or sparse vegetation cover.
This research acts as a roadmap for further studies on soil loss assessment in environmentally protected areas (e.g., N2K). The erosion process can pose a crucial threat for habitat types and species in Mediterranean ecosystems such as Crete. Therefore, factors such as overgrazing that put pressure on natural habitats and negatively affect the presence of soil erosion need to be further regulated.
Author Contributions
Conceptualization, S.S.; methodology, S.S.; software, S.S. and V.A.; formal analysis, S.S.; data curation, S.S. and V.A.; writing—original draft preparation, S.S.; writing—review and editing, S.S., V.A. and K.G.; visualization, S.S., V.A. and K.G. All authors have read and agreed to the published version of the manuscript.
Funding
This research received no external funding.
Conflicts of Interest
The authors declare no conflict of interest.
References
- Alewell, C.; Egli, M.; Meusburger, K. An attempt to estimate tolerable soil erosion rates by matching soil formation with denudation in Alpine grasslands. J. Soils Sediments 2015, 15, 1383–1399. [Google Scholar] [CrossRef] [Green Version]
- Giuliani, G.; Chatenoux, B.; Benvenuti, A.; Lacroix, P.; Santoro, M.; Mazzetti, P. Monitoring land degradation at national level using satellite Earth Observation time-series data to support SDG15–exploring the potential of data cube. Big Earth Data 2020, 4, 3–22. [Google Scholar] [CrossRef] [Green Version]
- Arshad, M.A.; Martin, S. Identifying critical limits for soil quality indicators in agro-ecosystems. Agric. Ecosyst. Environ. 2002, 88, 153–160. [Google Scholar] [CrossRef]
- Guerra, C.A.; Maes, J.; Geijzendorffer, I.; Metzger, M.J. An assessment of soil erosion prevention by vegetation in Mediterranean Europe: Current trends of ecosystem service provision. Ecol. Indic. 2016, 60, 213–222. [Google Scholar] [CrossRef]
- Olson, K.R.; Al-Kaisi, M.; Lal, R.; Cihacek, L. Impact of soil erosion on soil organic carbon stocks. J. Soil Water Conserv. 2016, 71, 61–67. [Google Scholar] [CrossRef] [Green Version]
- Panagos, P.; Standardi, G.; Borrelli, P.; Lugato, E.; Montanarella, L.; Bosello, F. Cost of agricultural productivity loss due to soil erosion in the European Union: From direct cost evaluation approaches to the use of macroeconomic models. Land Degrad. Dev. 2018, 29, 471–484. [Google Scholar] [CrossRef]
- Orgiazzi, A.; Panagos, P. Soil biodiversity and soil erosion: It is time to get married: Adding an earthworm factor to soil erosion modelling. Glob. Ecol. Biogeogr. 2018, 27, 1155–1167. [Google Scholar] [CrossRef]
- Polykretis, C.; Alexakis, D.D.; Grillakis, M.G.; Agapiou, A.; Cuca, B.; Papadopoulos, N.; Sarris, A. Assessment of water-induced soil erosion as a threat to cultural heritage sites: The case of Chania prefecture, Crete Island, Greece. Big Earth Data 2021, 1–19. [Google Scholar] [CrossRef]
- Haselberger, S.; Ohler, L.M.; Junker, R.R.; Otto, J.C.; Glade, T.; Kraushaar, S. Quantification of biogeomorphic interactions between small-scale sediment transport and primary vegetation succession on proglacial slopes of the Gepatschferner, Austria. Earth Surf. Processes Landf. 2021, 46, 1941–1952. [Google Scholar] [CrossRef]
- Bezak, N.; Borrelli, P.; Panagos, P. A first assessment of rainfall erosivity synchrony scale at pan-European scale. Catena 2021, 198, 105060. [Google Scholar] [CrossRef]
- Stefanidis, S.; Alexandridis, V.; Chatzichristaki, C.; Stefanidis, P. Assessing soil loss by water erosion in a typical Mediterranean ecosystem of northern Greece under current and future rainfall erosivity. Water 2021, 13, 2002. [Google Scholar] [CrossRef]
- Ballabio, C.; Borrelli, P.; Spinoni, J.; Meusburger, K.; Michaelides, S.; Begueria, S.; Klik, A.; Petan, S.; Janecek, M.; Olsen, P.; et al. Mapping monthly rainfall erosivity in Europe. Sci. Total Environ. 2017, 579, 1298–1315. [Google Scholar] [CrossRef] [PubMed] [Green Version]
- Panagos, P.; Borrelli, P.; Meusburger, K. A New European Slope Length and Steepness Factor (LS-Factor) for Modeling Soil Erosion by Water. Geosciences 2015, 5, 117–126. [Google Scholar] [CrossRef] [Green Version]
- DiBiase, R.A.; Whipple, K.X. The influence of erosion thresholds and runoff variability on the relationships among topography, climate, and erosion rate. J. Geophys. Res. Earth Surf. 2011, 116. [Google Scholar] [CrossRef] [Green Version]
- Panagos, P.; Meusburger, K.; Ballabio, C.; Borrelli, P.; Alewell, C. Soil erodibility in Europe: A high-resolution dataset based on LUCAS. Sci. Total Environ. 2014, 479, 189–200. [Google Scholar] [CrossRef] [PubMed]
- Efthimiou, N. The new assessment of soil erodibility in Greece. Soil Tillage Res. 2020, 204, 104720. [Google Scholar] [CrossRef]
- Moges, D.M.; Bhat, H.G. Integration of geospatial technologies with RUSLE for analysis of land use/cover change impact on soil erosion: Case study in Rib watershed, north-western highland Ethiopia. Environ. Earth Sci. 2017, 76, 765. [Google Scholar] [CrossRef]
- Efthimiou, N.; Psomiadis, E. The significance of land cover delineation on soil erosion assessment. Environ. Manag. 2018, 62, 383–402. [Google Scholar] [CrossRef]
- Xiao; Yang; Guo, B.; Lu, Y.; Zhang, R.; Zhang, D.; Zhen, X.; Chen, S.; Wu, H.; Wei, C.; et al. Spatial–temporal evolution patterns of soil erosion in the Yellow River Basin from 1990 to 2015: Impacts of natural factors and land use change. Geomat. Nat. Hazards Risk 2021, 12, 103–122. [Google Scholar] [CrossRef]
- Martínez-Casasnovas, J.A.; Concepcion Ramos, M. Soil alteration due to erosion, ploughing and levelling of vineyards in northeast Spain. Soil Use Manag. 2009, 25, 183–192. [Google Scholar] [CrossRef] [Green Version]
- García-Orenes, F.; Roldán, A.; Mataix-Solera, J.; Cerdà, A.; Campoy, M.; Arcenegui, V.; Caravaca, F. Soil structural stability and erosion rates influenced by agricultural management practices in a semi-arid Mediterranean agro-ecosystem. Soil Use Manag. 2012, 28, 571–579. [Google Scholar] [CrossRef]
- Kairis, O.; Karavitis, C.; Salvati, L.; Kounalaki, A.; Kosmas, K. Exploring the impact of overgrazing on soil erosion and land degradation in a dry Mediterranean agro-forest landscape (Crete, Greece). Arid Land Res. Manag. 2015, 29, 360–374. [Google Scholar] [CrossRef]
- Panagopoulos, Y.; Dimitriou, E.; Skoulikidis, N. Vulnerability of a Northeast Mediterranean Island to Soil Loss. Can Grazing Management Mitigate Erosion? Water 2019, 11, 1491. [Google Scholar] [CrossRef] [Green Version]
- Borrelli, P.; Panagos, P.; Langhammer, J.; Apostol, B.; Schütt, B. Assessment of the cover changes and the soil loss potential in European forestland: First approach to derive indicators to capture the ecological impacts on soil-related forest ecosystems. Ecol. Indic. 2016, 60, 1208–1220. [Google Scholar] [CrossRef]
- Myronidis, D.I.; Emmanouloudis, D.A.; Mitsopoulos, I.A.; Riggos, E.E. Soil erosion potential after fire and rehabilitation treatments in Greece. Environ. Modeling Assess. 2010, 15, 239–250. [Google Scholar] [CrossRef]
- Mallinis, G.; Gitas, I.Z.; Tasionas, G.; Maris, F. Multitemporal monitoring of land degradation risk due to soil loss in a fire-prone Mediterranean landscape using multi-decadal Landsat imagery. Water Resour. Manag. 2016, 30, 1255–1269. [Google Scholar] [CrossRef]
- Karamesouti, M.; Petropoulos, G.P.; Papanikolaou, I.D.; Kairis, O.; Kosmas, K. Erosion rate predictions from PESERA and RUSLE at a Mediterranean site before and after a wildfire: Comparison & implications. Geoderma 2016, 261, 44–58. [Google Scholar]
- Efthimiou, N.; Psomiadis, E.; Panagos, P. Fire severity and soil erosion susceptibility mapping using multi-temporal Earth Observation data: The case of Mati fatal wildfire in Eastern Attica, Greece. Catena 2020, 187, 104320. [Google Scholar] [CrossRef]
- Wu, J.; Nunes, J.P.; Baartman, J.E.; Urbina, C.F. Testing the impacts of wildfire on hydrological and sediment response using the OpenLISEM model. Calibration and evaluation for a burned Mediterranean forest catchment. Catena 2021, 207, 105658. [Google Scholar] [CrossRef]
- FAO; ITPS. Status of the World’s Soil Resources (SWSR)–Main Report; Food and Agriculture Organization of the United Nations and Intergovernmental Technical Panel on Soils: Rome, Italy, 2015; Available online: http://www.fao.org/3/a-i5199e.pdf (accessed on 15 January 2022).
- Montanarella, L.; Pennock, D.J.; McKenzie, N.; Badraoui, M.; Chude, V.; Baptista, I.; Mamo, T.; Yemefack, M.; Singh Aulakh, M.; Yagi, K.; et al. Soil conservation in Europe: Wish or reality? Land Degrad. Dev. 2016, 27, 1547–1551. [Google Scholar]
- Panagos, P.; Imeson, A.; Meusburger, K.; Borrelli, P.; Poesen, J.; Alewell, C. Soil conservation in Europe: Wish or reality? Land Degrad. Dev. 2016, 27, 1547–1551. [Google Scholar] [CrossRef] [Green Version]
- Keesstra, S.D.; Bouma, J.; Wallinga, J.; Tittonell, P.; Smith, P.; Cerdà, A.; Montanarella, L.; Quinton, J.N.; Pachepsky, Y.; van der Putten, W.H. The significance of soils and soil science towards realization of the United Nations Sustainable Development Goals. Soil 2016, 2, 111–128. [Google Scholar] [CrossRef] [Green Version]
- EC. Proposal for a Establishing a Framework for the Protection of Soil and Amending. Directive 2004/35/EC COM, 232. Available online: https://eur-lex.europa.eu/legal-content/EN/TXT/?uricelex:52006PC0232 (accessed on 20 October 2021).
- Robinson, N. The European union’s environmental agenda. Environ. Politics 1999, 8, 188–192. [Google Scholar] [CrossRef]
- Myers, N.; Mittermeier, R.A.; Mittermeier, C.G.; Da Fonseca, G.A.; Kent, J. Biodiversity hotspots for conservation priorities. Nature 2000, 403, 853–858. [Google Scholar] [CrossRef]
- Diffenbaugh, N.S.; Giorgi, F. Climate change hotspots in the CMIP5 global climate model ensemble. Clim. Change 2012, 114, 813–822. [Google Scholar] [CrossRef] [Green Version]
- Velázquez, J.; Tejera, R.; Hernando, A.; Núñez, M.V. Environmental diagnosis: Integrating biodiversity conservation in management of Natura 2000 forest spaces. J. Nat. Conserv. 2010, 18, 309–317. [Google Scholar] [CrossRef]
- Borrelli, P.; Alewell, C.; Alvarez, P.; Anache, J.A.A.; Baartman, J.; Ballabio, C.; Bezak, N.; Biddoccu, M.; Cerdà, A.; Chalise, D.; et al. Soil erosion modelling: A global review and statistical analysis. Sci. Total Environ. 2020, 780, 146494. [Google Scholar] [CrossRef]
- Panagos, P.; Katsoyiannis, A. Soil erosion modelling: The new challenges as the result of policy developments in Europe. Environ. Res. 2019, 172, 470–474. [Google Scholar] [CrossRef]
- Kinnell, P.I.A. A review of the design and operation of runoff and soil loss plots. Catena 2016, 145, 257–265. [Google Scholar] [CrossRef]
- Stefanidis, P.; Sapountzis, M.; Stathis, D. Sheet erosion after fire at the urban forest of Thessaloniki (Northern Greece). Silva Balc. 2002, 2, 65–77. [Google Scholar]
- Boix-Fayos, C.; Martínez-Mena, M.; Arnau-Rosalén, E.; Calvo-Cases, A.; Castillo, V.; Albaladejo, J. Measuring soil erosion by field plots: Understanding the sources of variation. Earth Sci. Rev. 2006, 78, 267–285. [Google Scholar] [CrossRef]
- Vanmaercke, M.; Poesen, J.; Radoane, M.; Govers, G.; Ocakoglu, F.; Arabkhedri, M. How long should we measure? An exploration of factors controlling the inter-annual variation of catchment sediment yield. J. Soils Sediments 2012, 12, 603–619. [Google Scholar] [CrossRef] [Green Version]
- Kosmadakis, I.; Tsardaklis, P.; Ioannou, K.; Zaimes, G.N. A Novel Fully Automated Soil Erosion Monitoring System. In Proceedings of the 7th International Conference on Information and Communication Technologies in Agriculture, Food and Environment (HAICTA 2015), Kavala, Greece, 17–20 September 2015; pp. 80–84. [Google Scholar]
- Myronidis, D.; Arabatzis, G. Evaluation of Greek post-fire erosion mitigation policy through spatial analysis. Pol. J. Environ. Stud. 2009, 18, 865–872. [Google Scholar]
- Myronidis, D.; Ioannou, K.; Sapountzis, M.; Fotakis, D. Development of a sustainable plan to combat erosion for an island of the Mediterranean region. Fresenius Environ. Bull. 2010, 19, 1694–1702. [Google Scholar]
- Panagos, P.; Borrelli, P.; Poesen, J.; Ballabio, C.; Lugato, E.; Meusburger, K.; Montanarella, L.; Alewell, C. The new assessment of soil loss by water erosion in Europe. Environ. Sci. Policy 2015, 54, 438–447. [Google Scholar] [CrossRef]
- Kumar, N.; Singh, S.K.; Reddy, G.P.; Mishra, V.N.; Bajpai, R.K. Remote Sensing and Geographic Information System in Water Erosion Assessment. Agric. Rev. 2020, 41, 116–123. [Google Scholar] [CrossRef]
- Polykretis, C.; Alexakis, D.D.; Grillakis, M.G.; Manoudakis, S. Assessment of intra-annual and inter-annual variabilities of soil erosion in Crete Island (Greece) by incorporating the Dynamic “Nature” of R and C-Factors in RUSLE modeling. Remote Sens. 2020, 12, 2439. [Google Scholar] [CrossRef]
- Wang, H.; Zhao, H. Dynamic Changes of Soil Erosion in the Taohe River Basin Using the RUSLE Model and Google Earth Engine. Water 2020, 12, 1293. [Google Scholar] [CrossRef]
- Ouadja, A.; Benfetta, H.; Porto, P.; Flanagan, D.C.; Mihoubi, M.K.; Omeir, M.R.; Graia, M.; Ghosal, K.; Talchabhadel, R. Mapping potential soil erosion using RUSLE, Remote Sensing, and GIS: A case study in the watershed of Oued El Ardjem, Northwest Algeria. Arab. J. Geosci. 2021, 14, 1945. [Google Scholar] [CrossRef]
- Benavidez, R.; Jackson, B.; Maxwell, D.; Norton, K. A review of the (Revised) Universal Soil Loss Equation ((R) USLE): With a view to increasing its global applicability and improving soil loss estimates. Hydrol. Earth Syst. Sci. 2018, 22, 6059–6086. [Google Scholar] [CrossRef] [Green Version]
- Batista, P.; Laceby, J.; Davies, J.; Carvalho, T.; Tassinari, D.; Silva, M.; Curi, N.; Quinton, J. A framework for testing large-scale distributed soil erosion and sediment delivery models: Dealing with uncertainty in models and the observational data. Environ. Model. Softw. 2021, 137, 104961. [Google Scholar] [CrossRef]
- Karydas, C.G.; Panagos, P.; Gitas, I.Z. A classification of water erosion models according to their geospatial characteristics. Int. J. Digit. Earth 2014, 7, 229–250. [Google Scholar] [CrossRef]
- Ghosal, K.; Bhattacharya, S.D. Identification of the relationship between temporally varying land surface temperature of winter season with the cover management factor of revised universal soil loss equation: A case study from upper Bakreshwar river basin. In Geoinformatics in Research & Development; Banerjee, T., Ed.; South Asian Institute for Advanced Research and Development (SAIARD): Kolkata, India, 2021; pp. 60–71. [Google Scholar]
- Aksoy, H.; Kavvas, M.L. A review of hillslope and watershed scale erosion and sediment transport models. Catena 2005, 64, 247–271. [Google Scholar] [CrossRef]
- Nearing, M.A.; Lane, L.J.; Lopes, V.L. Modeling soil erosion. In Soil Erosion Research Methods, 2nd ed.; Lal, R., Ed.; Taylor and Francis: Routledge, UK, 2017; pp. 127–158. [Google Scholar]
- Igwe, P.U.; Onuigbo, A.A.; Chinedu, O.C.; Ezeaku, I.I.; Muoneke, M.M. Soil erosion: A review of models and applications. Int. J. Adv. Eng. Res. Sci. 2017, 4, 237341. [Google Scholar]
- Wischmeier, W.H.; Smith, D.D. Predicting Rainfall Erosion Losses, a Guide to Conservation Planning; U.S. Department of Agriculture: Washington, DC, USA, 1978; Volume 537, p. 62.
- Renard, K.G.; Foster, G.R.; Weesies, G.A.; Porter, J.P. RUSLE: Revised universal soil loss equation. J. Soil Water Conserv. 1991, 46, 30–33. [Google Scholar]
- Alewell, C.; Borrelli, P.; Meusburger, K.; Panagos, P. Using the USLE: Chances, challenges and limitations of soil erosion modelling. Int. Soil Water Conserv. Res. 2019, 7, 203–225. [Google Scholar] [CrossRef]
- Ghosal, K.; Bhattacharya, S.D. A review of RUSLE model. J. Indian Soc. Remote Sens. 2020, 48, 689–707. [Google Scholar] [CrossRef]
- Napoli, M.; Cecchi, S.; Orlandini, S.; Mugnai, G.; Zanchi, C.A. Simulation of field-measured soil loss in Mediterranean hilly areas (Chianti, Italy) with RUSLE. Catena 2016, 145, 246–256. [Google Scholar] [CrossRef]
- Efthimiou, N.; Lykoudi, E.; Karavitis, C. Comparative analysis of sediment yield estimations using different empirical soil erosion models. Hydrol. Sci. J. 2017, 62, 2674–2694. [Google Scholar] [CrossRef]
- Gianinetto, M.; Aiello, M.; Polinelli, F.; Frassy, F.; Ravazzani, M.R.G.; Bocchiola, D.; Chiarelli, D.; Soncini, A.; Vezzoli, R. D-Rusle: A dynamic model to estimate potential soil erosion with satellite time series in the Italian alps. Eur. J. Remote Sens. 2019, 52, 34–53. [Google Scholar] [CrossRef]
- Zaimes, G.N.; Emmanouloudis, D.; Iakovoglou, V. Estimating soil erosion in Natura 2000 areas located on three semi-arid Mediterranean islands. J. Environ. Biol. 2012, 33, 277. [Google Scholar] [PubMed]
- Médail, F. The specific vulnerability of plant biodiversity and vegetation on Mediterranean islands in the face of global change. Reg. Environ. Chang. 2017, 17, 1775–1790. [Google Scholar] [CrossRef] [Green Version]
- Kougioumoutzis, K.; Kokkoris, I.P.; Panitsa, M.; Trigas, P.; Strid, A.; Dimopoulos, P. Plant diversity patterns and conservation implications under climate-change scenarios in the mediterranean: The case of Crete (Aegean, Greece). Diversity 2020, 12, 270. [Google Scholar] [CrossRef]
- Tapoglou, E.; Vozinaki, A.E.; Tsanis, I. Climate Change Impact on the Frequency of Hydrometeorological Extremes in the Island of Crete. Water 2019, 11, 587. [Google Scholar] [CrossRef] [Green Version]
- Tzoraki, O.; Kritsotakis, M.; Baltas, E. Spatial Water Use Efficiency Index towards resource sustainability: Application in the island of Crete, Greece. Int. J. Water Resour. Dev. 2015, 31, 669–681. [Google Scholar] [CrossRef]
- Tsanis, I.K.; Koutroulis, A.G.; Daliakopoulos, I.N.; Jacob, D. Severe climate-induced water shortage and extremes in Crete. Clim. Change 2011, 106, 667–677. [Google Scholar] [CrossRef]
- Koutroulis, A.G.; Tsanis, I.K.; Daliakopoulos, I.N. Seasonality of floods and their hydrometeorologic characteristics in the island of Crete. J. Hydrol. 2010, 394, 90–100. [Google Scholar] [CrossRef]
- Kourgialas, N.N.; Karatzas, G.P. A flood risk decision making approach for Mediterranean tree crops using GIS; climate change effects and flood-tolerant species. Environ. Sci. Policy 2016, 63, 132–142. [Google Scholar] [CrossRef]
- Morianou, G.G.; Kourgialas, N.N.; Psarras, G.; Koubouris, G.C. Mapping sensitivity to desertification in Crete (Greece), the risk for agricultural areas. J. Water Clim. Change 2018, 9, 691–702. [Google Scholar] [CrossRef]
- Corine Land Cover (CLC). Available online: https://land.copernicus.eu/pan-european/corine-land-cover/clc2018 (accessed on 10 November 2021).
- Panagos, P.; Borrelli, P.; Meusburger, K.; van der Zanden, E.H.; Poesen, J.; Alewell, C. Modelling the effect of support practices (P-factor) on the reduction of soil erosion by water at European scale. Environ. Sci. Policy 2015, 51, 23–34. [Google Scholar] [CrossRef]
- Panagos, P.; Van Liedekerke, M.; Jones, A.; Montanarella, L. European Soil Data Centre: Response to European policy support and public data requirements. Land Use Policy 2012, 29, 329–338. [Google Scholar] [CrossRef]
- Brini, I.; Alexakis, D.D.; Kalaitzidis, C. Linking Soil Erosion Modeling to Landscape Patterns and Geomorphometry: An Application in Crete, Greece. Appl. Sci. 2021, 11, 5684. [Google Scholar] [CrossRef]
- Bezak, N.; Borrelli, P.; Panagos, P. Exploring the possible role of satellite-based rainfall data to estimate inter-and intra-annual global rainfall erosivity. Hydrol. Earth Syst. Sci. Discuss. 2021, 1–27. [Google Scholar] [CrossRef]
- Padulano, R.; Rianna, G.; Santini, M. Datasets and approaches for the estimation of rainfall erosivity over Italy: A comprehensive comparison study and a new method. J. Hydrol. Reg. Stud. 2021, 34, 100788. [Google Scholar] [CrossRef]
- Efthimiou, N.; Lykoudi, E.; Psomiadis, E. Inherent relationship of the USLE, RUSLE topographic factor algorithms and its impact on soil erosion modelling. Hydrol. Sci. J. 2020, 65, 1879–1893. [Google Scholar] [CrossRef]
- Phinzi, K.; Ngetar, N.S. The assessment of water-borne erosion at catchment level using GIS-based RUSLE and remote sensing: A review. Int. Soil Water Conserv. Res. 2019, 7, 27–46. [Google Scholar] [CrossRef]
- De Santos Loureiro, N.; de Azevedo Coutinho, M. A new procedure to estimate the RUSLE EI30 index, based on monthly rainfall data and applied to the Algarve region, Portugal. J. Hydrol. 2001, 250, 12–18. [Google Scholar] [CrossRef]
- Grillakis, M.G.; Polykretis, C.; Alexakis, D.D. Past and projected climate change impacts on rainfall erosivity: Advancing our knowledge for the eastern Mediterranean island of Crete. Catena 2020, 193, 104625. [Google Scholar] [CrossRef]
- Karydas, C.G.; Petriolis, M.; Manakos, I. Evaluating alternative methods of soil erodibility mapping in the Mediterranean Island of Crete. Agriculture 2013, 3, 362–380. [Google Scholar] [CrossRef] [Green Version]
- Rozos, D.; Skilodimou, H.D.; Loupasakis, C.; Bathrellos, G.D. Application of the revised universal soil loss equation model on landslide prevention. An example from N. Euboea (Evia) Island, Greece. Environ. Earth Sci. 2013, 70, 3255–3266. [Google Scholar] [CrossRef]
- Efthimiou, N. The importance of soil data availability on erosion modeling. Catena 2018, 165, 551–566. [Google Scholar] [CrossRef]
- Liampas, S.-A.G.; Stamatiou, C.C.; Drosos, V.C. Comparison of three DEM sources: A case study from Greek forests. In Proceedings of the Sixth International Conference on Remote Sensing and Geoinformation of Environment, Paphos, Cyprus, 26–29 March 2018; Volume 10773. [Google Scholar]
- Nikolakopoulos, K.G. Accuracy assessment of ALOS AW3D30 DSM and comparison to ALOS PRISM DSM create with classical photogrammetric techniques. Eur. J. Remote Sens. 2020, 53, 39–52. [Google Scholar] [CrossRef]
- Florinsky, I.V.; Skrypitsyna, T.N.; Trevisani, S.; Romaikin, S.V. Statistical and visual quality assessment of nearly-global and continental digital elevation models of Trentino, Italy. Remote Sens. Lett. 2019, 10, 726–735. [Google Scholar] [CrossRef]
- Azizian, A.; Brocca, L. Determining the best remotely sensed DEM for flood inundation mapping in data sparse regions. Int. J. Remote Sens. 2020, 41, 1884–1906. [Google Scholar] [CrossRef]
- McCool, D.K.; Foster, G.R.; Mutchler, C.K.; Meyer, L.D. Revised Slope Length Factor for the Universal Soil Loss Equation. Trans. ASAE 1989, 30, 1387–1396. [Google Scholar] [CrossRef]
- Desmet, P.J.J.; Govers, G. A GIS procedure for automatically calculating the USLE LS factor on topographically complex landscape units. J. Soil Water Conserv. 1996, 51, 427–433. [Google Scholar]
- Pilesjö, P.; Hasan, A. A Triangular Form-based Multiple Flow Algorithm to Estimate Overland Flow Distribution and Accumulation on a Digital Elevation Model. Trans. GIS 2014, 18, 108–124. [Google Scholar] [CrossRef] [Green Version]
- Polykretis, C.; Grillakis, M.G.; Alexakis, D.D. Exploring the impact of various spectral indices on land cover change detection using change vector analysis: A case study of Crete Island, Greece. Remote Sens. 2020, 12, 319. [Google Scholar] [CrossRef] [Green Version]
- Van der Knijff, J.M.; Jones, R.J.A.; Montanarella, L. Soil Erosion Risk Assessment in Europe; European Soil Bureau and European Commission: Brussels, Belgium, 2000. [Google Scholar]
- Alexandridis, T.K.; Sotiropoulou, A.M.; Bilas, G.; Karapetsas, N.; Silleos, N.G. The effects of seasonality in estimating the C-factor of soil erosion studies. Land Degrad. Dev. 2015, 26, 596–603. [Google Scholar] [CrossRef]
- Kokkoris, I.; Dimopoulos, P.; Xystrakis, F.; Tsiripidis, I. National scale ecosystem condition assessment with emphasis on forest types in Greece. One Ecosyst. 2018, 3, e25434. [Google Scholar] [CrossRef] [Green Version]
- Kokkoris, I.; Mallinis, G.; Bekri, E.; Vlami, V.; Zogaris, S.; Chrysafis, I.; Mitsopoulos, I.; Dimopoulos, P. National Set of MAES Indicators in Greece: Ecosystem Services and Management Implications. Forests 2020, 11, 595. [Google Scholar] [CrossRef]
- EEA Linkages of Species and Habitat Types to MAES Ecosystems. Available online: https://www.eea.europa.eu/data-and-maps/data/linkages-of-species-and-habitat (accessed on 15 January 2022).
- Amani, M.; Ghorbanian, A.; Ahmadi, S.A.; Kakooei, M.; Moghimi, A.; Mirmazloumi, S.M.; Moghaddam, S.H.A.; Mahdavi, S.; Ghahremanloo, M.; Parsian, S.; et al. Google earth engine cloud computing platform for remote sensing big data applications: A comprehensive review. IEEE J. Sel. Top. Appl. Earth Obs. Remote Sens. 2020, 13, 5326–5350. [Google Scholar] [CrossRef]
- Panagos, P.; Karydas, C.; Ballabio, C.; Gitas, I. Seasonal monitoring of soil erosion at regional scale: An application of the G2 model in Crete focusing on agricultural land uses. Int. J. Appl. Earth Obs. Geoinf. 2014, 27, 147–155. [Google Scholar] [CrossRef]
- Karydas, C.G.; Sekuloska, T.; Silleos, G.N. Quantification and site-specification of the support practice factor when mapping soil erosion risk associated with olive plantations in the Mediterranean island of Crete. Environ. Monit. Assess. 2009, 149, 19–28. [Google Scholar] [CrossRef]
- Kouli, M.; Soupios, P.; Vallianatos, F. Soil erosion prediction using the Revised Universal Soil Loss Equation (RUSLE) in a GIS framework, Chania, Northwestern Crete, Greece. Environ. Geol. 2009, 57, 483–497. [Google Scholar] [CrossRef]
- Kazamias, A.P.; Sapountzis, M. Spatial and temporal assessment of potential soil erosion over Greece. Water 2017, 59, 315–321. [Google Scholar]
- Panagos, P.; Ballabio, C.; Borrelli, P.; Meusburger, K. Spatio-temporal analysis of rainfall erosivity and erosivity density in Greece. Catena 2016, 137, 161–172. [Google Scholar] [CrossRef]
- Allen, D.C.; Cardinale, B.J.; Wynn-Thompson, T. Plant biodiversity effects in reducing fluvial erosion are limited to low species richness. Ecology 2016, 97, 17–24. [Google Scholar] [CrossRef]
- Marino, D.; Gaglioppa, P.; Schirpke, U.; Guadagno, R.; Marucci, A.; Palmieri, M.; Pellegrino, D.; Gusmerotti, N. Assessment and governance of Ecosystem Services for improving management effectiveness of Natura 2000 sites. Bio-Based Appl. Econ. 2014, 3, 229–247. [Google Scholar]
- Pellegrino, D.; Schirpke, U.; Marino, D. How to support the effective management of Natura 2000 sites? J. Environ. Plan. Manag. 2017, 60, 383–398. [Google Scholar] [CrossRef]
- Papanastasis, V.P.; Bautista, S.; Chouvardas, D.; Mantzanas, K.; Papadimitriou, M.; Mayor, A.G.; Koukioumi, P.; Papaioannou, A.; Vallejo, R.V. Comparative assessment of goods and services provided by grazing regulation and reforestation in degraded Mediterranean rangelands. Land Degrad. Dev. 2015, 28, 1178–1187. [Google Scholar] [CrossRef] [Green Version]
- Kaltsas, D.; Panayiotou, E.; Kougioumoutzis, K.; Chatzaki, M. Overgrazed shrublands support high taxonomic, functional and temporal diversity of Mediterranean ground spider assemblages. Ecol. Indic. 2019, 103, 599–609. [Google Scholar] [CrossRef]
- Kostadinov, S.; Stanojevic, G. Design of Technical Erosion Control Measures for the Reconstruction of Degraded Steep Lands. In Reclaimed Land: Erosion Control, Soils and Ecology; Haigh, M., Balkema, A., Eds.; Brookfield: Rotterdam, The Netherlands, 2000; pp. 111–136. [Google Scholar]
- Andreu, V.; Khuder, H.; Mickovski, S.; Spanos, I.; Norris, J.; Dorren, L.; Nicoll, B.; Achim, A.; Rubio, J.; Luc, J.; et al. Ecotechnological solutions for unstable slopes: Ground bio- and eco-engineering techniques and strategies. In Slope Stability and Erosion Control: Ecotechnological Solutions; Norris, J.E., Stokes, A., Mickovski, S.B., Cammeraat, E., van Beek, R., Nicoll, B.C., Achim, A., Eds.; Springer: Dordrecht, The Netherlands, 2008; pp. 211–275. [Google Scholar]
- Lasanta, T.; Arnáez, J.; Oserín, M.; Ortigosa, L.M. Marginal lands and erosion in terraced fields in the Mediterranean mountains. Mt. Res. Dev. 2001, 21, 69–76. [Google Scholar] [CrossRef] [Green Version]
Figure 1.
(a) Location map of the study area and (b) designated Natura 2000 sites.

Figure 2.
Flowchart of the applied methodology for R-factor estimation in GEE environment.

Figure 3.
Flowchart of the applied methodology for C-Factor estimation in GEE environment.

Figure 4.
The overall workflow of the methodology.

Figure 5.
Spatial distribution of (a) rainfall erosivity factor (R), (b) soil erodibility factor (K), (c) topographic factor (LS), (d) cover management factor (C), (e) support practice factor (P) and (f) soil loss.
Figure 5.
Spatial distribution of (a) rainfall erosivity factor (R), (b) soil erodibility factor (K), (c) topographic factor (LS), (d) cover management factor (C), (e) support practice factor (P) and (f) soil loss.

Figure 6.
Spatial distribution of species richness according the Article 17 of the Directive 92/43/EEC.
Figure 6.
Spatial distribution of species richness according the Article 17 of the Directive 92/43/EEC.

Figure 7.
Mean annual soil loss per species richness grid.

Figure 8.
Mean annual soil loss per SCI areas (sitecode).

Figure 9.
The SCIs areas with mean annual soil loss above (red polygons) and below (green polygons) the study area’s average.
Figure 9.
The SCIs areas with mean annual soil loss above (red polygons) and below (green polygons) the study area’s average.

Figure 10.
Mean annual soil loss per habitats of (a) national importance, (b) priority and (c) Annex I.
Figure 10.
Mean annual soil loss per habitats of (a) national importance, (b) priority and (c) Annex I.

Figure 11.
Mean annual soil loss per MAES ecosystem category.

Figure 12.
Mean annual soil loss in Mediterranean EU Member States [48].
Figure 12.
Mean annual soil loss in Mediterranean EU Member States [48].


Table 1.
Summary of spatial datasets used in this study.
| Dataset | Data Source | Data Accessibility | Spatial Resolution | Format |
|---|---|---|---|---|
| Sentinel-2 Level 2A imagery | European Space Agency (ESA) via GEE | ee.ImageCollection (“COPERNICUS/S2_SR”) | 10 m | raster |
| ALOS DEM | Japan Aerospace Exploration Agency (JAXA) | https://www.eorc.jaxa.jp/ALOS/en/url_change_info_e.htm (accessed on 10 October 2021) | 30 m | raster |
| Daily Rainfall | ERA5-Land European Centre for Medium-Range Weather Forecasts (ECMWF) via GEE | ee.ImageCollection (“ECMWF/ERA5/DAILY”) | ~9 km | raster |
| Soil Map of Greece | Greek Ministry of the Environment & Energy | http://mapsportal.ypen.gr/maps/289 (accessed on 10 October 2021) | - | vector |
| Support practices | European Soil Data Center (ESDAC) | https://esdac.jrc.ec.europa.eu/content/support-practices-factor-p-factor-eu (accessed on 10 October 2021) | 1 km | raster |
| Species Diversity | Art 17 Directive 92/43/EEC (EIONET) | http://cdr.eionet.europa.eu/gr/eu/art17/envxrm90g/GR_Art17_species_distribution.zip/manage_document (accessed on 10 October 2021) | 10 km | Vector (grid) |
| N2K Terrestrial Habitat type | Greek Ministry of the Environment & Energy | http://mapsportal.ypen.gr/layers/geonode:habitats_egsa87 (accessed on 10 October 2021) | - | vector |
Table 2.
Soil parent material and assigned soil erodibility (K) values.
| Parent Material | K Value |
|---|---|
| Alluvial Deposits | 0.015 |
| Hard Limestone | 0.0008 |
| Flysch | 0.017 |
| Colluvial Limestone | 0.1 |
| Dolomite Limestone | 0.0008 |
| Colluvial Peridotite | 0.1 |
| Granite | 0.2 |
| Peridotite | 0.05 |
| Tertiary deposits | 0.015 |
| Schist | 0.07 |
Table 3.
Mean C-factor values for the main CLC 2018 level 2 categories.
| Corine Land Cover Level 2 | Area (km2) | C-Factor Value |
|---|---|---|
| Scrub and/or herbaceous vegetation associations | 3794.5 | 0.42 |
| Permanent crops | 2366.4 | 0.26 |
| Heterogeneous agricultural areas | 1102.3 | 0.34 |
| Open spaces with little or no vegetation | 410.4 | 0.68 |
| Forests | 299.7 | 0.16 |
| Arable land | 88.15 | 0.50 |
| Pastures | 59.2 | 0.49 |
Table 4.
Classification scheme and correspondence of habitat types to MAES categories.
| MAES Ecosystem Category (Level 1) | MAES Ecosystem Category (Level 2) | MAES Ecosystem Category (Level 3) | Area (km2) |
|---|---|---|---|
| Terrestrial | Woodland and Forests | Floodplain forests (Riparian forest/Fluvial forest) | 10.5 |
| Mediterranean coniferous forests | 311.7 | ||
| Mediterranean deciduous forests | 4.0 | ||
| Mediterranean sclerophyllous forests | 334.9 | ||
| Grasslands | Grasslands | 4.9 | |
| Heathland and shrub | Moors and heathland | 1292.6 | |
| Sclerophyllous vegetation | 40.2 | ||
| Sparsely vegetated | Beaches, dunes, sands | 12.9 | |
| Sparsely vegetated areas | 36.5 | ||
| Wetlands | Inland freshwater and saline marshes | 1.3 | |
| Freshwater | Rivers and lakes | Rivers and lakes | 0.2 |
Publisher’s Note: MDPI stays neutral with regard to jurisdictional claims in published maps and institutional affiliations. |
© 2022 by the authors. Licensee MDPI, Basel, Switzerland. This article is an open access article distributed under the terms and conditions of the Creative Commons Attribution (CC BY) license (https://creativecommons.org/licenses/by/4.0/).
Share and Cite
MDPI and ACS Style
Stefanidis, S.; Alexandridis, V.; Ghosal, K. Assessment of Water-Induced Soil Erosion as a Threat to Natura 2000 Protected Areas in Crete Island, Greece. Sustainability 2022, 14, 2738. https://doi.org/10.3390/su14052738
AMA Style
Stefanidis S, Alexandridis V, Ghosal K. Assessment of Water-Induced Soil Erosion as a Threat to Natura 2000 Protected Areas in Crete Island, Greece. Sustainability. 2022; 14(5):2738. https://doi.org/10.3390/su14052738
Chicago/Turabian StyleStefanidis, Stefanos, Vasileios Alexandridis, and Kaushik Ghosal. 2022. "Assessment of Water-Induced Soil Erosion as a Threat to Natura 2000 Protected Areas in Crete Island, Greece" Sustainability 14, no. 5: 2738. https://doi.org/10.3390/su14052738
Note that from the first issue of 2016, this journal uses article numbers instead of page numbers. See further details here.