
Plate Waste in School Catering in Rezekne, Latvia
by
 , , , , , , and
Jelena Lonska
1,* ,
,
Anda Zvaigzne
1,
Inta Kotane
1,
Inese Silicka
1 ,
,
Lienite Litavniece
1,
Sergejs Kodors
2,
Juta Deksne
1 and
and
Aija Vonoga
1 1
Research Institute for Business and Social Processes, Faculty of Economics and Management, Rezekne Academy of Technologies, LV-4601 Rezekne, Latvia
2
Institute of Engineering, Faculty of Engineering, Rezekne Academy of Technologies, LV-4601 Rezekne, Latvia
*
Author to whom correspondence should be addressed.
Sustainability 2022, 14(7), 4046; https://doi.org/10.3390/su14074046
Submission received: 22 February 2022
/
Revised: 22 March 2022
/
Accepted: 24 March 2022
/
Published: 29 March 2022
(This article belongs to the Topic Sustainable Development and Food Insecurity)
Abstract
:This research was conducted within the framework of a research project aimed at detecting patterns of plate waste and developing recommendations for improving catering in seven schools in Rezekne city (Latvia) by a combination of observation, physical weighing, semi-structured interview approaches and statistical analysis of variance (ANOVA). We identified plate waste (including wasted beverages), which remains after the lunch of schoolchildren in grades 1–7, examining a total of 7064 lunch samples. The originality of the research is due to the fact that a unified menu was designed for the field study, which ensured the same field study conditions in all the schools. The results of the research revealed that the average weight of plate waste per schoolchild reached 178 g, and the total weight of plate waste accounted for 28.75% of the total weight of food served. No significant differences in plate waste weight between various age groups and grades of schoolchildren were found, which was also confirmed by a one-way ANOVA test. An analysis of plate waste by food category showed that beverages accounted for the largest share of total plate waste (42.24%), followed by staple food (28.38%) and meat (11.77%). An analysis of plate waste shares of food served (%) by food category revealed a similar situation: the largest share of food served was made up of beverages (37.56%), followed by staple food (36.48%) and meat (28.77%). An analysis of the monetary value of food waste showed that the average cost of plate waste (excluding beverage) per schoolchild was EUR 0.236, which represented 16.6% of the national and municipal funding of EUR 1.42 per portion. Given the research results, the authors have concluded that in order to reduce the amount of plate waste generated by Rezekne city schools, school menus should be based not only on the requirements prescribed by relevant legal acts but also on cooking processes that meet the requirements of modern consumers (learners), e.g., by following trends in cooking practices in society to make the learners interested in consuming school food.
1. Introduction
1.1. Food Waste and Sustainability
Every year, significant amounts of food are lost or discarded throughout the food supply chain, from primary production to final consumption. Over the last 10 years, food loss (FL) and food waste (FW) have become a global problem with a negative impact on sustainable resource consumption, nature and the environment as well as on the development of society [1,2,3,4].
Reducing FW is an important prerequisite for achieving the Sustainable Development Goals set in 2015, namely SDG 2 (ending hunger) and SDG 12 (ensuring responsible consumption and production patterns) by 2030 [5]. In 2019, according to the Food and Agriculture Organization of the United Nations (FAO), 690 million people or 8.9% of the world’s population suffered from malnutrition, and this figure is projected to increase significantly due to the negative impacts of the COVID-19 pandemic [6].
1.2. Theoretical Framework
Although there is no general definition of food loss and waste, the FAO [7] states that food loss and waste are “the masses of food lost or wasted in the part of food chains leading to edible products going to human consumption”. Therefore, food originally intended for human consumption but later addressed to other non-food uses (e.g., animal feed, energy recovery) must be considered as lost or wasted [8].
Kaur et al. (2021) distinguish FL from FW and refer to “food loss” as the food that leaves the food supply chain at its initial stages, while “food waste” refers to the food that is not consumed at the places of consumption [9].
Ishangulyyev et al. (2019) conclude that FL represents a decrease in the weight of edible food at the first three stages of the food supply chain due to infrastructure constraints, environmental factors and quality or safety standards. In contrast, FW is food that was originally produced or processed for human consumption but was not consumed. FW also includes food that is edible or spoiled at the time of disposal. FW occurs at the distribution and marketing and consumption stages of the food supply chain (see Figure 1) [10].
Falasconi et al. (2015) define FW as all foods that are removed from the food supply chain but still retain their nutritional value and meet safety standards [11].
Papargyropoulou et al., (2014), developing a food waste prevention strategy, recommend distinguishing avoidable food waste (foods or components of food that are generally considered edible) from unavoidable food waste (includes foods that are not normally edible, e.g., bones, fruit peel, etc.) [12].
FW at the consumption stage of the food supply chain could also be categorized according to when the waste occurs. For example, FW produced during the purchase and storage of food is considered to be “spoilage food waste” (or “storage waste” [13]); “preparation food waste” occurs during cooking, i.e., due to peeling, cutting, as well as overproduction or food surplus; “leftover waste” occurs when the prepared food is not served to the consumer (unserved food); “plate waste” pertains to the food served to the consumer but not eaten [14].
García-Herrero et al., (2019), conducting a study on FW in Italian schools, divided FW into the following categories: (1) preparation waste: the FW that occurs during cooking (might be both avoidable and unavoidable); (2) serving waste: the food left on the serving dishes and not served to the students in the canteen (avoidable FW); (3) plate waste: the food left by students on their plates in the canteen (avoidable FW) [15].
Clarke et al. (2015) distinguish the following kinds of FW: (1) waste generated during preparation and cooking, (2) discards due to preparation of too much food, (3) discards due to expired use-by or open dates, (4) spoilage food waste and (5) plate waste [16].
A summary of the opinions available in the scientific literature on the kinds of FW at the consumption stage of the food supply chain is presented in Figure 2.
As shown in Figure 2, FW generated at the final stage of the food supply chain, i.e., the consumption stage, can be both avoidable and unavoidable. Most of the FW generated at the food consumption stage is avoidable food waste, which in turn consists of waste from spoiled food (it is discarded due to changes in quality that make it undesirable and unfit for human or animal consumption, as evidenced by signs of deterioration such as unpleasant odor, changes in texture and appearance), plate waste (food served to consumers that remains uneaten on the plate and is discarded), served food leftovers (food served but not eaten (intact) and discarded) and waste from leftovers (food prepared in excess of what was needed (overproduction) and not served go to waste). It should be noted that waste from leftovers comprises food preparation waste together with non-edible food (unavoidable food waste), which usually are not edible, e.g., peel of fruit or vegetables, bones, seeds, etc.
It should be mentioned that in 2019, at the distribution and marketing as well as consumption stages of the food supply chain, approximately 931 million tons of FW were generated, of which 61% were by the household sector, 26% by the catering sector and 13% by the retail sector. This means that around the world, 17% of the total food production was wasted (11% by the household sector, 5% by the catering sector and 2% by the retail sector), thereby increasing environmental pollution and unnecessary pressure on nature [17].
In this research field, researchers have a common understanding of the term plate waste, which refers to the amount of food served to consumers that remains uneaten on their plates and is subsequently discarded.
Plate waste is the largest source of food waste in schools [18], followed by food waste from serving lines [19]. It should be noted that most of the researchers working on food waste analysis focus specifically on plate waste analysis [11,12,15,16,18,20,21,22,23,24,25]. Derqui and Fernandez (2017) have found that approximately 80% of research in this field directly relates to plate waste analysis, without auditing FW at the entire stage of food consumption, i.e., not considering the FW generated during cooking in the kitchen or the FW from serving lines [19].
1.3. Literature Review
The plate waste generated in schools is influenced by multiple factors. The authors of the present paper have analyzed a number of research papers focusing on this field with the aim of summarizing the factors contributing to plate waste in schools (see Table 1).
The summary of factors influencing plate waste shown in Table 1 reveals that the authors have divided the factors into exogenous or objective ones that do not depend on schoolchildren’s (consumers’) subjective preferences and physiological condition, but tend to influence their eating behavior externally, and endogenous or subjective factors arising from the schoolchildren’s (consumers’) psychological and/or physiological condition.
Derqui et al. [27] point out that the catering sector is one of the largest sources of FW generated by schools, which also provides an opportunity to improve the dietary habits of the population and educate the public about sustainable resource consumption and development, thereby affecting the food system in the future. According to a delegated decision of the European Commission [61], from 2020 onwards, the measurement of FW and leftovers needs to be carried out at each stage of the food supply chain. This also applies to the FW generated by educational institutions, which has been little researched in Latvia to date. Research on waste generated by an educational institution have been conducted by some enthusiasts, whereas larger-scale research that would allow for drawing overall conclusions and continuous science-based, qualitative research, has not been carried out in Latvia yet.
1.4. Scope of Research
The purpose of this pilot study was to identify the patterns of plate waste in seven schools of Rezekne city (Latvia) and to develop recommendations for stakeholders on how to reduce the amount of plate waste by a combination of observation (the design of the dining hall, the placement of food on a plate, the way food was served and the process and time of enjoying the meal were observed), physical weighing and semi-structured interview approaches, as well as statistical analysis of variance.
The novelty of the research stems from the fact that no research studies have been conducted in Latvia that placed a focus on zero-waste food consumption, including plate waste in schools, and although there are publicly available reports on this problem by individual researchers, the reports are not considered scientifically relevant for further research. The present pilot study provides a first sign of examining the normally ignored amount of plate waste in Latvian schools. The authors believe that the results of this study are a good basis for further analysis in this field, and can help to inform stakeholders and policy makers in the field of education about the current situation in catering in Latvian educational institutions. This study also aims to promote the implementation of the recommendations developed (supported by the fact that the preliminary survey results were discussed with the head of the Education Department of the Rezekne State City and the observed schools’ representatives, as well as the fact that the research report was submitted to the Ministry of Education and Science of Latvia).
The fact that we performed an analysis of plate waste instead of an analysis of all food waste generated by school canteens could be considered to be a research limitation. This was due to the insufficient capacity of human resources involved in the present research. Otherwise, a comprehensive analysis of food waste would provide comprehensive information on the amount of food wasted.
2. Materials and Methods
2.1. Sample Selection
A field study was conducted in schools of Rezekne city in the Latgale region of the Republic of Latvia. Rezekne is the seventh largest city in the Republic of Latvia and the largest eastern border city of the European Union, with a total population not exceeding 30 thousand (Figure 3). The field study was performed in 7 publicly funded schools (one primary school, one gymnasium and 5 secondary schools). In all the schools, catering was provided on-site and funded from the Rezekne city municipality budget and the state budget. The selection of the surveyed schools was based on the fact that there were only 8 schools in the city, one school that was not surveyed was a school for children with special needs, and catering was managed differently in this school, therefore, it was excluded from the analysis.
During the observations, emphasis was put on quantitative measurements of plate waste by examining 7064 school lunch plates.
Figure 3.
Map with the observation location; authors’ construction.

Regarding the research methodology, the following plate-waste parameters were identified by the field study:
- number and grades of schoolchildren;
- work organization in school canteens or opportunities for a caterer to prepare food, the way of serving food, the capacity of the dining hall and other factors;
- free lunches for schoolchildren (grades entitled to free lunches funded jointly by the national and local governments were selected for the field study in Rezekne city schools: grades 1–7).
During the research, the authors, based on a number of legal acts [62,63,64], as well as after getting acquainted with the public food procurement situation in Latvia [65] and requests for tenders to procure food and catering services placed on the website of the Procurement Monitoring Bureau [66] and the Electronic Procurement System [67], concluded that in Latvia, catering in educational institutions was organized in the following ways:
- Type 1. The municipality in whose territory the schools are located organizes catering for schoolchildren on its own, equipping canteens in the schools in accordance with the requirements of safe food handling and creating special workplaces for canteen personnel;
- Type 2. Catering for schoolchildren is provided on an outsourced basis, i.e., the entire service is purchased from catering companies, delivering the food to the schools and serving it in accordance with the requirements stipulated in the procurement contract;
- Type 3. Catering for schoolchildren is provided as an outsourced service, provided that the catering provider prepares the food on-site in the schools.
In all the schools covered by the field study, the catering process was organized in closed-type canteens (hereinafter referred to as school canteens), which were provided by the local government of Rezekne city (Type 1). This means that catering services are supplied only to certain social groups—only to those who study, work or stay in the institutions that have an operating catering facility. The local government of Rezekne city covers the maintenance costs of school canteens, salaries of school canteen personnel, purchases of food and other functions related to catering services (control of compliance with hygiene requirements, monitoring of compliance with healthy nutrition requirements, etc.).
In accordance with the provisions of legal acts, including Cabinet Regulation No. 614 “Procedures for Calculating, Allocating and Using Funding Provided from the State Budget for Catering to Learners” [68] and the Rezekne City Council’s Education Board’s Order No. 197 of 3 September 2020 “On Catering for Learners” [69], in the schools of Rezekne city, catering is provided free of charge for the following schoolchildren:
- grades 1–4, free lunches are funded by the national government;
- grades 5–7, free lunches are funded by the local government of Rezekne city.
Only schoolchildren in grades 1–7 were included in the field study sample, i.e., those who were entitled to free lunch, and in this case, the schoolchildren had a specific lunch menu (Table 2). It should be noted that school S1 was a state gymnasium that starts from grade 7; therefore, only the schoolchildren in grade 7 were included in the sample of the field study.
2.2. Description of the Unified Menu and Catering Processes
Before performing plate-waste quantification, it was necessary to design a unified menu for the field study week that would eliminate differences in food availability and ensure laboratory conditions, thereby minimizing the impact of gastronomic distraction on the study. In Rezekne city schools, menus are designed by the canteen employees of each school together with the school nurse in accordance with Cabinet Regulation No. 610 “Hygiene Requirements for Educational Institutions Implementing General Primary Education, General Secondary Education, Professional Basic Education, Vocational Education or Professional Secondary Education Programmes” [70] and Cabinet Regulation No. 172 “Regulations regarding Nutritional Requirements for Learners of Educational Institutions, Clients of Social Care and Social Rehabilitation Institutions and Patients of Medical Institutions” [62], which set dietary requirements and require that the lunch menu include a second course and a soup or dessert. Cabinet Regulation No. 172 restricts the use of salt, sugar and other flavor enhancers in school meals, bans unhealthy foods (e.g., French fries and other foods cooked in oil, mayonnaise, ketchup, tomato sauce, sausages with a meat content of less than 90%, dried, smoked and salted meat and fish). Processed foods such as dumplings and fish fingers may be included in the diet of schoolchildren no more than once a week and only if meeting certain requirements (i.e., contain at least 70% meat or 60% fish; do not contain flavorings (E620–E650) and dyes, do not contain mechanically separated meat, do not contain raw foods produced from genetically modified organisms, contain less than 1.25 g of salt per 100 g of meat and 1.5 g per 100 g of fish) [62]. The menu is agreed and approved by the head of the educational institution or an authorized person.
It should be noted that in the autumn of 2021, in order to reduce the spread of COVID-19 in schools, legislative amendments were made to reduce the number of learners staying in the dining hall for a long time (i.e., food delivery and consumption time was reduced), allowing for one main course instead of two dishes, while at the same time ensuring that it complied with the nutritional requirements stipulated by Cabinet Regulation No. 172.
To design a unified menu, individual structured interviews were conducted with the canteen managers and specialists of the Rezekne city schools with the aim of obtaining information about school menus, schoolchildren’s preferences regarding the food served in each school, the frequency of serving particular foods, the factors influencing whether schoolchildren eat or do not eat the free lunch provided by school canteens, as well as food-waste management. A total of 11 individuals took part in the interviews: 7 canteen managers, 3 canteen specialists and a nurse who was also responsible for designing the school menu. All the interviewed canteen managers and canteen specialists had the professional qualification of a cook, they had at least 5–10 years working experience in school canteen service and had a good understanding of children’s food preferences.
The Interview provided experiential, semi-subjective opinions of the personnel of educational institutions and school canteens about the categories of food that children liked, did not like or were indifferent to. During the interviews, the researchers identified five foods that children preferred (i.e., more than 90% children ate them), five that they ate reluctantly (i.e., only up to 20% preferred them) and five foods that children were indifferent to (i.e., at least 65% preferred them). Based on the information obtained, the responsible employee of the Rezekne City Education Board (a chief specialist in nutrition who knew all the requirements for designing menus) prepared a unified menu for the field study for all the schools, considering the nutrition requirements stipulated by Cabinet Regulation No. 172 (Table 2).
The method for analysis of strengths, neutrals and weaknesses (SNW) was employed to evaluate the dishes prepared at the Rezekne city schools and a typological group index was calculated for the menu according to the equation [71]:
where
- I—typological group index (ranging from 1 to −1);
- S, N, W—number of respective indicators;
- N—number of respondent replies.
The typological group index calculated for the dishes prepared at the Rezekne city schools, which showed the rating of 7 dishes prepared at the schools, was 0.47, i.e., moderately high and positive. An analysis of the Rezekne city school menus showed that schoolchildren were indifferent to a total of 351 dishes prepared at the schools, 82 dishes they ate reluctantly, and 209 dishes they enjoyed (Table 3).
In all the Rezekne city school canteens, serving of the food partly takes the form of self-service, and the food is partly served, i.e., shortly before the lunch break, the school canteen personnel set a table reserved for each class. Only at school S1 is the food served at the canteen distribution point (at the distribution counter) where the schoolchild is given a tray with portioned food plates (except for fruit and glazed curd cheese), which are available in shared dishes on the tables). At the other schools, canteen personnel serve portions of a set meal on the tables (staple food and meats on a single plate), at some schools, vegetables with a set meal could be served on a single plate (e.g., schools S1, S4, S5 and S6), while at schools S2, S3 and S7 vegetables are served in shared dishes on the tables for each class separately. Except for school S1, where soup is served on separate plates for each schoolchild, at schools S2–S7 the soup is served in shared soup pans on the tables for each class (the amount of soup to be served is calculated according to the number of schoolchildren in each class by applying standardized measures and serving cups). A beverage is served in separate glasses for each schoolchild. Except for school S1, where a piece of bread is given to each schoolchild individually on the tray, in schools S2–S7 the slices of bread are placed on tables in shared containers according to the number of schoolchildren in each class. At all the schools, fruits (whole unpeeled apples or bananas) are placed on tables in shared containers according to the number of schoolchildren in each class; the way of serving glazed curd cheese, which is served in packaging in shared containers according to the number of schoolchildren in each class, is similar.
2.3. Data Collection
In the present research, the authors have considered plate waste as the amount of food served to schoolchildren that remains uneaten on their plates and is subsequently discarded. The total measured weight of plate waste includes uneaten food and beverages that remain on plates and in glasses, bowls, etc., after free lunches for schoolchildren in grades 1–7 in Rezekne city schools.
The field study was conducted in late September 2021. The field study was first tested at school S1 from 13 to 17 September 2021, evaluating the process of catering management in accordance with the unified menu, which was designed for the needs of the project, including plate-waste weighing. In the period from 20 to 24 September 2021, the field study was conducted simultaneously at schools S2, S3, S4, S5, S6 and S7. At each school, the field study lasted for 5 working days, from Monday to Friday, except for school S1 (grade 7) and school S7 (grades 5–7), where the field study lasted only for 4 days (from Monday to Thursday) because on Friday all the schoolchildren went on study tours and did not have lunch at school.
Each school had a different lunch break schedule. The average lunch time for schoolchildren in grades 1–4 was from 9:30 to 11:30, and for schoolchildren in grades 5–7 it was from 11:30 to 13:00. The researchers arrived at the schools at about 9:00 in the morning and finished their work at about 14:00 (depending on the school) for 5 consecutive days of the field study. Before the meal, the researchers identified the expected number of schoolchildren, considering the number of schoolchildren in the classes examined, and during the lunch they noted the number of schoolchildren who actually participated in the meal.
The research employed the following methods: observation, photography and direct manual weighing of plate waste by food category and by grade of schoolchildren [15,38,41,72,73]. The authors of the paper observed the design of the dining hall, the interior, the ergonomics, the table setting, the placement of food on a plate, the way food was served and the process and time of enjoying the meal. During the field study, the schoolchildren were asked to leave their dirty dishes on the tables (usually the schoolchildren had to bring their own dirty dishes to a special place). When the schoolchildren had finished their lunch, the researchers measured the plate waste by dividing the plate waste into the following food categories: soup, staple food, meat/fish, salad/vegetables, beverage, bread, fruit, curd products (glazed curd cheese). Later, each bucket was weighed, and the data on the weight of the waste were entered into a waste registration protocol. The following measurement tools were used to quantify the plate waste: two kinds of high-density polymer buckets (a large bucket with a capacity of 2 L, weight 61 g, and a small bucket with a capacity of 1 L, weight 35 g; each bucket was marked with the food category and the number of the class for which it was intended) and electronic kitchen scales (model—Clatronic KW3412, art. No. 271680, measuring range—up to 5 kg, units of measurement—grams).
2.4. Data Analysis
All the survey data were analyzed using the data-processing program IBM SPSS (version 26) and MS Excel.
The research employed a statistical analysis method—one-way ANOVA—to identify the effect of an independent variable on the dependent variable, i.e., whether the average plate waste, measured in grams per schoolchild, differed significantly across grades. The independent variable was a qualitative variable representing several, at least three, categories; therefore, for the analysis of variance, the grades were divided into three groups: grades 1–2, grades 3–4 and grades 5–7. An appropriate sample was selected for each of the grade groups, and the metric values of dependent variables were recorded for the sample.
To determine the cost of plate waste, the research also calculated the monetary value of waste (see equation No. 3) [19]. However, given that most of the waste consisted of liquid waste (beverages), as well as the fact that the most important component of this food category was water, the weight of plate waste excluding beverage waste per schoolchild and the cost of plate waste excluding beverages were also calculated (see equations No. 4 and No. 5).
3. Results
In total, 7064 schoolchildren were involved in the field study; of the total, 4105 or 58.11% were in grades 1–4, and 2959 or 41.89% were in grades 5–7. The total number of schoolchildren who actually ate lunch was equivalent to the number of portions of food served (Table 4).
It should be noted that the number of participants in the field study was significantly affected by COVID-19. For example, in school S4, grade 3 (24 schoolchildren) was in self-isolation throughout the week, and grade 7 (28) was in self-isolation from Tuesday. In school S7, grade 6 (25) was in self-isolation throughout the week. The number of participants in the field study was most significantly affected by COVID-19 in school S5: from Monday to Wednesday, 9 classes with a total of 212 schoolchildren, on Thursday 8 classes with a total of 201 schoolchildren and on Friday 7 classes with a total of 177 schoolchildren were in self-isolation.
The results of the interview with the personnel of the schools and their canteens showed that no food waste sorting nor food waste inventory were performed in any of the schools included in the field study. However, school S6 sorted food waste into fractions, i.e., solid and liquid food waste. At school S5, however, waste from vegetable preprocessing was partially sorted.
This is because the local government of Rezekne city has not entered into contracts with any waste-management company to dispose of FW generated by schools and pre-school educational institutions, as Rezekne waste management companies do not provide biodegradable waste-disposal services. Currently, such services are available only in the regions of Riga and Pieriga. Sorting biodegradable waste needs to be introduced throughout Latvia by the end of 2023. According to the principles of a circular economy, disposing of food waste is the least desirable option. However, if this cannot be avoided, food waste needs to be collected separately from other municipal waste. It should be noted that the management of biodegradable waste, including the management and control of food waste, is very poorly implemented in Latvia, which still makes the population overpay for the service received and hinders the fulfillment of national commitments to achieve the goals of the EU economy [74].
In the schools examined, some of the solid FW, e.g., cereals, potato, meat, etc., were often used informally for pet food. If there was no one to give such FW to, it was disposed of into general waste containers. However, beverage and soup waste were discharged into sewerage.
The field study revealed that the average weight of plate waste per schoolchild per day ranged from 142 g (school S6) to 268 g (school S4) (Table 5).
As shown in Table 5, the field study identified differences in the average weight of plate waste per schoolchild between the youngest schoolchildren (i.e., grades 1–4) and older ones (i.e., grades 5–7) (except for school S1 that starts from grade 7). Higher weights of plate waste were found for grades 1–4 in 5 out of the 6 schools (S2, S4, S5, S5 and S7). The average weight of plate waste per schoolchild registered in grades 1–4 exceeded that registered in grades 5–7 by 10 g, or 5.81%.
To perform a one-way ANOVA test, the schoolchildren of the seven Rezekne city schools were divided into three grade groups: grades 1–2, grades 3–4 and grades 5–7. The analysis of variance showed that the average weight of plate waste per schoolchild, in grams, was not affected by the grade which the schoolchildren were in (Table 6).
The share of plate waste (%) in the total weight of food served was calculated to identify the share of the food served that went to waste.
The share of plate waste at the schools examined was on average 28.75% of the total weight of food served, which means that on average almost one-third of the served food went to waste (Table 7).
As shown in Table 7, a lower share of plate waste than the average was identified in schools S2, S5, S6 and S7, while a higher share than the average was found in schools S1, S3 and S4.
The shares of plate waste in the total weight of food served were analyzed also by grade group, revealing a 1.68%-point difference between grades 1–4 and 5–7: the average for grades 1–4 was 29.46%, while the average for grades 5–7 was 27.78% (Figure 4).
Figure 4 shows that a higher share of plate waste in the total weight of food served than the average for grades 1–4 (i.e., 29.46%) was found in two out of the six schools, i.e., school S4—44.08% and school S7—29.72%; in school S3 this coincided with the average of 29.46%; however, in three schools the figure was below the average, i.e., school S2—23.73%, school S5—26.97%, school S6—24.79%. In the group of grades 5–7, a higher figure than the average (i.e., 27.78%) was found in three out of the seven schools, i.e., school S1—34.89%, school S3—34.16% and school S4—42.55%, whereas in four schools it was below the average: school S2—23.14%, school S5—22.43%, school S6—18.72% and school S7—23.73%. It should be noted that the largest share of plate waste in the total weight of food served among grades 1–4 (44.08%) and grades 5–7 (42.55%) was found in school S4.
The food served during the field study at the Rezekne city school canteens consisted of the following food categories: soup, staple food, fish or meat, beverages, fruit, vegetables, bread and curd products (glazed curd cheese). An analysis of the data obtained during the field study on the weight of plate waste by food waste category revealed that in all the schools, the largest share of plate waste in the total weight of plate waste was made up of beverages at 42.24%, followed by staple food (potato, pasta)—28.38% and meats—11.77% (Table 8). The authors of the paper note that in the present research, the plate waste analysis involved beverages (because all of them contain calories), as this method was suggested as the most comprehensive accounting of plate waste [75]. In some research studies, this method is called tray waste measurement, as all foods and beverages on schoolchildren trays are included in the total amount of food wasted [76].
As shown in Table 8, an analysis of plate waste shares by food waste category revealed a similar situation, as the largest share of plate waste was represented by beverages, followed by staple food and meat, which was found in three out of the seven schools: S2 (43.18%, 29.90% and 13.25%, respectively), S3 (53.31%, 22.25% and 12.97%) and S7 (55.76%, 22.24% and 7.00%). In two out of the seven schools, i.e., S5 and S6, the largest share of plate waste was found for staple food (S5—40.77% and S6—34.19%), followed by beverages (S5—22.33% and S6—31.49%) and meat (S5—16.22% and S6—14.53%). In school S4, however, the largest share of plate waste was found for beverages (37.92%), followed by staple food (29.72%) and soup (12.09%). In school S1, the largest share of plate waste was found for beverages (45.89%), followed by staple food (19.21%) and fruit (14.24%). Such shares of plate waste by food category were directly related to the weight of food served by food category, as beverages, staple food and meat had the largest share in the total weight of food served. Therefore, it would be more correct to analyze the shares of plate waste by food category by considering the weight of each food category served, using Equation (2):
At the same time, the calculations also showed which categories of food served the schoolchildren consumed the most and the least (Table 9).
As shown in Table 9, the largest share of plate waste in the total weight of food served was represented by beverages at 37.56%, followed by staple food—36.48% and meat—28.77% (see Figure 5). An analysis of the data by school revealed that there were categories of food that the schoolchildren consumed less than 50% of, i.e., the share of plate waste exceeded half of the total weight of food served, for example, in school S4, the share of plate waste for the category of staple food reached 57.62%, in schools S4 and S5, the shares of plate waste for the category of vegetables were 50.38% and 53.62%, respectively, and for the category of beverages, the figures were the highest in schools S1 (51.56%) and S3 (51.46%), followed by school S4—50.83%.
The authors of the paper point out that in Latvia, the planning and management of menus in educational institutions is conducted strictly in accordance with the dietary guidelines stipulated by various legal acts. After analyzing the menus used in the Rezekne city schools, the authors concluded that the menus were based on the government’s recommendations on nutrition for children; however, given the large share of meat and staple food in the total weight of food served during the field study, in this case compliance with the dietary guidelines did not guarantee a balanced diet for children. The large number of wasted beverages also indicated that the beverages given to the schoolchildren did not taste good. In the Rezekne city schools, beverages were poured into glasses and served on tables for each schoolchild individually. The observations during the field study showed that the schoolchildren often did not even taste their beverages. Due to COVID-19 restrictions, the intact beverages could not be given to other schoolchildren; therefore, they went to waste.
The monetary value of plate waste [19] was calculated using Equation (3); the weight of plate waste excluding beverage waste per schoolchild (see Equation (4)) and the cost of plate waste excluding beverages (see Equation (5)) were also calculated:
where EUR 1.42 is the cost of free lunch per schoolchild that is provided for learners in grades 1–7 in Rezekne city schools and funded from the state and local government budgets in accordance with the requirements of legal acts [68].
Average Weight of Plate Waste excluding Beverage Waste per Schoolchild, g = Average Weight of Plate Waste per Schoolchild, g − Average Weight of Beverage Waste per Schoolchild, g
The calculation results by school and by grade group, as well as for the entire period of the field study, are presented in Table 10.
After analyzing the costs of plate waste (excluding beverage waste) per schoolchild, shown in Table 10, it could be concluded that the average cost of plate waste (excluding beverage waste) per schoolchild was EUR 0.236 (EUR 1666.88/7064 samples). An analysis by grade revealed that except for schools S3 and S4, the figure was higher in all the other schools in the group of grades 1–4; in school S4, this figure was the same for both groups of grades, while in school S3, the cost of plate waste (excluding beverage waste) per schoolchild was lower in grades 1–4 than in grades 5–7. It should be noted that the highest cost of plate waste (excluding beverage waste) per schoolchild was found in school S4 at EUR 0.38. The average cost of plate waste (excluding beverage waste) per schoolchild found in the group of grades 1–4 was EUR 0.243 (EUR 997.06/4105 samples), and in the group of grades 5–7 it was EUR 0.226 (EUR 669.82/2959 samples), which made up a difference of EUR 0.017, or 7.5%. Given that the cost of plate waste for the period of the field study, i.e., for 5 working days (in some schools for 4 working days), totaled EUR 1666.88, per day it was about EUR 333.38, per month or on average 21 working days it was about EUR 7000.00.
4. Discussion
4.1. Comparison with Other Studies
The management of catering in the schools of Rezekne city differs significantly from the approach applied in several European countries and the USA, where it mostly takes the form of buffet-type catering. In Rezekne city schools, before each lunch break, tables reserved for individual classes are set by placing portions of a set meal (staple food and meats on a single plate) according to the expected number of lunch participants, while vegetables can be served together with a set meal on a single plate or served in shared dishes on tables for each class individually, while soup is usually served in shared dishes on each table. The menus are designed based on government recommendations on child nutrition and are agreed and approved by the head of each educational institution.
The results of the quantification of plate waste that was performed at the canteens of the Rezekne city schools, examining the plate waste of 7064 school lunches for schoolchildren in grades 1–7, showed that the average weight of plate waste per schoolchild reached 178 g: in the group of grades 1–4 it was 182 g, in the group of grades 5–7 it was 172 g. The share of the total weight of plate waste in the total weight of food served was 28.75%: in the group of grades 1–4 the figure was 29.46%, while in the group of grades 5–7 it was 27.78%.
It could be concluded that the share of plate waste calculated by the field study exceeded that identified by previous research studies conducted in other European countries and the USA. This could be due to the fact that in the present field study, the beverages that were not consumed were also included in the weight of plate waste. Many plate waste measurement studies considered only solid plate waste (excluding beverage waste), and often the components of plate waste were not discussed in detail at all. Eriksson et al. identified that 23% of food served in Swedish school canteens went to waste. Waste from beverages was not recorded or quantified in this study [35]. A research study on Italian schools by Garcia-Herrero et al. found that the average weight of food waste (excluding beverage waste) per primary school pupil was 136 g, of which about 95% was plate waste and about 5% was served food waste [15]. In an audit of food waste (excluding beverage waste) in Spanish schools, Derqui and Fernandez (2017) found that the largest amount of food waste came from plate waste, i.e., ranging from 21 g to 47 g per pupil per day in primary schools and from 23.7 g to 88.0 g per student per day in secondary schools, concluding that the plate waste tended to increase with the age of students [19]. This observation showed the importance of taking measurements for the quantification of food waste by age group. Conducting food waste research at three U.S. schools in Florida, Wilkie et al. found that school A had the highest average food waste per pupil among all the three schools, even though the kitchen did not generate a measurable amount of food waste. This was due to the higher number of school-provided meals in school A and the number of primary schoolchildren who were more selective, or the fact that they were served larger portions than they could eat. In this research, the amount of wasted milk was measured separately [37]. Buzby and Guthrie, and Niaki et al. also concluded that food waste tended to decrease with the age of schoolchildren [20,48]. Steen et al., in contrast, found that the amount of plate waste tended to increase with the age of schoolchildren [38]. The results of our field study showed that no significant differences in the share of plate waste in the total weight of food served were observed between the groups of grades; it was found that there was a difference of 1.68 percentage points between the groups of grades 1–4 and 5–7: the average for grades 1–4 was 29.46%, while for grades 5–7 it was 27.78%.
An analysis of plate waste by food category showed that beverages accounted for the largest share of total plate waste (42.24%), followed by staple food (28.38%) and meat (11.77%). An analysis of plate waste shares of food served (%) by food category revealed a similar situation: the largest share of food served was made up of beverages (37.56%), followed by staple food (36.48%) and meat (28.77%). The results of the present field study, broken down by plate-waste food category, differed from the results of other research studies conducted worldwide, which were as follows: in Italian schools, analyzing plate waste by food category, it was found that about 22.4% pasta or rice, 31% livestock food products and 43.6% vegetables were wasted [73]; in a research study conducted in Boston schools, Cohen et al. (2013) found that students discarded about 19% of their food, including 47% fruit, 25% milk and 73% vegetables [24]; a research study of students in grades 3 to 8 in four U.S. schools found that the share of vegetable waste reached 58.9% [77]; research studies conducted in China found that vegetables accounted for the largest share of plate waste, i.e., 42% [78] and 31% to 53% [41]. It could be concluded that vegetables were wasted the most, and this was a very common situation all over the world [20,23].
The results of the present field study on vegetable plate waste were as follows: the share of vegetables in the total amount of plate waste was only 4.89%, while the share of discarded vegetables in the total amount of vegetables served was 23.90%, which was the fourth largest plate waste food category. The authors of the paper attribute this to the relatively small share of vegetables in the school menu (only fresh vegetables such as fresh cucumbers, tomatoes, carrots and cabbage), which accounted for only 4–8% of the total weight of food included in the school menu. This mostly depended on the insufficient funding for free lunches (i.e., only EUR 1.42), which limited the possibility to introduce different kinds of vegetables to the menu. It is also necessary to consider the fact that Latvia is located in Northern Europe, where fresh vegetables such as cucumbers, tomatoes, peppers, etc. are mostly available at the end of summer when their prices are the lowest, yet during the school year their prices increase significantly, which does not encourage the diversification of the menu.
4.2. Monetary Value of Plate Waste
Regarding the monetary value of food waste, as noted by Derqui and Fernandez, such a measurement was very seldom taken by researchers due to the fact that the research objectives rarely related to costs [19].
The aim of the present research was not to perform a detailed analysis of the monetary value of food waste. However, given the fact that in Rezekne city, lunches for schoolchildren in grades 1–7 are funded by the national or local governments whose main source of revenue is personal taxes, in this case it was worth calculating the monetary value of food waste. To make the calculation of plate-waste costs as correct as possible, the weight of beverages was deducted from the total weight of plate waste, as the authors of the paper believed that the most significant component of any beverage was water, which was cheaper than, for example, meat or vegetables. The calculations showed that the average cost of plate waste (excluding beverage waste) per schoolchild was estimated at EUR 0.236 (or 16.6% of the cost of a portion of free lunch at EUR 1.42).
Given that the cost of plate waste for the period of the field study, i.e., for 5 working days (in some schools for 4 working days) totaled EUR 1666.88, per day it was about EUR 333.38, and per month or on average 21 working days it was about EUR 7000.00. Due to the different price levels across various countries, it is difficult to compare our figures in terms of whether they are high or low. However, given that the cost of one free lunch portion is EUR 1.42, almost 5000 schoolchildren a month could be provided with free lunch for this funding. Additionally, this is a significant figure, considering that the number of schoolchildren in grades 1–7 in Rezekne city schools was 2176: the monetary value of plate waste would be enough to provide free lunch for schoolchildren in the grades for about 2 days a month.
4.3. Policy Recommendations
One of the research methods was observation. The researchers observed the atmosphere in the dining halls of the school canteens, the interior, the table setting, the way the food was placed on the plate, the way the food was served for lunch and the process and time for enjoying the food. The plate-waste analysis was only one of the activities of the research project that developed recommendations for several areas of school catering management: designing of school menus, organization of the catering process, assessment of catering infrastructure and equipment, school canteen personnel, food waste management, etc.; for example, one of the recommendations developed was as follows (1) designing and implementing an education and communication strategy in schools, which is focused on sustainable and healthy food consumption. This recommendation is based on the idea of education and communication as the most effective approach to changing learners’ food-consumption behavior [79]. Food waste in school canteens could be reduced by educating learners and school personnel, thereby changing their behaviors [37,80,81], especially given that childhood food consumption behaviors and habits tend to continue into adulthood [20]. An awareness of food waste, healthy eating and waste needs to be raised among both learners and school personnel (teachers, administrators, kitchen personnel) [27,82,83,84]. Often it is one-way communication, through posters or table talkers, which conveys messages such as “Eat as much as you can—but throw away as little as you can” [85]. In addition, schools were recommended to integrate nutrition education and healthy food awareness into the school canteen environment, using a competency approach to the curriculum.
The use of various digital tools to track plate waste also allows the responsible personnel to gain an understanding of why the meal is wasted, as well as providing food planning, which could have a positive effect on the amount of waste in the long term [85]. One of the results of our research project was the development of a prototype of an e-mentor tool that is able to predict the quantity of food required for educational institutions with the aim of reducing food waste. The mathematical calculations for the prototype of the e-mentor tool showed that if the lunch break was less than 20 min (considering also the time it takes for schoolchildren to get to the canteen and go back to the classroom after the lunch), the weight of plate waste increased exponentially. By means of the prototype of the e-mentor tool, it is possible to predict not only the effect of the lunch break duration on the amount of plate waste but also to identify the effects of other parameters such as schoolchildren’s attitudes to certain categories of food and competitive food consumption (e.g., food brought from home) [86]. The authors of the paper plan to develop the e-mentor tool within future research projects so that it would be practically applicable in Rezekne city schools.
The other recommendations developed pertain to:
(2) the focus of school administration on the sustainability of food resources, which means that the more school administrators and teachers focus on sustainability, the larger the potential for waste-reduction initiatives [27,87];
(3) diversification of school menus, including identifying learners’ wishes for designing a menu [11,27], as well as the revision of and improvement in nutritional guidelines considering the changing demand for food by learners in today’s conditions, but based on the consumption of healthy food. It is highly recommended to review the menu periodically and to not include dishes that are not preferred by the learners [88];
(4) careful planning of the quantity of food to be prepared. Forecasting canteen attendance can help canteens to identify the number of learners they need to provide catering for, i.e., plan the demand [89]. Derqui et al. (2018) point out that timely and fast communication between the school administration and the kitchen about the actual number of learners is needed in order to be able to adjust the quantity of food prepared [27]. Previous research studies have shown that canteen attendance forecasting can reduce food waste and save financial resources [82,89,90,91]. The authors of the paper concluded that in the Rezekne city schools, due to external circumstances (mainly because of sick schoolchildren or the COVID-19 pandemic), the number of schoolchildren participating in lunch on a given day was variable. This is one of the risk factors in food waste, as from the organizational perspective, the educational institution does not always have a system in place that allows the catering provider to receive timely information on the actual number of schoolchildren on a given day to avoid unnecessary food production;
(5) prudent planning of lunch breaks and dining hall environment adaptation. Several research studies have examined the impacts of changes in the dining hall on food waste, e.g., the implementation of the Smarter Lunchrooms Movement (SLM) strategy [92] and its impact on the consumption of fruit, vegetables and dairy products by learners [31,93,94]. Research studies show that the implementation of fruit and vegetable-oriented marketing activities in schools significantly increase the consumption of the foods [95,96,97]. However, an extensive research study by Cohen et al. on school food promotion strategies conducted in 2021 showed that in the long term, the interventions yielded conflicting results, meaning that not all school food promotion methods included in the SLM strategy actually worked. The best results could be achieved by applying the holistic approach, e.g., giving students an opportunity to choose meal components (especially fruit and vegetables), improving the taste of food, offering cut fruit, allowing more time for lunch breaks (~ 30 min), limiting access to competitive foods, etc. [98].
(6) the way the food is served. Liu et al. (2016) have concluded that it is buffet-type catering that is more effective in serving food in schools, as it makes students more flexible in relation to the food choice, taste and weight (compared with a way of serving food that is of an oppressive nature) [78]. However, Simanovska points out that in some schools in Latvia, the Food and Veterinary Service inspectors objected to the possibility for schoolchildren to choose the components and size of the portion themselves, stating that this could be contrary to strict legal requirements concerning a certain amount of nutrients to be provided to every schoolchild. Nevertheless, the official opinion of the National Food and Veterinary Service states that it is acceptable for schoolchildren to choose their own food and portion size if the average nutritional requirements for every child are met [99]. Methods of serving foods that make it practically difficult for schoolchildren to consume them should be avoided [26]. The supply of unpeeled and uncut fruit to schoolchildren significantly increases the amount of plate waste [100]. The size of plates also plays an important role in placing the food in an attractive way for schoolchildren. The field study found that in most of the schools examined, the plate size was too small, often the food on the plate was placed in such a way that the components of each food were not visible, which made a negative impact on the schoolchildren’s attitudes to the food;
(7) modern kitchen equipment and professional kitchen personnel. The amount of food waste generated by schools is influenced by the diverse resources of their canteens, both physical (facilities and infrastructure) and human (school and canteen personnel). Some of the resources are structural, e.g., the size and equipment of the kitchen or canteen, while human resources are more closely linked to the school administration’s focus on sustainability [19,27]. The appearance and taste of food are influenced by factors such as the cooking skills of kitchen personnel, the quality of the food, cooking equipment and the storage of foods [27,41]. Despite the fact that 70.91% of school canteen personnel involved in the field study had the required qualifications to perform the responsibilities of a cook, it was recommended to develop a training plan for the school canteen personnel to acquire or improve the skills and knowledge required for the job. Regarding improvements in school canteen infrastructure, the schools were recommended to purchase modern technological equipment to prepare food by applying newer, more food-friendly methods, e.g., convection ovens or combination ovens. It is also necessary to consider the fact that the Rezekne school canteens mainly used manual work; therefore, equipment was needed that could automate many processes, e.g., a machine for portioning semi-finished foods, etc.
The authors of the paper believe that within the research project, significant work was conducted and basic information about the management of catering in Rezekne schools was obtained on which to build on future research. This future research would relate to the implementation of individual recommendations for the management of catering, as well as the improvement of the e-mentor tool with the aim of applying it in practice at school canteens.
5. Conclusions
Within the research project “E-mentor as a Transformation tool for Ensuring Zero-Waste Food Consumption in Educational Institutions” No. lzp-2020/2-0115, funded by the Latvian Council of Science, an analysis of plate waste was performed in seven schools of Rezekne city, and recommendations for stakeholders on how to reduce the amount of plate waste were developed. It should be noted that, to date, no research studies have been conducted in Latvia placing a focus on zero-waste food consumption, including plate waste generated by educational institutions.
The distinguishing feature of the present research was that during the week of the field study, a unified menu was introduced into all the schools examined, which eliminated differences in food availability and ensured the same research conditions, thereby reducing the impact of factors influencing gastronomic choices on the study.
The research results showed that in Rezekne city schools, the average weight of plate waste per schoolchild reached 178 g. The weight of plate waste accounted for 28.75% of the total weight of food served. The figures were higher than those obtained by earlier research studies conducted worldwide, and the authors of the paper explain this by a different methodology for measuring plate waste—the present field study also took into account beverages because all of them contain calories, and this method is considered to be the most comprehensive accounting of plate waste. The field study did not find significant differences in the average weight of plate waste between different age groups of schoolchildren: in the group of grades 1–4 it was 182 g, in the group of grades 5–7 it was 172 g. Regarding the share of plate waste in the total weight of food served, in the group of grades 1–4 the figure was 29.46%, while in the group of grades 5–7 it was 27.78%. A one-way analysis of variance showed that the average weight of plate waste per schoolchild, in grams, was not affected by the grade which the schoolchildren were in.
After analyzing the amounts of plate waste by food category, the authors of the paper found that the results obtained differed from those of previous research studies conducted worldwide, which found that vegetables were wasted the most. In the schools of Rezekne city, the largest share of plate waste in the total weight of plate waste was made up of beverages (42.24%), followed by staple food (28.38%) and meat (11.77%). An analysis of plate waste shares of food served (%) by food category revealed a similar situation: the largest share of food served was made up of beverages (37.56%), followed by staple food (36.48%) and meat (28.77%). The authors of the paper explain this via the relatively small share of fresh vegetables in the school menu, which, in the opinion of the authors, depends on insufficient national and municipal funding for school lunches, which does not allow the schools to diversify their menus with a variety of fresh vegetables.
The aim of the present research was not to perform a detailed analysis of the monetary value of food waste. However, given the fact that in Rezekne city, lunches for schoolchildren in grades 1–7 are funded by the national or local governments whose main source of revenue is personal taxes, in this case it was worth calculating the monetary value of food waste. To make the calculation of plate waste costs as correct as possible, the weight of beverages was deducted from the total weight of plate waste. The calculations showed that the average cost of plate waste (excluding beverage waste) per schoolchild was estimated at EUR 0.236, or 16.6% of the cost of a portion of free lunch at EUR 1.42.
Given the research results, the authors conclude that in order to reduce the amount of plate waste generated by Rezekne city schools, school menus should be based not only on the requirements prescribed by relevant legal acts but also on modern learners’ understanding of nutrition, their perception of food consumption and whether it is in line with their understanding of a “modern” and self-evident process. It is necessary to ensure that the schools’ cooking processes meet the requirements of modern consumers (learners) by introducing cooking techniques that are understandable and familiar to them (e.g., offering smoothies). By following the trends in cooking practices in society, it is possible not only to increase the consumption of school food but also to make the learners interested in consuming school food.
Nowadays, children’s eating habits have changed significantly. Many dishes that are preferred by school menu makers and children’s parents are not aligned with children’s understanding of a delicious and healthy diet. The observations made by the authors of the paper revealed that in relation to competitive foods, children often chose a food that they consider healthy, and its physical volume was smaller than the volume of free lunch food. Most often, a competitive food chosen by learners did not meet the requirements of a healthy diet. The authors of the paper believe that serving school food in a modern way could change learners’ attitude to the food offered. For example, packed small carrots, chopped peppers or cucumbers placed in disposable snack dishes allows schoolchildren to take the vegetables with them and eat them later. Expanding schoolchildren’s choices of the kinds of free lunch dishes could reduce the amount of plate waste. The authors recommend that schoolchildren be provided with food choices (e.g., pre-ordering or organizing buffet meals). The authors further recommend reviewing and improving the dietary guidelines by considering changes in the demand for food by learners in today’s world, while also ensuring the guidelines remain based on healthy food consumption.
Author Contributions
All authors: conceptualization. J.L., A.Z., I.S. and L.L.: methodology. J.L., A.Z., I.K., I.S., L.L. and S.K.: formal analysis and investigation. J.L.: writing—original draft preparation. A.Z., I.K., I.S., L.L., S.K., J.D. and A.V.: writing—review and editing. J.L. and S.K.: visualization. J.L. and A.Z.: supervision. A.Z.: project administration. All authors contributed to the study conception and design. All authors have read and agreed to the published version of the manuscript.
Funding
This research is funded by the Latvian Council of Science project “E-mentor as a Transformation Tool for Ensuring Zero-Waste Food Consumption in Educational Institutions”, project No. lzp-2020/2-0115.
Institutional Review Board Statement
Not applicable.
Informed Consent Statement
Not applicable.
Data Availability Statement
All datasets generated during the current study are available from the corresponding author upon reasonable request.
Acknowledgments
We would like to thank Arnolds Dreilings, the head of the Education Department of the Rezekne State City, Rita Deksne, the chief catering specialist, the principals of the participated schools and the heads of the school canteens, as well as volunteer students and colleagues from Rezekne Academy of Technologies for assistance in sorting plate waste at the schools’ canteens.
Conflicts of Interest
The authors declare no conflict of interest.
References
- Gustavsson, J.; Cederberg, C.; Sonesson, U.; van Otterdijk, R.; Meybeck, A. Global Food Losses and Food Waste. Extent, Causes and Prevention; FAO: Rome, Italy, 2011; 37p, Available online: https://www.fao.org/3/i2697e/i2697e.pdf (accessed on 2 January 2022).
- Cuellar, A.D.; Webber, M.E. Wasted Food, Wasted Energy: The Embedded Energy in Food Waste in the United States. Environ. Sci. Technol. 2010, 44, 6464–6469. [Google Scholar] [CrossRef] [PubMed]
- Kummu, M.; de Moel, H.; Porkka, M.; Siebert, S.; Varis, O.; Ward, P.J. Lost food, wasted resources: Global food supply chain losses and their impacts on freshwater, cropland, and fertiliser use. Sci. Total Environ. 2012, 438, 477–489. [Google Scholar] [CrossRef] [PubMed]
- Godfray, H.C.J.; Beddington, J.R.; Crute, I.R.; Haddad, L.; Lawrence, D.; Muir, J.F.; Pretty, J.; Robinson, S.; Thomas, S.M.; Toulmin, C. Food security: The challenge of feeding 9 billion people. Science 2010, 327, 812–818. [Google Scholar] [CrossRef] [Green Version]
- United Nations General Assembly. Transforming Our World: The 2030 Agenda for Sustainable Development; United Nations General Assembly: New York, NY, USA, 2015; Available online: https://www.unfpa.org/resources/transforming-our-world-2030-agenda-sustainable-development (accessed on 2 January 2022).
- FAO; IFAD; UNICEF; WFP; WHO. The State of Food Security and Nutrition in the World 2020: Transforming Food Systems for Affordable Healthy Diets; FAO: Rome, Italy, 2020; 320p. [CrossRef]
- HLPE. Food Losses and Waste in the Context of Sustainable Food Systems: A Report by the High Level Panel of Experts on Food Security and Nutrition of the Committee on World Food Security; High Level Panel of Experts (HLPE): Rome, Italy, 2014; Available online: https://www.fao.org/3/i3901e/i3901e.pdf (accessed on 12 February 2022).
- Amicarelli, V.; Lagioia, G.; Bux, C. Global warming potential of food waste through the life cycle assessment: An analytical review. Environ. Impact Assess. Rev. 2021, 91, 106677. [Google Scholar] [CrossRef]
- Kaur, P.; Dhir, A.; Talwar, S.; Alrasheedy, M. Systematic literature review of food waste in educational institutions: Setting the research agenda. Int. J. Contemp. Hosp. 2021, 33, 1160–1193. [Google Scholar] [CrossRef]
- Ishangulyyev, R.; Kim, S.; Lee, S.H. Understanding Food Loss and Waste—Why Are We Losing and Wasting Food? Foods 2019, 8, 297. [Google Scholar] [CrossRef] [Green Version]
- Falasconi, L.; Vittuari, M.; Politano, A.; Segre, A. Food waste in school catering: An Italian case study. Sustainability 2015, 7, 14745–14760. [Google Scholar] [CrossRef] [Green Version]
- Papargyropoulou, E.; Lozano, R.; Steinberger, J.K.; Wright, N.; Ujang, Z. The food waste hierarchy as a framework for the management of food surplus and food waste. J. Clean. Prod. 2014, 76, 106–115. [Google Scholar] [CrossRef]
- Persson Osowski, C.; Osowski, D.; Johansson, K.; Sundin, N.; Malefors, C.; Eriksson, M. From Old Habits to New Routines—A Case Study of Food Waste Generation and Reduction in Four Swedish Schools. Resources 2022, 11, 5. [Google Scholar] [CrossRef]
- Kasavan, S.; Ali, N.I.B.M.; Ali, S.S.B.S.; Masarudin, N.A.B.; Yusoff, S.B. Quantification of food waste in school canteens: A mass flow analysis. Resour. Conserv. Recycl. 2021, 164, 105176. [Google Scholar] [CrossRef]
- García-Herrero, L.; De Menna, F.; Vittuari, M. Food waste at school. The environmental and cost impact of a canteen meal. Waste Manag. 2019, 100, 249–258. [Google Scholar] [CrossRef] [PubMed]
- Clarke, C.; Schweitzer, Z.; Roto, A. Reducing Food Waste: Recommendations to the 2015 Dietary Guidelines Advisory Committee. 2015, pp. 1–9. Available online: https://static1.squarespace.com/static/5e7ba4837f438244321b6dcd/t/5ea819fdb77e297c58407416/1588075005973/REDUCING+FOOD+WASTE-TUFTS.pdf (accessed on 2 January 2022).
- United Nations Environment Programme. Food Waste Index Report 2021; United Nations Environment Programme (UNEP): Nairobi, Kenya, 2021; Available online: https://www.unep.org/resources/report/unep-food-waste-index-report-2021 (accessed on 12 December 2021).
- Betz, A.; Buchli, J.; Göbel, C.; Müller, C. Food waste in the Swiss food service industry—Magnitude and potential for reduction. Waste Manag. 2015, 35, 218–226. [Google Scholar] [CrossRef]
- Derqui, B.; Fernandez, V. The opportunity of tracking food waste in school canteens: Guidelines for self-assessment. Waste Manag. 2017, 69, 431–444. [Google Scholar] [CrossRef] [PubMed]
- Buzby, J.; Guthrie, J. Plate Waste in School Nutrition Programs—Final Report to Congress; USDA Economic Research Service: Washington, DC, USA, 2002; pp. 1–17. Available online: https://naldc.nal.usda.gov/download/48204/PDF (accessed on 13 December 2021).
- Engström, R.; Carlsson-Kanyama, A. Food losses in food service institutions Examples from Sweden. Food Policy 2004, 29, 203–213. [Google Scholar] [CrossRef]
- Adams, M.A.; Pelletier, R.L.; Zive, M.M.; Sallis, J.F. Salad bars and fruit and vegetable consumption in elementary schools: A plate waste study. J. Acad. Nutr. Diet. 2005, 105, 1789–1792. [Google Scholar] [CrossRef] [PubMed]
- Byker, C.J.; Farris, A.R.; Marcenelle, M.; Davis, G.C.; Serrano, E.L. Food waste in a school nutrition program after implementation of new lunch program guidelines. J. Nutr. Educ. Behav. 2014, 46, 406–411. [Google Scholar] [CrossRef] [Green Version]
- Cohen, J.F.W.; Richardson, S.; Austin, S.B.; Economos, C.D.; Rimm, E.B. School lunch waste among middle school students: Nutrients consumed and costs. Am. J. Prev. Med. 2013, 44, 114–121. [Google Scholar] [CrossRef] [Green Version]
- Marlette, M.A.; Templeton, S.B.; Panemangalore, M. Food type, food preparation and competitive food purchases impact school lunch plate waste by sixth-grade students. J. Acad. Nutr. Diet. 2005, 105, 1779–1782. [Google Scholar] [CrossRef]
- Cordingley, F.; Reeve, S.; Stephenson, J. Food Waste in Schools; Waste & Resources Action Programme (WRAP): Banbury, UK, 2011; Available online: https://wrap.org.uk/resources/report/food-waste-schools (accessed on 17 December 2021).
- Derqui, B.; Fernandez, V.; Fayos, T. Towards more sustainable food systems. Addressing food waste at school canteens. Appetite 2018, 129, 1–11. [Google Scholar] [CrossRef]
- Bergman, E.A.; Buergel, N.S.; Englund, T.F.; Femrite, A. Relationships of meal and recess schedules to plate waste in elementary schools. J. Child Nutr. Manag. 2004, 28, 2. Available online: https://agris.fao.org/agris-search/search.do?recordID=US201600112860 (accessed on 11 December 2021).
- Zandian, M.; Ioakimidis, I.; Bergstrom, J.; Brodin, U.; Bergh, C.; Leon, M.; Shield, J.; Sodersten, P. Children eat their school lunch too quickly: An exploratory study of the effect on food intake. BMC Public Health 2012, 12, 351. [Google Scholar] [CrossRef] [PubMed] [Green Version]
- Blondin, S.A.; Djang, H.C.; Metayer, N.; Anzman-Frasca, S.; Economos, C.D. It’s just so much waste. A qualitative investigation of food waste in a universal free School Breakfast Program. Public Health Nutr. 2015, 18, 1565–1577. [Google Scholar] [CrossRef] [PubMed] [Green Version]
- Cohen, J.F.W.; Jahn, J.L.; Richardson, S.; Cluggish, S.A.; Parker, E.; Rimm, E.B. Amount of Time to Eat Lunch Is Associated with Children’s Selection and Consumption of School Meal Entrée, Fruits, Vegetables, and Milk. J. Acad. Nutr. Diet. 2015, 116, 123–128. [Google Scholar] [CrossRef] [PubMed] [Green Version]
- Zhao, C.; Panizza, C.; Fox, K.; Boushey, C.J.; Byker Shanks, C.; Ahmed, S.; Chen, S.; Serrano, E.L.; Zee, J.; Fialkowski, M.K.; et al. Plate Waste in School Lunch: Barriers, Motivators, and Perspectives of SNAP-Eligible Early Adolescents in the US. J. Nutr. Educ. Behav. 2019, 51, 967–975. [Google Scholar] [CrossRef] [PubMed] [Green Version]
- Martins, M.L.; Rodrigues, S.P.S.; Cunha, L.M.; Rocha, M. Strategies to reduce plate waste in primary schools—Experimental evaluation. Public Health Nutr. 2015, 19, 1517–1525. [Google Scholar] [CrossRef] [Green Version]
- Martins, M.L.; Rodrigues, S.P.S.; Cunha, M.L.; Rocha, A. Factors influencing food waste during lunch of fourth-grade school children. Waste Manag. 2020, 113, 439–446. [Google Scholar] [CrossRef]
- Eriksson, M.; Osowski, P.C.; Malefors, C.; Bjorkman, J.; Eriksson, E. Quantification of food waste in public catering services—A case study from a Swedish municipality. Waste Manag. 2017, 61, 415–422. [Google Scholar] [CrossRef]
- Silvennoinen, K.; Heikkilä, L.; Katajajuuri, J.M.; Reinikainen, A. Food waste volume and origin: Case studies in the Finnish food service sector. Waste Manag. 2015, 46, 140–145. [Google Scholar] [CrossRef]
- Wilkie, A.C.; Graunke, R.E.; Cornejo, C. Food Waste Auditing at Three Florida Schools. Sustainability 2015, 7, 1370–1387. [Google Scholar] [CrossRef] [Green Version]
- Steen, H.; Malefors, C.; Röös, E.; Eriksson, M. Identification and modelling of risk factors for food waste generation in school and pre-school catering units. Waste Manag. 2018, 77, 172–184. [Google Scholar] [CrossRef]
- Bustamente, M.; Afonso, A.; De los Rios, I. Exploratory Analysis of Food Waste at Plate in School Canteens in Spain. Granja 2018, 28, 20–42. [Google Scholar] [CrossRef] [Green Version]
- Shanks, C.B.; Banna, J.; Serrano, E.L. Food Waste in the National School Lunch Program 1978–2015: A Systematic Review. J. Acad. Nutr. Diet. 2017, 117, 1792–1807. [Google Scholar] [CrossRef] [PubMed] [Green Version]
- Huang, Z.; Gao, R.; Bawuerjiang, N.; Zhang, Y.; Huang, X.; Cai, M. Food and Nutrients Intake in the School Lunch Program among School Children in Shanghai, China. Nutrients 2017, 9, 582. [Google Scholar] [CrossRef] [PubMed] [Green Version]
- Fox, M.K.; Gordon, A.; Nogales, R.; Wilson, A. Availability and consumption of competitive foods in US public schools. J. Am. Diet. Assoc. 2009, 109, S57–S66. [Google Scholar] [CrossRef] [PubMed]
- Templeton, S.B.; Marlette, M.A.; Panemangalore, M. Competitive foods increase the intake of energy and decrease the intake of certain nutrients by adolescents consuming school lunch. J. Am. Diet. Assoc. 2005, 105, 215–220. [Google Scholar] [CrossRef]
- Smith, S.L.; Cunningham-Sabo, L. Food choice, plate waste and nutrient intake of elementary- and middle-school students participating in the US National School Lunch Program. Public Health Nutr. 2014, 19, 1255–1263. [Google Scholar] [CrossRef] [Green Version]
- Dinis, D.; Liz Martins, M.; Rocha, A. Plate waste as an indicator of portions inadequacy at school lunch. World Acad. Sci. Eng. Technol. Int. J. Nutr. Food Eng. 2013, 7, 477–480. [Google Scholar]
- Yoon, S.J.; Kim, H.A. Elementary school students’ perception of food waste and factors affecting plate waste rate of school foodservice in the Gyeongnam area. J. Korean Diet. Assoc. 2012, 18, 126–140. [Google Scholar] [CrossRef] [Green Version]
- Boschini, M.; Falasconi, L.; Cicatiello, C.; Franco, S. Why the waste? A large-scale study on the causes of food waste at school canteens. J. Clean. Prod. 2020, 246, 118994. [Google Scholar] [CrossRef]
- Niaki, S.F.; Moore, C.E.; Chen, T.A.; Weber Cullen, K. Younger elementary school students waste more school lunch foods than older elementary school students. J. Acad. Nutr. Diet. 2016, 117, 95–101. [Google Scholar] [CrossRef] [Green Version]
- Zhao, X.; Manning, L. Food plate waste: Factors influencing insinuated intention in a university food service setting. Br. Food J. 2019, 121, 1536–1549. [Google Scholar] [CrossRef]
- Caporale, G.; Policastro, S.; Tuorila, H.; Monteleone, E. Hedonic ratings and consumption of school lunch among preschool children. Food Qual. Prefer. 2009, 20, 482–489. [Google Scholar] [CrossRef]
- De Moura, S.L. Determinants of food rejection amongst school children. Appetite 2007, 49, 716–719. [Google Scholar] [CrossRef] [PubMed]
- Fildes, A.; Mallan, M.K.; Cooke, L.; HM van Jaarsveld, C.; Llewellyn, H.C.; Fisher, A.; Lynne Daniels, L. The relationship between appetite and food preferences in British and Australian children. Int. J. Behav. Nutr. 2015, 12, 116. [Google Scholar] [CrossRef] [Green Version]
- Moore, S.N.; Tapper, K.; Murphy, S. Feeding strategies used by primary school meal staff and their impact on children’s eating. J. Hum. Nutr. Diet. 2010, 23, 78–84. [Google Scholar] [CrossRef]
- Serebrennikov, D.; Katare, B.; Kirkham, L.; Schmitt, S. Effect of classroom intervention on student food selection and plate waste: Evidence from a randomized control trial. PLoS ONE 2020, 15, e0226181. [Google Scholar] [CrossRef]
- Tuorila, H.M.; Palmujoki, I.; Kytö, E.; Törnwall, O.M.; Vehkalahti, K.I. School meal acceptance depends on the dish, student, and context. Food Qual. Prefer. 2015, 46, 126–136. [Google Scholar] [CrossRef]
- Wansink, B.; Just, D.R.; Hanks, A.S.; Smith, L.E. Pre-sliced fruit in school cafeterias: Children’s selection and intake. Am. J. Prev. Med. 2013, 44, 477–480. [Google Scholar] [CrossRef]
- Zampollo, F.; Kniffin, K.M.; Wansink, B.; Shimizu, M. Food plating preferences of children: The importance of presentation on desire for diversity. Acta Paediatr. 2012, 101, 61–66. [Google Scholar] [CrossRef]
- Baik, J.Y.; Lee, H. Habitual plate-waste of 6- to 9-year-olds may not be associated with lower nutritional needs or taste acuity, but undesirable dietary factors. Nutr. Res. 2009, 29, 831–838. [Google Scholar] [CrossRef]
- Casimir, J. Food Waste at the School Level. A Case Study on a Food Waste Reduction Project within School Restaurants in Uppsala, Sweden. Master’s Thesis, Uppsala University, Uppsala, Sweden, 2014. Available online: https://www.diva-portal.org/smash/get/diva2:742150/FULLTEXT01.pdf (accessed on 2 January 2022).
- Painter, K.; Thondhlana, G.; Kua, H.W. Food waste generation and potential interventions at Rhodes University, South Africa. Waste Manag. 2016, 56, 491–497. [Google Scholar] [CrossRef] [PubMed]
- Official Journal of the European Union. Commission Delegated Decision (EU) 2019/1597; Official Journal of the European Union: Brussels, Belgium, 2019; Available online: https://eur-lex.europa.eu/legal-content/LV/TXT/PDF/?uri=CELEX:32019D1597&from=EN (accessed on 2 January 2022).
- Cabinet of Ministers. Cabinet Regulation No. 172 of 13 March 2012 Regulations Regarding Nutritional Requirements for Learners of Educational Institutions, Clients of Social Care and Social Rehabilitation Institutions and Patients of Medical Institutions. 2012. Available online: https://likumi.lv/ta/id/245300 (accessed on 2 January 2022).
- Law on the Supervision of the Handling of Food. 1998. Available online: https://likumi.lv/ta/id/47184(accessed on 2 January 2022).
- Ministry of Health. Recommendations for the Management of Procurement of Catering Services and Food at Educational Institutions, Medical Institutions and Social Care and Social Rehabilitation Institutions. 2017. Available online: https://www.vm.gov.lv/lv/media/5693/download (accessed on 2 January 2022).
- Krivasonoka, I.; Zvirbule, A. Challenges and possible solutions in different stages of public food procurement. In Proceedings of the 26th International Scientific Conference on Economic and Social Development—“Building Resilient Society”, Economic and Social Development: Book of Proceedings, Zagreb, Croatia, 8–9 December 2017; Varazdin Development and Entrepreneurship Agency (VADEA): Varazdin, Croatia, 2017; pp. 343–352. Available online: https://www.researchgate.net/profile/Tomasz-Studzieniecki-2/publication/321717068_TOURIST_ARRIVALS_IN_POLAND_AND_REGIONAL_DEVELOPMENT_-_A_CASE_STUDY_OF_THE_POMERANIA_PROVINCE/links/5a2db61d0f7e9b63e53d3521/TOURIST-ARRIVALS-IN-POLAND-AND-REGIONAL-DEVELOPMENT-A-CASE-STUDY-OF-THE-POMERANIA-PROVINCE.pdf#page=353 (accessed on 2 January 2022).
- Procurement Monitoring Bureau. Procurement of Food and Catering Services. 2020. Available online: https://www.iub.gov.lv/lv/partikas-piegazu-un-edinasanas-pakalpojumu-iepirkumi (accessed on 2 January 2022).
- Electronic Procurement System. Delivery of Food and Beverages to the Organizational Units of the Rezekne City Council. 2021. Available online: https://www.eis.gov.lv/EKEIS/Supplier/Procurement/60505 (accessed on 2 January 2022).
- Cabinet of Ministers. Cabinet Regulation No. 614 of 10 December 2019 Procedures for Calculating, Allocating and Using Funding Provided from the State Budget for Catering to Learners. 2019. Available online: https://likumi.lv/ta/id/311355 (accessed on 2 January 2022).
- Rezekne City Education Board. On Catering for Learners; Rezekne City Education Board: Rezekne, Latvia, 2020. [Google Scholar]
- Cabinet of Ministers. Cabinet Regulation No. 610 of 27 December 2020 Hygiene Requirements for Educational Institutions Implementing General Primary Education, General Secondary Education, Professional Basic Education, Vocational Education or Professional Secondary Education Programmes). 2002. Available online: https://likumi.lv/ta/id/69952 (accessed on 2 January 2022).
- Forand, I. Business Management Technologies; Latvian Education Foundation: Riga, Latvia, 2004; 330p. [Google Scholar]
- Lagorio, A.; Pinto, R.; Golini, R. Food waste reduction in school canteens: Evidence from an Italian case. J. Clean. Prod. 2018, 199, 77–84. [Google Scholar] [CrossRef]
- Boschini, M.; Falasconi, L.; Giordano, C.; Alboni, F. Food waste in school canteens: A reference methodology for large-scale studies. J. Clean. Prod. 2018, 182, 1024–1032. [Google Scholar] [CrossRef]
- Graudins, U. Sorting Will Be Forced by a Higher Waste Fee. In Latvia, Food Waste Is Treated with Caution. 2021. Available online: https://www.la.lv/skirot-piespiedis-dargaka-atkritumu-maksa (accessed on 12 December 2021).
- Roe, B.E.; Apolzan, J.W.; Qi, D.; Allen, H.R.; Martin, C.K. Plate waste of adults in the United States measured in free-living conditions. PLoS ONE 2018, 13, e0191813. [Google Scholar] [CrossRef] [PubMed]
- Hanks, A.S.; Wansink, B.; Just, D.R. Reliability and Accuracy of Real-Time Visualization Techniques for Measuring School Cafeteria Tray Waste: Validating the Quarter-Waste Method. J. Acad. Nutr. Diet. 2013, 114, 470–474. [Google Scholar] [CrossRef] [Green Version]
- Cohen, J.F.W.; Richardson, S.; Parker, E.; Catalano, P.J.; Rimm, E.B. Impact of the New U.S. Department of Agriculture School Meal Standards on Food Selection, Consumption, and Waste. Am. J. Prev. Med. 2014, 46, 388–394. [Google Scholar] [CrossRef] [Green Version]
- Liu, Y.; Cheng, S.; Liu, X.; Cao, X.; Xue, L.; Liu, G. Plate Waste in School Lunch Programs in Beijing, China. Sustainability 2016, 8, 1288. [Google Scholar] [CrossRef] [Green Version]
- Whitehair, K.J.; Carol, W.; Shanklin, C.W.; Brannon, L.A. Written Messages Improve Edible Food Waste Behaviors in a University Dining Facility. J. Acad. Nutr. Diet. 2018, 113, 63–69. [Google Scholar] [CrossRef]
- Wu, Y.; Tian, X.; Li, X.; Yuan, H.; Liu, G. Characteristics, influencing factors, and environmental effects of plate waste at university canteens in Beijing, China. Resour. Conserv. Recycl. 2019, 149, 151–159. [Google Scholar] [CrossRef]
- Izumi, B.T.; Akamatsu, R.; Shanks, C.B.; Fujisaki, K. An ethnographic study exploring factors that minimize lunch waste in Tokyo elementary schools. Public Health Nutr. 2020, 23, 1142–1151. [Google Scholar] [CrossRef]
- Prescott, M.P.; Herritt, C.; Bunning, M.; Cunningham-Sabo, L. Resources, Barriers, and Tradeoffs: A Mixed Methods Analysis of School Pre-Consumer Food Waste. J. Acad. Nutr. Diet. 2019, 119, 1270–1283. [Google Scholar] [CrossRef] [PubMed]
- Pinto, R.S.; dos Santo Pinto, R.M.; Melo, F.F.S.; Campos, S.S.; Marques-dos-Santos Cordovil, C. A simple awareness campaign to promote food waste reduction in a University canteen. Waste Manag. 2018, 76, 28–38. [Google Scholar] [CrossRef] [PubMed]
- Visschers, V.H.M.; Gundlach, D.; Beretta, C. Smaller servings vs. information provision: Results of two interventions to reduce plate waste in two university canteens. Waste Manag. 2020, 103, 323–333. [Google Scholar] [CrossRef] [PubMed]
- Malefors, C.; Sundin, N.; Tromp, M.; Eriksson, M. Testing interventions to reduce food waste in school catering. Resour. Conserv. Recycl. 2022, 177, 105997. [Google Scholar] [CrossRef]
- Kodors, S.; Zvaigzne, A.; Litavniece, L.; Lonska, J.; Silicka, I.; Kotane, I.; Deksne, J. Plate Waste Forecasting Using the Monte Carlo Method for Effective Decision Making in Latvian Schools. Nutrients 2022, 14, 587. [Google Scholar] [CrossRef]
- Filimonau, V.; Coteau, D.A.D. Food waste management in hospitality operations: A critical review. Tour. Manag. 2019, 71, 234–245. [Google Scholar] [CrossRef]
- Ellison, B.; Savchenko, O.; Nikolaus, C.J.; Duff, B.R.L. Every plate counts: Evaluation of a food waste reduction campaign in a university dining hall. Resour. Conserv. Recycl. 2019, 144, 276–284. [Google Scholar] [CrossRef]
- Malefors, C.; Secondi, L.; Marchetti, S.; Eriksson, M. Food waste reduction and economic savings in times of crisis: The potential of machine learning methods to plan guest attendance in Swedish public catering during the Covid-19 pandemic. Socio-Econ. Plan. Sci. 2021, 101041. [Google Scholar] [CrossRef]
- Garre, A.; Ruiz, M.C.; Hontoria, E. Application of Machine Learning to support production planning of a food industry in the context of waste generation under uncertainty. Oper. Res. Perspect. 2020, 7, 100147. [Google Scholar] [CrossRef]
- Yurtsever, M.; Tecim, V. Forecasting Meal Requirements Using Time Series Methods in Organization. In Economic and Financial Challenges for Balkan and Eastern European Countries; Springer International Publishing: Cham, Switzerland, 2020; pp. 243–254. [Google Scholar] [CrossRef]
- Dairy Council of California. Let’s Eat Healthy. Smarter Lunchrooms of CA. Available online: https://www.healthyeating.org/our-cause/partners/slm-california/slm-tools-and-success (accessed on 12 December 2021).
- Greene, K.N.; Gabrielyan, G.; Just, D.R.; Wansink, B. Fruit-Promoting Smarter Lunchrooms Interventions: Results From a Cluster RCT. Am. J. Prev. Med. 2017, 52, 451–458. [Google Scholar] [CrossRef] [Green Version]
- Mumby, S.; Leineweber, M.; Andrade, J. The impact the smarter lunchroom movement strategies have on school children’s healthy food selection and consumption: A systematic review. J. Child. Nutr. Manag. 2018, 42, 19. Available online: https://schoolnutrition.org/uploadedFiles/5_News_and_Publications/4_The_Journal_of_Child_Nutrition_and_Management/Fall_2018/Fall2018-Impact-of-Smarter-Lunchroom-Strategies-Review-of-Literature.pdf (accessed on 16 December 2021).
- Hanks, A.S.; Just, D.R.; Brumberg, A. Marketing Vegetables in Elementary School Cafeterias to Increase Uptake. Pediatrics 2016, 38, e20151720. [Google Scholar] [CrossRef] [PubMed] [Green Version]
- Elsbernd, S.L.; Reicks, M.M.; Mann, T.L.; Redden, J.P.; Mykerezi, E.; Vickers, Z.M. Serving vegetables first: A strategy to increase vegetable consumption in elementary school cafeterias. Appetite 2016, 96, 111–115. [Google Scholar] [CrossRef] [PubMed]
- Kessler, H.S. Simple interventions to improve healthy eating behaviors in the school cafeteria. Nutr. Rev. 2016, 74, 198–209. [Google Scholar] [CrossRef] [Green Version]
- Cohen, J.F.W.; Hecht, A.A.; Hager, E.R.; Turner, L.; Burkholder, K.; Schwartz, M.B. Strategies to Improve School Meal Consumption: A Systematic Review. Nutrients 2021, 13, 3520. [Google Scholar] [CrossRef]
- Simanovska, J. (Food) Waste Not Want Not, Why Food Waste Is a Big Deal and How to Scale-Up Preventive Action; Food Waste Reduction in Canteens of Preschools and Schools in Latvia; Vidzeme University of Applied Sciences: Valmiera, Latvia; FEPS (Foundation for European Progressive Studies): Brussels, Belgium; BSF (Brīvības un Solidaritātes Fonds): Riga, Latvia, 2018; p. 159. Available online: https://www.feps-europe.eu/attachments/publications/food_web.pdf (accessed on 14 December 2021).
- Rodríguez-Tadeo, A.; Patiño Villena, B.; Periago Caston, M.J.; Ros Berrnezo, G.; González Martínez-Lacuesta, E. Evaluando la aceptacion de alimentos en escolares; registro visual cualitativo frente a analisis de residuos de alimentos. Nutr. Hosp. 2014, 29, 1054–1061. [Google Scholar] [CrossRef]
Figure 1.
Framework of Food Loss and Food Waste definitions [10].
Figure 1.
Framework of Food Loss and Food Waste definitions [10].

Figure 2.
Kinds of FW at the consumption stage of the food supply chain. Source: authors’ construction based on [11,12,13,14,15,16].

Figure 4.
Share of plate waste (%) in the total weight of food served at the Rezekne city school canteens (by school and by grade group). Source: authors’ construction based on the results of the field study.
Figure 4.
Share of plate waste (%) in the total weight of food served at the Rezekne city school canteens (by school and by grade group). Source: authors’ construction based on the results of the field study.

Figure 5.
Shares of plate waste in the total weight of food served at the Rezekne city school canteens (%). Source: authors’ construction based on the results of the field study.
Figure 5.
Shares of plate waste in the total weight of food served at the Rezekne city school canteens (%). Source: authors’ construction based on the results of the field study.


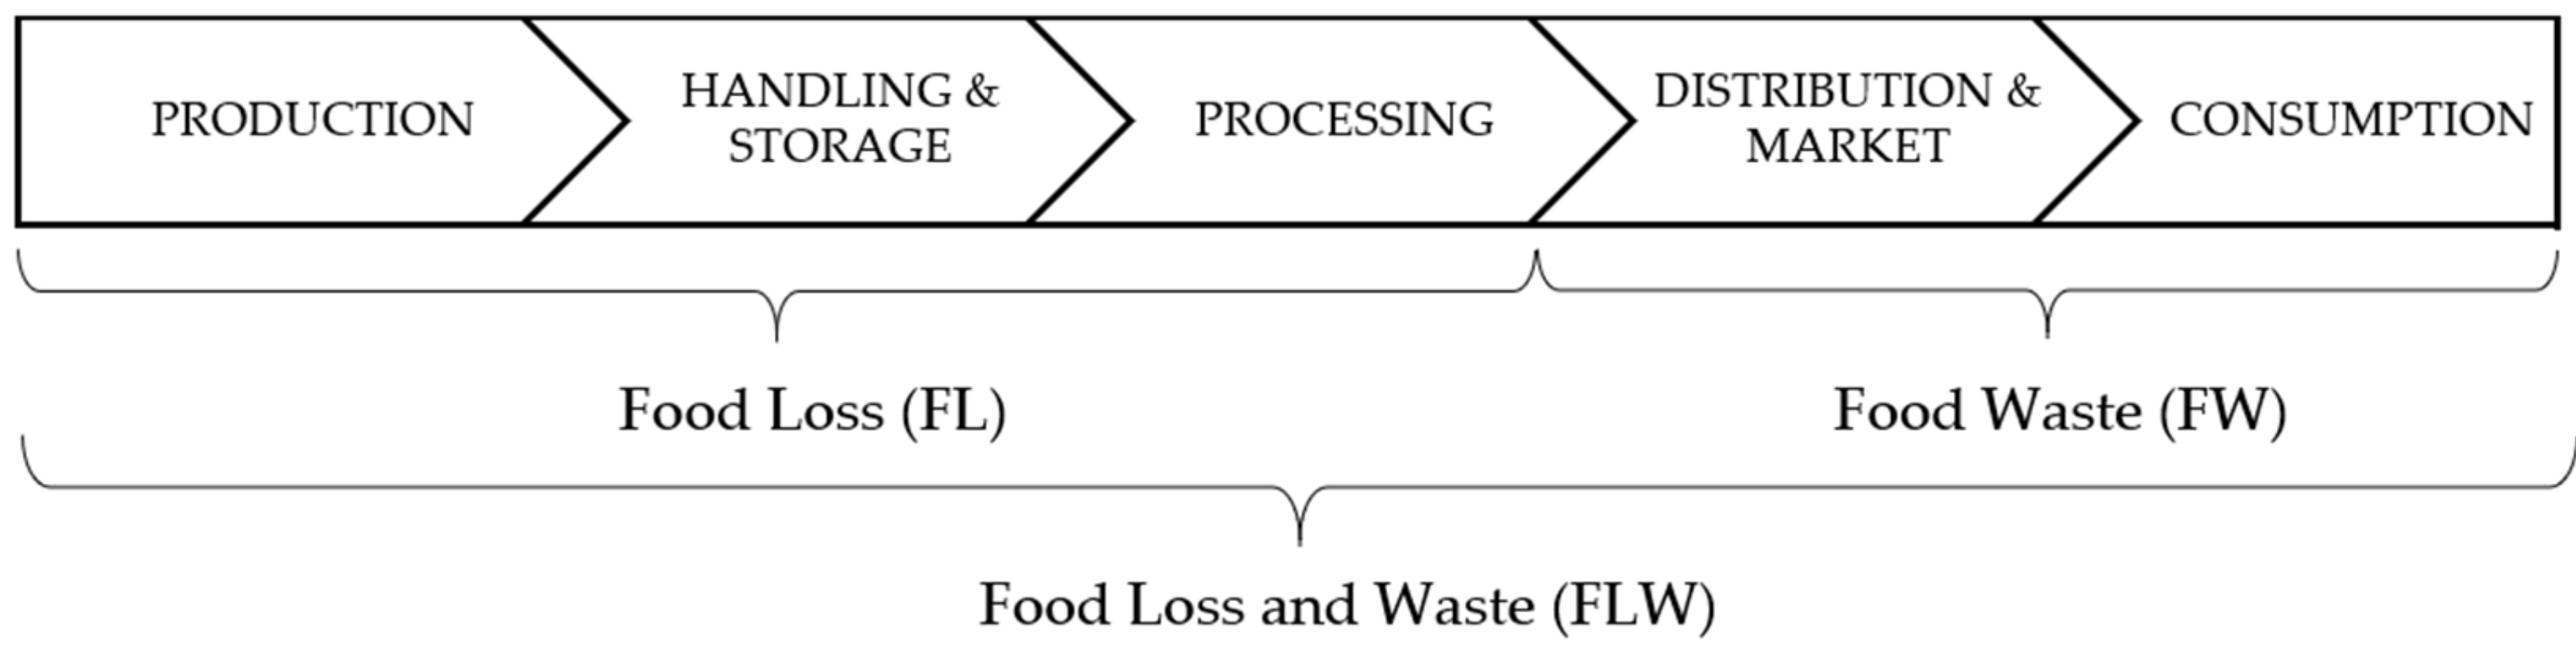
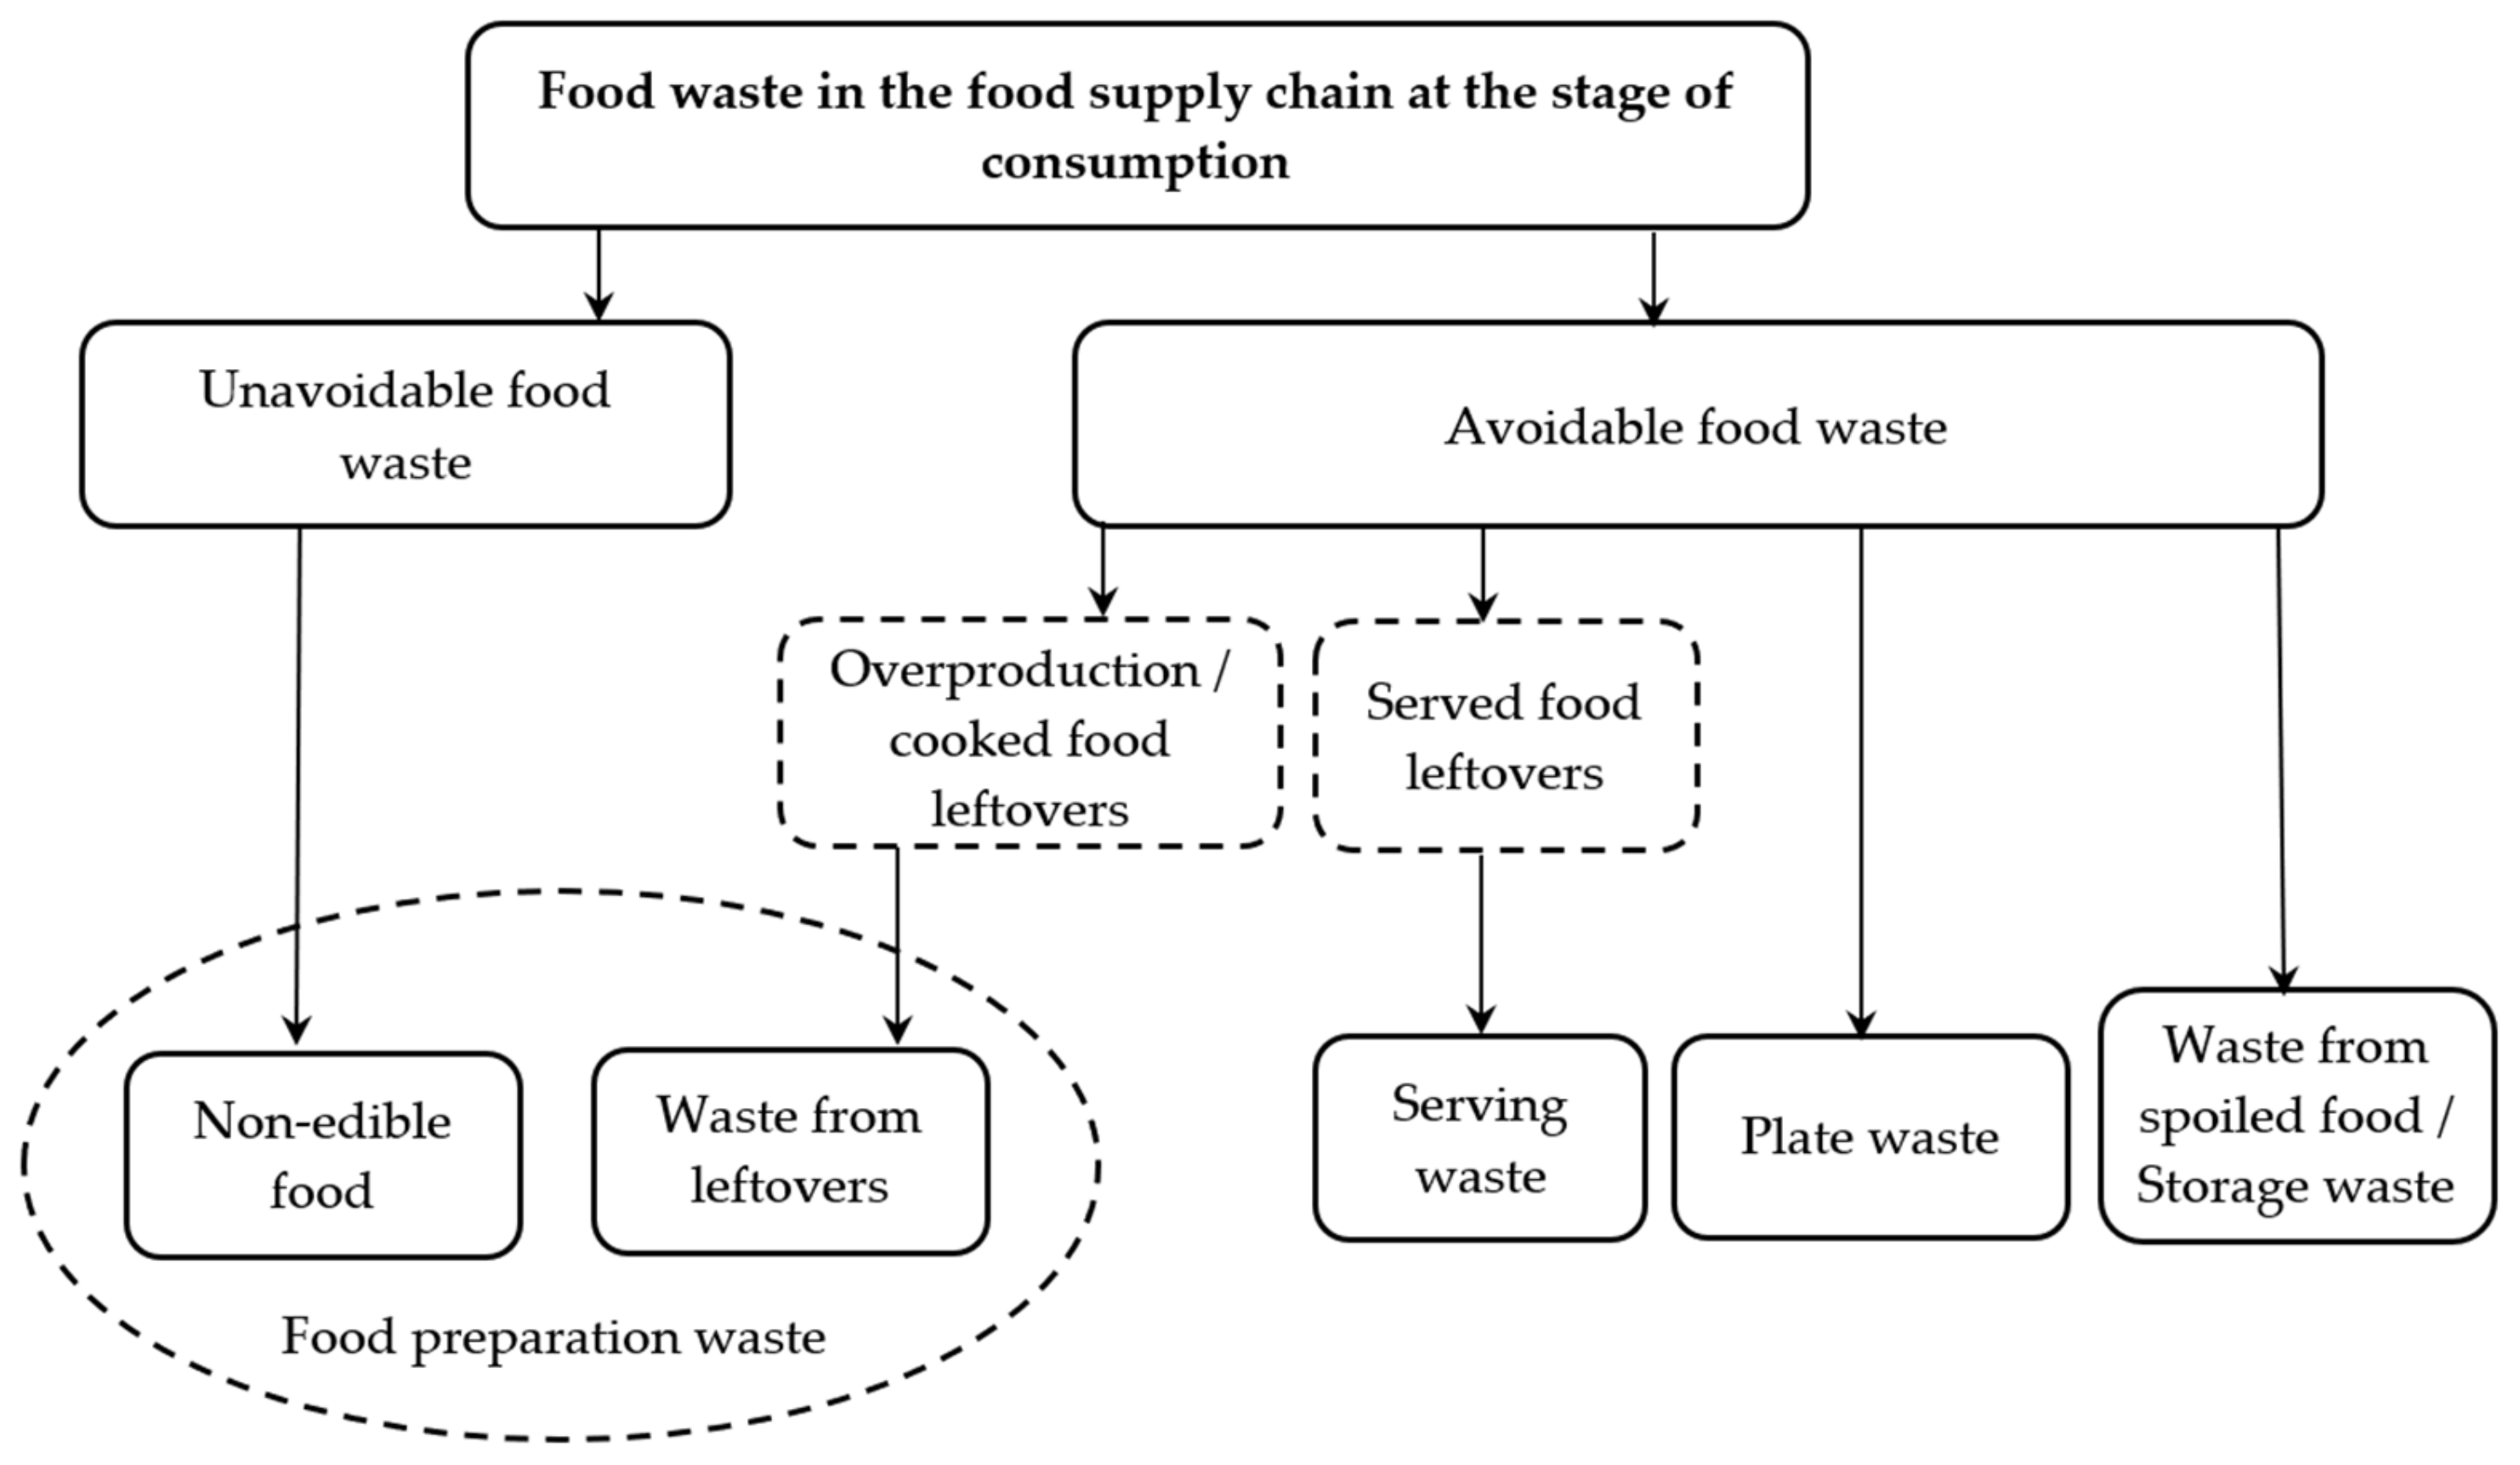
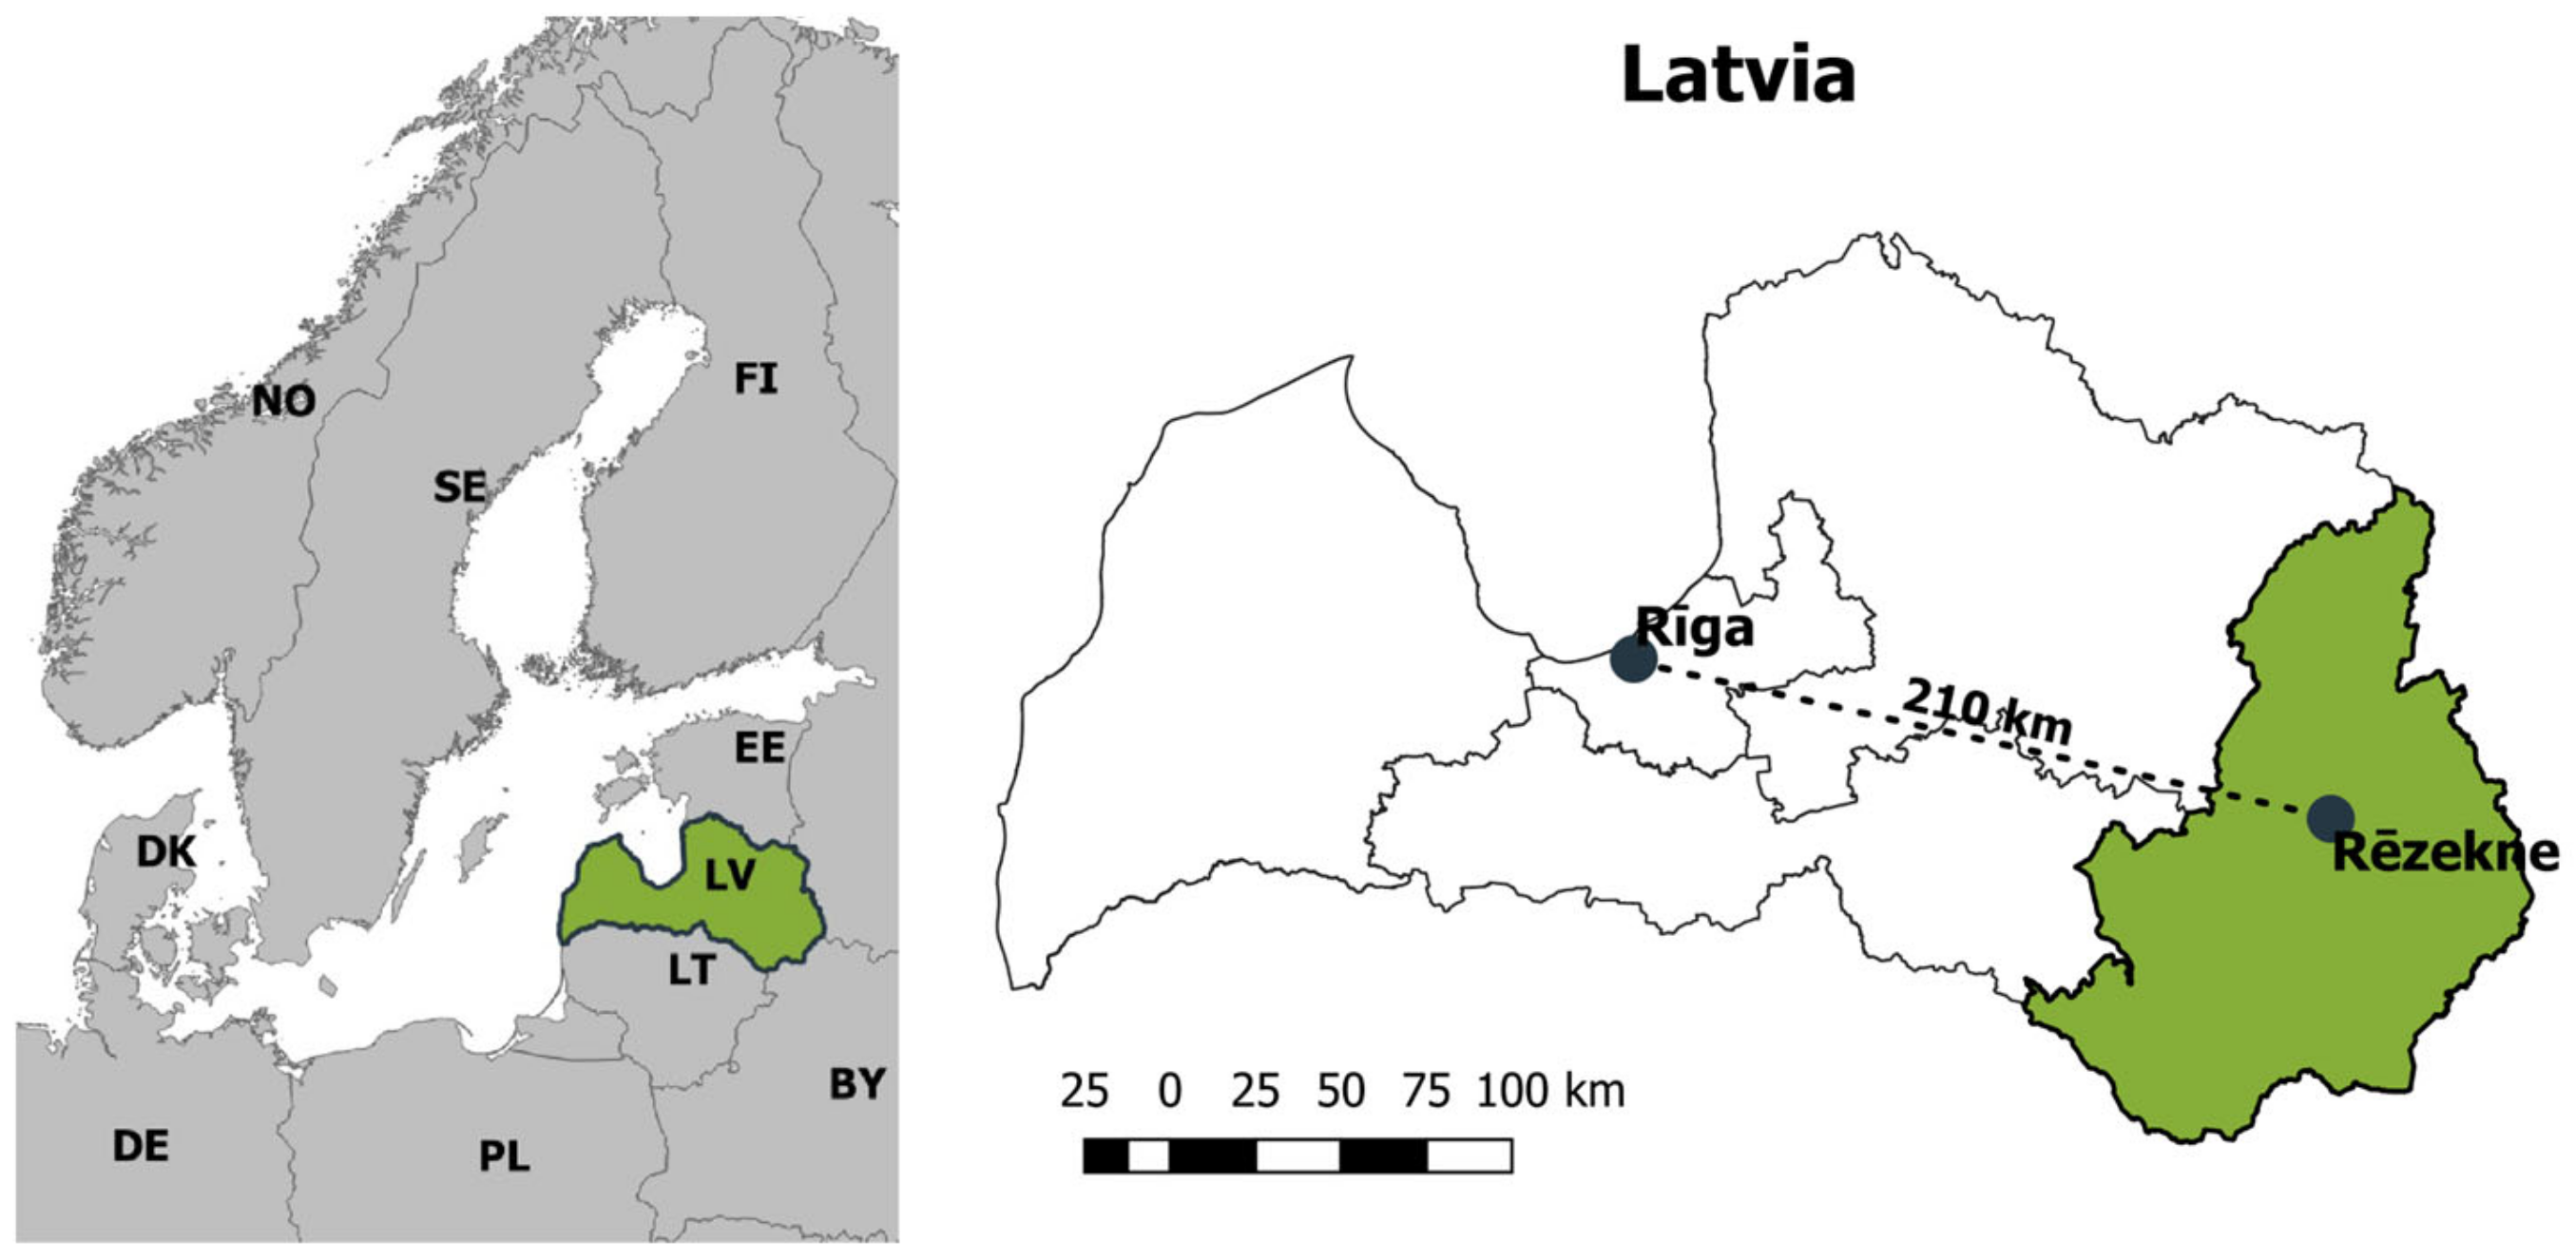
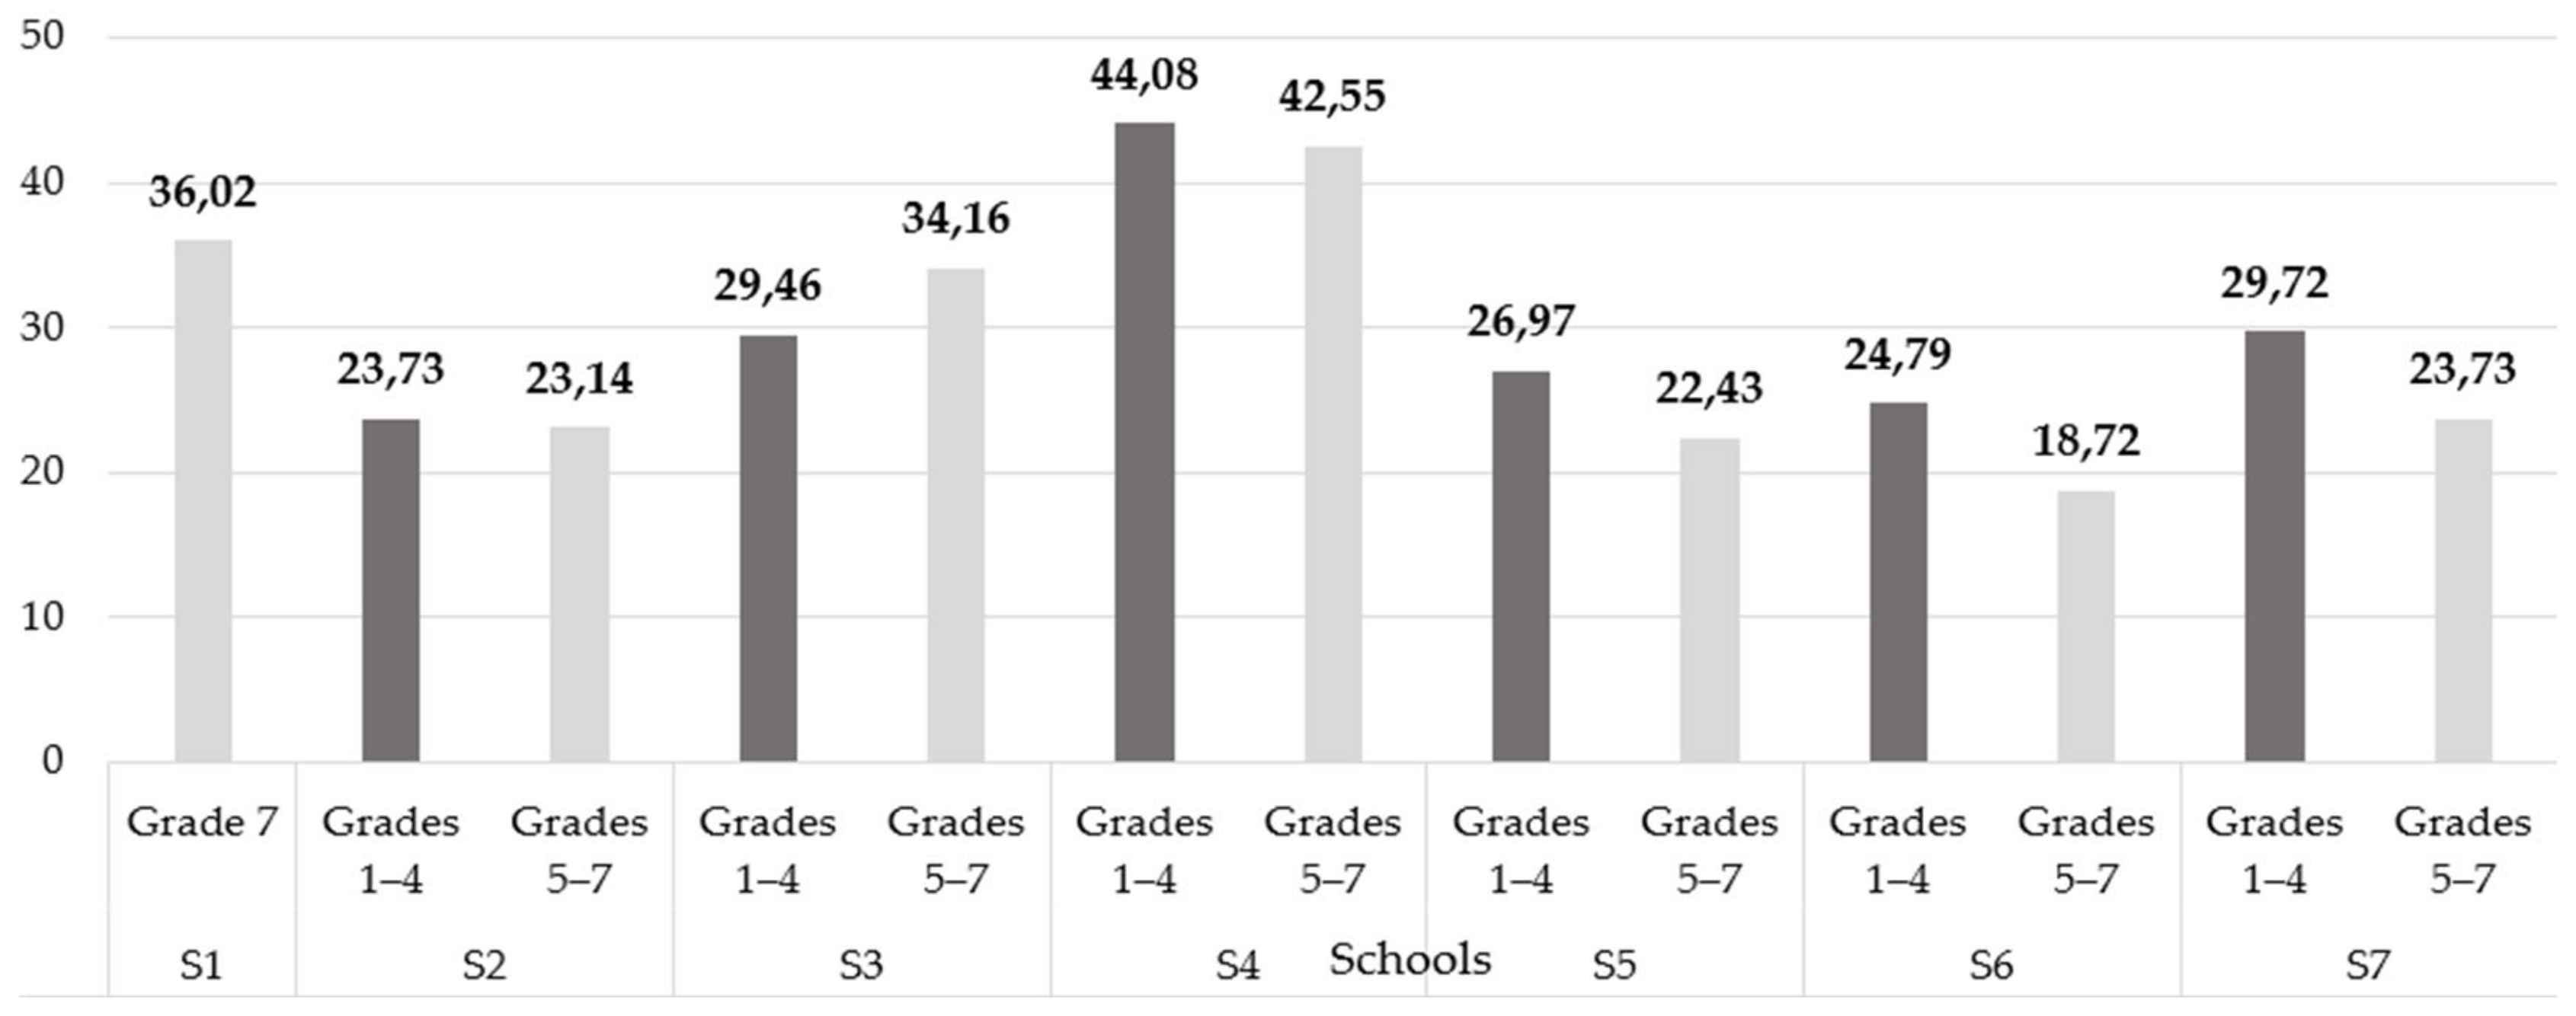
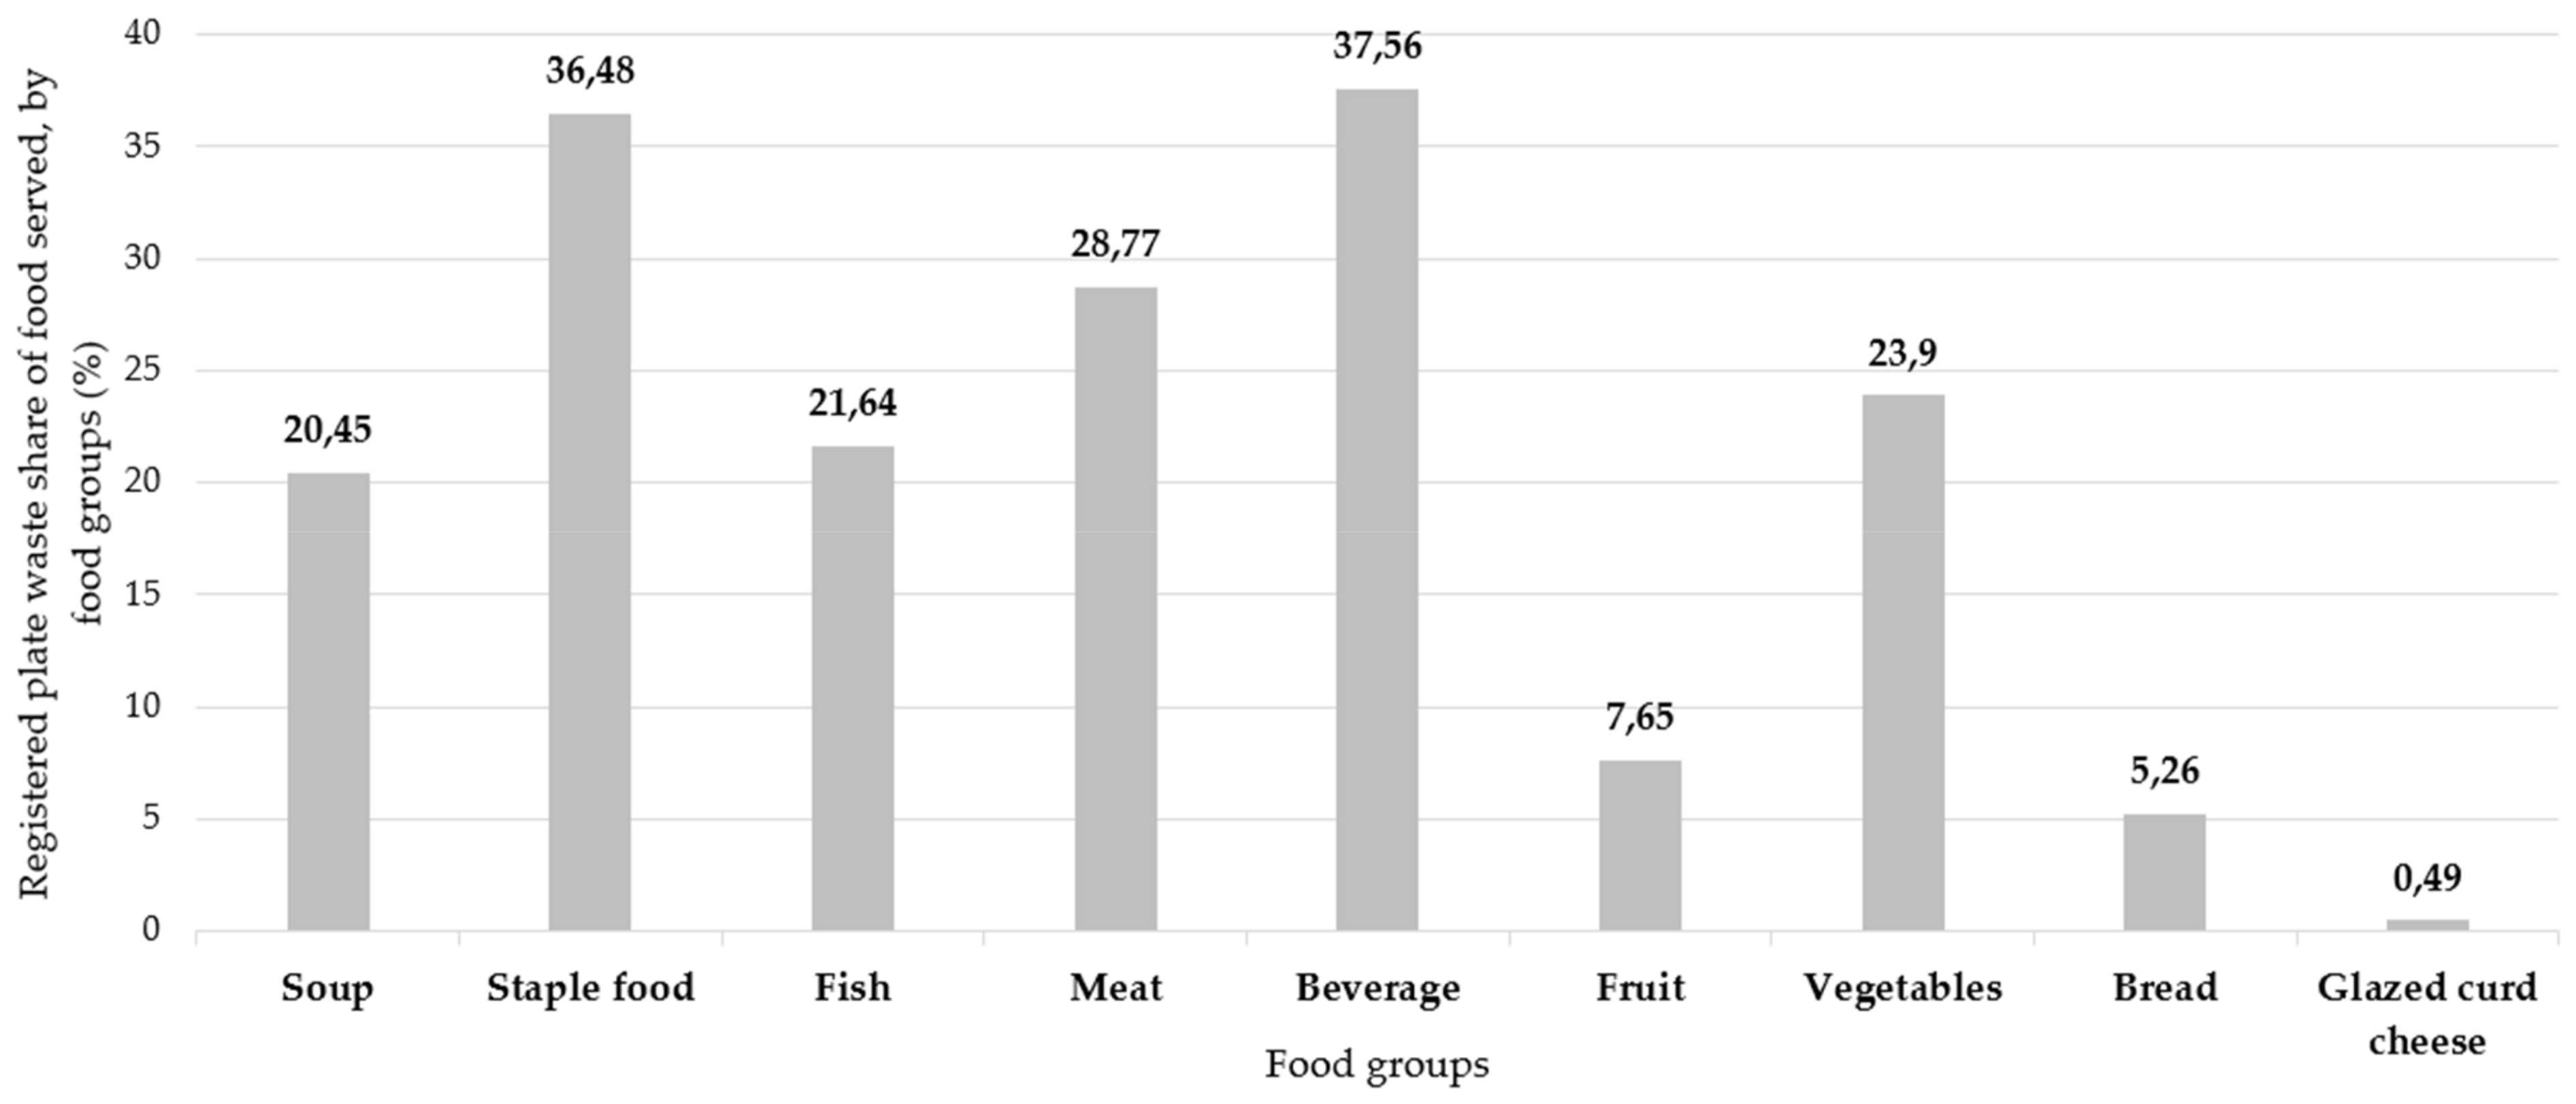
Table 1.
Factors contributing to plate waste in schools referred to in the scientific literature.
| Factor | Explanation | Source |
|---|---|---|
| Exogenous (objective) factors | ||
| School administration position | The restrained position of the school administration and a lack of interest in the implementation of a sustainable management policy, a lack of responsible personnel, a lack of attention to the amount of food waste in the school canteen, etc., increase the irrational consumption of food, which also indirectly affects schoolchildren’s eating behavior | [26,27] |
| Class schedule at school | A poorly planned schedule of classes leads to a lack of time for lunch; due to the short lunch break, schoolchildren do not have enough time to eat a full meal | [13,20,28,29,30,31,32] |
| Atmosphere and environment in the dining hall | A lot of noise in the canteen, a large number of schoolchildren and crowding put psychological pressure on the schoolchildren to finish their meals faster | [18,26,33,34,35,36,37,38,39] |
| Cooking techniques | The incompatibility of the cooking technique with the kind of food can adversely affect the appearance and sensory properties of the food | [23,30,34,40] |
| Way of serving food | The way food is served (e.g., peeled and sliced fruit, etc.) is an essential prerequisite for reducing plate waste: “The easier the food is to eat, the less plate waste is generated” | [27] |
| Cooking skills of kitchen personnel and kitchen equipment | Poor cooking skills of kitchen personnel and insufficient kitchen equipment can adversely affect the appearance and sensory properties of food | [27,41] |
| Competitive foods | Availability of competitive food from other sources (i.e., sweet/savory snacks and beverages), including food brought from home, can also reduce schoolchildren’s appetite | [20,25,34,42,43] |
| Catering service management and coordination policy | The way catering is managed (e.g., portioned or buffet-style catering, on-site cooking in the school kitchen or an outsourced service), a lack of flexibility to adapt the centrally planned menu to schoolchildren’s needs, a lack of timely information on changes in the number of schoolchildren and other organizational aspects can lead to an inadequate amount of food prepared, thereby creating leftovers | [11,23,26,27,30,44] |
| Non-involvement of supervisory or support personnel in the catering process | The non-involvement of supervisory or support personnel (e.g., a teacher or kitchen worker) in the catering process, which could otherwise promote the schoolchildren’s healthy attitudes towards food and new tastes and help to reduce food waste | [13,34,39] |
| Inadequacy of food portions to schoolchildren’s age, appetite and nutritional needs | The portion size of food served is not differentiated according to the age of schoolchildren (including their nutritional needs); consequently, the schoolchildren are simply unable to eat the whole portion | [20,26,41,45,46,47,48,49] |
| Endogenous (subjective) factors | ||
| Schoolchildren preferences | Schoolchildren may refuse to eat or not eat all the food served to them because they might not like the particular food or kind of food | [20,24,26,30,39,50,51,52,53,54] |
| Schoolchildren’s appetite level, total daily nutritional energy requirements and body mass index | Schoolchildren might or might not eat the food served to them due to a reduced appetite and/or need for nutritional energy | [20] |
| Appearance and sensory properties of food | Schoolchildren might refuse to eat or not eat all the food served to them if they are not satisfied with the appearance, taste, texture, color and temperature of the food. This factor is partly subjective, as the appearance and sensory properties of food also depend on the cooking skills of kitchen personnel and kitchen equipment | [26,30,33,39,41,43,46,49,50,55,56,57] |
| Schoolchildren’s desire to socialize during free time | Schoolchildren might refuse to eat or not eat all the food served to them because they communicate with others at the table, or they might leave the dining hall to meet their fellow students during the lunch break | [28,38] |
| Schoolchildren’s unhealthy eating habits | Schoolchildren might refuse to eat or not eat all the food served to them due to their unhealthy eating habits, which often come from their families | [11,58] |
| Schoolchildren’s knowledge and understanding of and attitude towards food | Schoolchildren might refuse to eat or not eat all the food served to them due to a lack of understanding of the negative effects of food waste on the environment and the associated ethical and socio-economic consequences, as well as of the sources and production of food | [27,37,58,59,60] |
Table 2.
Unified menu designed for the field study.
| Placed/Portion/ Planned Weight in Grams | Weight of Food Served on a Plate in Grams | Placed/Portion/ Planned Weight in Grams | Weight of Food Served on a Plate in Grams | ||
|---|---|---|---|---|---|
| Monday | Thursday | ||||
| Pasta | 150 | 150 | Stewed rice with carrots and corn | 150 | 150 |
| Pork goulash | 50/50 | 100 | Chicken cutlet | 80 | 80 |
| Fresh cabbage salad | 50 | 50 | Fresh tomato | 30 | 30 |
| Glazed curd cheese | 1 piece | 46 | Lemon drink | 200 | 200 |
| Bread | 25 | 25 | Bread | 25 | 25 |
| Tea with sugar | 200/10 * | 200 | Apple | 1 piece | 95 |
| Tuesday | Friday | ||||
| Pickled cucumber | 25 | 25 | Milk soup with pasta | 125 | 125 |
| Pork cutlet | 75 | 75 | Mashed potatoes | 130 | 130 |
| Mashed potatoes | 130 | 130 | Fish in breadcrumbs | 60–65 | 63 |
| Juice drink | 200 | 200 | Carrot salad with sunflower seeds | 50 | 50 |
| Bread (optional) | 25 | 25 | Juice drink | 200 | 200 |
| Banana | 1 piece | 160 | Bread | 25 | 25 |
| Wednesday | |||||
| Borscht (beet soup) with fresh cabbage, sour cream | 250/5 ** | 250 | |||
| Mashed potatoes | 130 | 130 | |||
| Stewed liver in cream sauce | 50/45 | 95 | |||
| Fresh cucumber | 30 | 30 | |||
| Juice drink | 200 | 200 | |||
| Bread | 25 | 25 | |||
* Note: 10 g of sugar per 200 g of tea. ** Note: 5 g of sour cream is put in a common pot of soup, providing 5 g per 1 child. The weight of soup in each plate is 250 g. Source: menu calculations performed by the Rezekne City Council’s Education Board based on the research conducted by the authors.
Table 3.
Schoolchildren’s attitudes to the dishes prepared at the Rezekne city schools analyzed by the SNW method.
Table 3.
Schoolchildren’s attitudes to the dishes prepared at the Rezekne city schools analyzed by the SNW method.
| School | Number of Dishes Enjoyed by More Than 90% Children, or the Strength (S) | Number of Dishes Eaten by at Least 65% Children, or the Neutral (N) | Number of Dishes Eaten by Less Than 20% Children, or the Weakness (W) | Typological Group Index |
|---|---|---|---|---|
| S1 | 46 | 36 | 13 | 0.54 |
| S2 | 21 | 70 | 5 | 0.53 |
| S3 | 21 | 75 | 10 | 0.46 |
| S4 | 12 | 62 | 5 | 0.48 |
| S5 | 27 | 54 | 12 | 0.45 |
| S6 | 53 | 30 | 22 | 0.44 |
| S7 | 29 | 24 | 15 | 0.38 |
| Total | 209 | 351 | 82 | 0.47 |
Source: authors’ calculations based on the results of an interview with canteen personnel.
Table 4.
Basic information on the 7 sample schools.
| School | Grade Group | Age Range | Number of Children in Grades | Number of Field Study Days (per Week) | Actual Number of Lunch Participants (Number of Samples) * | |
|---|---|---|---|---|---|---|
| S1 | Grade 7 | 13 (14) | 76 | 4 | 234 | 234 |
| S2 | Grades 1–4 | (6) 7–10 | 176 | 5 | 677 | 1127 |
| Grades 5–7 | 11–13 (14) | 126 | 5 | 450 | ||
| S3 | Grades 1–4 | (6) 7–10 | 150 | 5 | 603 | 1024 |
| Grades 5–7 | 11–13 (14) | 126 | 5 | 421 | ||
| S4 | Grades 1–4 | (6) 7–10 | 184 | 5 | 663 | 1110 |
| Grades 5–7 | 11–13 (14) | 130 | 5 | 447 | ||
| S5 | Grades 1–4 | (6) 7–10 | 206 | 5 | 94 | 493 |
| Grades 5–7 | 11–13 (14) | 147 | 5 | 399 | ||
| S6 | Grades 1–4 | (6) 7–10 | 314 | 5 | 1239 | 1813 |
| Grades 5–7 | 11–13 (14) | 165 | 5 | 574 | ||
| S7 | Grades 1–4 | (6) 7–10 | 202 | 5 | 829 | 1263 |
| Grades 5–7 | 11–13 (14) | 174 | 4 | 434 | ||
| Total: | - | 2176 | - | 7064 | ||
* Note: the sample of the field study included only the number of schoolchildren who actually ate lunch, which might not correspond to the actual number of schoolchildren at school, as some schoolchildren did not eat lunch during the field study due to illness or self-isolation because of COVID-19.
Table 5.
Weights of plate waste identified by the field study at the Rezekne city school canteens (by school and by grade group).
Table 5.
Weights of plate waste identified by the field study at the Rezekne city school canteens (by school and by grade group).
| School | Total Weight of Plate Waste (g/Week) | Average Plate Waste per Schoolchild (g) * | Grade Group | Total Weight of Plate Waste (g/Week) | Actual Number of Lunch Participants (Number of Samples) | Average Plate Waste per Schoolchild (g) |
|---|---|---|---|---|---|---|
| S1 | 52,578 | 225 | Grade 7 | 52,578 | 234 | 225 |
| S2 | 163,750 | 145 | Grades 1–4 | 99,397 | 677 | 147 |
| Grades 5–7 | 64,353 | 450 | 143 | |||
| S3 | 197,674 | 193 | Grades 1–4 | 109,544 | 603 | 182 |
| Grades 5–7 | 88,130 | 421 | 209 | |||
| S4 | 297,603 | 268 | Grades 1–4 | 180,518 | 663 | 272 |
| Grades 5–7 | 117,085 | 447 | 262 | |||
| S5 | 71,131 | 144 | Grades 1–4 | 15,416 | 94 | 164 |
| Grades 5–7 | 55,715 | 399 | 140 | |||
| S6 | 256,933 | 142 | Grades 1–4 | 190,644 | 1239 | 154 |
| Grades 5–7 | 66,289 | 574 | 115 | |||
| S7 | 216,630 | 172 | Grades 1–4 | 152,566 | 829 | 184 |
| Grades 5–7 | 64,064 | 434 | 148 | |||
| Total: | 1,256,299 | 178 | Total for grades 1–4 | 748,085 | 4105 | 182 |
| Total for grades 5–7 | 508,214 | 2959 | 172 |
* Note: the average weight of plate weight per schoolchild (g) was calculated as the total weight of plate waste divided by the actual number of schoolchildren [19]. Source: authors’ calculations based on the results of the field study.
Table 6.
Results of the ANOVA test for the average weights of plate waste per schoolchild, in grams, identified at the Rezekne city school canteens.
Table 6.
Results of the ANOVA test for the average weights of plate waste per schoolchild, in grams, identified at the Rezekne city school canteens.
| Grade Group | Count | Sum | Average | Variance | ||
|---|---|---|---|---|---|---|
| Grades 1–2 | 22 | 4147.681 | 188.531 | 3670.868 | ||
| Grades 3–4 | 27 | 4754.659 | 176.0985 | 2988.212 | ||
| Grades 5–7 | 39 | 6830.969 | 175.1531 | 3965.215 | ||
| One-way ANOVA | ||||||
| Source of variation | SS | df | MS | F | p-value | F crit |
| Between groups | 2798.964 | 2 | 1399.482 | 0.389432 | 0.678644 | 3.103838661 |
| Within groups | 305,459.9 | 85 | 3593.646 | |||
| Total | 308,258.9 | 87 | ||||
F < Fcrit, = grades do not statistically significantly affect the amount of plate waste. Source: authors’ calculations based on the results of the field study.
Table 7.
Shares of plate waste (%) in the total weight of food served at the Rezekne city school canteens (by school).
Table 7.
Shares of plate waste (%) in the total weight of food served at the Rezekne city school canteens (by school).
| School | Total Weight of Plate Waste (g/Week) | Total Weight of Food Served, g/Week * | Share of Plate Waste, % ** |
|---|---|---|---|
| S1 | 52,578 | 145,970 | 36.02 |
| S2 | 163,750 | 696,962 | 23.49 |
| S3 | 197,674 | 629,858 | 31.38 |
| S4 | 297,603 | 684,707 | 43.46 |
| S5 | 71,131 | 305,503 | 23.28 |
| S6 | 256,933 | 1,122,945 | 22.88 |
| S7 | 216,630 | 783,191 | 27.66 |
| Total: | 1,256,299 | 4,369,136 | 28.75 |
* Note: the total weight of food served (g/week) was calculated based on the weight of food indicated by the menu (see Table 3), multiplying the weight of food served each day by the number of samples examined that day and adding up the results for all the days and all the schools. ** Note: the share of plate waste (%) in the total weight of food served was calculated as the ratio of the total weight of plate waste (g) to the total weight of food served (g) × 100% [19]. Source: authors’ calculations based on the results of the field study.
Table 8.
Breakdown of plate waste by food waste category at the Rezekne city school canteens, as a % of the total weight of plate waste (by school).
Table 8.
Breakdown of plate waste by food waste category at the Rezekne city school canteens, as a % of the total weight of plate waste (by school).
| Plate Waste by Food Category, Share of Total Plate Waste | School | Total | ||||||
|---|---|---|---|---|---|---|---|---|
| S1 | S2 | S3 | S4 | S5 | S6 | S7 | ||
| Soup | 2.66 | 4.45 | 5.48 | 12.09 | 6.17 | 12.94 | 5.56 | 8.37 |
| Staple food | 19.21 | 29.90 | 22.25 | 29.72 | 40.77 | 34.19 | 22.24 | 28.38 |
| Fish | 0.00 | 1.71 | 0.75 | 1.33 | 0.96 | 1.97 | 1.00 | 1.28 |
| Meat | 12.55 | 13.25 | 12.97 | 10.03 | 16.22 | 14.53 | 7.00 | 11.77 |
| Beverage | 45.89 | 43.18 | 53.31 | 37.92 | 22.33 | 31.49 | 55.76 | 42.24 |
| Fruit * | 14.24 | 1.66 | 2.30 | 1.63 | 0.00 | 3.15 | 0.57 | 2.30 |
| Vegetables | 5.14 | 5.03 | 1.41 | 6.98 | 13.33 | 1.07 | 6.82 | 4.89 |
| Bread | 0.32 | 0.75 | 1.53 | 0.26 | 0.22 | 0.65 | 1.05 | 0.74 |
| Glazed curd cheese | 0.00 | 0.07 | 0.00 | 0.05 | 0.00 | 0.01 | 0.01 | 0.03 |
| Total | 100.00 | 100.00 | 100.00 | 100.00 | 100.00 | 100.00 | 100.00 | 100.00 |
* Note: regarding fruit waste, it is difficult to draw any conclusion because the schoolchildren were given whole bananas and whole apples during the field study, which they often took with them. For example, in school S5, fruits were served in a box, which was usually taken to the classroom where the fruits were later consumed. Source: authors’ calculations based on the results of the field study.
Table 9.
Plate waste shares of food served (%) at the Rezekne city school canteens by food category (by school).
Table 9.
Plate waste shares of food served (%) at the Rezekne city school canteens by food category (by school).
| School | Soup | Staple Food | Fish | Meat | Beverage | Fruit | Vegetables | Bread | Glazed Curd Cheese |
|---|---|---|---|---|---|---|---|---|---|
| S1 | 7.99 | 30.84 | 0.00 | 32.52 | 51.56 | 50.18 | 34.32 | 2.85 | 0.00 |
| S2 | 8.63 | 31.47 | 20.81 | 27.10 | 31.37 | 4.74 | 19.79 | 4.34 | 1.00 |
| S3 | 14.76 | 31.07 | 10.93 | 36.32 | 51.46 | 8.59 | 7.30 | 11.83 | 0.00 |
| S4 | 44.56 | 57.62 | 29.64 | 37.87 | 50.83 | 8.62 | 50.38 | 2.75 | 1.33 |
| S5 | 12.40 | 42.44 | 15.29 | 31.32 | 16.11 | 0.00 | 53.62 | 1.25 | 0.00 |
| S6 | 24.65 | 35.05 | 25.77 | 28.44 | 22.31 | 8.43 | 4.15 | 3.70 | 0.20 |
| S7 | 13.67 | 27.53 | 21.29 | 15.80 | 47.82 | 1.68 | 32.94 | 7.23 | 0.25 |
| Total | 20.45 | 36.48 | 21.64 | 28.77 | 37.56 | 7.65 | 23.90 | 5.26 | 0.49 |
Source: authors’ calculations based on the results of the field study.
Table 10.
Weights (g) and costs (EUR) of plate waste at the Rezekne city school canteens (by school and by grade group).
Table 10.
Weights (g) and costs (EUR) of plate waste at the Rezekne city school canteens (by school and by grade group).
| Schools | Groups of Grades | Average Weight of Served Meal, g | Average Weight of Plate Waste Per Schoolchild, g | Cost of Plate Waste per Served Meal, EUR | Average Weight of Beverage Waste Per Schoolchild, g | Average Weight of Plate Waste Excluding Weight of Beverage Waste Per Schoolchild, g | Cost of Plate Waste Excluding Beverage Waste Per Schoolchild, EUR | Actual Number of Lunch Participants (Number of Samples) | Total Cost of Plate Waste Excluding Beverage Waste, EUR |
|---|---|---|---|---|---|---|---|---|---|
| S1 | Grade 7 | 613 | 225 | 0.52 | 103 | 122 | 0.28 | 234 | 66.13 |
| S2 | Grades 1–4 | 618 | 147 | 0.34 | 58 | 89 | 0.20 | 677 | 138.45 |
| Grades 5–7 | 618 | 143 | 0.33 | 69 | 74 | 0.17 | 450 | 76.51 | |
| S3 | Grades 1–4 | 618 | 182 | 0.42 | 94 | 88 | 0.20 | 603 | 121.93 |
| Grades 5–7 | 618 | 209 | 0.48 | 116 | 93 | 0.21 | 421 | 89.96 | |
| S4 | Grades 1–4 | 618 | 272 | 0.62 | 105 | 167 | 0.38 | 663 | 254.41 |
| Grades 5–7 | 618 | 262 | 0.60 | 97 | 165 | 0.38 | 447 | 169.47 | |
| S5 | Grades 1–4 | 618 | 164 | 0.38 | 34 | 130 | 0.30 | 94 | 28.08 |
| Grades 5–7 | 618 | 140 | 0.32 | 32 | 108 | 0.25 | 399 | 99.01 | |
| S6 | Grades 1–4 | 618 | 154 | 0.35 | 52 | 102 | 0.23 | 1239 | 290.38 |
| Grades 5–7 | 618 | 115 | 0.26 | 29 | 86 | 0.20 | 574 | 113.43 | |
| S7 | Grades 1–4 | 618 | 184 | 0.42 | 98 | 86 | 0.20 | 829 | 163.81 |
| Grades 5–7 | 624 | 148 | 0.34 | 92 | 56 | 0.13 | 434 | 55.31 | |
| Total for grades 1–4 | 4105 | 997.06 | |||||||
| Total for grades 5–7 | 2959 | 669.82 | |||||||
| Total | 1666.88 | ||||||||
Source: authors’ calculations based on the results of the field study.
Publisher’s Note: MDPI stays neutral with regard to jurisdictional claims in published maps and institutional affiliations. |
© 2022 by the authors. Licensee MDPI, Basel, Switzerland. This article is an open access article distributed under the terms and conditions of the Creative Commons Attribution (CC BY) license (https://creativecommons.org/licenses/by/4.0/).
Share and Cite
MDPI and ACS Style
Lonska, J.; Zvaigzne, A.; Kotane, I.; Silicka, I.; Litavniece, L.; Kodors, S.; Deksne, J.; Vonoga, A. Plate Waste in School Catering in Rezekne, Latvia. Sustainability 2022, 14, 4046. https://doi.org/10.3390/su14074046
AMA Style
Lonska J, Zvaigzne A, Kotane I, Silicka I, Litavniece L, Kodors S, Deksne J, Vonoga A. Plate Waste in School Catering in Rezekne, Latvia. Sustainability. 2022; 14(7):4046. https://doi.org/10.3390/su14074046
Chicago/Turabian StyleLonska, Jelena, Anda Zvaigzne, Inta Kotane, Inese Silicka, Lienite Litavniece, Sergejs Kodors, Juta Deksne, and Aija Vonoga. 2022. "Plate Waste in School Catering in Rezekne, Latvia" Sustainability 14, no. 7: 4046. https://doi.org/10.3390/su14074046
Note that from the first issue of 2016, this journal uses article numbers instead of page numbers. See further details here.