
Canadian Consumers’ Dining Behaviors during the COVID-19 Pandemic: Implications for Channel Decisions in the Foodservice Industry


1
Faculty of Agriculture, Dalhousie University, Truro, NS B2N 5E3, Canada
2
Agri-Food Analytics Lab, Dalhousie University, Halifax, NS B3H 4R2, Canada
*
Author to whom correspondence should be addressed.
Sustainability 2022, 14(9), 4893; https://doi.org/10.3390/su14094893
Submission received: 16 March 2022
/
Revised: 3 April 2022
/
Accepted: 18 April 2022
/
Published: 19 April 2022
Abstract
:The past two years have been challenging for the restaurant industry in Canada and countries worldwide. This has led many casual and fine dining restaurants to adapt their business models to overcome the immediate and long-term impacts of the COVID-19 pandemic. This paper aims to understand how COVID-19 has impacted Canadian consumers’ on- and off-premise dining behaviors and how such behaviors vary among various sociodemographic groups, general knowledge of COVID-19, and telecommuting. Data were collected from a nationally representative consumer panel (n = 1091), from a survey administered online by Angus Reid. The results show that Canadian consumers increased their off-premise dining experiences during the COVID-19 pandemic, which also varied across various sociodemographic groups. There was also an increased level of telecommuting during the pandemic, of which 68% started following the pandemic. However, telecommuting was negatively correlated with off-premise dining experiences during the pandemic. Canadian consumers perceived off-premise dining during the pandemic as reasonably expensive, lesser quality, and more convenient. The findings may have important implications for casual and dining restaurants in Canada to improve channel decisions and messaging as operators prepare for a full-service post-COVID-19. They can build on the infrastructure and capability that has been established during the COVID-19 pandemic to offer sustainable services beyond the pandemic.
1. Introduction
The COVID-19 pandemic has brought one of the most significant historical shocks, shattering global health and food systems [1,2,3,4]. The introduction of lockdown measures and social-distancing rules (including capacity restrictions) have negatively affected the foodservice industry and consumer relationships with food [5]. Restaurant operators have reacted immediately to the pandemic and introduced different interventions, including a refocus toward off-premise services [6,7]. While the decision to switch to off-premise options was relatively smooth for fast-food restaurants, it was not as easy for traditional casual and fine dining restaurants, as they were required to optimize their dining rooms and increase their outdoor services [6,8].
The last two years have given a harsh lesson to the restaurant industry about the need for flexible business models. The COVID-19 pandemic could change how casual and fine dining restaurants view off-premise alternatives to distribute food to customers. Most dine-in restaurants would have to adapt to the new reality to overcome the crisis created by the pandemic. It is expected that the restaurant industry has already established the skills, infrastructure, and capabilities to continue offering off-premise experiences to their customers post-COVID-19 [9]. Therefore, evaluating consumers’ perceptions regarding the off-premise dining experience is timely and highly relevant.
As many countries are currently easing restrictions related to the pandemic, attitudes toward COVID-19 and beliefs in conspiracy theories about the virus continue to affect individual perceptions [10] and how consumers assess service offerings [11,12]. Existing studies about the impact of COVID-19 on consumer behavior primarily focus on shifts toward home cooking [13,14] and shopping behavior [15]. Furthermore, most of the studies regarding the impact of COVID-19 on consumer perceptions were carried out at the early stages or peak of the pandemic, before the discovery of the ‘Delta variant’ and later the ‘Omicron’ variant that has spread more rapidly than the earlier variant [16]. The significance of these latest variants is that dining behavior is more likely to be affected by uncertainties surrounding the virus.
This study aims to explore how COVID-19 has impacted the off-premise dining behavior of consumers in Canada and how such behavior varies among sociodemographic groups, general knowledge of COVID-19, and telecommuting trends. More specifically, the study seeks to (1) provide a comparative analysis of off-premise dining experience during and before COVID-19 and how changes (if any) in dining behavior varied among various socioeconomic groups; (2) assess the association between telecommuting and off-premise dining behavior of Canadian consumers during the COVID-19 pandemic; and (3) provide a comparative analysis of perceived off-premise restaurant services during the COVID-19 pandemic. The study contributes to the literature looking at the impacts of the COVID-19 pandemic on the off-premise dining behavior of consumers in the North American context. Context-specific studies are needed as the extent of lockdown measures and impact varied across time and geographies [17,18,19] and as the impact of COVID-19 on consumer behavior is likely to be far from understood [20].
How consumers’ perceptions of off-premise offerings would improve channel decisions and messaging as operators prepare for a full-service post-COVID-19 is a key managerial implication for this study. Restaurants in Canada are still struggling to overcome the challenges posed by the COVID-19 pandemic. Boosted by the country’s high vaccination rate and the expected lifting of federal and provincial restrictions, Restaurant Canada estimates a CAD 80 billion sales forecast for 2022, which is still CAD 15 billion worse than the pre-COVID-19 level but 5.4% better than the previous year’s forecast [21]. Indeed, the pandemic may have brought a lasting impact on the dining behavior of consumers [18,22] as consumer misconceptions about COVID-19 persist and continue to influence restaurant operations [23]. The implication is that off-premise channels, such as takeout/delivery, drive-thru, and curbside pickup, would remain valuable alternatives for the foodservice industry. As a result, there is a greater interest in expanding our understanding of the value of off-premise formats from consumers’ perspectives. In Canada, only a handful of studies have assessed the impact of COVID-19 on consumer behavior, but in other topics such as single-use plastic packaging [24], home food gardening [25], food shopping [26], and food-wasting habits [27,28].
2. Literature Review
Before the onset of the COVID-19 pandemic, the foodservice industry was booming, and food away from home was trending [29]. For example, in Canada, household spending on food outside of the home had increased from 20% to 30% for the period 1997–2017 [22]. However, following the onset of COVID-19, Canada closed restaurants, which shifted food services into retail stores [18]. In the United States, for example, consumer restaurant spending was 54.8% before the pandemic; however, the loss in restaurant revenue was USD 120 billion and 8 million in jobs just three months after COVID-19 was declared a global pandemic by the World Health Organization [30]. This has prompted the traditional casual and fine dining restaurants to alternative approaches to successfully recover from the COVID-19 crisis [31] and sustain their business in the future, such as by investing in a lower contact ordering environment where consumers can access food safely and quickly [32].
The theoretical and empirical literature links dining behaviors with multiple motives, including sociocultural, biological, and economic [33], compliance with social norms [34], and emotional states [35]. A pandemic can quickly turn consumers’ enjoyment from eating out into negative emotions by creating fear and anxiety and thus behavioral changes [36]. Indeed, the COVID-19 pandemic and subsequent lockdown measures have induced both positive and negative behavioral changes. Regarding the former, several studies have documented behavioral changes toward healthy and sustainable diets, such as in the United States [37], European countries [38,39], China [40], and Brazil [20]. Other studies have linked dietary patterns during the COVID-19 pandemic to increased consumption of unhealthy foods [41,42] and impact on consumers’ food choices and spending levels [43,44].
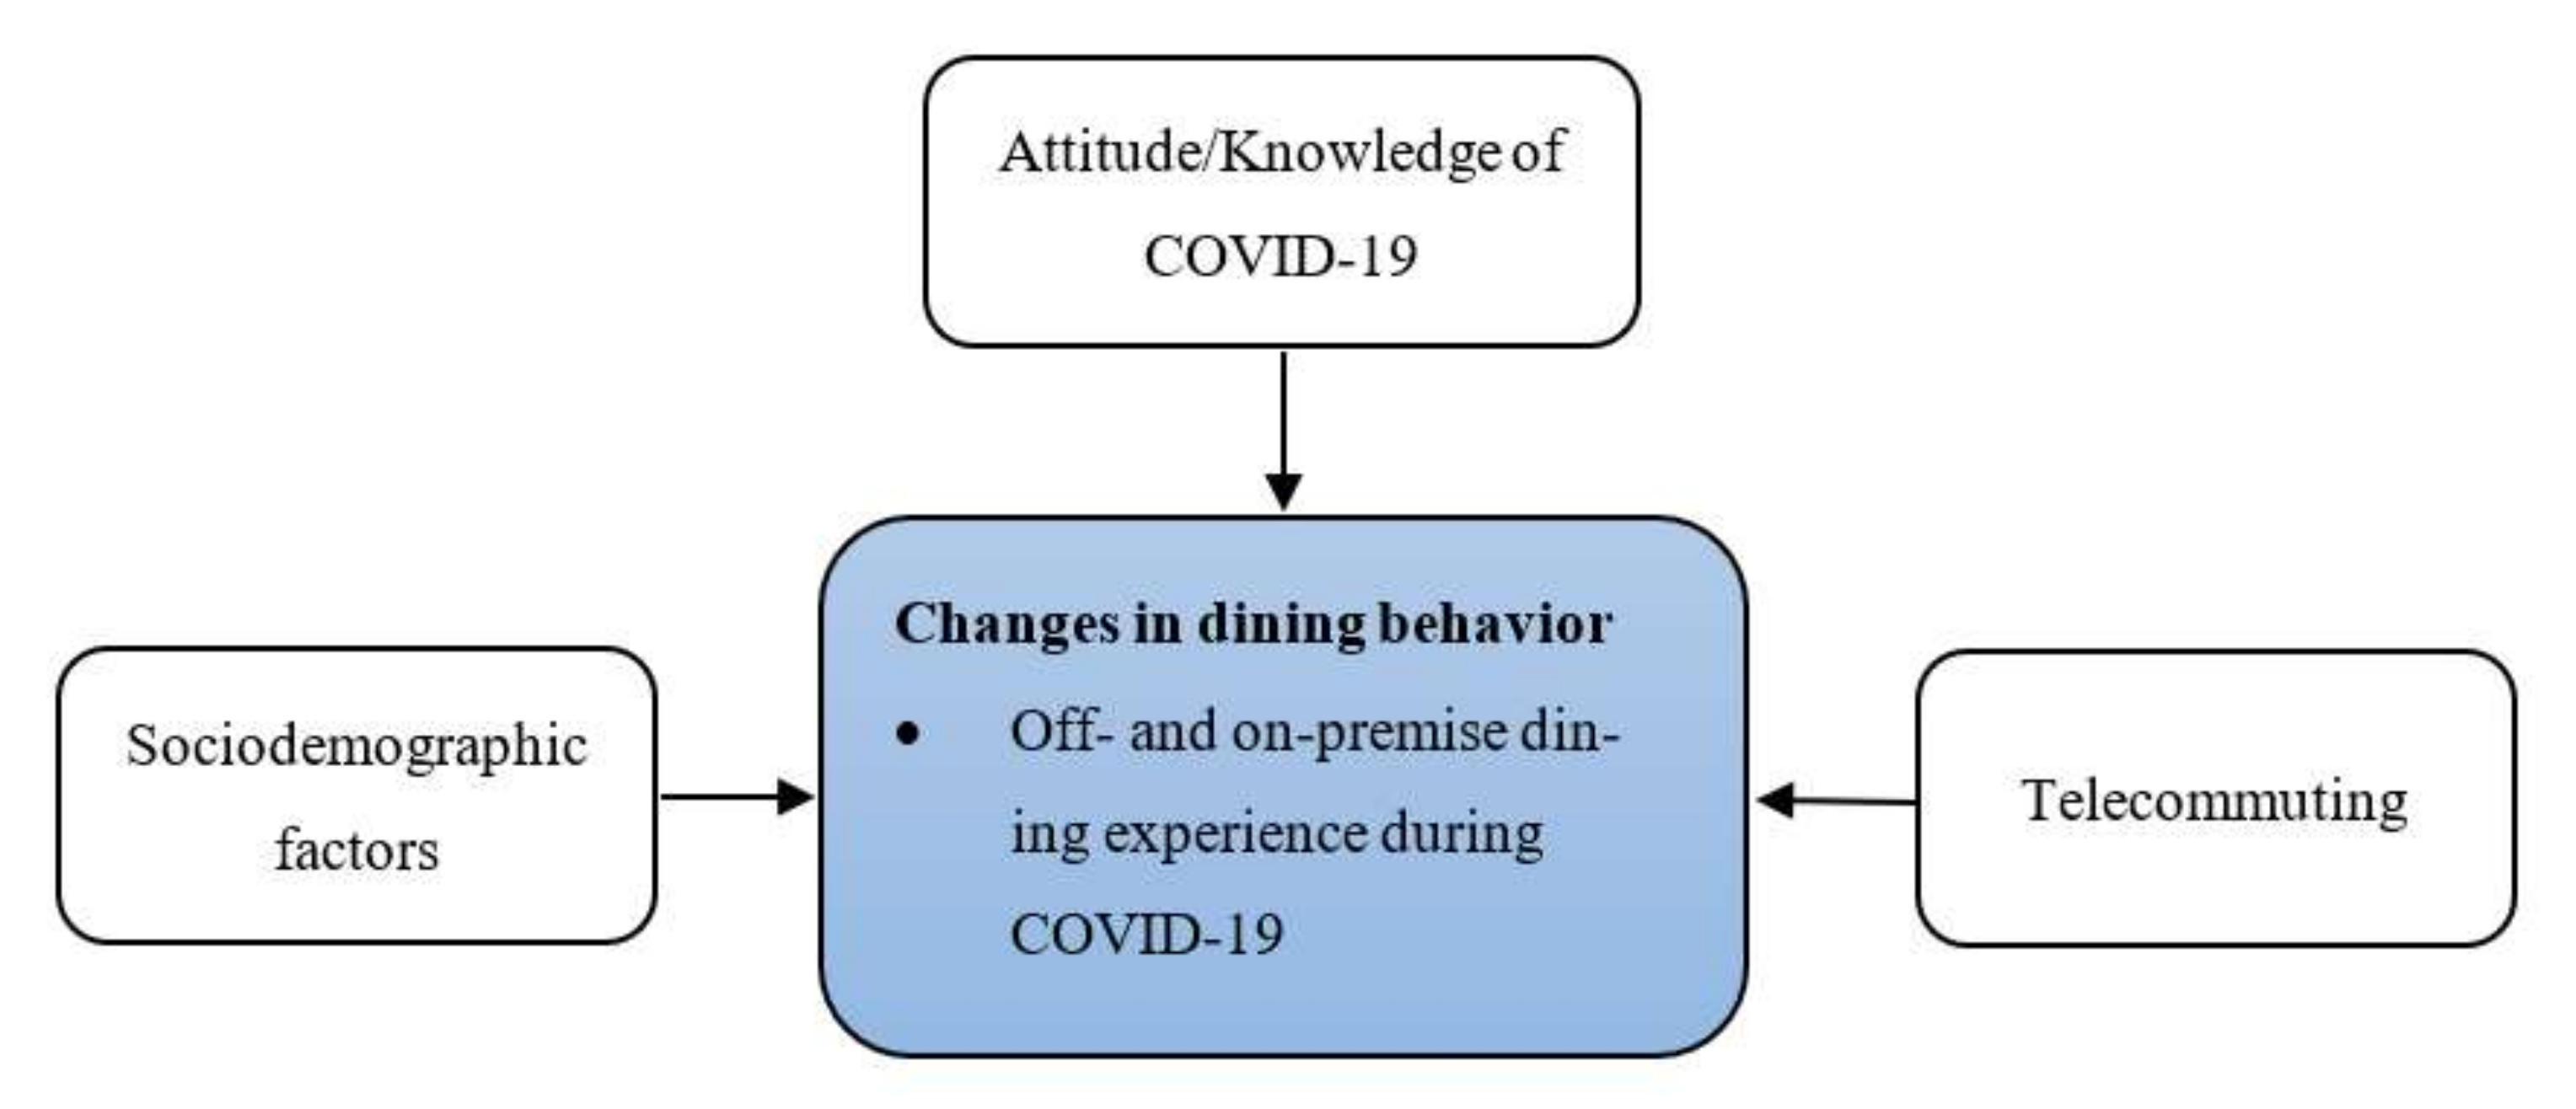
There is a growing body of literature studying consumer dining intentions in the context of a pandemic [45,46,47]. According to Hakim et al. (2021), the dining behavior of consumers during the COVID-19 pandemic could be predicted by various factors such as marketing (e.g., price, perceived safety, and brand), context (e.g., social trust, politics, and culture), risk perception, and demographic characteristics. Building on the recent work, the present study examines the relationship between consumer off-premise dining behavior and sociodemographic variables, general COVID-19 knowledge, and telecommuting, as displayed in Figure 1. Consumers’ dining behavior is measured in terms of off-premise dining experiences related to takeout/delivery, curbside pickup, drive-thru and on-premise dining. Furthermore, changes in dining behavior during COVID-19 are assessed based on perceived price, quality, safety, and convenience of offerings in the off- and on-premise dining environment.
Sociodemographic factors (gender, age, education, income, household size, and the number of children, etc.) are predicted to affect dining behavior [17,23,48]. However, the nature of relationships and behavioral patterns can vary across time and geographies. In addition, this study seeks to establish the relationship between off-and on-premise dining behavior, consumer knowledge of and attitude toward COVID-19, and telecommuting, in the North American context. Evidence about the connection between consumer perceptions and knowledge of contracting COVID-19 from restaurant food has not yet been fully understood. In this regard, Byrd, Her, et al. [23] found consumers show moderate concern of contracting the virus from restaurant food despite available public health guidelines asserting that COVID-19 is a respiratory virus. Interestingly, Byrd, Her, et al. [23] found consumers more concerned about food delivered by a third party than the restaurant itself. Although consumers’ knowledge about the virus has improved over time, misconceptions and beliefs surrounding the virus remain. Finally, telecommuting had already been a trend before the COVID-19 pandemic in western countries such as Canada [49]. Therefore, it would be interesting to explore how such a trend has influenced consumers’ dining behavior during COVID-19 and potentially into the future.
3. Data and Methodology
The study used the survey method and was carried out by Angus Reid (AR). Angus Reid has a sample panel of over one million participants nationally. Participants join the panel voluntarily (https://angusreid.org/how-we-poll-ari/, accessed on 15 March 2022). For this survey, participants were drawn from this sample panel of consumers in Canada who had lived there for at least 12 months at the time of the study and were 18 years or older. We asked AR to collect data randomly on a quota system that generally represents the Canadian population by age and gender within the region. AR would send an electronic message to their sample pool inviting them to participate in the survey voluntarily.
The survey used a structured questionnaire that was pretested to obtain an effective measuring tool. All questions were translated from English into French, and both versions were made available for participants. Since it was an exploratory study, a sample size of 1000 was thought to be adequate. The survey was hosted on an online platform called Qualtrics.
Data analysis for this exploratory study was carried out using SPSS version 27 in two stages: (1) descriptive analysis computed for all measures; (2) correlations and multi-variate analysis were conducted to better understand relationships between consumers’ off- and on-premise dining experience, sociodemographic variables, general COVID-19 knowledge, and the telecommuting experience of Canadian consumers. We used two sets of dependent variables: (1) experience of off-premise dining (takeout/delivery, curbside pickup, and drive-thru) and on-premise dining, and (2) perceived price, quality, food safety, and convenience of service offerings. All the dependent variables were measured on a Likert scale of 1 to 5 (Table 1).
4. Results
4.1. Descriptive Statistics
Table 2 describes the survey participants (49% male and 51% female). Around 64% and 24% of participants were common-law or married couples and singles, respectively. The study included diverse age groups and included those born from 1980 to 1994 (33%) and from 1946 to 1964 (31%), which accounted for about two-thirds of the study participants. About 68% of the participants had a “College, CEGEP or Other Non-University Certificate or Diploma” or higher. Most of the participants were from Ontario (36%), Quebec (22%), and Prairies (20%). In terms of household income, the majority of the study participants had a total household income (in CAD) between 100,000 and 149,999 (21%), 50,000 and 74,999 (21%), 150,000 or more (18%), and between 75,000 and 99,999 (16%). The distribution of participants by residential neighborhood was approximately even: suburban (36%), urban (32%), and small towns or rural areas (31%). Approximately 80% of the study participants claimed to have no dietary preferences.
4.2. Analysis of Canadian Consumers’ Dining Experience during and before COVID-19
Before exploring the study participants’ dining experience, we first asked them about their understanding of COVID-19 and its potential impact on the foodservice. The questions about COVID-19 related to general knowledge about the virus, its spreading mechanism within foodservice, and how the vaccine could limit its spread. The majority of study participants did have a good knowledge of COVID-19. Most of the study participants did disagree with the statement that “the availability of the vaccine would completely stop people from being infected” and “food handlers with no COVID-19 symptoms could not transmit the virus to customers” (Figure 3).
Next, study participants were asked to compare their dining experience during and before COVID-19 (Table 3). We run a paired sample t-test to determine the change in mean dining behavior of Canadian consumers during and pre-COVID-19. Based on the applied t-test, there was a statistically significant difference in dining behavior during the COVID-19 pandemic compared to the pre-COVID-19 level: on average, the study participants increased their “takeout”, “curbside pickup”, and “drive-thru” experience and decreased “on-premise dining” during the pandemic.
Table 4 provides the associations of changes in dining behavior by sociodemographic groups. For this analysis, we applied multivariate analysis of variance (MANOVA). Accordingly, we first checked the appropriateness of the dependent variables for MANOVA. The four dependent variables were measured on an ordinal scale of 1 to 5. Next, we used MANOVA to test the hypotheses that consumers’ dining experience changed during COVID-19 compared to their pre-COVID-19 level. MANOVA was preferred because it allows simultaneously comparing the means of off-dining (takeout, curbside pickup, and drive-thru) and on-premise dining experiences across several groups.
As shown in Table 4, there was a statistically significant difference between various sociodemographic groups (i.e., age, education, household income, marital status, and the number of children) and the combined dependent variables. Pillai’s Trace Test is considered a popular and robust test in MANOVA to study consumer perceptions [50].
After MANOVA confirmed the presence of statistically significant changes in dining behavior during COVID-19, we ran multiple individual analysis of variance (ANOVA) tests to find any differences in dining experience during COVID-19 among the various sociodemographic groups (Table 5). Gender was the only sociodemographic variable that turned out to be statistically insignificant (Pillai’s Trace Test) and thus was dropped from further analysis (i.e., p-value > 0.05).
Table 5 shows the one-way ANOVA with the test statistic. Where the assumption of the equality of group variances was not violated, the F-value and p-value were reported based on the Levene statistic; where the assumption of homogeneity of variances did not hold for the mean differences, the results were reported based on the Brown–Forsythe statistic.
There was a statistically significant difference between off-premise dining experience (takeout) among age groups during and before COVID-19 (Table 5). Those born from 1946 to 1964 had a lesser takeout experience than those born from 1980 to 1994 (p < 0.001). Likewise, there was a significant mean difference among education levels regarding takeout/delivery during and pre-COVID-19. Accordingly, consumers who had a “Registered Apprenticeship or Other Trades Certificate or Diploma” had a lesser takeout experience than those with a “University Degree, Certificate or Diploma” (p = 0.02) and an “Advanced University Degree” (p = 0.033). Also, those with a “College, CEGEP or Other Non-University Certificate or Diploma” had a lesser takeout experience than those with a “University Degree, Certificate or Diploma” (p = 0.001). Participants’ takeout experience during and before COVID-19 also varied by neighborhood; those who resided in small towns or rural areas had a lesser takeout experience than those who lived in the urban core (p < 0.001) and suburban areas (p = 0.002). We found no statistically significant mean difference during and before COVID-19 regarding takeout/delivery across various income groups.
Curbside pickup during and before COVID-19 was statistically significant among age groups. Those born from 1980 to 1994 had a better curbside experience than those born before 1946 (p = 0.029), from 1946 to 1964 (p < 0.001), and after 1994 (p = 0.014). Curbside pickup also differed along with education levels. Those with a “High School Diploma or Equivalent” had a lesser curbside pickup experience than those with a “University Degree, Certificate or Diploma” (p < 0.001) and those with an “Advanced University Degree” (p < 0.001). Also, participants with a “Registered Apprenticeship or Other Trades Certificate or Diploma” had a lesser curbside pickup experience than those with a “University Degree, Certificate or Diploma” (p < 0.01) and an “Advanced University Degree” (p = 0.002). Finally, those with a “College, CEGEP or Other Non-University Certificate or Diploma” had a lesser curbside pickup experience compared to those with a “University Degree, Certificate or Diploma” (p = 0.011) and an “Advanced University Degree” (p = 0.027). The mean curbside pickup during and before COVID-19 was also varied among neighborhoods. Those who lived in suburban areas had a better curbside pickup experience than those who resided in the urban core during COVID-19. Curbside pickup also varied along with income groups (p < 0.001). There was less use of curbside pickup by households with income levels less than CAD 35,000 per year compared to those with a household income of CAD 75,000 and 99,999 (p = 0.012), 100,000 and 149,999 (p < 0.001), and 150,000 and more (p = 0.004). Also, households with an income level between CAD 35,000 and 49,999 had less curbside experience than those with a household income range of 100,000 and 149,999 (p < 0.001) and 150,000 or more (p = 0.055). Likewise, those households with an income level of between CAD 50,000 and 74,999 had a lesser curbside experience during COVID-19 than those households whose household income was between CAD 100,000 and 149,999 (p = 0.025). Curbside pickup significantly differed between households with no children living in the house and those who had two children; those with two children tended to use more curbside pickup than those with no children (p < 0.001) and those with three or more children in the house (p = 0.038). In addition, married couples or common-law partners used more curbside pickups during COVID-19 than singles (p < 0.001).
Finally, both drive-thru and on-premise dining experiences during and before COVID-19 did not differ among the various sociodemographic groups.
4.3. General Knowledge of COVID-19 among Canadian Consumers and Dining Behavior
For this analysis, the study participants were asked several questions to assess their general knowledge of COVID-19 and the association with their off-premise dining experience during the pandemic. As shown in Table 6, the participants understood the virus and its transmission mechanisms well.
Next, factor analysis was conducted to examine how many components could explain the consumers’ general knowledge level (Table 7). A factor loading of 0.5 and more is needed to record the correlation relationship between the factor and observed variable [51]. The oblique rotation technique and principal components’ extraction as perceptions related to COVID-19 are relatively newer [52]. Accordingly, the factor “Food handlers who have no COVID-19 symptoms could not transmit COVID-19 to customers” and “The availability of the vaccine for the novel coronavirus will completely stop people from being infected” had a factor loading of below 0.5 and thus were dropped. The factor analysis of the remaining items returned a single component (i.e., theoretical construct “consumer knowledge”). The measure of sampling adequacy, Kaiser-Meyer-Olkin, was 0.846, suggesting the adequacy of the sample for factor analysis, with a high significance level of Bartlett’s test of sphericity (<0.001).
Finally, the correlation between consumers’ general knowledge and off-premise dining experience during the COVID-19 pandemic was carried out using Spearman’s rho. There was a statistically significant correlation between consumer’s general knowledge of COVID-19 and curbside pickup (positive, rs = 0.081, p = 0.01), drive-thru (negative, rs = −0.084, p = 0.008) and on-premise dining (negative, rs = −0.124, p < 0.001). No significant correlation was found between takeout/delivery and COVID-related knowledge of the study participants.
4.4. Telecommuting and Dining Behavior during COVID-19
A significant impact of the COVID-19 pandemic was lockdown measures imposed by national and provincial governments. Therefore, the study documented the participants’ professional profiles and telecommuting behavior (Table 8). Accordingly, around 43% of the study participants were professional (jobs that required a college degree) and 24% had no work, while 23% were non-professional (Table 3). Of those who did work, 81% were on a full-time basis. The majority of participants (61%) stated that they never telecommuted; about 39% mentioned they telecommuted once per week to every day. As shown in Table 7, the main reason for telecommuting was the COVID-19 pandemic (68%).
Table 9 displays the association between telecommuting and the dining behavior of consumers during the COVID-19 pandemic. There was a statistically significant difference between those who telecommuted at least once per week during the pandemic and those who never telecommuted regarding takeout/delivery and curbside pickup.
4.5. Perceptions of Canadian Consumers about the Quality of Off-Premise Restaurant Services
The study participants were asked to compare restaurant services off- and on-premise in terms of price, food quality, food safety, and convenience (Table 10). The mean scores for price and food quality were below the median value (on a Likert scale of 1 to 5), while the mean value for convenience was above it.
Next, MANOVA was carried out on the four dependent variables measuring service quality (price, food quality, food safety, and convenience) to examine how consumers perceived differences in restaurant services during COVID-19 compared to the pre-COVID-19 level. MANOVA was preferred to simultaneously compare the four service quality levels (price, food quality, food safety, and convenience).
There was a statistically significant difference between groups on combined dependent variables (Pillai’s trace test). Household income and education were the main predictors of differential perceptions in the price of a meal in takeout/delivery, curbside pickup and/or drive-thru, and that of a sit-down dining atmosphere. Household income, age, and gender were the main predictors of differential perceptions in food quality in takeout/delivery, curbside pickup and/or drive-thru, and a sit-down dining atmosphere. Age and gender were the main predictors for difference in perceptions regarding convenience in takeout/delivery, curbside pickup and/or drive-thru, and a sit-down dining atmosphere. There was no statistically significant difference among the various sociodemographic groups regarding perceived food safety during the pandemic compared to the pre-pandemic level (Table 11).
MANOVA confirmed three of the indicators to be highly significant (price, quality, and convenience), while food safety was not. We then carried out multiple ANOVA tests to test whether there were differences in perception among the various sociodemographic groups. Table 12 shows the one-way ANOVA with test statistics along with the corresponding F- and p-values. If the assumption of equality of group variances was not violated, the Levene statistic was applied to report the F- and p-values; otherwise, the results were reported based on the Brown–Forsythe statistic.
Men generally considered the price of off-premise meals reasonably expensive compared to females (p = 0.042); however, perceived prices did not vary by age group. In terms of income, those households with an income level of CAD 150,000 and more perceived off-premise dining less expensive than the sit-down environment compared to those whose income levels were less than CAD 35,000 (p = 0.047) and between CAD 35,000 and 49,999 (p = 0.039). Perceived prices under off-premise and sit-down environments differed among education groups. Consumers with an education level of “Some High School” considered off-premise meals more expensive compared to those with a “University Degree, Certificate or Diploma” (p = 0.033) and an “Advanced University Degree (Graduate)” (p = 0.022).
Men respondents considered the quality of off-premise meals somewhat lower compared to female participants (p = 0.002). However, within age groups, those born before 1946 perceived the food quality of off-premise dining more favorably than those born after 1994 (p = 0.005) and from 1980 to 1994 (p = 0.002). Also, those born from 1946 to 1964 had a positive perception about the quality of meals under the off-premise environment compared to those born from 1980 to 1994 (p = 0.003). There was no significant difference in the perceived quality of meals under the off-premise and sit-down environments along with the education groups. In terms of income, those with a household income level of CAD 150,000 and more perceived the quality of meals off-premise dining favourably compared to those with a household income of less than CAD 35,000 (p < 0.001), between CAD 35,000 and 49,999 (p < 0.001), between CAD 50,000 and 74,999 (p < 0.001), between CAD 75,000 and 99,999 (p < 0.001).
Female participants considered off-premise services to be more convenient compared to male respondents. There was a statistically significant difference among sociodemographic groups concerning the convenience of the off-premise and sit-down dining experience. Those born before 1946 felt the off-premise dining experience less convenient compared to those born after 1994 (p < 0.001), between 1980 to 1994 (p < 0.001) and 1965 to 1979 (p < 0.001). Also, those born from 1946 to 1964 perceived off-premise dining as less convenient than those born from 1980 to 1994 (p < 0.001). In terms of education, those with a “High School Diploma or Equivalent” perceived the off-premise dining experience as less convenient compared to those with a “University Degree, Certificate or Diploma” (p = 0.016). Likewise, those with “Registered Apprenticeship or Other Trades Certificate or Diploma” perceived the off-premise experience as less convenient compared to those with a “University Degree, Certificate or Diploma” (p < 0.001) and “Advanced University Degree (Graduate)” (p = 0.036). Perceived off- and on-premise service quality did not differ across the income groups. However, consumers who lived in small towns or rural areas perceived the off-premise dining experience as less convenient than suburban consumers (p = 0.023).
5. Discussion
This empirical study sought to explore the dining behavior of Canadian consumers concerning their experiences with three off-premise channels—takeout/delivery, curbside pickup, and drive-thru—and in-dining during the COVID-19 pandemic, and how they perceived the price, quality, safety, and convenience of service offerings during COVID-19 compared to the pre-COVID-19 level, and how such changes varied across various socioeconomic groups. The following sub-sections discuss the main findings.
5.1. Patterns in the Dining Behavior of Canadian Consumers across Sociodemographic Groups
The study involved a diverse group of participants (in terms of age, income, education, gender, etc.) across Canada. The participants exhibited good knowledge of COVID-19. Most of the study participants understood that the availability of the vaccine would not completely stop the COVID-19 virus from spreading. A potential implication for restaurant operators is that COVID-19 will likely have a lasting impact on dining behavior.
Our findings confirm significant changes in dining behavior during the COVID-19 pandemic compared to the pre-COVID-19 level. Overall, Canadian consumers had increased perception of the level of off-premise dining experiences (i.e., “takeout”, “curbside pickup”, and “drive-thru”) and decreased perception of the “on-premise” dining during the pandemic. These findings are in keeping with [17]. The results revealed that Canadian consumers used takeout/delivery more often, followed by drive-thru and curbside pickup. Curbside pickup showed the highest increase following COVID-19.
Takeout/delivery and curbside pickup varied across various sociodemographic groups while dining behavior during and before COVID-19 did not vary by gender; both male and female consumers exhibited a similar dining behavior during COVID-19 compared to the pre-COVID-19 level. Also, takeout/delivery and curbside pickup tended to vary across age groups, with older people having a lower takeout/delivery service experience than their younger counterparts. This finding also mirrors that of the curbside pickup, with the youngest participants having more curbside experiences than the oldest ones. Takeout/delivery services and curbside pickup vary significantly across education groups. We found increased use of takeout/delivery service and curbside pickup with the participants’ level of education. Also, curbside pickup varies by income group; households in the upper income category had more curbside pickup experiences than those in the lower-income category. However, takeout/delivery during COVID-19 did not vary based on the level of household income. Takeout/delivery and curbside pickup also differed by neighborhood. As expected, study participants living in small towns or rural areas had lower mean changes in takeout/delivery during COVID-19 than those residing in the suburban and urban core. On the other hand, consumers from suburban areas had more curbside pickup experiences than those from the urban core. Marital status tended to associate with changes in curbside pickup during COVID-19, with married or common-law partners opting for more curbside pickup than singles. Finally, the number of children living in the house was associated with curbside pickup during COVID-19; however, the relationship was not linear. We found that participants with two children had increased curbside pickup during COVID-19 compared to those with no or three or more children in the house.
5.2. Dining Behavior during the COVID-19 Pandemic and Telecommuting
Addressing how the COVID-19 pandemic and subsequent lockdown measures would lead to telecommuting as a sustainable and flexible work pattern is crucial for businesses [49,53,54]. Our study documented telecommuting patterns during and before COVID-19 and explored the reasons for such a pattern. A significant number of the study participants (39%) who had jobs did telecommute at least once per week, the majority being every day; about 68% of them started telecommuting following the COVID-19 pandemic. Although how many of those who telecommuted during COVID-19 would continue to do so post-COVID-19 is yet to be seen, the trend was already picking up in Canada even before the pandemic. Additionally, a recent study indicated an interest among Canadians in working remotely post-COVID-19 [49]. The findings, however, showed that telecommuting behavior during the COVID-19 pandemic was associated with a decrease in takeout/delivery and curbside pickup compared to those who never telecommuted.
Apart from the lockdown measures, several factors contribute to the recent telecommuting behavior, including increased fuel taxes and congestion charges and dependent children in the household. Based on the responses from the open-ended question, we found patterns along four lines—workspace/location management, job characteristics, convenience, time management, and health issues—as the reasons for remote working. The majority of the responses relate to workspace/location management and job characteristics. The main qualitative responses from the study participants are summarized in Table 13.
5.3. Patterns Regarding the Perceived Quality of Off-Premise Dining Services
Our study also examined the quality of services during the pandemic relative to pre-COVID-19 levels. The analysis focused on four indicators: price, food quality, food safety, and convenience. Generally, Canadian consumers perceived the price of meals as fairly expensive and of lesser quality and improvement regarding the convenience of off-premise dining services during COVID-19. In addition, consumers perceived no significant change in terms of food safety during COVID-19 compared to the pre-pandemic level. This is perhaps counter to several studies that reported otherwise, but in line with available public health guidelines and recent studies that provided no evidence supporting COVID-19 being transmitted by food or water [55,56]. However, concern about contracting COVID-19 from restaurant food was reported in several perception studies [23,57]. Canadian consumers seem to understand that COVID-19 did not directly impact food; this finding is consistent with a study among consumers in the United States [58].
In addition, perceived changes in meal prices, quality, and convenience during the COVID-19 pandemic varied across sociodemographic groups. Male participants considered off-premise meals as reasonably expensive, low quality, and less convenient compared to female respondents. There was a significant variation in perceived quality and convenience across age groups but not in the price of meals. We found that older people perceived the quality of off-premise meals favorably but of less convenience than younger ones. Perceived off-premise meal prices differed along with education levels; those participants with a lower level of education considered off-premise meals more expensive than participants with a higher level of education; however, no difference was observed in perceived quality by education groups. On the other hand, those with a lower level of education considered off-premise meals as less convenient than those with a higher level of education. Participants with a high level of household income considered off-premise meals less expensive and of good quality, while those with lower income levels perceived otherwise (i.e., more expensive and of low quality). No significant difference was observed among neighborhood groups regarding perceived quality and price of off-premise meals. As expected, those consumers living in small towns or rural areas considered off-premise meals less convenient than those in suburban areas.
5.4. Associations between Perceived Off-Premise Service Offerings and Dining Experiences
The previous sections have analyzed the changes in dining behavior before and during COVID-19 from two perspectives (off- and on-premise dining experience and the performance of foodservice operators in terms of price, quality, safety, and convenience) independently. This section brings the two perspectives together and explores the associations (if any) between dining experiences and the perceived performance of restaurant services during the COVID-19 pandemic.
As shown in Table 14, consumers’ perceptions about the price and convenience of off-premise service offerings were significantly correlated with frequency of takeout and curbside pickup during COVID-19. On the other hand, there was a significant association between the quality of off-premise service offerings and the frequency of takeout, and between food safety and the frequency of curbside pickup during the pandemic. These findings are consistent with the empirical literature that associates price, food quality, and quality of services with behavioral intentions and customer satisfaction in the foodservice industry [59].
6. Conclusions
The past two years have been challenging for the restaurant industry in Canada and many countries worldwide. This has led many casual and fine dining restaurants to adapt their business models to overcome the immediate and long-term impact of the pandemic. Indeed, the foodservice industry may have already established the necessary infrastructure and capability to offer off-premise services during the pandemic and, potentially, beyond [9]. This empirical study was carried out to explore the dining behavior of Canadian consumers during the COVID-19 pandemic and perceptions about the quality of off-premise services (i.e., price, quality, food safety, and convenience), and how such behavior varied across sociodemographic factors, general knowledge of COVID-19, and telecommuting trends.
Our study has confirmed the increased use of off-premise dining services (takeout/delivery, curbside pickup, and drive-thru) during the COVID-19 pandemic while consumers had significantly reduced their dining-in experience. Furthermore off-premise dining services tended to vary across sociodemographic groups such as age, education, household income, neighborhood, the number of children in the house, and marital status. Telecommuting is also an important trend in Canada; about 70% of the study participants did so following the COVID-19 pandemic. Apparently, the pandemic and the subsequent lockdown measures played a major role in the recent surge in telecommuting among Canadian consumers. Nevertheless, other interesting trends contribute to remote working, such as optimizing working space, travel time, and job characteristics. However, the findings confirm that telecommuting may reduce off-premise dining behaviors. Likewise, household income, age, and gender were the main sociodemographic variables that affected consumers’ perceptions about the quality of off-premise dining services during COVID-19. Studies elsewhere also indicated sociodemographic factors having a significant influence on consumer shopping behavior [20,44,60]; however, most of the studies are either not specific to off- and in-dining experiences or were carried out at the early stages of the COVID-19 pandemic.
This study contributes to the handful of studies in the literature that look at the impacts of the COVID-19 pandemic on the dining behavior of consumers in Canada [24,25,26,27,28]. The study has provided empirical evidence about the value of off-premise channels from the perspective of Canadian consumers. The findings may be particularly relevant for casual and fine dining restaurants to improve and optimize their infrastructure and capability and enhance customers’ on- and off-premise dining experiences. The findings may also have important implications for the sustainability of casual and dining restaurants. For example, Canadian consumers believe that the vaccine would not completely stop the COVID-19 virus from spreading, implying that fear and anxiety related to COVID-19 will likely continue to influence dining behavior even after federal and provincial government restrictions are lifted. Indeed, expanding our understanding of dining patterns during the COVID-19 pandemic would be highly relevant because fear and anxiety related to infectious diseases could arise any time in the future [17]. Furthermore, knowledge of the relationship between sociodemographic variables and off-premise dining behavior could improve channel decisions and messaging as operators prepare for a full-service post-pandemic. In times when consumer misconceptions about COVID-19 persist [23], off-premise channels, such as takeout/delivery, drive-thru, and curbside pickup, could remain valuable alternatives for the survival of the foodservice industry.
Author Contributions
Conceptualization, G.K.A. and S.C.; methodology, G.K.A. and S.C.; writing—original draft preparation, G.K.A.; writing—review and editing, S.C. and J.M. All authors have read and agreed to the published version of the manuscript.
Funding
Provided by the Agri-Food Analytics Lab at Dalhousie University.
Institutional Review Board Statement
This study was approved by the Social Sciences & Humanities Research Ethics Board of Dalhousie University (Reference Number: 2021-5502).
Informed Consent Statement
Informed consent was obtained from all study participants.
Data Availability Statement
Data can be available on request from the corresponding author.
Conflicts of Interest
The authors declare no conflict of interest.
References
- Aday, S.; Aday, M.S. Impact of COVID-19 on the food supply chain. Food Qual. Saf. 2020, 4, 167–180. [Google Scholar] [CrossRef]
- Chen, K.Z.; Mao, R. Fire lines as fault lines: Increased trade barriers during the COVID-19 pandemic further shatter the global food system. Food Sec. 2020, 12, 735–738. [Google Scholar] [CrossRef] [PubMed]
- Sarkodie, S.A.; Owusu, P.A. Global assessment of environment, health and economic impact of the novel coronavirus (COVID-19). Environ. Dev. Sustain. 2021, 23, 5005–5015. [Google Scholar] [CrossRef] [PubMed]
- Singh, S.; Kumar, R.; Panchal, R.; Tiwari, M.K. Impact of COVID-19 on logistics systems and disruptions in food supply chain. Int. J. Prod. Res. 2021, 59, 1993–2008. [Google Scholar] [CrossRef]
- Soon, J.M.; Vanany, I.; Abdul Wahab, I.R.; Hamdan, R.H.; Jamaludin, M.H. Food safety and evaluation of intention to practice safe eating out measures during COVID-19: Cross sectional study in Indonesia and Malaysia. Food Control 2021, 125, 107920. [Google Scholar] [CrossRef]
- Norris, C.L.; Taylor, S., Jr.; Taylor, D.C. Pivot! How the restaurant industry adapted during COVID-19 restrictions. Int. Hosp. Rev. 2021, 35, 132–155. [Google Scholar] [CrossRef]
- Pantano, E.; Pizzi, G.; Scarpi, D.; Dennis, C. Competing during a pandemic? Retailers’ ups and downs during the COVID-19 outbreak. J. Bus. Res. 2020, 116, 209–213. [Google Scholar] [CrossRef]
- Roy, H.; Gupta, V.; Faroque, A.R.; Patel, A. The impact of COVID-19 on the foodservice industry in Vancouver, British Columbia, Canada. Anatolia 2021, 32, 157–160. [Google Scholar] [CrossRef]
- Ma, J.; Webb, T.; Schwartz, Z. A blended model of restaurant deliveries, dine-in demand and capacity constraints. Int. J. Hosp. Manag. 2021, 96, 102981. [Google Scholar] [CrossRef]
- Gerace, A.; Rigney, G.; Anderson, J.R. Predicting attitudes towards easing COVID-19 restrictions in the United States of America: The role of health concerns, demographic, political, and individual difference factors. PLoS ONE 2022, 17, e0263128. [Google Scholar] [CrossRef]
- de Medeiros, J.F.; Marcon, A.; Ribeiro, J.L.D.; Quist, J.; D’Agostin, A. Consumer emotions and collaborative consumption: The effect of COVID-19 on the adoption of use-oriented product-service systems. Sustain. Prod. Consum. 2021, 27, 1569–1588. [Google Scholar] [CrossRef]
- Zhong, Y.; Oh, S.; Moon, H.C. What Can Drive Consumers’ Dining-Out Behavior in China and Korea during the COVID-19 Pandemic? Sustainability 2021, 13, 1724. [Google Scholar] [CrossRef]
- Flanagan, E.W.; Beyl, R.A.; Fearnbach, S.N.; Altazan, A.D.; Martin, C.K.; Redman, L.M. The Impact of COVID-19 Stay-At-Home Orders on Health Behaviors in Adults. Obesity 2021, 29, 438–445. [Google Scholar] [CrossRef] [PubMed]
- Gerritsen, S.; Egli, V.; Roy, R.; Haszard, J.; Backer, C.D.; Teunissen, L.; Cuykx, I.; Decorte, P.; Pabian, S.P.; Van Royen, K.; et al. Seven weeks of home-cooked meals: Changes to New Zealanders’ grocery shopping, cooking and eating during the COVID-19 lockdown. J. R. Soc. N. Z. 2021, 51, S4–S22. [Google Scholar] [CrossRef]
- Truong, D.; Truong, M.D. How do customers change their purchasing behaviors during the COVID-19 pandemic? J. Retail. Consum. Serv. 2022, 67, 102963. [Google Scholar] [CrossRef]
- Wang, C.; Han, J. Will the COVID-19 pandemic end with the Delta and Omicron variants? Environ. Chem. Lett. 2022. [Google Scholar] [CrossRef]
- Ko, Y.H.; Son, J.H.; Kim, G.J. An exploratory study of changes in consumer dining out behavior before and during COVID-19. J. Foodserv. Bus. Res. 2022, 0, 1–19. [Google Scholar] [CrossRef]
- Richards, T.J.; Rickard, B. COVID-19 impact on fruit and vegetable markets. Can. J. Agric. Econ. Rev. Can. D’agroeconomie 2020, 68, 189–194. [Google Scholar] [CrossRef]
- Sheth, J. Impact of COVID-19 on consumer behavior: Will the old habits return or die? J. Bus. Res. 2020, 117, 280–283. [Google Scholar] [CrossRef]
- Ferreira Rodrigues, J.; Cunha dos Santos Filho, M.T.; Aparecida de Oliveira, L.E.; Brandemburg Siman, I.; de Barcelos, A.F.; de Paiva Anciens Ramos, G.L.; Almeida Esmerino, E.; Gomes da Cruz, A.; Arriel, R.A. Effect of the COVID-19 pandemic on food habits and perceptions: A study with Brazilians. Trends Food Sci. Technol. 2021, 116, 992–1001. [Google Scholar] [CrossRef]
- Restaurants Canada Commercial Foodservice Sales Forecast to Rise to $80B in 2022. Available online: https://www.restaurantscanada.org/resources/commercial-foodservice-sales-forecast-to-rise-to-80b-in-2022/?lang=fr (accessed on 10 March 2022).
- Goddard, E. The impact of COVID-19 on food retail and food service in Canada: Preliminary assessment. Can. J. Agric. Econ./Rev. Can. D’agroeconomie 2020, 68, 157–161. [Google Scholar] [CrossRef]
- Byrd, K.; Her, E.; Fan, A.; Almanza, B.; Liu, Y.; Leitch, S. Restaurants and COVID-19: What are consumers’ risk perceptions about restaurant food and its packaging during the pandemic? Int. J. Hosp. Manag. 2021, 94, 102821. [Google Scholar] [CrossRef] [PubMed]
- Kitz, R.; Walker, T.; Charlebois, S.; Music, J. Food packaging during the COVID-19 pandemic: Consumer perceptions. Int. J. Consum. Stud. 2022, 46, 434–448. [Google Scholar] [CrossRef] [PubMed]
- Mullins, L.; Charlebois, S.; Finch, E.; Music, J. Home Food Gardening in Canada in Response to the COVID-19 Pandemic. Sustainability 2021, 13, 3056. [Google Scholar] [CrossRef]
- Sayyida, S.; Hartini, S.; Gunawan, S.; Husin, S.N. The Impact of the COVID-19 Pandemic on Retail Consumer Behavior. APTISI Trans. Manag. (ATM) 2021, 5, 79–88. [Google Scholar] [CrossRef]
- Everitt, H.; van der Werf, P.; Seabrook, J.A.; Wray, A.; Gilliland, J.A. The quantity and composition of household food waste during the COVID-19 pandemic: A direct measurement study in Canada. Socio-Econ. Plan. Sci. 2021; in press. [Google Scholar] [CrossRef]
- Laila, A.; von Massow, M.; Bain, M.; Parizeau, K.; Haines, J. Impact of COVID-19 on food waste behaviour of families: Results from household waste composition audits. Socio-Econ. Plan. Sci. 2021, in press. [Google Scholar] [CrossRef]
- Hakim, M.P.; Zanetta, L.D.; da Cunha, D.T. Should I stay, or should I go? Consumers’ perceived risk and intention to visit restaurants during the COVID-19 pandemic in Brazil. Food Res. Int. 2021, 141, 110152. [Google Scholar] [CrossRef]
- Brewer, P.; Sebby, A.G. The effect of online restaurant menus on consumers’ purchase intentions during the COVID-19 pandemic. Int. J. Hosp. Manag. 2021, 94, 102777. [Google Scholar] [CrossRef]
- Breier, M.; Kallmuenzer, A.; Clauss, T.; Gast, J.; Kraus, S.; Tiberius, V. The role of business model innovation in the hospitality industry during the COVID-19 crisis. Int. J. Hosp. Manag. 2021, 92, 102723. [Google Scholar] [CrossRef]
- Chuah, S.H.-W.; Aw, E.C.-X.; Cheng, C.-F. A silver lining in the COVID-19 cloud: Examining customers’ value perceptions, willingness to use and pay more for robotic restaurants. J. Hosp. Mark. Manag. 2022, 31, 49–76. [Google Scholar] [CrossRef]
- Renner, B.; Sproesser, G.; Strohbach, S.; Schupp, H.T. Why we eat what we eat. The Eating Motivation Survey (TEMS). Appetite 2012, 59, 117–128. [Google Scholar] [CrossRef] [PubMed] [Green Version]
- Robinson, E.; Tobias, T.; Shaw, L.; Freeman, E.; Higgs, S. Social matching of food intake and the need for social acceptance. Appetite 2011, 56, 747–752. [Google Scholar] [CrossRef] [PubMed]
- Tomiyama, A.J.; Mann, T.; Comer, L. Triggers of eating in everyday life. Appetite 2009, 52, 72–82. [Google Scholar] [CrossRef] [Green Version]
- Fisher, J.J.; Almanza, B.A.; Behnke, C.; Nelson, D.C.; Neal, J. Norovirus on cruise ships: Motivation for handwashing? Int. J. Hosp. Manag. 2018, 75, 10–17. [Google Scholar] [CrossRef]
- Jaeger, S.R.; Vidal, L.; Ares, G.; Chheang, S.L.; Spinelli, S. Healthier eating: COVID-19 disruption as a catalyst for positive change. Food Qual. Prefer. 2021, 92, 104220. [Google Scholar] [CrossRef]
- Caso, D.; Guidetti, M.; Capasso, M.; Cavazza, N. Finally, the chance to eat healthily: Longitudinal study about food consumption during and after the first COVID-19 lockdown in Italy. Food Qual. Prefer. 2022, 95, 104275. [Google Scholar] [CrossRef]
- Molina-Montes, E.; Uzhova, I.; Verardo, V.; Artacho, R.; García-Villanova, B.; Jesús Guerra-Hernández, E.; Kapsokefalou, M.; Malisova, O.; Vlassopoulos, A.; Katidi, A.; et al. Impact of COVID-19 confinement on eating behaviours across 16 European countries: The COVIDiet cross-national study. Food Qual. Prefer. 2021, 93, 104231. [Google Scholar] [CrossRef]
- Li, S.; Kallas, Z.; Rahmani, D. Did the COVID-19 lockdown affect consumers’ sustainable behaviour in food purchasing and consumption in China? Food Control 2022, 132, 108352. [Google Scholar] [CrossRef]
- Ammar, A.; Brach, M.; Trabelsi, K.; Chtourou, H.; Boukhris, O.; Masmoudi, L.; Bouaziz, B.; Bentlage, E.; How, D.; Ahmed, M.; et al. Effects of COVID-19 Home Confinement on Eating Behaviour and Physical Activity: Results of the ECLB-COVID19 International Online Survey. Nutrients 2020, 12, 1583. [Google Scholar] [CrossRef]
- Galali, Y. The impact of COVID-19 confinement on the eating habits and lifestyle changes: A cross sectional study. Food Sci. Nutr. 2021, 9, 2105–2113. [Google Scholar] [CrossRef] [PubMed]
- Crosta, A.D.; Ceccato, I.; Marchetti, D.; Malva, P.L.; Maiella, R.; Cannito, L.; Cipi, M.; Mammarella, N.; Palumbo, R.; Verrocchio, M.C.; et al. Psychological factors and consumer behavior during the COVID-19 pandemic. PLoS ONE 2021, 16, e0256095. [Google Scholar] [CrossRef] [PubMed]
- Marinković, V.; Lazarević, J. Eating habits and consumer food shopping behaviour during COVID-19 virus pandemic: Insights from Serbia. Br. Food J. 2021, 123, 3970–3987. [Google Scholar] [CrossRef]
- Byrd, K.; Her, E.; Fan, A.; Liu, Y.; Leitch, S. Consumers’ threat and coping appraisals of in-restaurant dining during a pandemic–The moderating roles of conflicting information and trust-in-science and scientists. Int. J. Hosp. Manag. 2022, 103, 103186. [Google Scholar] [CrossRef]
- Byrd, K.; Fan, A.; Her, E.; Liu, Y.; Leitch, S.; Almanza, B. Restaurant patronage during the COVID-19 pandemic and the protection motivation theory: Influence of consumers’ socio-demographic, situational, and psychographic factors. J. Foodserv. Bus. Res. 2021, 1–29. [Google Scholar] [CrossRef]
- Kim, M.; Kim, E.J.; Bai, B. Examining restaurant purchase intention during crises: The role of message appeal. Int. J. Contemp. Hosp. Manag. 2021, 33, 4373–4390. [Google Scholar] [CrossRef]
- Knight, A.J.; Worosz, M.R.; Todd, E.C.D. Dining for Safety: Consumer Perceptions of Food Safety and Eating Out. J. Hosp. Tour. Res. 2009, 33, 471–486. [Google Scholar] [CrossRef]
- Music, J.; Charlebois, S.; Toole, V.; Large, C. Telecommuting and food E-commerce: Socially sustainable practices during the COVID-19 pandemic in Canada. Transp. Res. Interdiscip. Perspect. 2022, 13, 100513. [Google Scholar] [CrossRef]
- Bryant, C.J.; Barnett, J.C. What’s in a name? Consumer perceptions of in vitro meat under different names. Appetite 2019, 137, 104–113. [Google Scholar] [CrossRef]
- Hair, J.F.; Black, W.C.; Babin, B.J. Multivariate Data Analysis: A Global Perspective; Pearson Education: London, UK, 2010; ISBN 978-0-13-515309-3. [Google Scholar]
- Filimonau, V.; Vi, L.H.; Beer, S.; Ermolaev, V.A. The COVID-19 pandemic and food consumption at home and away: An exploratory study of English households. Socio-Econ. Plan. Sci. 2021, in press. [Google Scholar] [CrossRef]
- Nayak, S.; Pandit, D. Potential of telecommuting for different employees in the Indian context beyond COVID-19 lockdown. Transp. Policy 2021, 111, 98–110. [Google Scholar] [CrossRef]
- Borkowski, P.; Jażdżewska-Gutta, M.; Szmelter-Jarosz, A. Lockdowned: Everyday mobility changes in response to COVID-19. J. Transp. Geogr. 2021, 90, 102906. [Google Scholar] [CrossRef]
- Maragoni-Santos, C.; Serrano Pinheiro de Souza, T.; Matheus, J.R.V.; de Brito Nogueira, T.B.; Xavier-Santos, D.; Miyahira, R.F.; Costa Antunes, A.E.; Fai, A.E.C. COVID-19 pandemic sheds light on the importance of food safety practices: Risks, global recommendations, and perspectives. Crit. Rev. Food Sci. Nutr. 2021, 1–13. [Google Scholar] [CrossRef] [PubMed]
- Shahidi, F. Does COVID-19 Affect Food Safety and Security? J. Food Bioact. 2020, 9, 1–3. [Google Scholar] [CrossRef] [Green Version]
- Meixner, O.; Katt, F. Assessing the Impact of COVID-19 on Consumer Food Safety Perceptions—A Choice-Based Willingness to Pay Study. Sustainability 2020, 12, 7270. [Google Scholar] [CrossRef]
- Thomas, M.S.; Feng, Y. Consumer risk perception and trusted sources of food safety information during the COVID-19 pandemic. Food Control 2021, 130, 108279. [Google Scholar] [CrossRef]
- Ababneh, K.I.; Ponnaiyan, S.; ElMelegy, A.R.; Prybutok, V. Determinants of customer satisfaction and behavioral intentions in fast-food restaurants among undergraduate students during the COVID-19 pandemic. Qual. Manag. J. 2022, 1–21. [Google Scholar] [CrossRef]
- Valaskova, K.; Durana, P.; Adamko, P. Changes in Consumers’ Purchase Patterns as a Consequence of the COVID-19 Pandemic. Mathematics 2021, 9, 1788. [Google Scholar] [CrossRef]
Figure 1.
Conceptual framework.

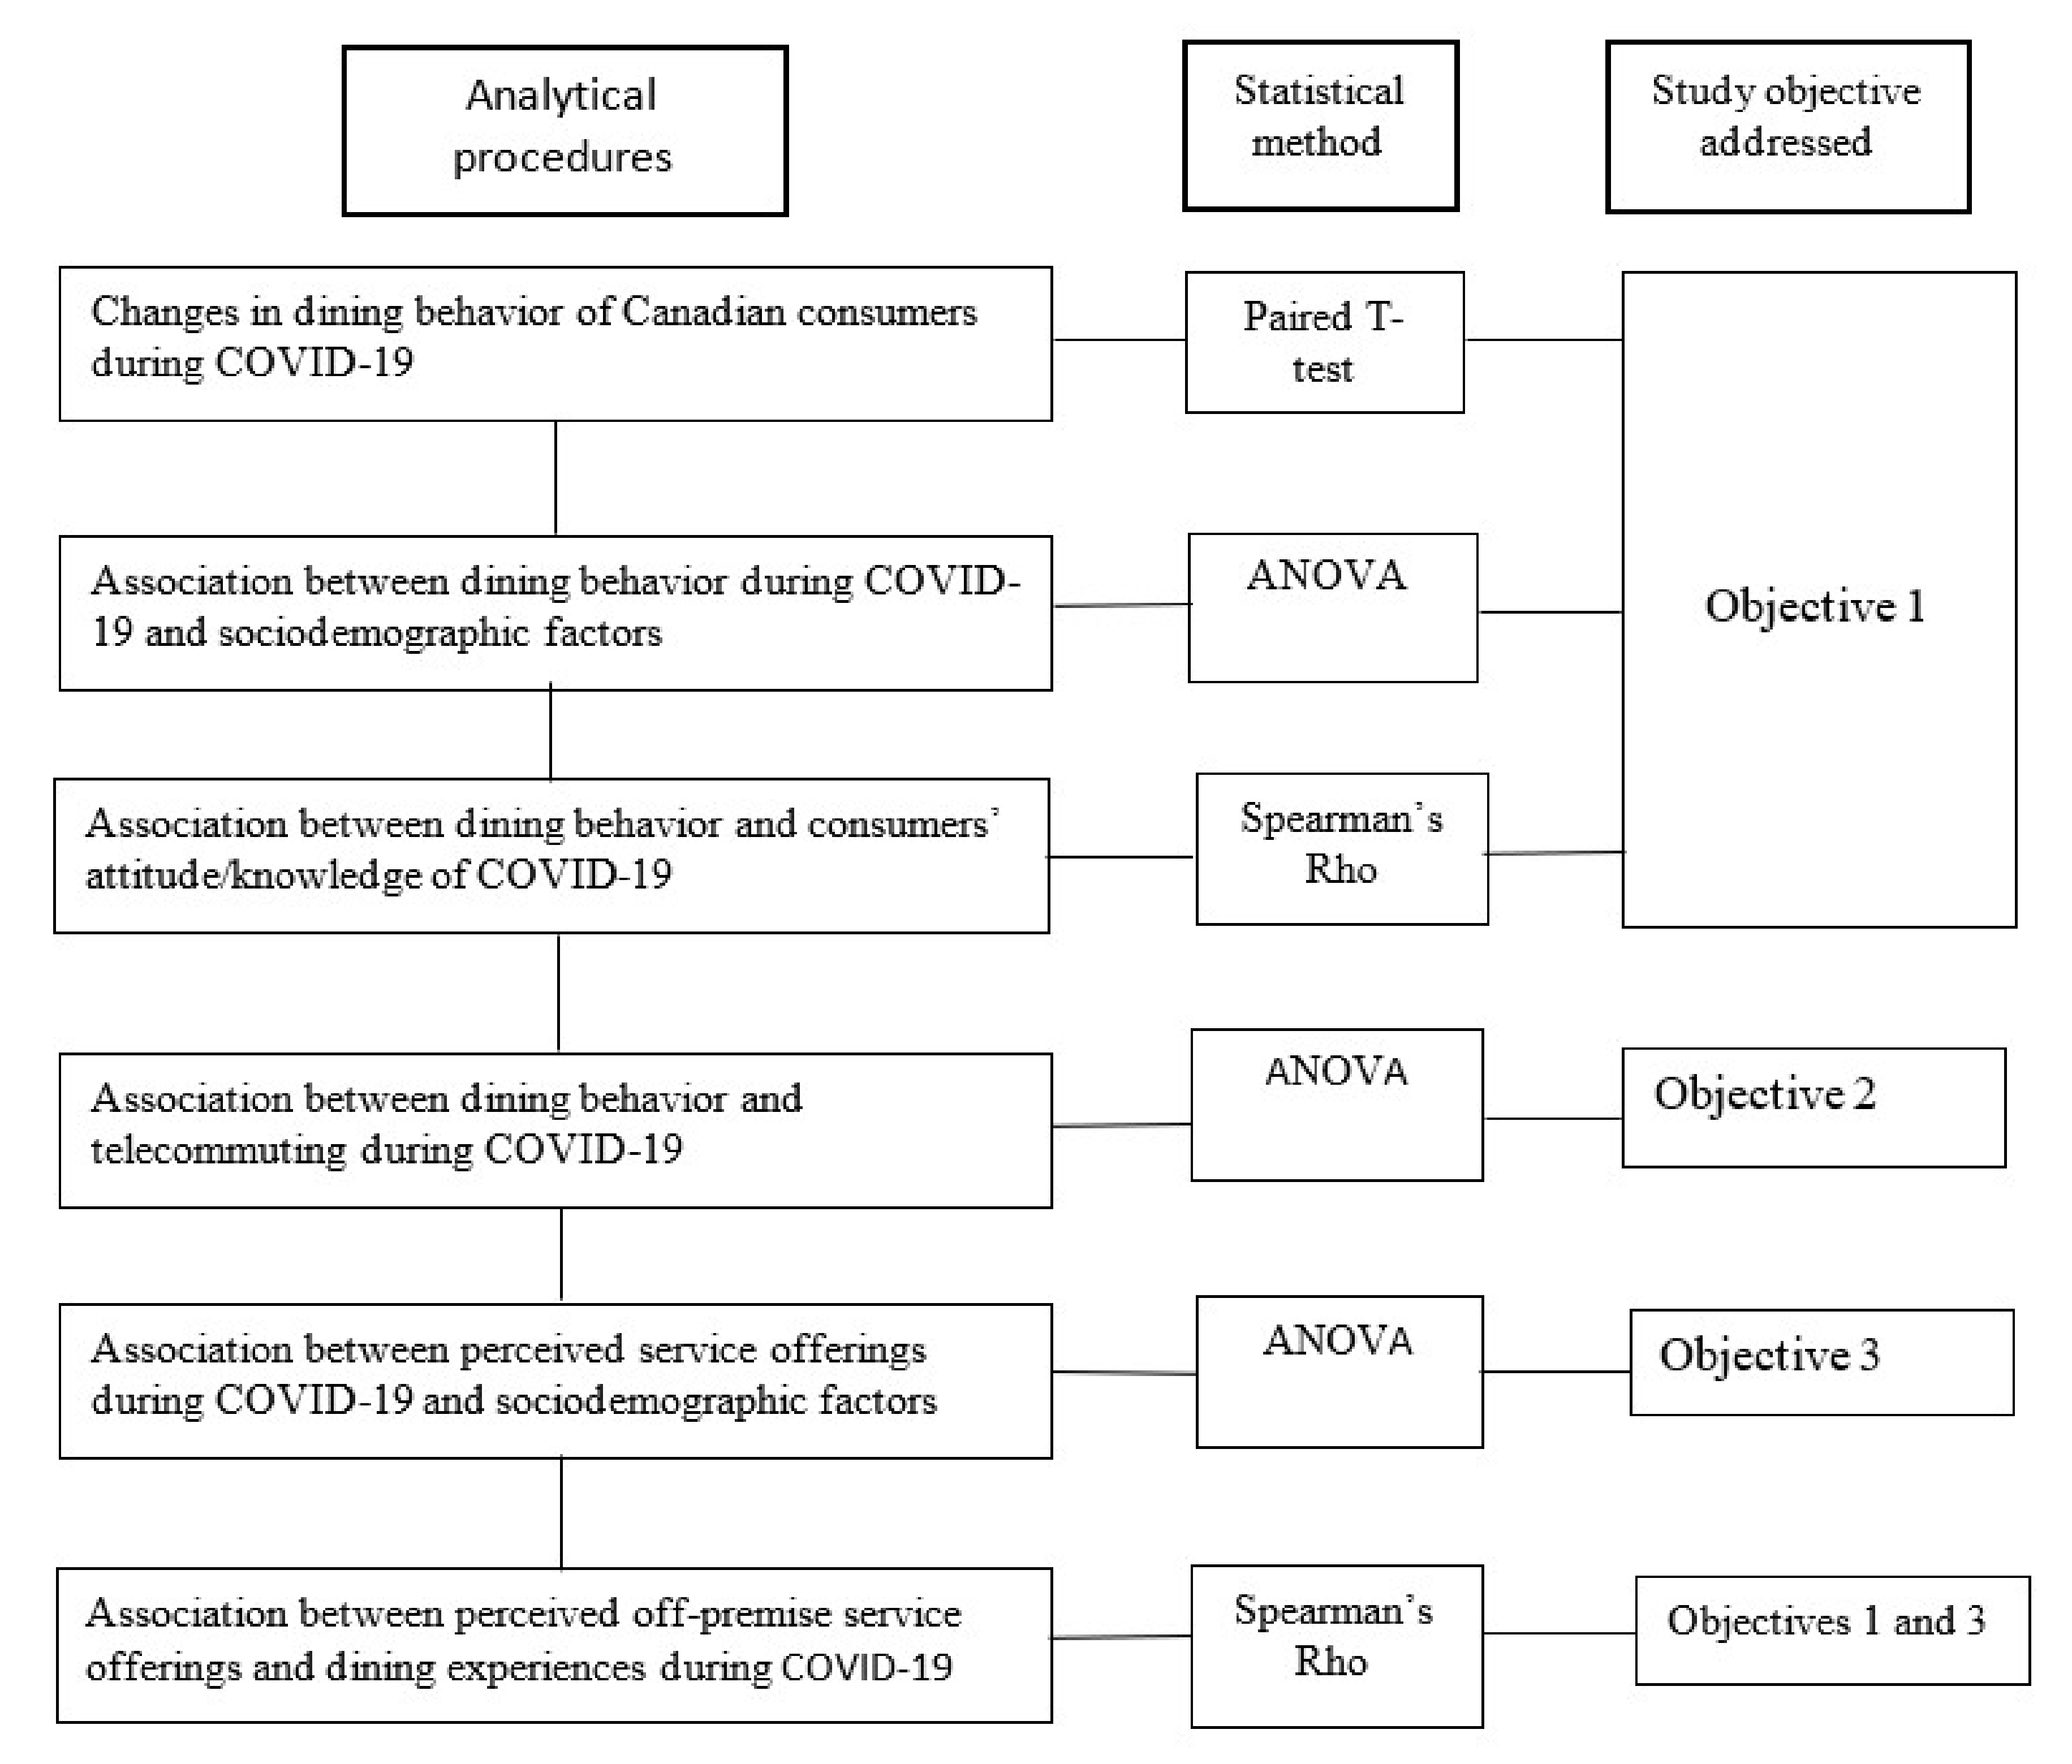
Figure 2.
Data analysis procedure.

Figure 3.
Canadian consumers’ COVID-19-related knowledge.


Table 1.
Measurement scales of variables included in the analysis.
| Factors | Variables | Measurement Scale |
|---|---|---|
| Dependent variables | ||
| Off- and on-premise dining experience during COVID-19 | Categorical: | |
| Takeout/delivery services | Never (1), Once a month (2), Once a week (3), Twice a week (4), Three or more a week (5) | |
| Curbside pickup | Categorical: Never (1), Once a month (2), Once a week (3), Twice a week (4), Three or more a week (5) | |
| Drive-thru | Categorical: Never (1), Once a month (2), Once a week (3), Twice a week (4), Three or more a week (5) | |
| On-premise dinning | Categorical: Never (1), Once a month (2), Once a week (3), Twice a week (4), Three or more a week (5) | |
| Perceived off-premise services during COVID-19 | Likert-Scale | |
| Price | Expensive (1) to very cheap (5) | |
| Food quality | Inferior (1) to Very good (5) | |
| Food safety | Unsafe (1) to Very safe (5) | |
| Convenience | Highly inconvenient (1) to Highly convenient (5) | |
| Independent variables | ||
| Sociodemographic | Categorical | |
| Age | After 1994 (1), From 1980 to 1994 (2), From 1965 to 1979 (3), From 1946 to 1964 (4), Before 1946 (5) | |
| Gender | Male (1), Female (2), Non-binary (3), Prefer not to say (4) | |
| Education | Some High School (1), High School Diploma or Equivalent (2) Registered Apprenticeship or Other Trades Certificate or Diploma (3), College, CEGEP or Other Non-University Certificate or Diploma (4) University Degree, Certificate or Diploma (5) Advanced University Degree (Graduate) (6) | |
| Family income (in CAD) | Less than 35,000 (1), Between 35,000 and 49,999 (2), Between 50,000 and 74,999 (3), Between 75,000 and 99,999 (4), Between 100,000 and 149,999 (5) 150,000+ (6) | |
| Marital status | Single (1), Married or common-law (2), Divorced, separated or widowed (3) | |
| Number of children | None (1), One (2) Two (3), Three or more (4) | |
| Neighborhood | Urban Core (1), Suburban (2), Small town/rural (3) | |
| Attitude/Knowledge of COVID-19 | 8 items | Likert Scale: Strongly Disagree (1) to Strongly Agree (5) |
| Telecommuting | Frequency of telecommuting | Likert Scale: Never (1) to Everyday (5) |
Table 2.
Sociodemographic characteristics of survey respondents.
| Demographic Characteristics | Frequency | % |
|---|---|---|
| Gender (n = 1018) | ||
| Male | 495 | 48.6 |
| Female | 517 | 50.8 |
| Non-binary/third gender | 4 | 0.4 |
| Prefer not to say | 2 | 0.2 |
| Marital status (n = 1020) | ||
| Single | 248 | 24.3 |
| Married or common-law | 657 | 64.4 |
| Divorced, separated or widowed | 115 | 11.3 |
| Age category (n = 1021) | ||
| After 1994 | 82 | 8 |
| From 1980 to 1994 | 333 | 32.6 |
| From 1965 to 1979 | 241 | 23.6 |
| From 1946 to 1964 | 321 | 31.4 |
| Before 1946 | 44 | 4.3 |
| Number of children living in the household (n = 1021) | ||
| None | 692 | 67.8 |
| One | 145 | 14.2 |
| Two | 131 | 12.8 |
| Three or more | 53 | 5.2 |
| Education (n = 1020) | ||
| Some High School | 37 | 3.6 |
| High School Diploma or Equivalent | 194 | 19 |
| Registered Apprenticeship or Other Trades Certificate or Diploma | 95 | 9.3 |
| College, CEGEP or Other Non-University Certificate or Diploma | 255 | 25 |
| University Degree, Certificate or Diploma | 290 | 28.4 |
| Advanced University Degree (Graduate) | 149 | 14.6 |
| Region (n = 1017) | ||
| British Columbia | 148 | 14.6 |
| Prairies | 203 | 20 |
| Ontario | 369 | 36.3 |
| Quebec | 222 | 21.8 |
| Atlantic Canada | 73 | 7.2 |
| Northern Region | 2 | 0.2 |
| Total household income (in CAD) (n = 997) | ||
| Less than 35,000 | 113 | 11.3 |
| Between 35,000 and 49,999 | 122 | 12.2 |
| Between 50,000 and 74,999 | 209 | 21 |
| Between 75,000 and 99,999 | 163 | 16.3 |
| Between 100,000 and 149,999 | 210 | 21.1 |
| 150,000+ | 180 | 18.1 |
| Residential neighborhood (n = 1021) | ||
| Urban Core | 331 | 32.4 |
| Suburban | 369 | 36.1 |
| Small town or rural | 321 | 31.4 |
| Dietary preferences (n = 1067) | ||
| Consumer with no dietary preferences | 850 | 79.7 |
| Vegetarian (diet free of meat, fish, and fowl flesh) | 17 | 1.6 |
| Lacto-ovo vegetarian (diet free of animal flesh but eats eggs and milk products) | 7 | 0.7 |
| Pescatarian (diet free of land animal flesh but eats eggs, fish, and milk products) | 24 | 2.2 |
| Vegan (diet free of all animal-based products) | 21 | 2 |
| Flexitarian (vegetarian who occasionally eats meat and fish) | 73 | 6.8 |
| Consumer with specific religious or cultural dietary preferences | 13 | 1.2 |
| Other | 62 | 5.8 |
Table 3.
Dining behavior of Canadian consumers during and before COVID-19 (Paired T-test).
| How Often Did You Use (1 = Never; 5 = Three or More a Week) | N | During Pandemic | Before Pandemic | Mean Difference | SD | Paired T-Value | p-Value |
|---|---|---|---|---|---|---|---|
| Mean | Mean | ||||||
| Takeout/delivery services | 1033 | 2.54 | 2.29 | 0.25 | 0.958 | 8.48 | <0.001 |
| Curbside pickup | 1032 | 1.81 | 1.24 | 0.57 | 0.912 | 20.08 | <0.001 |
| Drive-thru | 1031 | 2.35 | 2.29 | 0.06 | 0.863 | 2.24 | 0.025 |
| On-premise dinning | 1028 | 1.73 | 2.52 | −0.79 | 0.891 | −28.39 | <0.001 |
Table 4.
Mean changes in dining experience during and before COVID-19 by sociodemographic (MANOVA).
| Socio Demographic Variables | Dining Experience | Type III Sum of Squares | F-Statistic | p-Value | Pillai’s Trace Test | ||
|---|---|---|---|---|---|---|---|
| Value | F-Value | p-Value | |||||
| Gender | Takeout | 4.135 | 1.516 | 0.209 | 0.018 | 1.535 | 0.104 |
| Curbside pickup | 4.339 | 1.732 | 0.159 | ||||
| Drive-thru | 4.948 | 2.213 | 0.085 | ||||
| On-premise dinning | 0.174 | 0.073 | 0.974 | ||||
| Age | Takeout | 16.426 | 4.572 | 0.001 | 0.05 | 3.20 | <0.001 |
| Curbside pickup | 19.955 | 6.095 | <0.001 | ||||
| Drive-thru | 0.722 | 0.244 | 0.913 | ||||
| On-premise dinning | 5.558 | 1.747 | 0.137 | ||||
| Education | Takeout | 23.325 | 5.224 | <0.001 | 0.068 | 3.469 | <0.001 |
| Curbside pickup | 34.077 | 8.458 | <0.001 | ||||
| Drive-thru | 1.713 | 0.463 | 0.804 | ||||
| On-premise dinning | 4.369 | 1.096 | 0.361 | ||||
| Income levels | Takeout | 3.764 | 0.826 | 0.531 | 0.043 | 2.131 | 0.002 |
| Curbside pickup | 29.298 | 7.134 | <0.001 | ||||
| Drive-thru | 5.355 | 1.415 | 0.216 | ||||
| On-premise dinning | 1.175 | 0.294 | 0.917 | ||||
| Neighbourhood | Takeout | 15.253 | 8.497 | <0.001 | 0.025 | 3.204 | 0.001 |
| Curbside pickup | 6.960 | 4.194 | 0.015 | ||||
| Drive-thru | 1.014 | 0.680 | 0.507 | ||||
| On-premise dinning | 0.743 | 0.468 | 0.626 | ||||
| Marital status | Takeout | 2.218 | 1.216 | 0.297 | 0.026 | 3.295 | <0.001 |
| Curbside pickup | 15.056 | 9.156 | <0.001 | ||||
| Drive-thru | 0.333 | 0.225 | 0.798 | ||||
| On-premise dinning | 2.024 | 1.277 | 0.279 | ||||
| Number of children in the house | Takeout | 3.141 | 1.148 | 0.329 | 0.035 | 2.938 | <0.001 |
| Curbside pickup | 21.306 | 8.700 | <0.001 | ||||
| Drive-thru | 1.788 | 0.798 | 0.495 | ||||
| On-premise dinning | 0.935 | 0.390 | 0.760 | ||||
Table 5.
Mean differences in dining behavior during and before COVID-19 (ANOVA).
| Sociodemographic Variables | Takeout/Delivery | Curbside Pickup | Drive-thru | On-Premise Dinning | ||||
|---|---|---|---|---|---|---|---|---|
| F(p)-Value | Mean Difference | F(p)-Value | Mean Difference | F(p)-Value | Mean Difference | F(p)-Value | Mean Difference | |
| Age | ||||||||
| After 1994 | 4.552 (0.001) | 0.341 | 7.099 (<0.001) | 0.390 | 0.245 (0.913) | 0.037 | 1.769 (0.133) | −0.550 |
| From 1980 to 1994 | 0.387 | 0.744 | 0.057 | −0.781 | ||||
| From 1965 to 1979 | 0.232 | 0.602 | 0.041 | −0.842 | ||||
| From 1946 to 1964 | 0.097 | 0.458 | 0.097 | −0.818 | ||||
| Before 1946 | 0.455 | 0.318 | 0.000 | −0.837 | ||||
| Education | ||||||||
| Some High School | 4.838 (<0.001) | 0.189 | 9.125 (<0.001) | 0.460 | 0.467 (0.801) | 0.135 | 1.075 (0.372) | −0.568 |
| High School Diploma or Equivalent | 0.211 | 0.345 | 0.016 | −0.705 | ||||
| Registered Apprenticeship or Other Trades Certificate or Diploma | 0.011 | 0.337 | 0.160 | −0.821 | ||||
| College, CEGEP or Other Non-University Certificate or Diploma | 0.122 | 0.508 | 0.059 | −0.823 | ||||
| University Degree, Certificate or Diploma | 0.438 | 0.766 | 0.055 | −0.813 | ||||
| Advanced University Degree (Graduate) | 0.383 | 0.792 | 0.101 | −0.851 | ||||
| Household income (in CAD) | ||||||||
| Less than 35,000 | 0.848 (0.516) | 0.186 | 7.614 (<0.001) | 0.265 | 1.422 (0.216) | 0.027 | 0.309 (0.908) | −0.699 |
| Between 35,000 and 49,999 | 0.139 | 0.361 | −0.098 | −0.815 | ||||
| Between 50,000 and 74,999 | 0.254 | 0.526 | 0.120 | −0.799 | ||||
| Between 75,000 and 99,999 | 0.319 | 0.636 | 0.123 | −0.772 | ||||
| Between 100,000 and 149,999 | 0.314 | 0.800 | 0.119 | −0.814 | ||||
| 150,000+ | 0.300 | 0.661 | 0.039 | −0.804 | ||||
| Neighbourhood | ||||||||
| Urban Core | 9.067 (<0.001) | 0.369 | 3.76 (0.024) | 0.509 | 0.687 (0.689) | 0.073 | 0.427 (0.653) | −0.812 |
| Suburban | 0.320 | 0.678 | 0.098 | −0.802 | ||||
| Small town or rural | 0.075 | 0.520 | 0.022 | −0.752 | ||||
| Marital status | ||||||||
| Single | 1.237 (0.291) | 0.331 | 10.98 (<0.001) | 0.387 | 0.219 (0.803) | 0.040 | 1.267 (0.282) | −0.720 |
| Married or common-law | 0.244 | 0.663 | 0.063 | −0.803 | ||||
| Divorced, separated | 0.174 | 0.470 | 0.104 | −0.867 | ||||
| Children | ||||||||
| None | 0.971 (0.406) | 0.276 | 7.224 (<0.001) | 0.490 | 0.782 (0.504) | 0.059 | 0.584 (0.626) | −0.793 |
| One | 0.159 | 0.683 | 0.076 | −0.821 | ||||
| Two | 0.313 | 0.916 | 0.015 | −0.817 | ||||
| Three or more | 0.151 | 0.519 | 0.226 | −0.642 | ||||
Table 6.
Canadian consumers’ knowledge about the COVID-19 pandemic.
| Variable | Obs. | Mean | SD | Min | Max |
|---|---|---|---|---|---|
| The COVID-19 virus spreads via respiratory droplets of infected individuals | 1040 | 4.23 | 1.16 | 1 | 5 |
| Wearing general medical masks can prevent one from acquiring infection by the COVID-19 virus. | 1038 | 3.65 | 1.28 | 1 | 5 |
| To prevent the infection by COVID-19, individuals should avoid going to crowded places such as casual dining restaurants | 1042 | 3.52 | 1.25 | 1 | 5 |
| Handwashing with water and soap before meal preparation helps to reduce the risks of transmission of coronavirus. | 1039 | 4.04 | 1.06 | 1 | 5 |
| Food handlers who have no COVID-19 symptoms could not transmit COVID-19 to customers. | 1038 | 1.97 | 1.12 | 1 | 5 |
| A crowded restaurant with no social distancing measures increases the risks of transmission of COVID-19. | 1039 | 4.15 | 1.13 | 1 | 5 |
| The coronavirus pandemic is not a hoax; it is a serious disease. | 1040 | 4.31 | 1.17 | 1 | 5 |
| The availability of the vaccine for the novel coronavirus will completely stop people from being infected. | 1042 | 2.19 | 1.15 | 1 | 5 |
Table 7.
Component Matrix results.
| Canadian Consumers COVID-19 Knowledge | α = 0.846 |
|---|---|
| Wearing general medical masks can prevent one from acquiring infection by the COVID-19 virus. | 0.799 |
| A crowded restaurant with no social distancing measures increase risks of transmission of COVID-19. | 0.789 |
| To prevent the infection by COVID-19, individuals should avoid going to crowded places such as casual dining restaurants | 0.780 |
| The coronavirus pandemic is not a hoax; it is a serious disease. | 0.758 |
| The COVID-19 virus spreads via respiratory droplets of infected individuals | 0.682 |
| Handwashing with water and soap before meal preparation helps to reduce risks of transmission of coronavirus. | 0.567 |
Table 8.
Telecommuting behavior of Canadian consumers.
| Working Condition | % |
|---|---|
| Type of work (n = 1050) | |
| Professional (requires college degree) | 42.7 |
| Non-professional (without a college degree) | 23.0 |
| Self-employed | 9.6 |
| No work | 24.7 |
| Employment status (n = 720) | |
| Employed full-time | 80.7 |
| Employed part-time | 19.3 |
| How often do you telecommute? (n = 1052) | |
| Never | 61.1 |
| Once a week | 9.2 |
| Twice a week | 5.2 |
| Three or four times a week | 6.8 |
| Everyday | 17.6 |
| When did you start telecommuting? (n = 414) | |
| Before the COVID-19 pandemic | 30.4 |
| After the COVID-19 pandemic | 69.6 |
| Reasons for telecommuting (n = 416) | % |
| COVID-19 pandemic | 68.3 |
| Increased fuel taxes and congestion charges | 4.1 |
| Dependent children in the household | 4.1 |
| Environmental concerns | 2.6 |
| Lack of public transport infrastructure | 1.4 |
| Other | 19.5 |
Table 9.
Telecommuting and dining behavior of consumers during the COVID-19 pandemic (ANOVA).
| Takeout/Delivery | Curbside Pickup | Drive-thru | On-Premise Dinning | |||||
|---|---|---|---|---|---|---|---|---|
| F(p)-Value | Mean Value (SD) | F(p)-Value | Mean Value (SD) | F(p)-Value | Mean Value (SD) | F(p)-Value | Mean Value (SD) | |
| Do you telecommute? | ||||||||
| Yes, at least once per week | 14.026 (<0.001) | 2.45(1.00) | 14.75 (<0.001) | 1.72(0.90) | 0.55 (0.459) | 2.38(1.17) | 3.246 (0.072) | 1.70(0.75) |
| Never | 2.69(1.03) | 1.95(0.95) | 2.32(1.18) | 1.79(0.79) | ||||
Table 10.
Comparison of perceived off- and on-premise restaurant services.
| Perceived Restaurant Services | N | Mean | SD |
|---|---|---|---|
| How would you compare the price of a meal in a takeout, delivery, curbside pickup and/or drive-thru and that of a sit-down dining atmosphere? (1 = Expensive; 5 = Very cheap) | 1031 | 2.65 | 1.020 |
| How would you compare food quality in a takeout, delivery, curbside pickup and/or drive-thru and that of a sit-down dining atmosphere? (1 = Inferior; 5 = Very good) | 1031 | 2.35 | 0.803 |
| How would you compare food safety in a takeout, delivery, curbside pickup and/or drive-thru and that of a sit-down dining atmosphere? (1 = Unsafe; 5 = Very safe) | 1030 | 3.14 | 0.675 |
| How would you compare convenience in a takeout, delivery, curbside pickup and/or drive-thru and that of a sit-down dining atmosphere? (1 = Highly inconvenient 5 = Highly convenient) | 1031 | 3.52 | 0.962 |
Table 11.
Relationship between sociodemographic variables and perceived quality of restaurant services during COVID-19.
Table 11.
Relationship between sociodemographic variables and perceived quality of restaurant services during COVID-19.
| Sociodemographic Variables | Service Experience | Type III Sum of Squares | F-Statistics | p-Value | Pillai’s Trace Test | ||
|---|---|---|---|---|---|---|---|
| Value | F-Statistics | p-Value | |||||
| Gender (DMG2) | Price | 4.332 | 4.189 | 0.041 | 0.019 | 4.846 | <0.001 |
| Quality | 6.144 | 9.690 | 0.002 | ||||
| Food safety | 2.477 | 5.498 | 0.019 | ||||
| Convenience | 6.050 | 6.566 | 0.011 | ||||
| Age (DMG4) | Price | 0.921 | 0.222 | 0.926 | 0.059 | 2.97 | <0.001 |
| Quality | 15.685 | 6.255 | 0.000 | ||||
| Food safety | 1.739 | 0.963 | 0.427 | ||||
| Convenience | 34.227 | 9.564 | <0.001 | ||||
| Education (DMG6) | Price | 19.061 | 3.724 | 0.002 | 0.058 | 1.254 | <0.001 |
| Quality | 7.985 | 2.520 | 0.028 | ||||
| Food safety | 4.122 | 1.831 | 0.104 | ||||
| Convenience | 19.655 | 4.306 | 0.001 | ||||
| Household Income (DMG8) | Price | 17.163 | 3.346 | 0.005 | 0.06 | 3.062 | <0.001 |
| Quality | 20.049 | 6.424 | 0.000 | ||||
| Food safety | 2.561 | 1.138 | 0.338 | ||||
| Convenience | 7.492 | 1.635 | 0.148 | ||||
| Neighbourhood (DMG9) | Price | 2.201 | 1.061 | 0.346 | 0.017 | 2.149 | 0.029 |
| Quality | 3.020 | 2.367 | 0.094 | ||||
| Food safety | 1.325 | 1.463 | 0.232 | ||||
| Convenience | 6.767 | 3.677 | 0.026 | ||||
Table 12.
Mean perceived quality of restaurant services during COVID-19 (ANOVA).
| Sociodemographic Variables | Price | Food Quality | Convenience | |||
|---|---|---|---|---|---|---|
| F (p)-Value | Mean Value | F (p)-Value | Mean Value | F (p)-Value | Mean Value | |
| Gender (DMG2) | ||||||
| Male | 4.282 (0.042) | 2.60 | 9.52 (0.002) | 2.27 | 6.89 (0.009) | 3.44 |
| Female | 2.73 | 2.42 | 3.60 | |||
| Age (DMG4) | ||||||
| After 1994 | 0.231 (0.921) | 2.63 | 6.467 (<0.001) | 2.19 | 9.449 (<0.001) | 3.66 |
| From 1980 to 1994 | 2.65 | 2.23 | 3.69 | |||
| From 1965 to 1979 | 2.67 | 2.35 | 3.56 | |||
| From 1946 to 1964 | 2.70 | 2.46 | 3.36 | |||
| Before 1946 | 2.57 | 2.70 | 2.95 | |||
| Education (DMG 6) | ||||||
| Some High School | 3.744 (0.002) | 2.24 | 2.472 (0.031) | 2.49 | 4.383 (<0.001) | 3.43 |
| High School Diploma or Equivalent | 2.52 | 2.45 | 3.39 | |||
| Registered Apprenticeship or Other Trades Certificate or Diploma | 2.54 | 2.27 | 3.23 | |||
| College, CEGEP or Other Non-University Certificate or Diploma | 2.65 | 2.42 | 3.50 | |||
| University Degree, Certificate or Diploma | 2.77 | 2.28 | 3.68 | |||
| Advanced University Degree (Graduate) | 2.82 | 2.24 | 3.60 | |||
| Household income (in CAD) (DMG 8) | ||||||
| Less than 35,000 | 3.44 (0.005) | 2.45 | 6.411 (<0.001) | 2.47 | 1.685 (0.135) | 3.40 |
| Between 35,000 and 49,999 | 2.45 | 2.44 | 3.37 | |||
| Between 50,000 and 74,999 | 2.63 | 2.42 | 3.51 | |||
| Between 75,000 and 99,999 | 2.73 | 2.46 | 3.60 | |||
| Between 100,000 and 149,999 | 2.76 | 2.29 | 3.63 | |||
| 150,000+ | 2.80 | 2.07 | 3.51 | |||
| Neighborhood (DMG 9) | ||||||
| Urban Core | 1.038 (0.354) | 2.60 | 2.293 (0.101) | 2.28 | 3.500 (0.031) | 3.52 |
| Suburban | 2.68 | 2.35 | 3.61 | |||
| Small town or rural | 2.70 | 2.41 | 3.42 | |||
Table 13.
Other reasons for telecommuting—summary of qualitative information.
| Factor/Pattern | Reason for Telecommuting |
|---|---|
| Workspace/ location management | “Due to lack of office space”; “office was only built for a certain number of people so we had a hybrid workforce”; “workplace pivoted to telecommuting primary”; “no office to go to”; “team dispersed across the country making office attendance unnecessary”; “outsourced offices”; “out of town business”; “company based in Palo Alto California”; “live in Canada, company is based in Geneva”; “live remote part of Alberta”; “location of head office”; “long distance”; “long distance between work places”; and “long-distance family”. |
| Job characteristics | “My job involved interacting with students overseas”; “talking to people in other countries”; “my job requires remote work”; “work does not require going to the office”; “requirements of job”; “no office needed”; “no need to go to office”; “job requirements”; “part-time job”; “job doable at home”; “job does not require central office attendance”; “my business is sales management which I managed from home”; “job is from home”; “very little colleagues went into office”; “self-employed”; and “part time remote work”, |
| Convenience | “Flexible work hours”; “better in every way”; “gives flexibility”; “work-life balance”; “prefer work environment at home”; “prefer telecommuting (travel time, etc.)”; “to make extra income at home”. |
| Time management | “Avoid commuting time”; “commuting is a waste of time”; and “commuting save time both ways” |
| Health issues | “Employer mandate”; “flexibility to work from home for health reasons”; and “long term disability”. |
Table 14.
Correlation between perceived off-premise service offerings and dining experiences of Canadian consumers during COVID-19.
Table 14.
Correlation between perceived off-premise service offerings and dining experiences of Canadian consumers during COVID-19.
| Spearman-Rho | SE | p-Value | |
|---|---|---|---|
| Perceived price of off-premise offerings | |||
| Frequency of takeout and/or delivery | 0.090 | 0.031 | 0.004 |
| Frequency of curbside pickup | 0.107 | 0.031 | 0.001 |
| Frequency of drive-thru | 0.050 | 0.031 | 0.11 |
| Perceived quality off-premise offerings | |||
| Frequency of takeout and/or delivery | -0.077 | 0.030 | 0.013 |
| Frequency of curbside pickup | 0.020 | 0.031 | 0.523 |
| Frequency of drive-thru | -0.039 | 0.031 | 0.209 |
| Perceived safety off-premise offerings | |||
| Frequency of takeout and/or delivery | 0.035 | 0.032 | 0.266 |
| Frequency of curbside pickup | 0.097 | 0.031 | 0.002 |
| Frequency of drive-thru | 0.011 | 0.032 | 0.729 |
| Perceived convenience of off-premise offerings | |||
| Frequency of takeout and/or delivery | 0.128 | 0.032 | <0.001 |
| Frequency of curbside pickup | 0.100 | 0.032 | 0.001 |
| Frequency of drive-thru | 0.055 | 0.031 | 0.075 |
Publisher’s Note: MDPI stays neutral with regard to jurisdictional claims in published maps and institutional affiliations. |
© 2022 by the authors. Licensee MDPI, Basel, Switzerland. This article is an open access article distributed under the terms and conditions of the Creative Commons Attribution (CC BY) license (https://creativecommons.org/licenses/by/4.0/).
Share and Cite
MDPI and ACS Style
Abebe, G.K.; Charlebois, S.; Music, J. Canadian Consumers’ Dining Behaviors during the COVID-19 Pandemic: Implications for Channel Decisions in the Foodservice Industry. Sustainability 2022, 14, 4893. https://doi.org/10.3390/su14094893
AMA Style
Abebe GK, Charlebois S, Music J. Canadian Consumers’ Dining Behaviors during the COVID-19 Pandemic: Implications for Channel Decisions in the Foodservice Industry. Sustainability. 2022; 14(9):4893. https://doi.org/10.3390/su14094893
Chicago/Turabian StyleAbebe, Gumataw Kifle, Sylvain Charlebois, and Janet Music. 2022. "Canadian Consumers’ Dining Behaviors during the COVID-19 Pandemic: Implications for Channel Decisions in the Foodservice Industry" Sustainability 14, no. 9: 4893. https://doi.org/10.3390/su14094893
Note that from the first issue of 2016, this journal uses article numbers instead of page numbers. See further details here.