
Livelihood Capitals, Income Inequality, and the Perception of Climate Change: A Case Study of Small-Scale Cattle Farmers in the Ecuadorian Andes

 ,
,  , , , and
Abstract
:1. Introduction
2. Materials and Methods
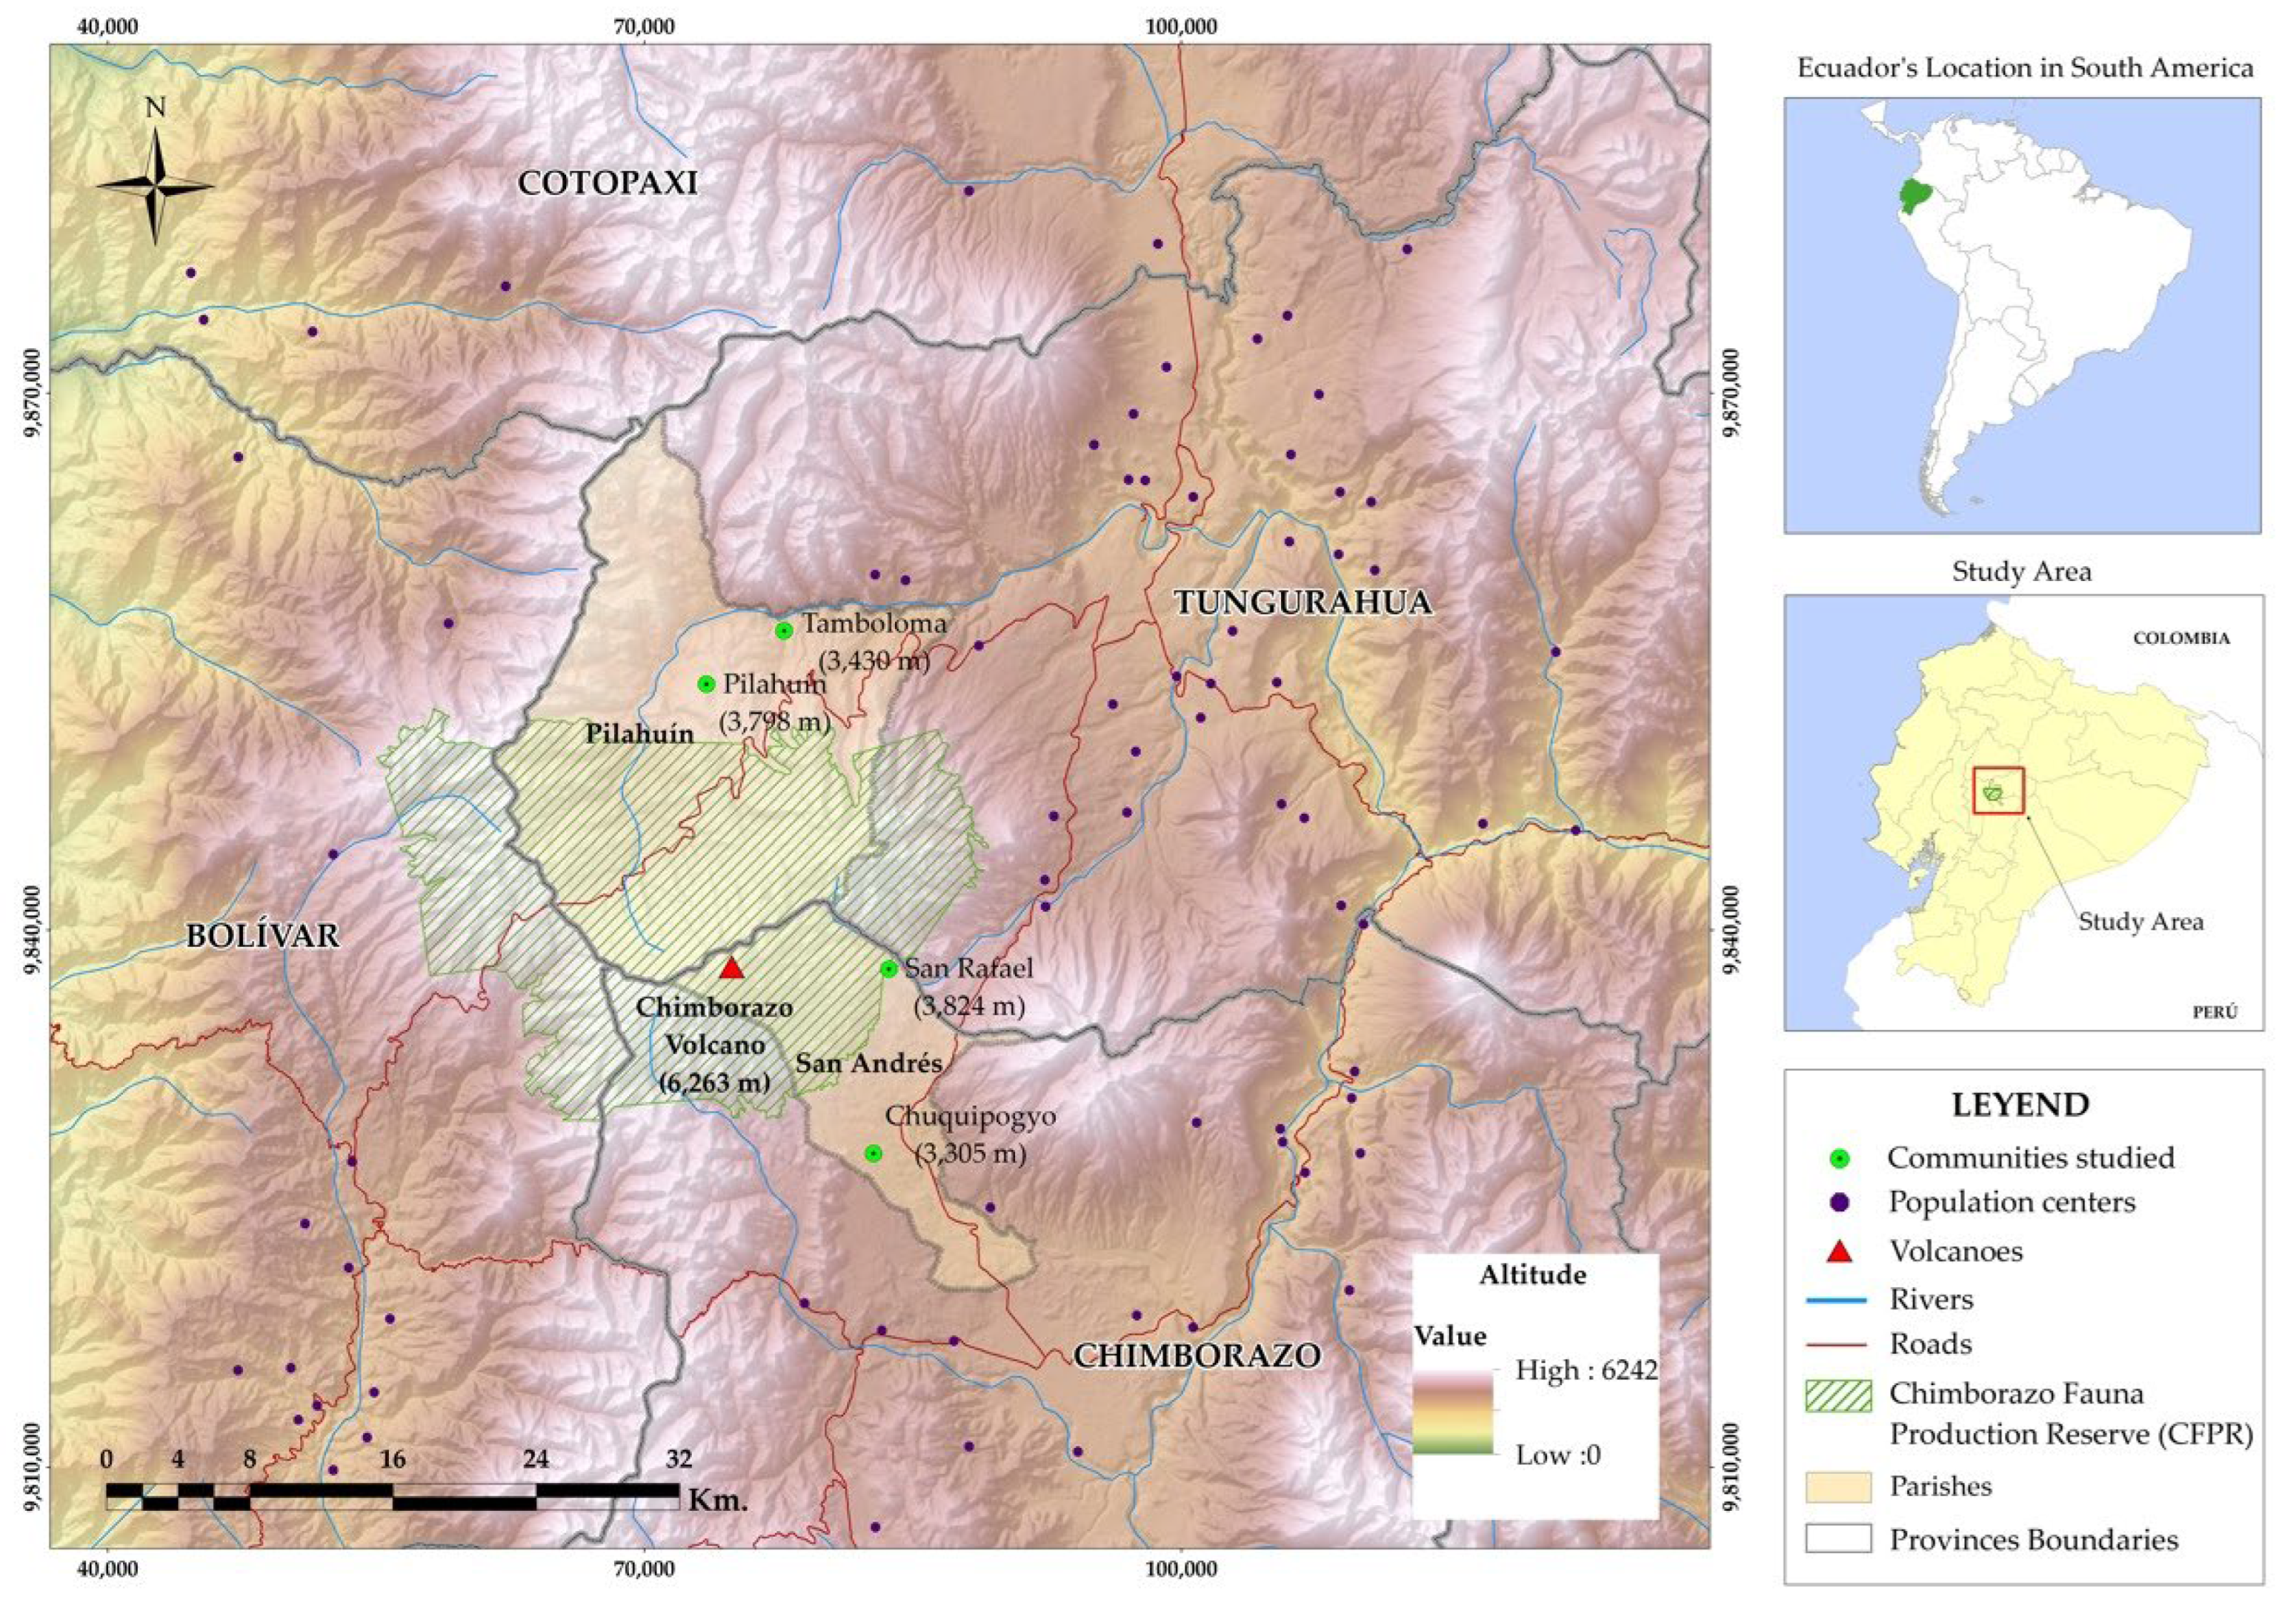
2.1. Study Area
2.2. Data Collection and Statistical Analysis
2.3. Determination of Net Income and Poverty Groups by Quintiles
- Quintile 1 (Q1): value that is higher than the 20% of the lowest samples;
- Quintile 2 (Q2): value that is higher than the 40% of the lowest samples;
- Quintile 3 (Q3): value that is higher than the 60% of the lowest samples;
- Quintile 4 (Q4): value that is higher than the 80% of the lowest samples;
- Quintile 5 (Q5): corresponds to the highest value.
- where:
- Li is the lower real limit of the class of the quintile (q);
- N is the number of data;
- Ni − 1 is the cumulative frequency of the class that precedes the class of the quintile (q);
- ni is the frequency of the class of the quintile (q);
- a is the length of the class interval of the quintile (q).
2.4. Income Inequality (Gini Index and Lorenz Curve)
2.5. Characterization of Rural Livelihoods Using the Theory of Capitals
2.6. Perception of Climate Change (CC) and Readiness to Accept Adaptation and Mitigation Actions
3. Results and Discussion
3.1. Determination of Poverty Groups by Quintiles through Cattle Income
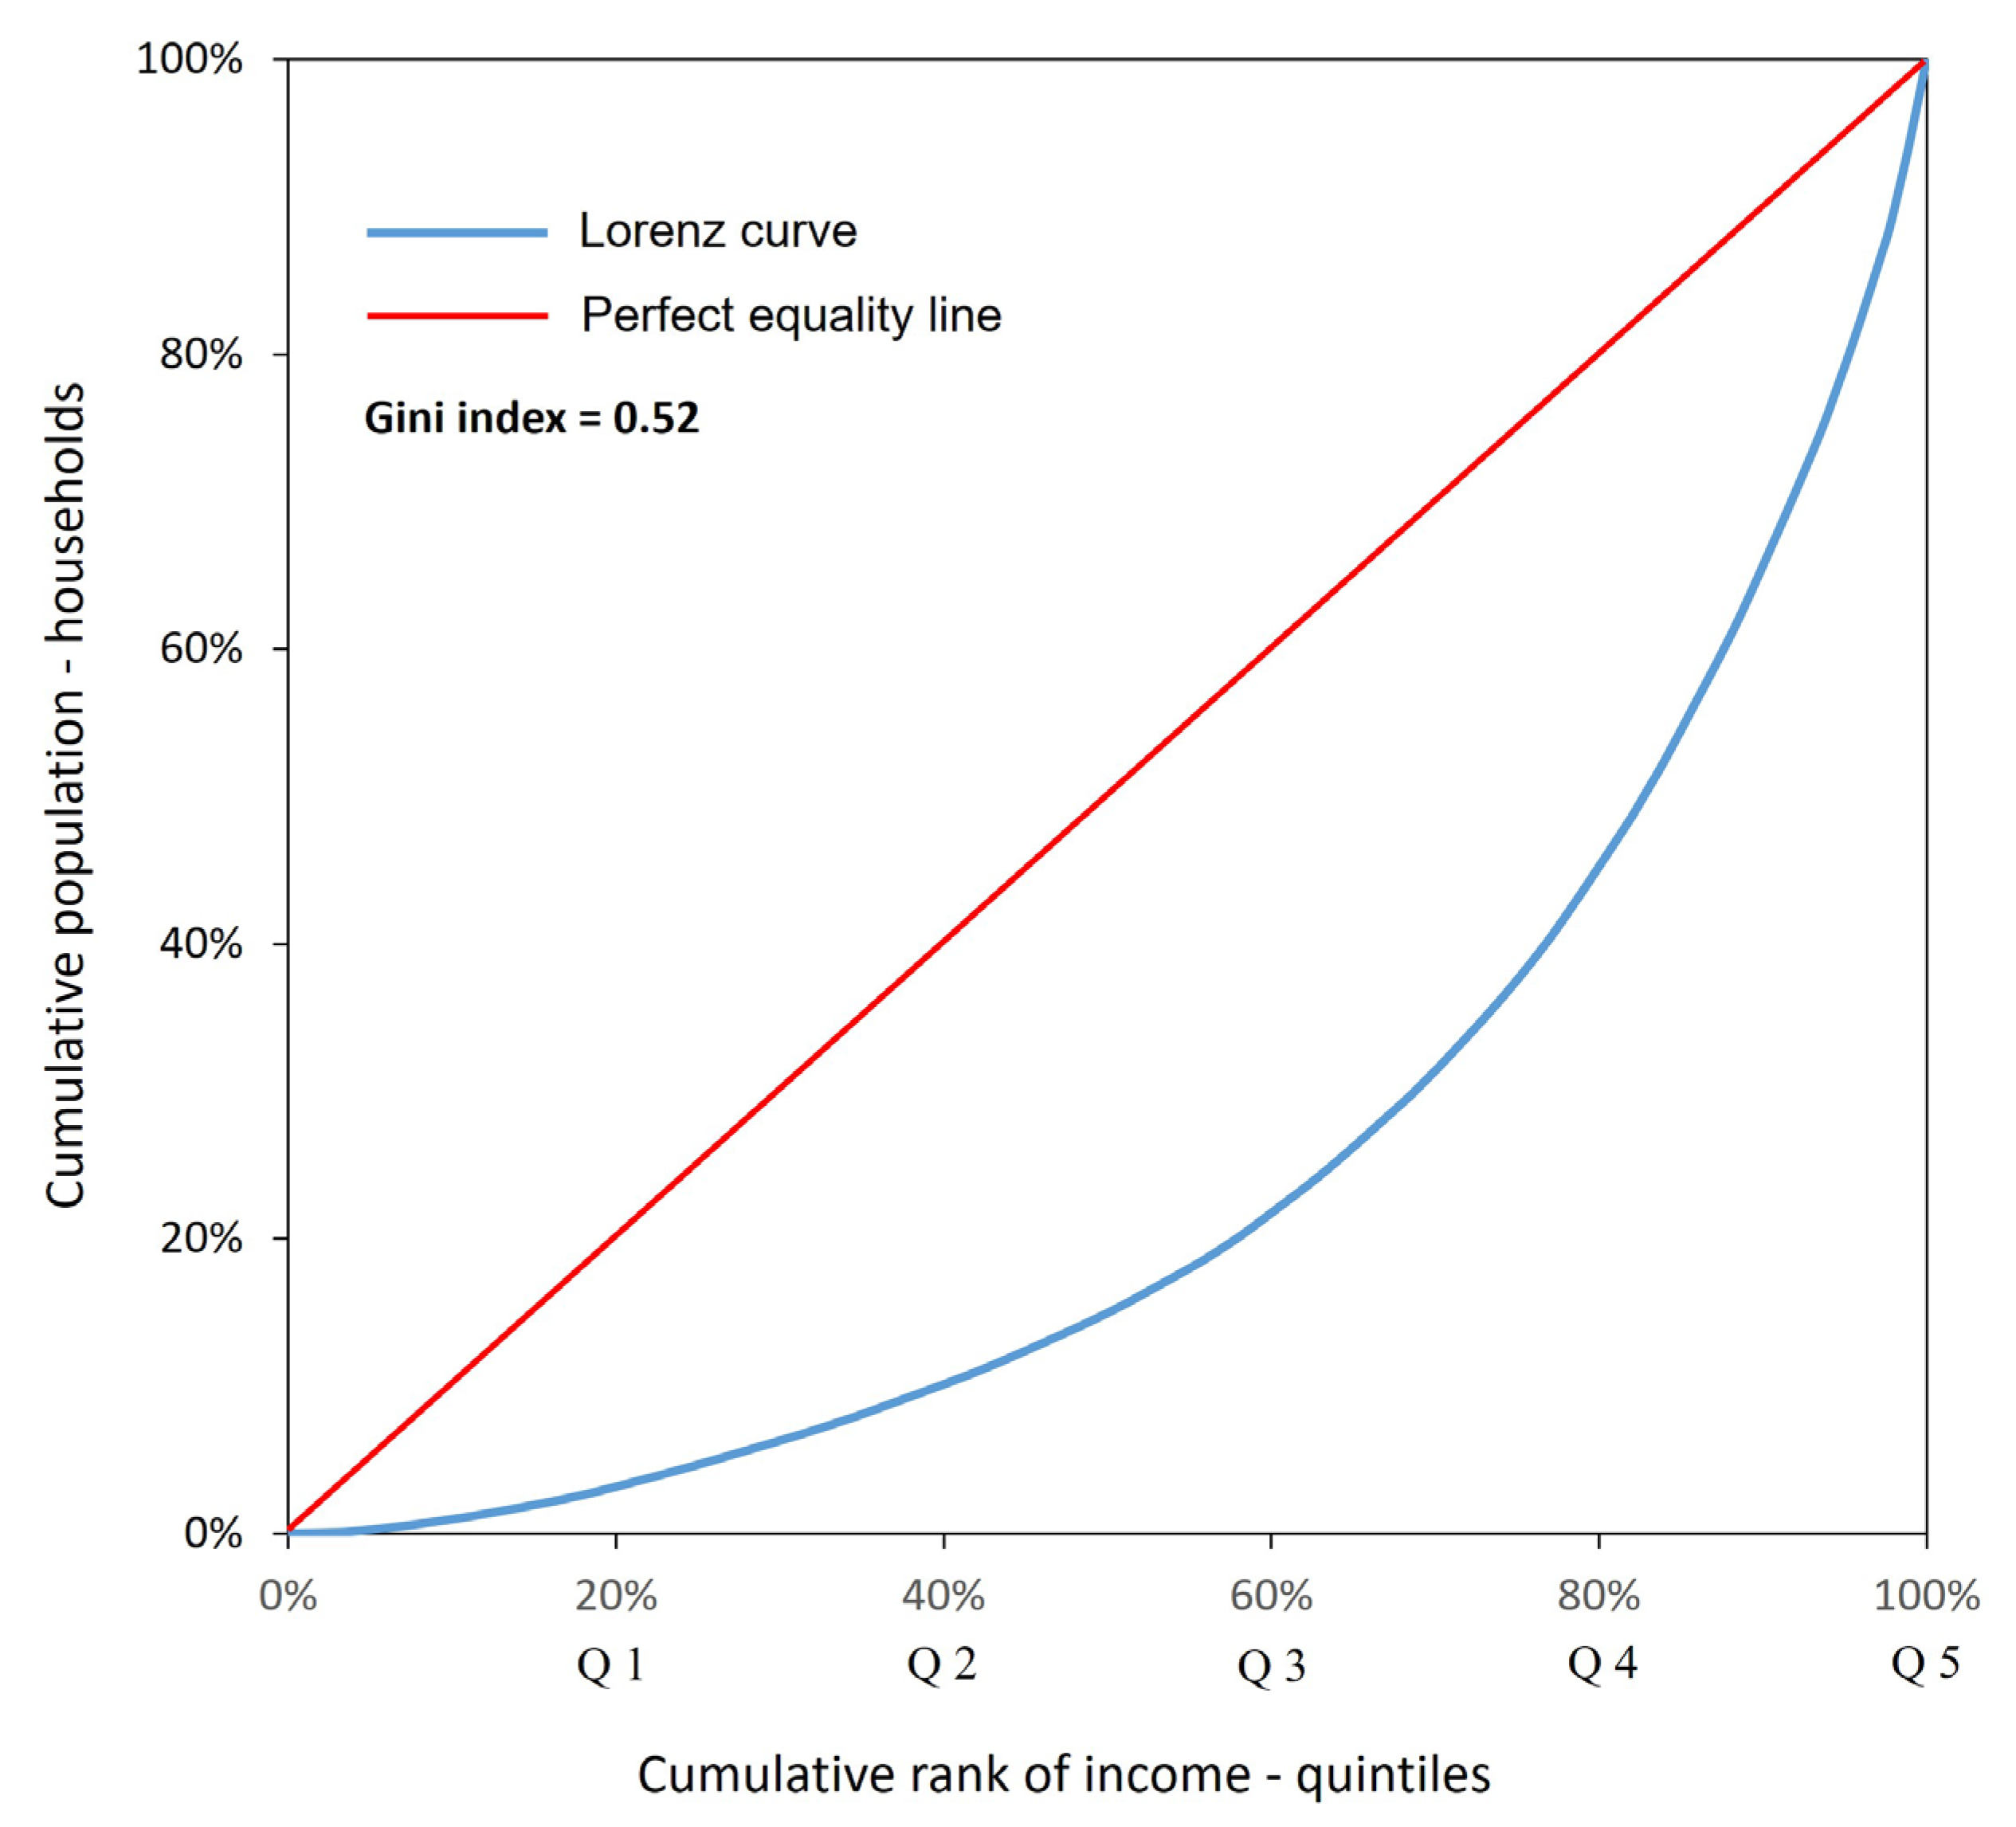
3.2. Inequity in Economic Income
3.3. Income from Cattle Activity by Quintiles
3.4. Characterization of Rural Livelihoods by Quintiles
3.4.1. Human and Social Capital
3.4.2. Natural Capital
3.4.3. Physical and Financial Capital
3.5. Perception of Climate Change and Readiness to Accept Adaptation as Well as Mitigation Measures
4. Conclusions
Author Contributions
Funding
Institutional Review Board Statement
Informed Consent Statement
Data Availability Statement
Acknowledgments
Conflicts of Interest
References
- Ansoms, A.; McKay, A. A quantitative analysis of poverty and livelihood profiles: The case of rural Rwanda. Food Policy 2010, 35, 584–598. [Google Scholar] [CrossRef]
- Mutenje, M.; Ortmann, G.; Ferrer, S.; Darroch, M. Rural livelihood diversity to manage economic shocks: Evidence from south-east Zimbabwe. Agrekon 2010, 49, 338–357. [Google Scholar] [CrossRef]
- Ellis, F. The Determinants of Rural Livelihood Diversification in Developing Countries. J. Agric. Econ. 2008, 51, 289–302. [Google Scholar] [CrossRef]
- Scoones, I. Sustainable Rural Livelihoods: A Framework for Analysis; IDS: Brighton, UK, 1998. [Google Scholar]
- Kibria, A.M.G.; Jashimuddin, M.; Makoto, I. Effects of participatory forest management on livelihood capitals of the community in Cox’s Bazar, Bangladesh. J. For. Res. 2014, 19, 42–51. [Google Scholar] [CrossRef]
- Angelsen, A.; Jagger, P.; Babigumira, R.; Belcher, B.; Hogarth, N.J.; Bauch, S.; Börner, J.; Smith-Hall, C.; Wunder, S. Environmental Income and Rural Livelihoods: A Global-Comparative Analysis. World Dev. 2014, 64 (Suppl. 1), S12–S28. [Google Scholar] [CrossRef] [Green Version]
- Berg, M.V.D. Household income strategies and natural disasters: Dynamic livelihoods in rural Nicaragua. Ecol. Econ. 2010, 69, 592–602. [Google Scholar] [CrossRef]
- Walelign, S.Z.; Pouliot, M.; Larsen, H.O.; Smith-Hall, C. Combining Household Income and Asset Data to Identify Livelihood Strategies and Their Dynamics. J. Dev. Stud. 2016, 53, 769–787. [Google Scholar] [CrossRef]
- Walelign, S.Z. Getting stuck, falling behind or moving forward: Rural livelihood movements and persistence in Nepal. Land Use Policy 2017, 65, 294–307. [Google Scholar] [CrossRef]
- Reardon, T.; Taylor, J.E.; Stamoulis, K.; Lanjouw, P.; Balisacan, A. Effects of Non-Farm Employment on Rural Income Inequality in Developing Countries: An Investment Perspective. J. Agric. Econ. 2008, 51, 266–288. [Google Scholar] [CrossRef]
- Shackleton, C.M.; Shackleton, S.E.; Buiten, E.; Bird, N. The importance of dry woodlands and forests in rural live-lihoods and poverty alleviation in South Africa. For. Policy Econ. 2007, 9, 558–577. [Google Scholar] [CrossRef]
- Alary, V.; Corniaux, C.; Gautier, D. Livestock’s Contribution to Poverty Alleviation: How to Measure It? World Dev. 2011, 39, 1638–1648. [Google Scholar] [CrossRef]
- Christiaensen, L.J.; Demery, L.; Khl, J. The Role of Agriculture in Poverty Reduction: An Empirical Perspective; World Bank Publications: Washington, DC, USA, 2006; Volume 4013. [Google Scholar]
- Hogarth, N.; Belcher, B.; Campbell, B.; Stacey, N. The Role of Forest-Related Income in Household Economies and Rural Livelihoods in the Border-Region of Southern China. World Dev. 2012, 43, 111–123. [Google Scholar] [CrossRef]
- Soltani, A.; Angelsen, A.; Eid, T.; Naieni, M.S.N.; Shamekhi, T. Poverty, sustainability, and household livelihood strategies in Zagros, Iran. Ecol. Econ. 2012, 79, 60–70. [Google Scholar] [CrossRef]
- Torres, B.; Vasco, C.; Günter, S.; Knoke, T. Determinants of Agricultural Diversification in a Hotspot Area: Evidence from Colonist and Indigenous Communities in the Sumaco Biosphere Reserve, Ecuadorian Amazon. Sustainability 2018, 10, 1432. [Google Scholar] [CrossRef] [Green Version]
- Torres, B.; Günter, S.; Acevedo-Cabra, R.; Knoke, T. Livelihood strategies, ethnicity and rural income: The case of migrant settlers and indigenous populations in the Ecuadorian Amazon. For. Policy Econ. 2018, 86, 22–34. [Google Scholar] [CrossRef]
- Torres, B.; Eche, D.; Torres, Y.; Bravo, C.; Velasco, C.; García, A. Identification and Assessment of Livestock Best Management Practices (BMPs) Using the REDD+ Approach in the Ecuadorian Amazon. Agronomy 2021, 11, 1336. [Google Scholar] [CrossRef]
- Fang, Y.; Qin, D.; Ding, Y. Frozen soil change and adaptation of animal husbandry: A case of the source regions of Yangtze and Yellow Rivers. Environ. Sci. Policy 2011, 14, 555–568. [Google Scholar] [CrossRef]
- Fang, Y.-P. The effects of natural capital protection on pastoralist’s livelihood and management implication in the source region of the Yellow River, China. J. Mt. Sci. 2013, 10, 885–897. [Google Scholar] [CrossRef]
- Gentle, P.; Maraseni, T.N. Climate change, poverty and livelihoods: Adaptation practices by rural mountain communities in Nepal. Environ. Sci. Policy 2012, 21, 24–34. [Google Scholar] [CrossRef]
- Beverly, S.G. Measures of material hardship: Rationale and recommendations. J. Poverty 2001, 5, 23–41. [Google Scholar] [CrossRef]
- Hallegatte, S.; Fay, M.; Barbier, E.B. Poverty and climate change: Introduction. Environ. Dev. Econ. 2018, 23, 217–233. [Google Scholar] [CrossRef] [Green Version]
- Anand, S.; Harris, C.J. Choosing a welfare indicator. Am. Econ. Rev. 1994, 84, 226–231. [Google Scholar]
- Guo, Y.; Zhou, Y.; Liu, Y. Targeted poverty alleviation and its practices in rural China: A case study of Fuping county, Hebei Province. J. Rural Stud. 2019, 2, 10. [Google Scholar] [CrossRef]
- Liu, Y.; Liu, J.; Zhou, Y. Spatio-temporal patterns of rural poverty in China and targeted poverty alleviation strategies. J. Rural Stud. 2017, 52, 66–75. [Google Scholar] [CrossRef]
- Foster, J.E. Absolute versus Relative Poverty. Am. Econ. Rev. 1998, 88, 335–341. [Google Scholar]
- Chen, S.; Ravallion, M. Absolute poverty measures for the developing world, 1981–2004. Proc. Natl. Acad. Sci. USA 2007, 104, 16757–16762. [Google Scholar] [CrossRef] [Green Version]
- Hulme, D.; Shepherd, A. Conceptualizing Chronic Poverty. World Dev. 2003, 31, 403–423. [Google Scholar] [CrossRef]
- Ward, P.S. Transient Poverty, Poverty Dynamics, and Vulnerability to Poverty: An Empirical Analysis Using a Balanced Panel from Rural China. World Dev. 2015, 78, 541–553. [Google Scholar] [CrossRef] [Green Version]
- Powell, M.; Boyne, G.; Ashworth, R. Towards a geography of people poverty and place poverty. Policy Politics 2001, 29, 243–258. [Google Scholar] [CrossRef]
- Park, A.; Wang, S.; Wu, G. Regional poverty targeting in China. J. Public Econ. 2002, 86, 123–153. [Google Scholar] [CrossRef]
- Bourguignon, F.; Chakravarty, S.R. The measurement of multidimensional poverty. In Poverty, Social Exclusion and Stochastic Dominance; Springer: Singapore, 2019; pp. 83–107. [Google Scholar]
- Milbourne, P. The Geographies of Poverty and Welfare. Geogr. Compass 2010, 4, 158–171. [Google Scholar] [CrossRef]
- Li, Q.; Sun, P.; Li, B.; Mohiuddin, M. Impact of Climate Change on Rural Poverty Vulnerability from an Income Source Perspective: A Study Based on CHIPS2013 and County-Level Temperature Data in China. Int. J. Environ. Res. Public Health 2022, 19, 3328. [Google Scholar] [CrossRef] [PubMed]
- Amato, P.R.; Zuo, J. Rural poverty, urban poverty, and psychological well-being. Sociol. Q. 1992, 33, 229–240. [Google Scholar] [CrossRef]
- Du, Y.; Park, A.; Wang, S. Migration and rural poverty in China. J. Comp. Econ. 2005, 33, 688–709. [Google Scholar] [CrossRef]
- Liu, Y.; Xu, Y. A geographic identification of multidimensional poverty in rural China under the framework of sustainable livelihoods analysis. Appl. Geogr. 2016, 73, 62–76. [Google Scholar] [CrossRef]
- Ding, J.; Leng, Z.M. Regional poverty analysis in a view of geography science. Acta Geogr. Sin. 2018, 73, 232–247. [Google Scholar]
- Zhou, Y.; Guo, Y.; Liu, Y.; Wu, W.; Li, Y. Targeted poverty alleviation and land policy innovation: Some practice and policy implications from China. Land Use Policy 2018, 74, 53–65. [Google Scholar] [CrossRef]
- Zhou, Y.; Guo, L.; Liu, Y. Land consolidation boosting poverty alleviation in China: Theory and practice. Land Use Policy 2018, 82, 339–348. [Google Scholar] [CrossRef]
- World Bank. Poverty and Shared Prosperity. In Reversals of Fortune; World Bank: Washington, DC, USA, 2020. [Google Scholar] [CrossRef]
- Strategic Work of FAO to Reduce Rural Poverty; FAO: Roma, Italy, 2017.
- Zhang, H.; Wang, Z.; Liu, J.; Chai, J.; Wei, C. Selection of targeted poverty alleviation policies from the perspective of land resources-environmental carrying capacity. J. Rural Stud. 2019. [Google Scholar] [CrossRef]
- UN 2015 UN General Assembly Resolution Adopted by the General Assembly on 25 September 2015. Available online: http://www.un.org/ga/search/view_doc.asp?symbol=A/RES/70/1&Lang=E (accessed on 6 January 2022).
- Griggs, D.; Stafford-Smith, M.; Gaffney, O.; Rockström, J.; Öhman, M.C.; Shyamsundar, P.; Noble, I. Sustainable development goals for people and planet. Nature 2013, 495, 305–307. [Google Scholar] [CrossRef]
- Zhou, Y.; Liu, Y. The geography of poverty: Review and research prospects. J. Rural Stud. 2019. [Google Scholar] [CrossRef]
- Fan, S.; Brzeska, J.; Keyzer, M.; Halsema, A. From subsistence to profit: Transforming smallholder farms. Intl. Food Policy Res. Inst. 2013, 26. [Google Scholar] [CrossRef]
- Grubbström, A.; Sooväli-Sepping, H. Estonian family farms in transition: A study of intangible assets and gender issues in generational succession. J. Hist. Geogr. 2012, 38, 329–339. [Google Scholar] [CrossRef]
- Wegren, S.K.; O'Brien, D.J. Introduction to symposium: Smallholders in communist and postcommunist societies. J. Agrar. Chang. 2018, 18, 869–881. [Google Scholar] [CrossRef]
- Alkire, S.; Roche, J.M.; Ballon, P.; Foster, J.; Santos, M.E.; Seth, S. Multidimensional Poverty Measurement and Analysis; Oxford University Press: Oxford, UK, 2015. [Google Scholar]
- Carney, D.; Drinkwater, M.; Rusinow, T.; Neefjes, K.; Wanmali, S.; Singh, N. Livelihoods Approaches Compared—A Brief Comparison of the Livelihoods Approaches of the UK Department for International Development (DFID), CARE; Oxfam and the United Nations Development Programme (UNDP) UK Department for International Development: New York, NY, USA, 1999. [Google Scholar]
- Onyekwere, I.; Nworgu, K.O. Amenazas a los medios de vida rurales en Nigeria: Implicaciones para el orden social y la gestión de crisis. Av. En Sociol. Apl. 2020, 10, 41. [Google Scholar]
- Gasper, D. Securing Humanity: Situating ‘Human Security’ as Concept and Discourse. J. Hum. Dev. 2005, 6, 221–245. [Google Scholar] [CrossRef] [Green Version]
- Bigman, D.; Fofack, H. Geographical Targeting for Poverty Alleviation: An Introduction to the Special Issue. World Bank Econ. Rev. 2000, 14, 129–145. [Google Scholar] [CrossRef]
- Do, Q.-T.; Iyer, L. Geography, poverty and conflict in Nepal. J. Peace Res. 2010, 47, 735–748. [Google Scholar] [CrossRef]
- Luo, Q.; Xj, L. Progress in the study of rural poverty geography in foreign countries. Econ. Geogr. 2014, 34, 1–8. [Google Scholar]
- Scherr, S.J. A downward spiral? Research evidence on the relationship between poverty and natural resource deg-radation. Food Policy 2000, 25, 479–498. [Google Scholar] [CrossRef]
- Cavendish, W. Empirical Regularities in the Poverty-Environment Relationship of Rural Households: Evidence from Zimbabwe. World Dev. 2000, 28, 1979–2003. [Google Scholar] [CrossRef]
- Gray, L.C.; Moseley, W.G. A geographical perspective on poverty-environment interactions. Geogr. J. 2005, 171, 9–23. [Google Scholar] [CrossRef]
- Dasgupta, S.; Deichmann, U.; Meisner, C.; Wheeler, D. Where is the poverty–environment nexus? Evidence from Cambodia, Lao PDR, and Vietnam. World Dev. 2005, 33, 617–638. [Google Scholar] [CrossRef]
- Lufumpa, C.L. The Poverty-Environment Nexus in Africa. Afr. Dev. Rev. 2005, 17, 366–381. [Google Scholar] [CrossRef]
- Cao, S.; Zhong, B.; Yue, H.; Zeng, H.; Zeng, J. Development and testing of a sustainable environmental restoration policy on eradicating the poverty trap in China’s Changting County. Proc. Natl. Acad. Sci. USA 2009, 106, 10712–10716. [Google Scholar] [CrossRef] [Green Version]
- Barbier, E.B. The challenges for environment and development economics. Environ. Dev. Econ. 2014, 19, 287–290. [Google Scholar] [CrossRef]
- Casillas, C.E.; Kammen, D.M.; Matyas, F.; Sreenivasan, V.; Marbach, F.; Wacongne, C.; Barsy, B.; Mateo, C.; Aronoff, R.; Petersen, C.C.H. The Energy-Poverty-Climate Nexus. Science 2010, 330, 1181–1182. [Google Scholar] [CrossRef]
- Watmough, G.; Atkinson, P.M.; Saikia, A.; Hutton, C. Understanding the Evidence Base for Poverty–Environment Relationships using Remotely Sensed Satellite Data: An Example from Assam, India. World Dev. 2016, 78, 188–203. [Google Scholar] [CrossRef]
- Bird, K.; Shepherd, A. Livelihoods and Chronic Poverty in Semi-Arid Zimbabwe. World Dev. 2003, 31, 591–610. [Google Scholar] [CrossRef]
- Partridge, M.D.; Rickman, D.S. Distance from urban agglomeration economies and rural poverty. J. Reg. Sci. 2008, 48, 285–310. [Google Scholar] [CrossRef] [Green Version]
- Tian, F.; Wu, B.; Zeng, H.; Watmough, G.R.; Zhang, M.; Li, Y. Detecting the linkage between arable land use and poverty using machine learning methods at global perspective. Geogr. Sustain. 2022, 3, 7–20. [Google Scholar] [CrossRef]
- Henninger, N.; Snel, M. Where Are the Poor? Experiences with the Development and Use of Poverty Maps; World Resources Institute and UNEP/GRID-Arendal: Washington, DC, USA, 2002. [Google Scholar]
- Okwi, P.O.; Ndeng’e, G.; Kristjanson, P.; Arunga, M.; Notenbaert, A.; Omolo, A.; Owuor, J. Spatial determinants of poverty in rural Kenya. Proc. Natl. Acad. Sci. USA 2007, 104, 16769–16774. [Google Scholar] [CrossRef] [PubMed] [Green Version]
- Cheng, X.; Shuai, C.M.; Wang, J.; Li, W.J.; Shuai, J.; Liu, Y. Building a sustainable development model for China’s poverty-stricken reservoir regions based on system dynamics. J. Clean. Prod. 2018, 176, 535–554. [Google Scholar] [CrossRef]
- Zhou, L.; Xiong, L.-Y. Natural topographic controls on the spatial distribution of poverty-stricken counties in China. Appl. Geogr. 2017, 90, 282–292. [Google Scholar] [CrossRef]
- Ma, Z.; Chen, X.; Chen, H. Multi-scale Spatial Patterns and Influencing Factors of Rural Poverty: A Case Study in the Liupan Mountain Region, Gansu Province, China. Chin. Geogr. Sci. 2018, 28, 296–312. [Google Scholar] [CrossRef] [Green Version]
- Hertel, T.W.; Rosch, S.D. Climate change, agriculture, and poverty. Appl. Econ. Perspect. Policy 2010, 32, 355–385. [Google Scholar] [CrossRef]
- Shimada, G. The impact of climate-change-related disasters on africa’s economic growth, agriculture, and conflicts: Can humanitarian aid and food assistance offset the damage? Int. J. Environ. Res. Public Health 2022, 19, 467. [Google Scholar] [CrossRef]
- Hallegatte, S.; Vogt-Schilb, A.; Bangalore, M.; Rozenberg, J. Unbreakable: Building the Resilience of the Poor in the Face of Natural Disasters; World Bank: Washington, DC, USA, 2016. [Google Scholar]
- Hallegatte, S. An Exploration of the Link between Development, Economic Growth, and Natural Risk. SSRN Electron. J. 2012. [Google Scholar] [CrossRef] [Green Version]
- Rozenberg, J.; Hallegatte, S. Model and Methods for Estimating the Number of People Living in Extreme Poverty Because of the Direct Impacts of Natural Disasters. In World Bank Policy Research Working Paper; World Bank: Washington, DC, USA, 2016. [Google Scholar] [CrossRef] [Green Version]
- Datt, G.; Hoogeveen, H. El Niño or El Peso? Crisis, Poverty and Income Distribution in the Philippines. World Dev. 2003, 31, 1103–1124. [Google Scholar] [CrossRef] [Green Version]
- Rodriguez-Oreggia, E.; De La Fuente, A.; De La Torre, R.; Moreno, H.A. Natural Disasters, Human Development and Poverty at the Municipal Level in Mexico. J. Dev. Stud. 2013, 49, 442–455. [Google Scholar] [CrossRef]
- Akter, S.; Mallick, B. The poverty–vulnerability–resilience nexus: Evidence from Bangladesh. Ecol. Econ. 2013, 96, 114–124. [Google Scholar] [CrossRef]
- Rodriguez, F.; Toulkeridis, T.; Padilla, O.; Mato, F. Economic risk assessment of Cotopaxi volcano Ecuador in case of a future lahar emplacement. Nat. Hazards 2017, 85, 605–618. [Google Scholar] [CrossRef]
- Echegaray-Aveiga, R.C.; Rodríguez, F.; Toulkeridis, T.; Echegaray-Aveiga, R.D. Effects of potential lahars of the Cotopaxi volcano on housing market prices. J. Appl. Volcanol. 2020, 9, 1–11. [Google Scholar] [CrossRef]
- Shepherd, A.; Mitchell, T.; Lewis, K.; Lenhardt, A.; Jones, L.; Scott, L.; Muir-Wood, R. The Geography of Poverty, Disasters and Climate Extremes in 2030; ODI: London, UK, 2013; p. 72. [Google Scholar]
- MAE. Sistema de Clasificación de los Ecosistemas del Ecuador Continental; Subsecretaría de Patrimonio Natural, Ministerio del Ambiente del Ecuador: Quito, Ecuador, 2013. [Google Scholar]
- Zambrano, R.; López, M. Breve historia y perspectivas para el futuro del Sistema Nacional de Áreas Protegidas del Ecuador (SNAP). Memorias 2015, 4, 42. [Google Scholar]
- MAG. Decreto de Creación de la Reserva de Producción de Fauna Chimborazo N°437; Ministerio de Agricultura y Ganadería: Quito, Ecuador, 1987. [Google Scholar]
- Lilliefors, H.W. On the Kolmogorov-Smirnov test for normality with mean and variance unknown. J. Am. Stat. Assoc. 1967, 62, 399–402. [Google Scholar] [CrossRef]
- Steinskog, D.J.; Tjøstheim, D.B.; Kvamstø, N.G. A Cautionary Note on the Use of the Kolmogorov–Smirnov Test for Normality. Mon. Weather Rev. 2007, 135, 1151–1157. [Google Scholar] [CrossRef]
- Lim, T.-S.; Loh, W.-Y. A comparison of tests of equality of variances. Comput. Stat. Data Anal. 1996, 22, 287–301. [Google Scholar] [CrossRef]
- Kim, H.-Y. Analysis of variance (ANOVA) comparing means of more than two groups. Restor. Dent. Endod. 2014, 39, 74–77. [Google Scholar] [CrossRef] [Green Version]
- Mujica, O.; Moreno, C. Guía Ilustrada Paso-a-paso para el Cálculo y Análisis de Desigualdades Ecosociales en Salud; Organización Panamericana de la Salud: Washington, DC, USA, 2020. [Google Scholar]
- Luna, V.M.I. Incremento de la desigualdad mundial y la situación de américa latina de 1962 a 2019. Vances En Investig. Científica 2020, 3, 853. [Google Scholar]
- Reddy, A.A. Disparities in employment and income in rural Andhra Pradesh, India. Bangladesh Dev. Stud. 2011, 34, 73–96. [Google Scholar]
- INEC. Reporte de pobreza y desigualdad 2018; Instituto Nacional de Estadísticas y Censos: Quito, Ecuador, 2018; p. 9. [Google Scholar]
- Bishop, J.A.; Formby, J.P.; Thistle, P.D. Changing American earnings distributions: One-half century of experience. Empir. Econ. 1997, 22, 501–514. [Google Scholar] [CrossRef]
- Atkinson, A. Measurement of inequality. J. Econ. Theory 1970, 1, 244–263. [Google Scholar] [CrossRef]
- Paredes, R.P.; Escobar, F. El rol de la ganadería y la pobreza en el área rural de Puno. Rev. De Investig. Altoandinas 2018, 20, 39–60. [Google Scholar] [CrossRef]
- Holden, S.T.; Shiferaw, B.; Pender, J. Non-farm income, household welfare, and sustainable land management in a less-favoured area in the Ethiopian highlands. Food Policy 2004, 29, 369–392. [Google Scholar] [CrossRef] [Green Version]
- John, C. The Dynamics of Inequality and Poverty: Comparing Income Distributions; Edward Elgar Publishing: Boston, MA, USA, 1998. [Google Scholar]
- Shackleton, S.; Campbell, B.; Lotz-Sisitka, H.; Shackleton, C. Links between the Local Trade in Natural Products, Livelihoods and Poverty Alleviation in a Semi-arid Region of South Africa. World Dev. 2008, 36, 505–526. [Google Scholar] [CrossRef]
- Heredia, R.M.; Torres, B.; Cayambe, J.; Ramos, N.; Luna, M.; Diaz-Ambrona, C.G.H. Sustainability Assessment of Smallholder Agroforestry Indigenous Farming in the Amazon: A Case Study of Ecuadorian Kichwas. Agronomy 2020, 10, 1973. [Google Scholar] [CrossRef]
- Heredia, R.M.; Torres, B.; Vasseur, L.; Puhl, L.; Barreto, D.; Díaz-Ambrona, C.G.H. Sustainability Dimensions Assessment in Four Traditional Agricultural Systems in the Amazon. Front. Sustain. Food Syst. 2022, 5, 782633. [Google Scholar] [CrossRef]
- Weiler, A.; Albertini, S.; Barreto, D.; Heredia, M. Evaluación de la sustentabilidad a escala de sistemas silvopastoriles en tres ecorregiones del Paraguay. Rev. Amaz. Cienc. Y Tecnol. 2019, 8, 24–39. Available online: https://revistas.proeditio.com/revistamazonica/arti-cle/view/3364 (accessed on 26 January 2022).
- Heredia, R.M.; Cayambe, J.; Noguera, L.; Torres, A.; Barreto, D.; Andi, Y.; Torres, B.; Bravo, C.; Alemán, R. Sostenibilidad en el Territorio Ancestral Waorani: Caso Producción de Cacao. In Memorias del Primer Simposio Internacional Innovaciones Tecnológicas para Fortalecer la Cadena de Cacao en la Amazonía Ecuatoriana, La Joya de los Sachas, Ecuador, 10–11 July 2019; En Caicedo, C., Díaz, A., Eds.; 2020; pp. 1–4. Available online: https://www.researchgate.net/publication/348375470_Sostenibilidad_en_el_Territorio_Ancestral_Waorani_Caso_Produccion_de_Cacao (accessed on 3 March 2022).
- Heredia, R.M.; Torres, B.; Guerrero, E.; Gallardo, D.; Núñez, M.; Alemán, R.; Cayambe, J.; Díaz-Ambrona, C.G.H. Evaluación de la sostenibilidad de sistemas productivos en la franja de diversidad y vida: Reserva de biosfera yasuní, ama-zonía. AXIOMA 2020, 22, 5–11. [Google Scholar]
- Instrumento para la evaluación del desempeño agroecológico (TAPE)-Versión de prueba. 2021. Available online: https://www.fao.org/documents/card/es/c/ca7407es (accessed on 15 January 2022).
- Mottet, A.; Bicksler, A.; Lucantoni, D.; De Rosa, F.; Scherf, B.; Scopel, E.; López-Ridaura, S.; Gemmil-Herren, B.; Kerr, R.B.; Sourisseau, J.-M.; et al. Assessing Transitions to Sustainable Agricultural and Food Systems: A Tool for Agroecology Performance Evaluation (TAPE). Front. Sustain. Food Syst. 2020, 4. [Google Scholar] [CrossRef]
- Heredia, R.M.; Cayambe, J.; Schorsch, C.; Toulkeridis, T.; Barreto, D.; Poma, P.; Villegas, G. Multitemporal Analysis as a Non-Invasive Technology Indicates a Rapid Change in Land Use in the Amazon: The Case of the ITT Oil Block. Environments 2021, 8, 139. [Google Scholar] [CrossRef]
- Heredia, R.M.; Torres, B.; Cabrera-Torres, F.; Torres, E.; Díaz-Ambrona, C.G.H.; Pappalardo, S.E. Land Use and Land Cover Changes in the Diversity and Life Zone for Uncontacted Indigenous People: Deforestation Hotspots in the Yasuní Biosphere Reserve, Ecuadorian Amazon. Forests 2021, 12, 1539. [Google Scholar] [CrossRef]
- Heredia, R.M.; Falconí, K.; Cayambe, J.; Becerra, S. Pedagogical Innovation: Towards Conservation Psychology and Sustainability. Univers. J. Educ. Res. 2021, 9, 771–780. [Google Scholar] [CrossRef]
- García, C.R.; Brown, S. Assessing water use and quality through youth participatory research in a rural Andean watershed. J. Environ. Manag. 2009, 90, 3040–3047. [Google Scholar] [CrossRef]
- Ngongoni, N.T.; Mapiye, C.; Mwale, M.; Mupeta, B. Factors affecting milk production in the smallholder dairy sector of Zimbabwe. Livest. Res. Rural Dev. 2006, 18, 1–21. [Google Scholar]
- Valdivia, C.; Quiroz, R. Coping and Adapting to Increased Climate Variability in the Andes. In Proceedings of the American Agricultural Economics Association Annual Meeting, Montreal, QC, Canada, 27–30 July 2003; pp. 1–28. [Google Scholar]
- Kristjanson, P.; Krishna, A.; Radeny, M.; Kuan, J.; Quilca, G.; Sanchez-Urrelo, A.; Leon-Velarde, C. Poverty dynamics and the role of livestock in the Peruvian Andes. Agric. Syst. 2007, 94, 294–308. [Google Scholar] [CrossRef]
- SENPLADES. Plan Nacional del Buen Vivir 2013–2017; Secretaría Nacional de Planificación y Desarrollo: Quito, Ecuador, 2013. [Google Scholar]
- FAO. Panorama de la Seguridad alimentaria. Quito, Ecuador: Organización de las Naciones Unidas Para la Alimentación y la Agricultura. 2014. Available online: http://www.fao.org/3/a-i4018s.pdf (accessed on 4 January 2022).
- Eche, D. Migración y renovación generacional en la agricultura familiar indígena: Estudio de caso Otavalo-Ecuador. Siembra 2018, 5, 1–15. [Google Scholar] [CrossRef]
- ILO. Cooperatives and the World of Work Series No. 5. Securing Rights, Creating Jobs and Ensuring Sustainability: A Co-operative Way for Empowering Indigenous Peoples. Available online: https://tinyurl.com/y2oxabjm (accessed on 4 January 2022).
- Dhir, R.K. Indigenous Peoples in the World of Work in Asia and the Pacific: A Status Report; ILO: Geneva, Switzerland, 2015. [Google Scholar]
- Morales Ramirez, M.A. Strategies for youth employment in an informal economy. Rev. Latinoam. Derecho Soc. 2016, 23, 89–121. [Google Scholar]
- Balezentis, T.; Morkunas, M.; Volkov, A.; Ribasauskiene, E.; Streimikiene, D. Are women neglected in the EU agriculture? Evidence from Lithuanian young farmers. Land Use Policy 2021, 101, 105129. [Google Scholar] [CrossRef]
- Qingqi, W. The Way of Yin: The Chinese Construction of Ecofeminism in a Cross-Cultural Context. ISLE: Interdiscip. Stud. Lit. Environ. 2014, 21, 749–765. [Google Scholar] [CrossRef]
- Arora-Jonsson, S.; Sijapati, B.B. Disciplining Gender in Environmental Organizations: The Texts and Practices of Gender Mainstreaming. Gend. Work Organ. 2017, 25, 309–325. [Google Scholar] [CrossRef]
- Irving, S.; Helin, J. A World for Sale? An Ecofeminist Reading of Sustainable Development Discourse. Gend. Work Organ. 2017, 25, 264–278. [Google Scholar] [CrossRef]
- Finzer, E. Mother Earth, Earth Mother: Gabriela Mistral as an Early Ecofeminist. Hispania 2015, 98, 243–251. [Google Scholar] [CrossRef]
- Salleh, A. Ecofeminism as Politics, 2nd ed.; Zed Books: London, UK, 2017. [Google Scholar]
- MacGregor, S. From care to citizenship: Calling ecofeminism back to politics. Ethics Environ. 2004, 9, 56–84. [Google Scholar] [CrossRef]
- Brown, P.; James, D. Educational expansion, poverty reduction and social mobility: Reframing the debate. Int. J. Educ. Res. 2020, 100, 101537. [Google Scholar] [CrossRef]
- Caplan, B. The Case Against Education: Why the Education System is a Waste of Time and Money; Princeton University Press: Princeton, NJ, USA, 2018. [Google Scholar]
- Bourdieu, P.; Passeron, J.C.; Nice, R. Education, Society and Culture; SAGE Publications: London, UK, 1977. [Google Scholar]
- Levin, H.M.; Kelley, C. Can education do it alone? Econ. Educ. Rev. 1994, 13, 97–108. [Google Scholar] [CrossRef]
- Mojo, D.; Fischer, C.; Degefa, T. The determinants and economic impacts of membership in coffee farmer cooperatives: Recent evidence from rural Ethiopia. J. Rural Stud. 2017, 50, 84–94. [Google Scholar] [CrossRef]
- Abate, G.T.; Francesconi, G.N.; Getnet, K. Impact of agricultural cooperatives on smallholders’ technical efficiency: Empirical evidence from ethiopia. Ann. Public Coop. Econ. 2014, 85, 257–286. [Google Scholar] [CrossRef] [Green Version]
- Ji, C.; Jin, S.; Wang, H.; Ye, C. Estimating effects of cooperative membership on farmers’ safe production behaviors: Evidence from pig sector in China. Food Policy 2019, 83, 231–245. [Google Scholar] [CrossRef]
- Chagwiza, C.; Muradian, R.; Ruben, R. Cooperative membership and dairy performance among smallholders in Ethiopia. Food Policy 2016, 59, 165–173. [Google Scholar] [CrossRef]
- Wynne-Jones, S. Understanding farmer co-operation: Exploring practices of social relatedness and emergent affects. J. Rural Stud. 2017, 53, 259–268. [Google Scholar] [CrossRef] [Green Version]
- Kyotos, K.B.; Oduma, J.; Wahome, R.G.; Kaluwa, C.; Abdirahman, F.A.; Opondoh, A.; Mbobua, J.N.; Muchibi, J.; Bagnol, B.; Stanley, M.; et al. Gendered Barriers and Opportunities for Women Smallholder Farmers in the Contagious Caprine Pleuropneumonia Vaccine Value Chain in Kenya. Animals 2022, 12, 1026. [Google Scholar] [CrossRef]
- Zheng, S.; Wang, Z.; Awokuse, T. Determinants of Producers’ Participation in Agricultural Cooperatives: Evidence from Northern China. Appl. Econ. Perspect. Policy 2011, 34, 167–186. [Google Scholar] [CrossRef]
- Barham, J.; Chitemi, C. Collective action initiatives to improve marketing performance: Lessons from farmer groups in Tanzania. Food Policy 2009, 34, 53–59. [Google Scholar] [CrossRef] [Green Version]
- León-Velarde, C.U.; Quiroz, R. The development of livestock production systems in the Andean region: Implications for smallholder producers. In Animal Production and Animal Science Worldwide: A Review on Developments and Research in Livestock Systems; World Association of Animal Production: Lima, Peru, 2003; pp. 233–240. [Google Scholar]
- Mumba, C.; Samui, K.L.; Pandey, G.S.; Hang’ombe, B.M.; Simuunza, M.; Tembo, G.; Muliokela, S.W. Economic analysis of the viability of smallholder dairy farming in Zambia. Livest. Res. Rural Dev. 2011, 23, 137. Available online: http://www.lrrd.org/lrrd23/6/mumb23137.html (accessed on 27 January 2022).
- Ruvuga, P.R.; Wredle, E.; Mwakaje, A.; Selemani, I.S.; Sangeda, A.Z.; Nyberg, G.; Kronqvist, C. Indigenous Rangeland and Livestock Management Among Pastoralists and Agro-pastoralists in Miombo Woodlands, Eastern Tanzania. Rangel. Ecol. Manag. 2019, 73, 313–320. [Google Scholar] [CrossRef]
- Whitmarsh, L.; Capstick, S. Perceptions of climate change. In Psychology and Climate Change; Clayton, S., Manning, C., Eds.; Academic Press: Cambridge, MA, USA, 2016; pp. 13–33. [Google Scholar] [CrossRef]
- van der Linden, S. The social-psychological determinants of climate change risk perceptions: Towards a comprehensive model. J. Environ. Psychol. 2015, 41, 112–124. [Google Scholar] [CrossRef]
- Leroy, D. Farmers’ Perceptions of and Adaptations to Water Scarcity in Colombian and Venezuelan Páramos in the Context of Climate Change. Mt. Res. Dev. 2019, 39, R21–R34. [Google Scholar] [CrossRef] [Green Version]
- Su, Y.; Bisht, S.; Wilkes, A.; Pradhan, N.S.; Zou, Y.; Hyde, K.; Liu, S. Gendered Responses to Drought in Yunnan Province, China. Mt. Res. Dev. 2017, 37, 24–34. [Google Scholar] [CrossRef] [Green Version]
- Toulkeridis, T.; Tamayo, E.; Simón-Baile, D.; Merizalde-Mora, M.J.; Yunga, D.F.R.; Viera-Torres, M.; Heredia, M. Climate Change according to Ecuadorian academics–Perceptions versus facts. La Granja 2020, 31, 21–46. [Google Scholar] [CrossRef] [Green Version]
- Heredia, R.M.; Barreto, D.; Toulkeridis, T. Percepción de las Poblaciones Indígenas Kichwa sobre el Cambio Climático y sus Implicaciones en Puyo, Ecuador. In La acción climática en las ciu-dades latinoamericanas: Aproximaciones y propuestas; Carrión, A., Ariza-Montobbio, P., Eds.; FLACSO: Quito, Ecuador, 2020; pp. 209–230. [Google Scholar]
- León Alvear, V.; Torres, B.; Luna, M.; Torres, A.; Ramírez, P.; Andrade-Yucailla, V.; Muñoz-Rengifo, J.C.; Heredia, R.M. Per-cepción sobre cambio climático en cuatro comunidades orientadas a la ganadería bovina en la zona central de los Andes Ecuatorianos. Livest. Res. Rural Dev. 2020, 32, 165. [Google Scholar]
- Bradley, R.S.; Vuille, M.; Diaz, H.F.; Vergara, W. Threats to Water Supplies in the Tropical Andes. Science 2006, 312, 1755–1756. [Google Scholar] [CrossRef] [PubMed]
- Vuille, M.; Francou, B.; Wagnon, P.; Juen, I.; Kaser, G.; Mark, B.; Bradley, R.S. Climate change and tropical Andean glaciers: Past, present and future. Earth Sci. Rev. 2008, 89, 79–96. [Google Scholar] [CrossRef] [Green Version]
- Perez, C.; Nicklin, C.; Dangles, O.; Vanek, S.; Sherwood, S.; Halloy, S. Climate change in the high Andes: Im-plications and adaptation strategies for small-scale farmers. Int. J. Environ. Cult. Econ. Soc. Sustain. 2010, 6, 71–88. [Google Scholar] [CrossRef]
- Thibeault, J.; Seth, A.; Garcia, M.; Mayor, U.; Andrés, D.S.; Paz, L. Changing climate in the Bolivian Altiplano: CMIP3 projections for extremes of temperature and precipitation. J. Geophys. Res. Atmos. 2010, 115, 2070. [Google Scholar] [CrossRef]
- Valdivia, C.; Seth, A.; Gilles, J.L.; García, M.; Jiménez, E.; Cusicanqui, J.; Navia, F.; Yucra, E. Adapting to Climate Change in Andean Ecosystems: Landscapes, Capitals, and Perceptions Shaping Rural Livelihood Strategies and Linking Knowledge Systems. Ann. Assoc. Am. Geogr. 2010, 100, 818–834. [Google Scholar] [CrossRef]
- Meldrum, G.; Mijatović, D.; Rojas, W.; Flores, J.; Pinto, M.; Mamani, G.; Condori, E.; Hilaquita, D.; Gruberg, H.; Padulosi, S. Climate change and crop diversity: Farmers’ perceptions and adaptation on the Bolivian Altiplano. Environ. Dev. Sustain. 2017, 20, 703–730. [Google Scholar] [CrossRef] [Green Version]
- Nnadi, F.N.; Chikaire, J.; Ezudike, K.E. Assessment of indigenous knowledge practices for sustainable agriculture and food security in Idemili South Local Government Area of Anambra State, Nigeria. J. Resour. Dev. Manag. 2013, 1, 34–42. [Google Scholar]
- Godtland, E.M.; Sadoulet, E.; de Janvry, A.; Murgai, R.; Ortiz, O. The Impact of Farmer Field Schools on Knowledge and Productivity: A Study of Potato Farmers in the Peruvian Andes. Econ. Dev. Cult. Chang. 2004, 53, 63–92. [Google Scholar] [CrossRef] [Green Version]
- Afsar, N.; Idrees, M. Farmers perception of agricultural extension services in disseminating climate change knowledge. Sarhad J. Agric. 2019, 35, 942–947. [Google Scholar]
- Antwi-Agyei, P.; Dougill, A.J.; Stringer, L.C.; Codjoe, S.N.A. Adaptation opportunities and maladaptive outcomes in climate vulnerability hotspots of northern Ghana. Clim. Risk Manag. 2018, 19, 83–93. [Google Scholar] [CrossRef]
- Juhola, S.; Glaas, E.; Linnér, B.O.; Neset, T.S. Redefining maladaptation. Environ. Sci. Policy 2016, 55, 135–140. [Google Scholar] [CrossRef] [Green Version]
- Vásquez, R.P.; Aguilar-Lasserre, A.A.; López-Segura, M.V.; Rivero, L.C.; Rodríguez-Duran, A.A.; Rojas-Luna, M.A. Expert system based on a fuzzy logic model for the analysis of the sustainable livestock production dynamic system. Comput. Electron. Agric. 2019, 161, 104–120. [Google Scholar] [CrossRef]
- FAO. Climate-Smart Agriculture Sourcebook; FAO: Rome, Italy, 2013; p. 570. [Google Scholar]
- Serra, R.; Mckune, S. Climate Information Services and Behavioral Change: The Case of SENEGAL; Working Paper Series for Development, Security and Climate Change in the Sahel: Exchange Program between UF, Sciences Po and UCAD; Sahel Research Group: Gainesville, FL, USA, 2016; 22p. [Google Scholar]
- Vaughan, C.; Hansen, J.; Roudier, P.; Watkiss, P.; Carr, E. Evaluating agricultural weather and climate services in Africa: Evidence, methods, and a learning agenda. WIREs Clim. Chang. 2019, 10, e586. [Google Scholar] [CrossRef] [Green Version]
- Ouédraogo, I.; Diouf, N.S.; Ouedraogo, M.; Ndiaye, O.; Zougmoré, R.B. Closing the Gap between Climate Information Producers and Users: Assessment of Needs and Uptake in Senegal. Climate 2018, 6, 13. [Google Scholar] [CrossRef] [Green Version]
- Santiago, C.M.; Díaz, P.R.; Morales-Salinas, L.; Betancourt, L.P.; Fernández, L.O. Practices and Strategies for Adaptation to Climate Variability in Family Farming. An Analysis of Cases of Rural Communities in the Andes Mountains of Colombia and Chile. Agriculture 2021, 11, 1096. [Google Scholar] [CrossRef]
- Henry, B.K.; Eckard, R.J.; Beauchemin, K.A. Review: Adaptation of ruminant livestock production systems to climate changes. Animal 2018, 12, s445–s456. [Google Scholar] [CrossRef] [Green Version]
- Cayambe, J.; Iglesias, A. The cost of mitigating greenhouse gas emissions in farms in Central Andes of Ecuador. Span. J. Agric. Res. 2020, 18, e0101. [Google Scholar] [CrossRef] [Green Version]


| Provinces | Cantons | Parishes | Meters above Sea Level m.a.s.l. |
|---|---|---|---|
| Chimborazo | Riobamba | San Juan | 3200 |
| Guano | San Andrés | 6310 | |
| Tungurahua | Ambato | Pilahuin | 3480 |
| Juan Benigno Vela | 3016 | ||
| Tisaleo | Tisaleo | 3320 | |
| Mocha | Mocha | 3280 | |
| Bolívar | Guaranda | Simiatug | 3238 |
| Salinas | 3536 | ||
| Guanujo | 2920 |
| Topic | Variables |
|---|---|
| Human and social capital | Ethnicity, gender, age, and education of the household head, successor generation, and association membership. |
| Natural capital | Total farm area, pasture area, crop area. |
| Physical and financial capital | Total number of animals per head, total number of cows in production per head, availability of milking water, type of milking floors, container that moves the milk, who performs the milking, and who receives a bonus from the state. |
| Id | Variables | Options |
|---|---|---|
| 1 | Understanding about climate change. | 1: yes; 2: no; 3: some |
| 2 | Does the weather change in your area? | 1: yes, a lot; 2: yes, a little: 3: no; 4: unsure |
| 3 | Willingness to receive climate-change training. | 1: yes; 0: no |
| 4 | Willingness to adopt appropriate cattle-management practices. | 1: yes; 0: no |
| 5 | Access to climatological information. | 1: yes; 0: no |
| 6 | In the last ten years, have you adopted adaptive actions to climate change? | 1: yes; 0: no |
| 7 | Willingness to invest labor and materials to adopt actions adapting to climate change. | 1: yes; 0: no |
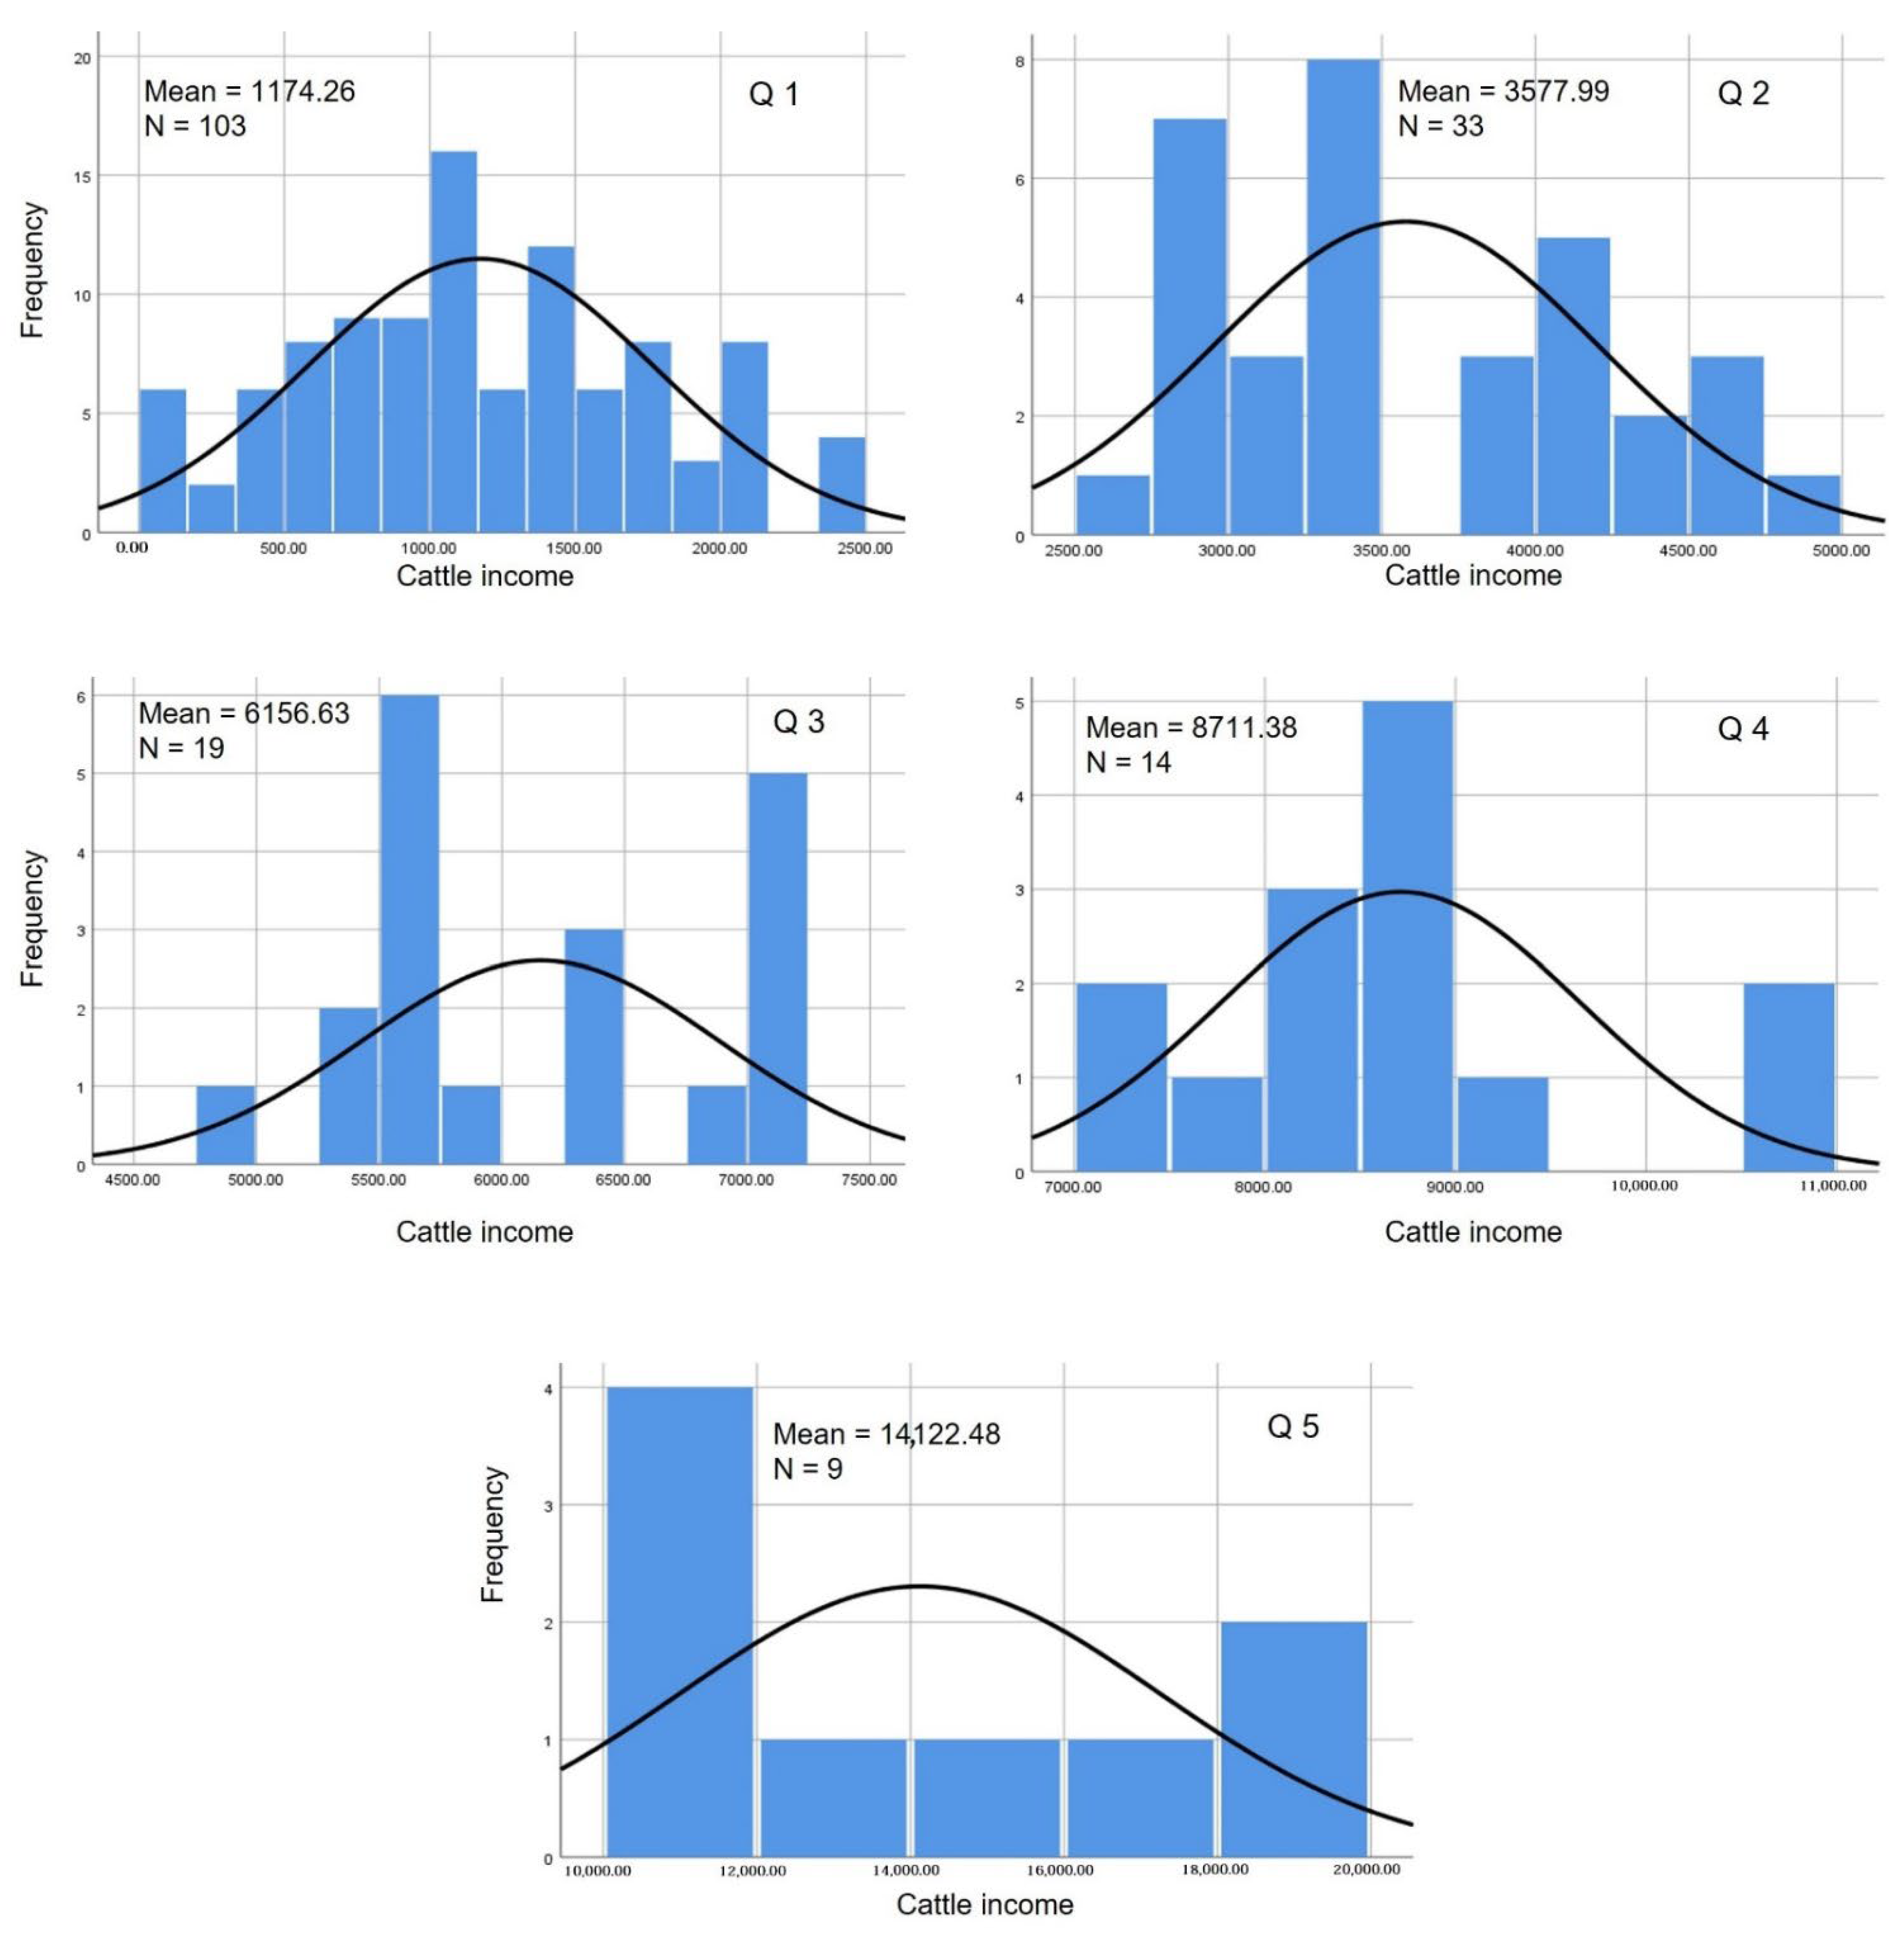
| Variables | Q1 | Q2 | Q3 | Q4 | Q5 | Average USD | Significance |
|---|---|---|---|---|---|---|---|
| <20% | 20–40% | 40–60% | 60–80% | >80% | |||
| USD | USD | USD | USD | USD | |||
| Average total livestock income | 1174.26 (595.98) | 3577.99 (624.30) | 6156.63 (727.35) | 8711.38 (940.03) | 14,122.48 (3115.40) | 3399.22 (3551.66) | *** |
| Average household size | 3.54 | 3.18 | 3.47 | 2.93 | 3.56 | 3.42 | ns |
| Average income per capita/daily | 0.91 | 3.08 | 4.86 | 8.15 | 10.87 | 2.72 | *** |
| Poverty category | Extremely poor | Moderately poor | Not so well-off | Moderately well-off | Well-off | Moderately poor | |
| Sample percentage | 58% | 18% | 11% | 8% | 5% | 100 |
| Variables | Quintiles | Average | Significance | |||||
|---|---|---|---|---|---|---|---|---|
| Q1 | Q2 | Q3 | Q4 | Q5 | ||||
| Ethnicity | Kichwa % | 78.6 | 39.4 | 15.8 | 14.3 | - | 55.6 | *** |
| Mestizo % | 21.4 | 60.6 | 84.2 | 85.7 | 100 | 44.4 | ||
| Gender of household head | Man % | 76.7 | 66.7 | 52.6 | 64.3 | 66.7 | 70.8 | ns |
| Women % | 23.3 | 33.3 | 47.4 | 35.7 | 33.3 | 29.2 | ||
| Age of household head | (years) | 42.0 | 45.9 | 41.9 | 47.5 | 36.8 | 42.9 | ns |
| Education of household head (years) | Basic % | 56.3 | 54.5 | 57.9 | 50.0 | 77.8 | 56.7 | |
| Medium % | 19.4 | 18.2 | 21.1 | 28.6 | 11.1 | 19.7 | ns | |
| College % | 5.8 | 30 | 5.3 | - | 11.1 | 5.1 | ||
| None % | 18.4 | 24.2 | 15.8 | 21.4 | - | 18.5 | ||
| Generational Replacement | Yes % | 72.8 | 81.8 | 89.5 | 71.4 | 88.9 | 77.0 | ns |
| No % | 27.2 | 18.2 | 10.5 | 21.4 | 11.1 | 22.5 | ||
| Belongs to an association | Yes % | 38.8 | 57.6 | 78.9 | 71.4 | 55.6 | 50.0 | *** |
| No % | 61.2 | 42.4 | 21.1 | 286 | 44.4 | 50.0 | ||
| Variables | Quintiles | Average | Significance | ||||
|---|---|---|---|---|---|---|---|
| Q1 | Q2 | Q3 | Q4 | Q5 | |||
| Total farm area (ha) | 2.37 (2.12) | 2.79 (1.99) | 3.08 (1.65) | 3.82 (1.49) | 7.00 (5.07) | 2.87 (2.45) | *** |
| Pasture area (ha) | 1.60 (1.52) | 2.45 (1.65) | 2.63 (1.38) | 3.68 (1.51) | 5.78 (2.99) | 2.24 (1.91) | *** |
| Cultivation area (ha) | 0.77 (1.08) | 0.33 (0.77) | 0.45 (0.52) | 0.14 (0.36) | 1.22 (2.64) | 0.63 (1.09) | ns |
| Variables | Quintiles | Average | Significance | |||||
|---|---|---|---|---|---|---|---|---|
| Q1 | Q2 | Q3 | Q4 | Q5 | ||||
| Total cows in production per household | Cow unit | 1.93 | 3.12 | 4.11 | 4.93 | 8.44 | 2.95 | *** |
| Milking water | Yes % | 69.9 | 81.8 | 78.9 | 42.1 | 55.6 | 70.2 | |
| No % | 30.1 | 18.2 | 21.1 | 57.9 | 44.4 | 29.8 | ||
| Milking-floor type | Earth % | 97.1 | 100 | 84.2 | 100 | 100 | 96.3 | |
| Cement% | - | - | 10.5 | - | - | 2.1 | ns | |
| Lack of % | 2.9 | - | 5.3 | - | - | 1.6 | ||
| Milk container | AI drums % | 11.7 | 27.3 | 26.3 | 50.0 | 33.3 | 20.2 | |
| Aluminum drums % | 64.1 | 60.6 | 68.4 | 14.3 | 44.4 | 59.0 | ns | |
| Plastic tanks % | 9.7 | 3.0 | 5.3 | 35.7 | 11.1 | 10.1 | ||
| Others | 14.6 | 9.1 | - | - | 11.1 | 10.7 | ||
| Who realizes the milking | Man % | 21.4 | 9.1 | 15.8 | 14.3 | - | 16.9 | |
| Women % | 73.8 | 87.9 | 73.7 | 85.7 | 100 | 78.7 | ns | |
| Both % | 4.9 | 3.0 | 10.5 | - | - | 4.5 | ||
| Receives bonus | Yes % | 41.7 | 30.3 | 26.3 | 28.6 | 11.1 | 35.4 | ns |
| No% | 58.3 | 69.7 | 73.7 | 71.4 | 88.9 | 64.6 | ||
| Variables | Quintiles | Average | Significance | |||||
|---|---|---|---|---|---|---|---|---|
| Q1 | Q2 | Q3 | Q4 | Q5 | ||||
| Understanding about climate change. | Yes % | 27.2 | 25.0 | 31.6 | 42.9 | 44.4 | 29.4 | |
| No % | 70.9 | 68.8 | 68.4 | 50.0 | 55.6 | 67.8 | ns | |
| Some % | 1.9 | 6.2 | - | 7.1 | - | 2.8 | ||
| Does the weather change in your area? | Yes, a lot % | 26.2 | 33.3 | 31.6 | 64.3 | 55.6 | 32.6 | |
| Yes, a little % | 44.7 | 27.3 | 42.1 | 7.1 | 33.3 | 37.6 | ns | |
| No % | 9.7 | 15.2 | 15.8 | - | - | 10.1 | ||
| Unsure % | 19.4 | 24.2 | 10.5 | 28.6 | 1.1 | 19.7 | ||
| Willingness to receive climate-change training. | Yes % | 81.6 | 84.8 | 78.9 | 100 | 100 | 84.3 | |
| No % | 18.4 | 15.2 | 21.1 | - | - | 15.7 | ns | |
| Willingness to adopt appropriate cattle-management practices. | Yes % | 80.6 | 66.7 | 47.4 | 42.9 | 44.4 | 69.7 | |
| No % | 19.4 | 33.3 | 52.6 | 57.1 | 55.6 | 30.3 | ns | |
| Access to climatological information. | Yes % | 10.7 | 15.2 | 15.8 | 28.6 | 22.2 | 14.0 | |
| No % | 89.3 | 84.8 | 84.2 | 71.4 | 77.8 | 86.0 | ns | |
| In the last ten years, have you adopted adaptive actions to climate change? | Yes % | 5.8 | 12.1 | - | 14.3 | 11.1 | 7.3 | |
| No % | 94.2 | 87.9 | 100 | 85.7 | 88.9 | 92.7 | ns | |
| Willingness to invest labor and materials to adopt actions adapting to climate change. | Yes % | 84.5 | 84.8 | 57.9 | 64.3 | 66.7 | 79.2 | |
| No % | 15.5 | 15.2 | 42.1 | 35.7 | 33.3 | 20.8 | *** | |
Publisher’s Note: MDPI stays neutral with regard to jurisdictional claims in published maps and institutional affiliations. |
© 2022 by the authors. Licensee MDPI, Basel, Switzerland. This article is an open access article distributed under the terms and conditions of the Creative Commons Attribution (CC BY) license (https://creativecommons.org/licenses/by/4.0/).
Share and Cite
Torres, B.; Cayambe, J.; Paz, S.; Ayerve, K.; Heredia-R, M.; Torres, E.; Luna, M.; Toulkeridis, T.; García, A. Livelihood Capitals, Income Inequality, and the Perception of Climate Change: A Case Study of Small-Scale Cattle Farmers in the Ecuadorian Andes. Sustainability 2022, 14, 5028. https://doi.org/10.3390/su14095028
Torres B, Cayambe J, Paz S, Ayerve K, Heredia-R M, Torres E, Luna M, Toulkeridis T, García A. Livelihood Capitals, Income Inequality, and the Perception of Climate Change: A Case Study of Small-Scale Cattle Farmers in the Ecuadorian Andes. Sustainability. 2022; 14(9):5028. https://doi.org/10.3390/su14095028
Chicago/Turabian StyleTorres, Bolier, Jhenny Cayambe, Susana Paz, Kelly Ayerve, Marco Heredia-R, Emma Torres, Marcelo Luna, Theofilos Toulkeridis, and Antón García. 2022. "Livelihood Capitals, Income Inequality, and the Perception of Climate Change: A Case Study of Small-Scale Cattle Farmers in the Ecuadorian Andes" Sustainability 14, no. 9: 5028. https://doi.org/10.3390/su14095028