Article

Assessment of Emissions and Energy Consumption for Construction Machinery in Earthwork Activities by Incorporating Real-World Measurement and Discrete-Event Simulation

1
Department of Machine Design, KTH Royal Institute of Technology, 100 44 Stockholm, Sweden
2
School of Naval Architecture, Ocean and Energy Power Engineering, Wuhan University of Technology, Wuhan 430063, China
*
Author to whom correspondence should be addressed.
Sustainability 2022, 14(9), 5326; https://doi.org/10.3390/su14095326
Submission received: 10 April 2022 / Revised: 24 April 2022 / Accepted: 25 April 2022 / Published: 28 April 2022

Abstract

:
Earthwork, an essential activity in most construction projects, consumes large quantities of fossil fuel and produces substantial air pollution with adverse environmental impacts. To achieve more sustainable construction processes, novel methodologies to evaluate and improve the performance of earthwork operations are required. This study quantifies the real-world emissions and fuel consumption of construction equipment within an earthwork project in China. Two wheel loaders and two dump trucks are examined through on-board measurements and in-lab engine tests. The duty cycles of construction equipment are categorized with respect to their power efficiency and working patterns. Moreover, the power-specific and time-based emission factors for these duty cycles are computed and compared with relevant legislative emission limits. Significant emission variations among different duty cycles were found, and the real-world emission measurements exceeded the results from the in-lab test required for emission certification. In addition, a discrete-event simulation (DES) framework was developed, validated, and integrated with the computed emission factors to analyze the environmental and energy impacts of the earthwork project. Furthermore, the equipment fleet schedule was optimized in the DES framework to reduce greenhouse gas emissions and fuel consumption by 8.1% and 6.6%, respectively.

1. Introduction

As an essential activity in most construction projects, earthwork consumes a significant amount of fossil fuel, thereby producing substantial air pollution with adverse environmental impacts [1,2]. The construction industry is continuously developing novel methodologies to evaluate and improve the environmental performance of earthwork operations. Different types of heavy-duty (HD) vehicles are used in the construction process to accomplish the earthwork tasks (e.g., excavators for digging, wheel loaders for moving and loading, or trucks for hauling and disposing). Although electrified vehicles have been widely popularized in the transportation and mobility sectors, the electrification process of the construction industry is lagging, in particular, for heavy-duty construction equipment [3]. Earthwork construction equipment is generally driven by diesel engines, which generate large quantities of pollutants, such as nitrogen oxides (NOx), hydrocarbon (HC), carbon monoxide (CO), particulate matter (PM), and carbon dioxide (CO2) [4]. Assessing emissions and energy impacts for construction equipment used in earthwork is important to improve the social and environmental sustainability of construction processes.

1.1. Literature Review

To reduce the pollutants emitted from construction machines, emission standards for nonroad vehicles have been globally implemented since the 1990s (e.g., EPA Tier I of the U.S. in 1994 or EU Stage I in 1999). The permissible levels of tail-out emissions also keep decreasing with successive legislation [5]. Nevertheless, there is still room for improvement. The emission laws on nonroad vehicles usually lag nearly two generations behind their on-road HD truck counterparts. For example, the current national nonroad Stage III emission standard [6] in China requires the reduction of NOx emissions to 4.0 g/kWh for a power rating of 19–560 kW (implemented since 2014). In contrast, the Chinese national on-road Stage V emission standard [7] specifies a NOx limitation of 2.0 g/kWh (implemented since 2016). Moreover, the test cycles regulated by emission laws may not reflect the real-world operating conditions of construction machines; thus misleading the estimation of air pollutants emitted from construction processes [8,9]. In addition, limitations on greenhouse gas emissions have not been included in the area of nonroad equipment.
During the last few decades, the environmental and social impacts of earthwork projects have been studied to evaluate the emissions and fuel consumption of nonroad equipment [10]. Two approaches have been widely used to measure construction machines’ emissions: in-lab engine tests and on-board measurement [9]. In-lab tests are conducted by connecting the engines of HD construction equipment with a dynamometer on an engine test bench. The test bench operates engines in test duty cycles (i.e., pre-set torque and speed profiles) to simulate particular operating conditions and monitor the emissions with other engine parameters [11]. The in-lab test is also used for engine emission certification approvals. Through this approach, complex test duty cycles can be conducted with high-frequency sampling and accurate exhaust measurement [12]. However, the in-lab test is generally high-cost. Furthermore, the emission levels are determined by the selection of the test duty cycles, which may differ from the engine conditions in real-world operations [13].
Another approach for characterizing nonroad emissions is to use the portable emissions measurement system (PEMS). The PEMS mounted on construction vehicles can measure the real-time emission data during the construction process by sampling at the tailpipe. Compared to the in-lab engine test, results from on-board measurement are considered closer to real-world conditions [9]. Many studies have been conducted to assess the real-time emissions for various construction activities [13,14,15]. For the application of the PEMS on construction equipment in China, [16] reviewed the literature on five types of Chinese nonroad equipment, and a high variability of on-board emissions was observed. The highest emission measurement values can be nine-times lower. Reference [17] tested the real-world NOx and PM emissions of 30 nonroad diesel mobile machinery complying with their corresponding national Chinese II or III standards. It has shown that NOx emissions measured by the PEMS were 24% to 225% larger than the respective emission limits. In addition, [18] examined 16 excavators and 19 wheel loaders using the PEMS to capture emission characteristics. Reference [8] investigated the emissions of excavators, loaders, cranes, trucks, and other equipment in several Chinese urban areas. In these studies, typical operating conditions are categorized based on on-board diagnostics, and emissions measured through PEMS were found higher than the limits of the corresponding emission standards.
For the studies quantifying the environmental and economic influences of construction processes, due to the various types of machines and complicated activities involved in the projects, most literature in this area seeks assistance from discrete-event simulations (DESs). In the simulation, the event-based agents of construction equipment interact and accomplish the tasks under temporal, spatial, cost, or other constraints [19]. For instance, the productivity and equipment behavior of earthmoving operations in a dam construction project were modeled and analyzed using DES in [20]. Based on specific traffic and environmental models, [21] incorporated sustainability objectives into the design of road construction operations. Furthermore, based on the DES framework, the decision-making of construction management or the behavior of selected equipment can be optimized [22]. Research in this area focuses on reducing the emissions or the energy consumption of construction machines while maintaining the productivity of the projects [23]. Reference [24] simulated and optimized a highway construction project with respect to CO2 emissions and productivity. Reference [25] optimized the earth allocation planning of earthwork processes to reduce the project’s overall cost.
To accurately assess environmental performance in DES, the emission models used for nonroad equipment are vital [26]. The emission factor (sometimes called emission inventory or emission rate) [27] is commonly adopted in DES to estimate the environmental impact of in-use construction machines. These emission factors are defined in terms of the mass of specific emission pollutants per unit output power (emission factors can also be calculated based on operating time or fuel consumed). The emission factors of construction equipment in the literature are generally sourced from massive databases covering almost all categories of in-use machines, such as the EPA NONROAD model [28]. Such emission databases are usually categorized based on engine power rates, model years, fuel types, and emission control technologies. Nevertheless, even the same equipment’s performance may differ for different operating conditions. Emission data with localized characteristics are still needed to achieve a reliable assessment of construction projects.

1.2. Objectives of the Present Work

To the best of the authors’ knowledge, no study has evaluated the environmental performance of an earthwork project by incorporating the real-world measurements of in-use construction equipment and a DES model. Although many previous studies measured the emission characteristics of construction operations in China [16], the difference between the real-world emissions and the in-lab results from test cycles regulated by emission standards remains to be investigated. Moreover, at which level different operational patterns of construction equipment can change the environmental impacts and energy consumption of earthwork projects is yet to be determined. This study evaluates the emissions and energy consumption of earthwork activities based on real-world measurements. The equipment’s emission factors and fuel use were calculated based on in-lab measurement and on-board data at a construction site. The earthmoving project’s environmental impacts and energy consumption were then estimated and optimized using a DES platform. The primary contributions of this work are:
  • On-board operational data were measured from equipment (two wheel loaders and two dump trucks) utilized in the earthwork activities of an urban construction site in China. In-lab engine experiments were also conducted to investigate the emission levels and fuel consumption associated with different typical operating conditions.
  • Based on measurement data, different operational cycles for wheel loaders and working modes for dump trucks are categorized. Thus, the power-specific and time-based emission factors and fuel consumption for these duty cycles are discussed.
  • The emission factors and fuel use levels were integrated into a DES framework to assess and optimize an earthmoving project with the objective of minimizing overall tail-out emissions and fuel consumption.

1.3. Document Organization

The remainder of this paper is organized as follows. Section 2 introduces the data collection in the on-board measurement and in-lab tests. Following this, the power-specific emissions and energy consumption of selected construction machinery are quantified for different operating conditions in Section 3. Finally, a DES platform is introduced and applied in Section 4 to evaluate and optimize the operational schedule of HD equipment with respect to the emission and energy aspects of the earthwork project. Section 6 concludes the paper.

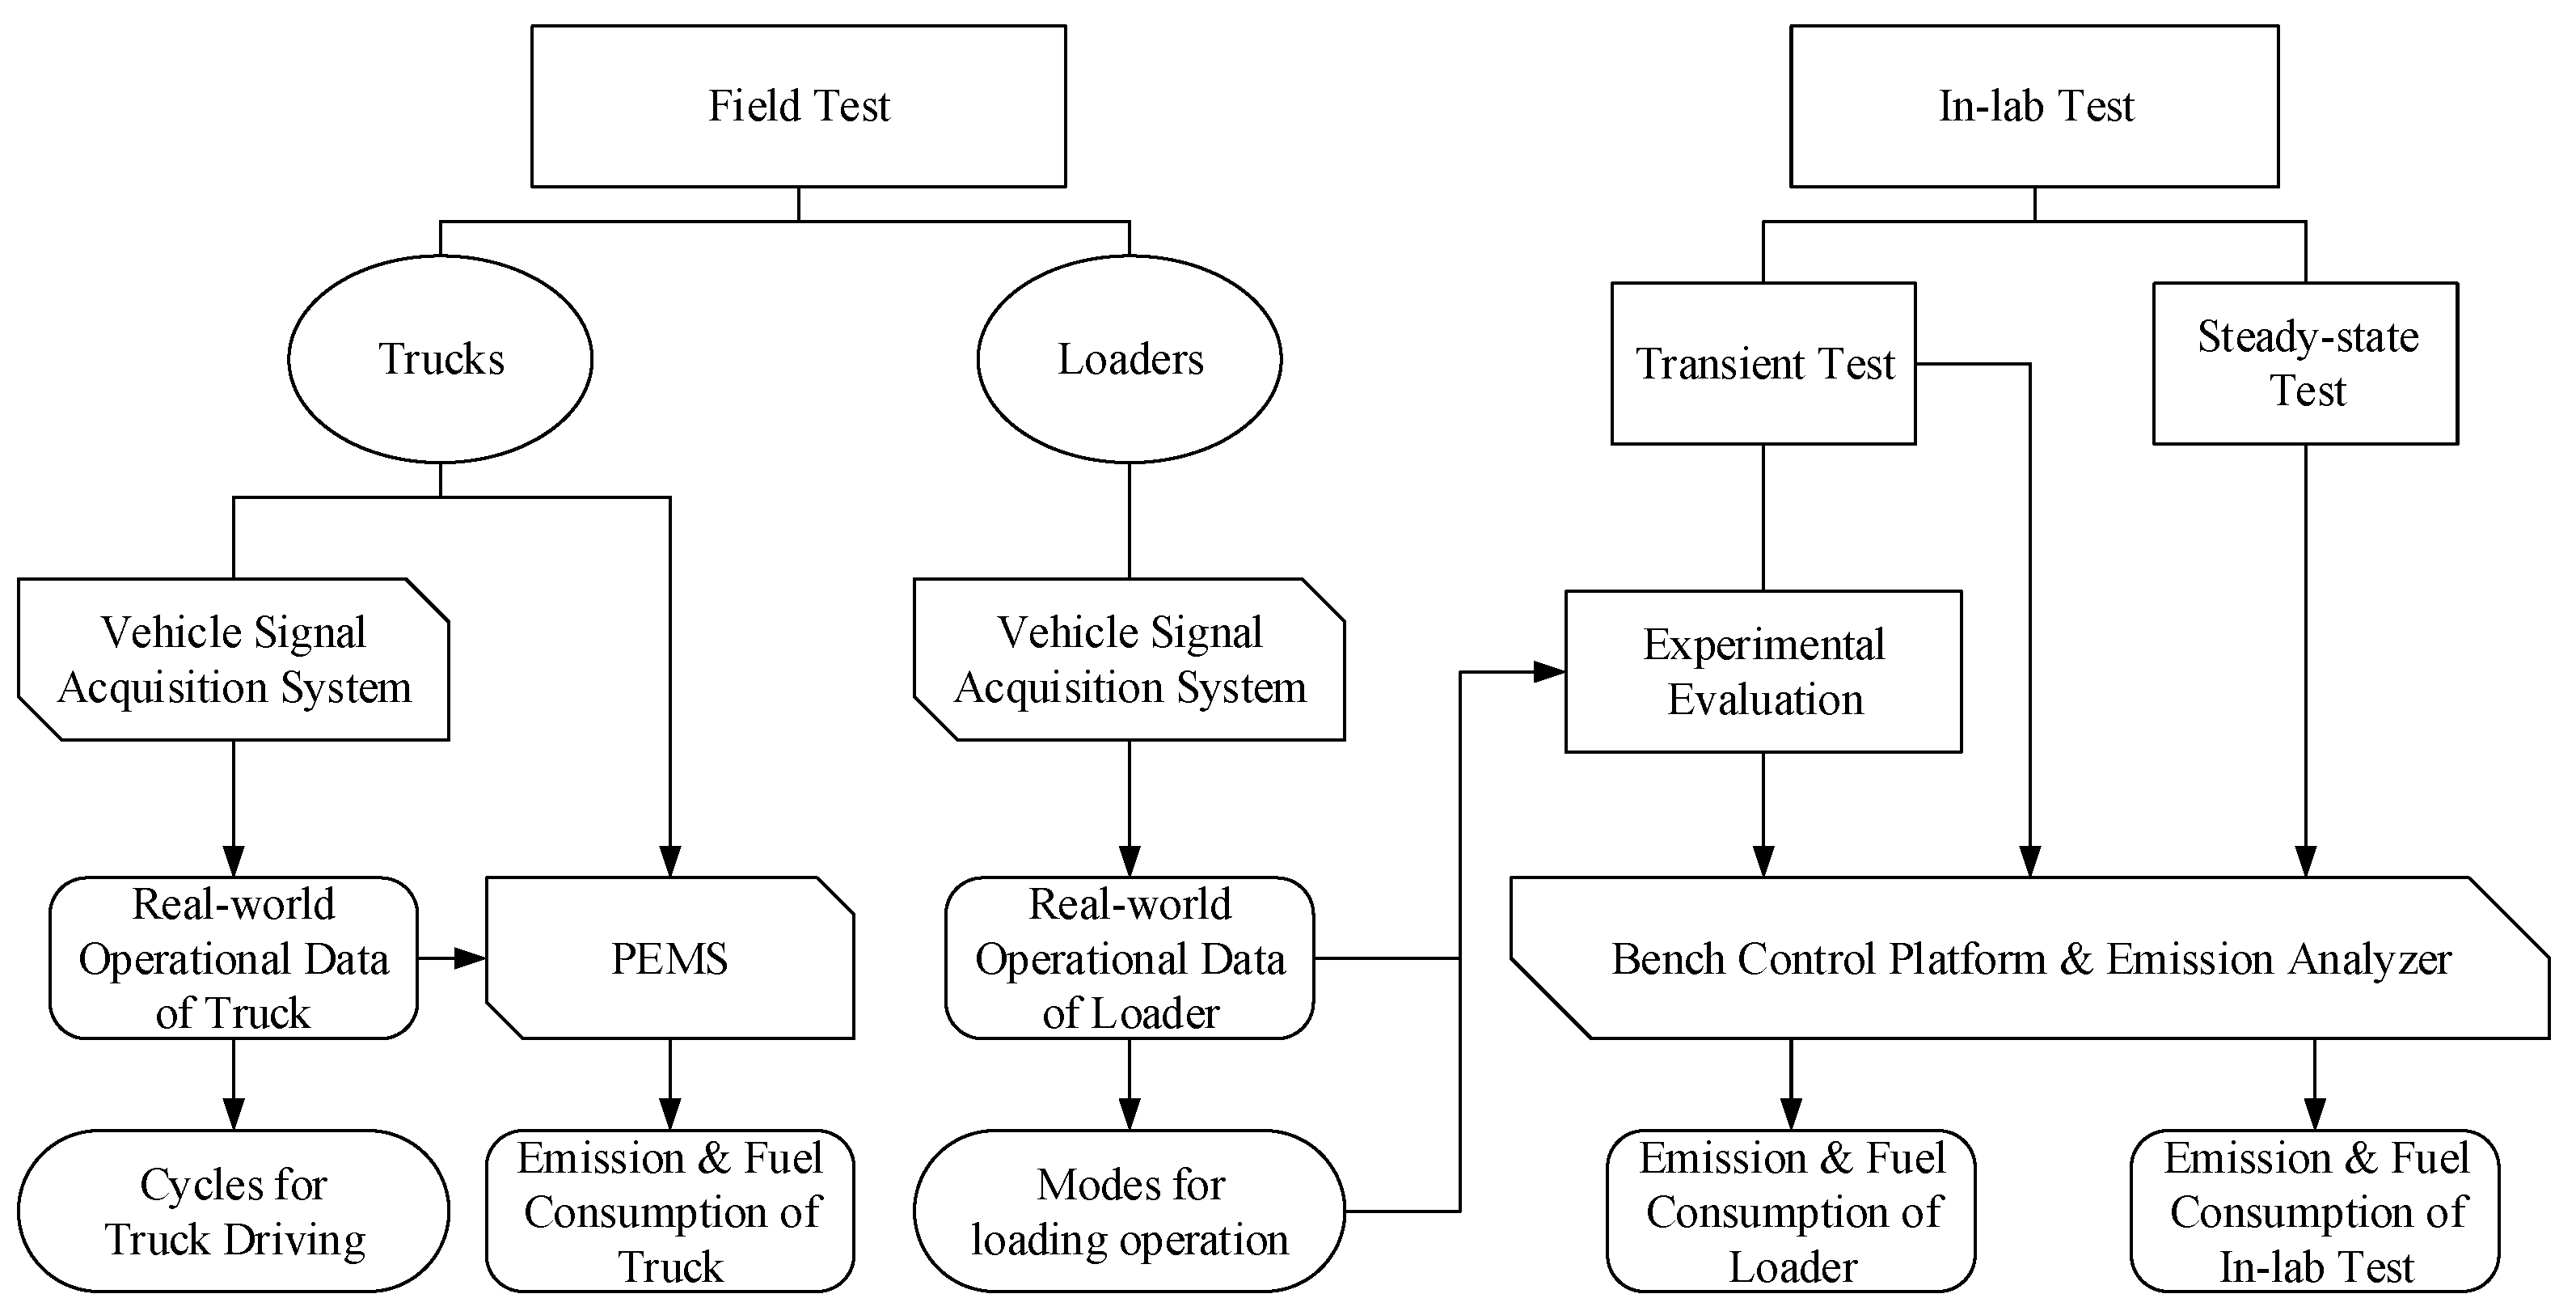
2. Experiments and Data Collection

Four types of earthwork equipment were involved in the experimental studies at the construction site: two wheel loaders with rated workloads of 3200 kg and 5000 kg and two dump trucks with power ratings of 228 kW and 385 kW, respectively. In the earthwork activities, the task of loaders is to lift stockpiled materials from the ground level and deposit them into an awaiting dump truck. In contrast, the dump truck used for earthmoving delivers the construction material for long-distance transportation. The powertrains of the selected machines were heavy-duty engines fueled by conventional (i.e., petroleum) diesel or biodiesel with certifications according to their corresponding Chinese national emission legislation. The main parameters of these construction machines are listed in Table 1. Note that the emission standard of the wheel loaders was the national nonroad Stage III for nonroad mobile machinery [6], and the dump trucks followed the emission regulations for on-road heavy-duty vehicles [7]. The limits for exhaust pollutants in the emission standards are given in Appendix A. For the emission control techniques applied in select machines, apart from the after-treatment systems such as selective catalytic reduction (SCR) or exhaust gas recirculation (EGR), the common-rail system (CR) for fuel injection has also been modified by engine manufacturers to reduce the greenhouse gases emission and other pollutants.
As shown in Figure 1, the test schedule in this study contains two parts: a field test with on-board measurement and an in-lab engine test. First, the field test was performed when loaders and trucks were operated in a construction site for earthmoving. The acquisition system was linked to the on-board diagnostics (OBD) system via a controller area network (CAN bus) to record the operations of the selected machines. The PEMS was connected to the tailpipe of the trucks for sampling and measuring the emission data (e.g., NOx, HC, CO, and CO2) during the construction process. However, the application of the PEMS on the wheel loaders might interfere with the loading operation: the installation of the PEMS affects the movement of loaders due to less power being available for the operations, and the bumpy terrain at the construction site increases the risk of interrupting the PEMS measurement. Consequently, an in-lab experimental evaluation was involved as an alternative approach to measure the emission values of loaders based on the real-world operational parameters captured by the on-board acquisition system. Engines tested in the bench platform were operated following the preset operating profiles using the engine dynamometers and controlling devices. The profiles included the real-world operating conditions and the typical operational cycles categorized from real-world data (see Section 2). According to the corresponding emission legislation, the in-lab experiments also contained transient and steady-state tests.

2.1. Field Test

The field test took place at a construction site located in the urban area of Yulin city, Southwest China, and the material for this earthwork was a mixture of soil and gravel. The earthwork was completed by a group of cooperating trucks and loaders. The truck fleet was composed of eight EQ345 dump trucks and six DFL180 dump trucks, while the loader team had two Z50 wheel loaders and two LW30 wheel loaders. One EQ345 and one DFL180 dump truck were measured during the earthwork of four days to record their real-world operational data and emission values. The PEMS installed on the employed truck was SEMTECH ECOSTAR (see Figure 2). The system was also connected to a global positioning system (GPS) and an OBD system to simultaneously measure and log the emissions, engine parameters, and vehicle positions during the earthmoving activities. Figure 3 shows the hauling-and-returning route between the construction site and the dumping site. According to the municipal plan of the local government, this round-trip route was temporarily dedicated for this earthwork; hence, there was no other traffic interference. This enabled the trucks to maintain similar speed profiles without interruptions due to urban traffic conditions.
The vehicle acquisition system and engine accessory sensors were installed in selected wheel loaders (see Figure 4) to log the operational data and engine parameters during the loading processes. These data were further used in the in-lab tests to repeat the real-world conditions for classifying and analyzing the representative operational cycles of the wheel loaders. Moreover, the video files of the loading processes were also digitized to classify the driving behavior of different cycles.

2.2. In-Lab Test

The in-lab engine test bench (see Figure 5) is an automatic test system for developing, characterizing, and testing the engine of machinery. In this study, the engine test bench with a PUMA OPEA control platform employed AVL fuel flow meters and sensors for intake and exhaust gases (e.g., KROHNE air flow meter, FUTEK pressure transducers, and K-type thermocouples). The command signal was sent by an independent FPGA system to the engine control unit (ECU) to control the engine state. The tailpipe emission was measured using an AVL AMA 4000 emission analyzer.
The experimental evaluations were conducted on an engine test bench to reproduce real-world operations based on engine parameters collected through the acquisition system in the field test. The bench control platform operated the engine according to the profiles of the real-world operations. Meanwhile, the engine control systems simulated the ambient conditions (e.g., the temperature, pressure, and humidity) by tracking the real-world data. Different duty cycles were categorized from the real-world data and simulated separately. Steady-state and transient tests were also conducted in the engine test. The steady-state test controls the engine running at fixed operating points to measure the parameters in stable conditions as a regular part of an engine test. According to the emission standards, the ISO 8178 test cycles for nonroad machines [6] and the European Stationary Cycle (ESC) [7] test for on-road HD vehicles were separately adopted for the HD engines of the loaders and trucks employed in this study. Moreover, transient tests required by the current emission regulation were included in the in-lab experiment to observe differences in performance caused by transient conditions (i.e., rapid changes in engine workload and speed), which occur frequently in real-life operations. The transient cycles used were the Nonroad Transient Cycle (NRTC) [29] for nonroad machines and the European Transient Cycle (ETC) [5,7] for on-road HD vehicles.

3. Emission Factors of Duty Cycles

This section presents the calculation of the power-specific and time-based emission factors. Emission factors of different duty cycles for construction equipment were computed based on the real-world PEMS data and in-lab measurements. The duty cycles of the wheel loaders and dump trucks were categorized from real-world data. Since wheel loaders are usually utilized for transporting construction materials over short distances with repetitive loading tasks, the duty cycle categorization of wheel loaders in this study was based on the power rates of loading cycles. In contrast, the driving scenarios of dump trucks are relatively complex and contain several different types of tasks (e.g., on-road driving, waiting, or dumping). Therefore, the duty cycles of the dump trucks were characterized by the tasks.

3.1. Emission Factors

Based on the PEMS data and in-lab measurements, the emission factors of different duty cycles can be calculated and compared with relevant legislative test cycles. Two forms of emission factors and fuel consumption metrics were used in this work: the power-specific emission factor ε p (unit: g/kWh) [16,17] and the time-based emission factor ε t (unit: g/h or kg/h) [28]. The emission factors of pollutant i can be calculated as follows:
ε p i = total emission mass of i total power output = T c y c l e c i m ˙ e x d t T c y c l e P d t
ε t i = total emission mass of i time consumption = T c y c l e c i m ˙ e x d t T c y c l e
where i denotes one type of gaseous composition of emitted pollution, such as NOx, HC, CO, or CO2. The power-specific and time-based fuel consumption were also computed by using these formulations. c i is the measured gaseous concentration (unit: ppm) of pollutant i, and m ˙ e x is the instantaneous exhaust mass flow (unit: g/h). P is the measured instantaneous engine power (unit: kW), and the time consumption of the test cycle is T c y c l e (unit: h).

3.2. Operational Cycles of Wheel Loaders

A wheel loader is one type of HD construction vehicle used for short-distance transport of building materials. The operational cycle of wheel loaders is depicted in Figure 6. Besides the procedures of bucket-filling, lifting, and dumping materials, a wheel loader also needs to travel backward and forward between the materials pile and awaiting dump trucks four times to complete a loading task [30,31]. Although the loading patterns are similar and repetitive, there are still significant cycle-to-cycle variations in energy efficiency, emissions, and time consumption. Therefore, power efficiency was introduced to categorize the different operational cycles of the wheel loaders.
Based on the collected data from the two types (Z50 and LW30) of loaders in real-world operations, different cycles can be categorized by their power efficiency η P , i.e., the ratio of the average power per cycle to the engine rated power:
η P = P c y c l e P r a t e d = T c y c l e P d t P r a t e d T c y c l e
where P c y c l e (unit: kW/cycle) denotes the average power of one cycle. T c y c l e (unit: h/cycle) is the time duration of that operational cycle, while P r a t e d (unit: kW) is the engine rated power indicating the highest power output of the machines.
The real-world measurements were classified into four operational cycles according to the power efficiency listed in Table 2. Moreover, the event distributions of operational cycles when performing the earthwork are shown in Figure 7. It can be found that the loading operations of both wheel loaders usually followed the pattern of Cycle #2, and LW30 was relatively more likely to operate in the range of the highest engine efficiency.
Experimental evaluations of the loaders were made to repeat the operations following the extracted data from the real-world measurement. To ensure that the data collection reflected the real-world operating conditions and emission levels of the wheel loaders, at least 50 cycles were extracted from measurement data for each operating cycle. The measured emissions and fuel consumption of different operational cycles are presented in Table 3. Note that the emission factors and fuel consumption are presented in both power-specific and time-based forms. The former evaluates the emissions and fuel consumption based on the vehicle energy efficiency, while the latter is capable of showing the amount of pollutant by operating time.
Table 3 summarizes the average emission factors and fuel consumption of loaders associated with real-world earthwork and in-lab engine test cycles required for emission certification. As previously mentioned, the engine test cycles for wheel loaders also involved the ISO 8178 cycle as the steady-state (SS) test and the NRTC as the transient test. Since the emission laws mainly regulate the power-specific emissions over the test cycles, the corresponding time-based emission results are not given in Table 3. In particular, the real-world (RW) test results were calculated by repeating 1.5 h loading operations (in total, 72 successive operational cycles) on the engine bench based on the real-world-measured operational data.
The emission levels and fuel consumption varied in different cycles. For example, NOx in the real-world cycle largely exceeded the emission standards. This result partly confirmed that the current testing method regulated by the emission standards cannot entirely reflect the actual emission level of nonroad equipment. As the power rating differed, there was no clear trend among the time-based emission factors. In contrast, the power-specific emissions of the different wheel loaders were comparable. Despite obeying the same nonroad emission regulation, noticeable differences among the emissions of the employed wheel loaders can be observed. For instance, the power-specific HC and CO pollutants in the real-world cycle of these two loaders were different. The HC and CO emissions of the LW30 loader were much less than those of the Z50 loader when compared to other pollutants. Since HC and CO emissions are mainly caused by incomplete combustion, this indicates that the engine efficiency of LW30 is lower than Z50. This was further indicated by the higher power-specific fuel consumption in LW30. Apparent differences also existed among the operation cycles. When compared to Cycle #1, Cycle #2 can reduce half of the NOx emission while maintaining almost the same loading quantity. In addition, shifting the operating patterns from Cycle #1 to Cycle #2 reduces fuel consumption by 7.2% for LW30 and 6.1% for Z50.

3.3. Working Modes of Dump Trucks

The task of the dump truck in the earthwork differs from the operation of the wheel loader. As HD construction vehicles, dump trucks are mainly used to transport building materials across long distances. As shown in Figure 3, the traveling routine of dump trucks in the urban area usually involves the construction terrain and city motor traffic. The major earthmoving task of the dump trucks is to haul materials from the construction site to the dumping site and return with an empty load. This round trip was recorded by the vehicle data acquisition system assisted by the PEMS and GPS. Instead of classifying the duty cycles by power efficiency, the operating data of dump trucks were categorized by the working modes during the earthmoving. The working modes associated with real-world driving scenarios are defined as follows:
Mode #1
The fully loaded truck drives from the construction site to the dump site on Road 1;
Mode #2
The empty truck drives from the dump site to the construction site on Road 2;
Mode #3
The truck moves on the construction site, but excluding the idle stations;
Mode #4
The truck works in the dump site, but excluding the idling;
Mode #5
All the idle stations in both sites include waiting in the queue and being loaded by a loader.
Table 4 shows the emission factors and fuel consumption quantified by the real-world measurement and in-lab engine test cycles. Since the dump truck in this study is certified according to on-road emission regulations and delivered construction material in the urban transportation system, the ESC and ETC test cycles from the on-road HD vehicles emission regulations were used in the engine tests for the steady-state and transient tests, respectively.
In contrast with the loaders, the variability of the emissions between the different work modes of the trucks was not significant. One reason is that the transient conditions of the trucks were not as dramatic as that of the wheel loaders. The change of engine state mainly occurred with acceleration or deceleration, and other factors such as the slope of the road or traffic stations only slightly affect the vehicle’s working conditions. Another reason is the advanced emission controlling technology used in on-road machinery. In comparison with nonroad machinery, the after-treatment systems installed on dump trucks vastly reduce the emission from the tailpipes below the regulated level to satisfy stricter on-road emission regulations. However, the highly effective after-treatment system also demands more energy supply, thereby increasing fuel consumption [32]. For example, the increase in fuel consumption and greenhouse gas emission can be observed in EQ345 dump trucks due to the upgraded emission certification.

4. Discrete-Event Simulation

In this section, a DES framework is developed to evaluate the total emissions and energy consumption of construction machinery in an earthwork project. By integrating the emission factors and energy consumption of different driving cycles into the operating cost functions of vehicle agents, the simulation was used to quantify the environmental impacts of each process during the earthwork activities. Furthermore, based on the DES framework, the task assignments of the earthwork were optimized to reduce the total amount of emitted pollutants and energy cost for more sustainable construction operations.

4.1. Earthwork Project and Simulation

As mentioned in the previous section, the earthwork project investigated in the field study was performed in the urban area of Yulin city, China. This earthwork project was one part of a municipal construction program for building local business districts. The earthmoving investigated was approximately 63,800 m3 of soil. The project deployed four wheel loaders (two Z50 and two LW30) and 14 dump trucks (eight EQ345 and six DFL180). The distances between the construction site and the dumping area (see Figure 3) were 9.73 km for the haul trip and 11.29 km for the return trip. The local government temporarily assigned these two roads for earthmoving. Hence, traffic interruptions were avoided, and the average travel time of these two trips amounted to roughly 14.5 min and 12 min, respectively. The construction period of this earthwork project was 11 working days with 12 h of operation per day.
The DES flowchart of the earthwork project is presented in Figure 8. The vehicle agents of the loaders and trucks were modeled as resources. The earthwork activities of these two types of HD construction vehicles were represented as tasks (e.g., loading, dumping, waiting, hauling, and returning), while the emission factors and energy consumption of different duty cycles were integrated into their corresponding vehicle agents as operating costs. Interactions between vehicle agents while performing activities/tasks were modeled as server queues. For example, during the loading operation, the truck agents must queue for loaders (in this case, the server) to fill its dump container (the earthwork activity). The DES framework used in this study was developed using the MATLAB and Simulink discrete-event simulation tool SimEvents [33]. The SimEvents earthmoving model (shown in Appendix B) contains the following modules:
  • Initialization module for the truck and loader fleets.
  • Earth loading module in the constructions site: empty trucks arrive and wait in the queue, while the loaders are the servers.
  • Earth dumping module in the dumping site: loaded trucks arrive and wait in the queue, while the two dumping positions are the servers.
  • Truck washing module in the construction site and dumping area: loaded trucks arrive and wait in the queue; one washing server is set in the module.
  • Truck driving module: working modes for different driving scenarios.
Figure 8. DES flowchart of the earthwork project.
Sustainability 14 05326 g008
The duration of tasks for construction vehicles within the DES framework was estimated using the field test data. The distribution of each activity in the duty cycles was configured using the MATLAB Statistics Toolbox. The time distributions of trucks and loaders from the field test are listed in Table 5. Note that the time distributions for Cycle #4 of the wheel loaders and Mode #5 of the dump trucks are not given for the DES model since these activities (e.g., waiting, position adjusting, idle) are dependent on other activities during the cooperation. Moreover, the waiting duration of Mode #3 for trucks depends on the loading operations of wheel loaders. Therefore, two types of time distributions are given for different loaders.

4.2. Quantification of Emissions and Fuel Consumption

The emissions and fuel use of the earthwork project can be estimated by integrating the emission factors and activity time distributions into the DES framework. Figure 9 compares the project’s time duration, number of duty cycles, and fuel consumption for one-day operation, which were estimated using the DES model with the measured data. These selected variables are commonly used as performance indices of earthmoving projects [20]. Overall, the DES model showed a good agreement with the real-world measurement. With less than 3% of errors of the selected variables in the simulation, the established DES model is capable of assessing the earthwork operations of construction equipment.
Table 6 depicts the overall emissions and fuel usage assessment using the DES framework coupled with the emission factors and fuel consumption in different duty cycles. The emission levels and fuel estimation of the individual construction vehicle agents are also listed. It can be seen that about 80 tons of fuel were used for earthwork activities, with 302 tons of greenhouse gases emitted into the urban atmosphere. Construction equipment with a higher engine power also had better emission and fuel performance. Moreover, the emissions and fuel consumption of trucks was lower than that of loaders. This confirms the power-specific emission factors shown in Table 3 and Table 4. Furthermore, due to the upgraded after-treatment system, the EQ345 truck had the lowest NOx emission among the selected construction equipment. The rest of the emitted pollutants of these equipment were proportional to their engine power ratings.

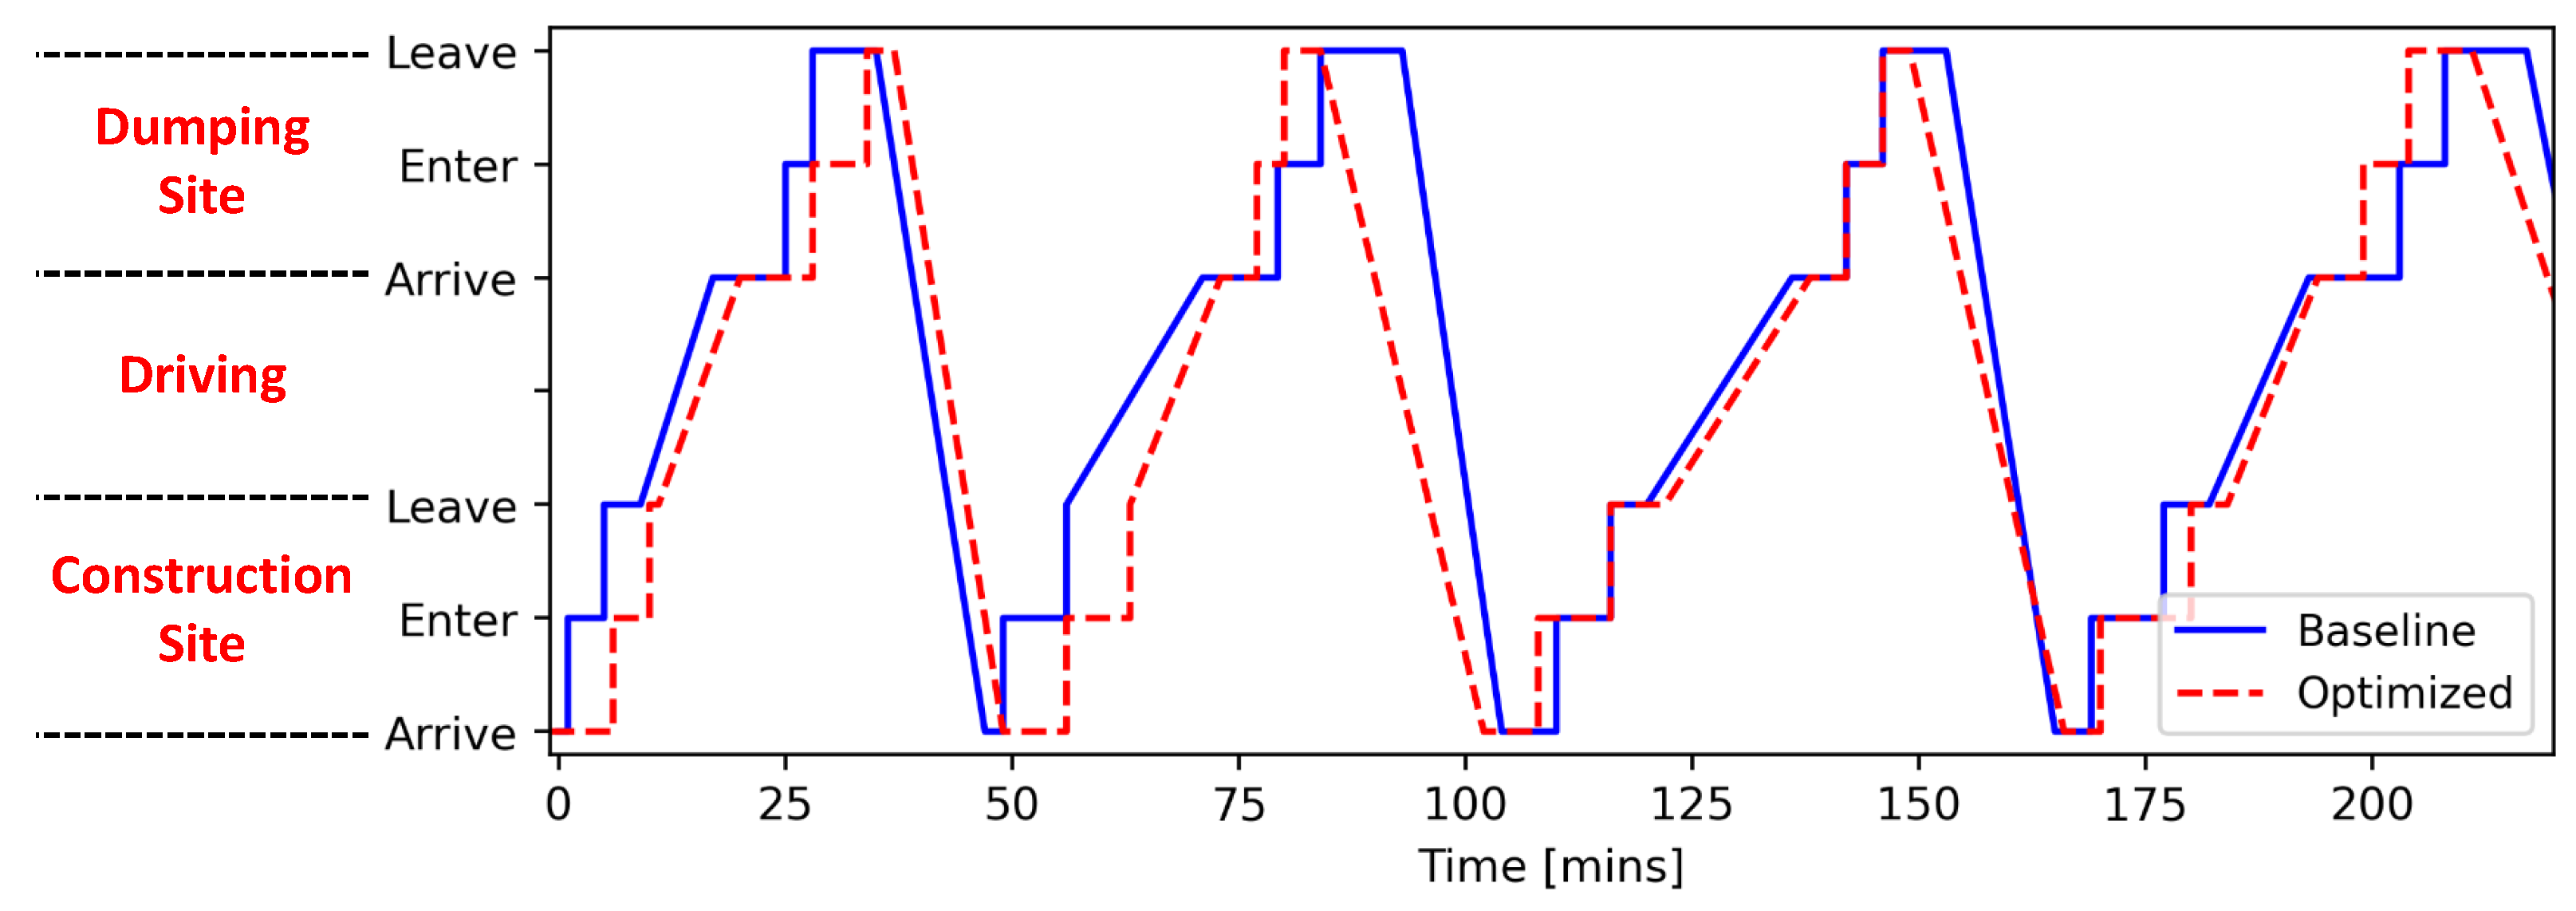
4.3. Optimized Equipment Fleet Schedule for Emission Reduction

Based on the validated DES framework, the equipment fleet schedule of the current earthwork project was optimized to reduce emissions and energy consumption. Without changing the behavior of the selected construction vehicles in the simulation, a genetic algorithm was used to search for an operation strategy for achieving a more sustainable earthmoving process. The algorithm adjusted the equipment fleet planning (i.e., the number of available trucks and loaders) to minimize the emissions and fuel consumption while maintaining the capacity and efficiency of the earthmoving operation. The optimization problem of this earthwork project is formulated in Appendix C. As a result, an optimized equipment fleet schedule for the construction vehicle assignment is given in Table 7. The most apparent change in this optimized schedule is to increase the number of EQ345 trucks to replace the DFL180 trucks.
Figure 10 depicts the timetable of one DFL180 truck, indicating the driving behavior of the truck during the earthmoving operation. The states of the truck in the construction site or dumping area are presented as “arrive”, “enter”, and “leave”. The length of the horizontal lines for each state represents the time duration of waiting or operating. For instance, the waiting time at “enter” the construction site denotes the time consumption of the loading processes. The comparison of the truck timetables shows that the waiting and operating time in the dumping site were reduced in the optimized case due to its reduced truck number. Nevertheless, the increased number of EQ345 trucks also slowed the loading operations, leading to longer queues at the construction site.
The optimized equipment fleet schedule increased the number of high-power equipment, especially for dump trucks. The relative changes in emissions and fuel consumption are summarized in Figure 11. Compared with the baseline case, the most significant improvement was the reduction of greenhouse gas emissions and fuel use by 8.1% and 6.6%. Moreover, due to the effective NOx emission control system of EQ354, the overall NOx emission also dropped by 3.1%. However, the optimized schedule also caused more CO and HC emissions. The main reason is that the long waiting time of trucks (i.e., Mode #5) at the construction site resulted in more CO and HC pollution. Although the optimized schedule could reduce most of the pollution produced, the total time consumption as a trade-off was extended 5.2%.

5. Discussion and Recommendations

The emissions and energy consumption of earthwork activities can be better captured by incorporating real-world measurements and the DES model. The combination of methods provides a novel approach to assessing the environmental performance of construction projects by observing the emissions and fuel cost in different operational patterns of the selected construction equipment. In contrast to the earlier construction pollution investigations that mainly monitored the air quality around the construction site [34,35], the approach in this study can support the development of sustainable construction processes by creating optimal working practices for all the equipment in use in the project. In general, the presented methodology shows the promise to be implemented by the construction industry for integrating data collection, optimization, and online control for a more environmentally friendly usage of HD equipment.
Nevertheless, the limitations and drawbacks in this study require further work. Firstly, as the weight and size of the PEMS were not suitable to be installed in the wheel loaders, in-lab experimental evaluation for the wheel loads was conducted to measure their emission values on the real-world operational parameters captured by the on-board acquisition system. This alternative approach caused a non-negligible energy waste, as well as the increase of the measurement errors inherent in the on-board acquisition system. With the development of emission monitoring systems and vehicle-to-infrastructure communications for construction applications [36], further work may be capable of omitting this procedure and directly measuring the tail-out emission from medium machinery without interfering with their performances. Furthermore, the DES framework did not include the cost of employing and maintaining the equipment in use due to the lack of relevant financial data. This drawback prevents the DES optimization from considering the relationship between earthmoving production rates and project costs.
Another issue addressed in this earthwork study was that the real-world emission measurements on the selected construction machinery exceeded the results from the in-lab test required by the respective emission certifications. Many previous studies [16,17,18] have also confirmed that the current in-lab emission test cycles (i.e., steady-state cycles or NRTC) could not fully represent the real-world operational conditions for HD construction machinery. The upgrade of the after-treatment systems can effectively reduce tail-out emissions. However, since most emission control strategies are developed and calibrated based on the in-lab test cycles, the inconsistency between test cycles in regulations and the actual working situations of construction equipment may lead to the emission control deviating from its optimal working mode. Therefore, as a pollution policy recommendation, it is desirable to create test cycles that capture construction equipment’s real-world working features and emission characteristics.

6. Conclusions

This study quantified the environmental performance of construction equipment in an earthwork project in China. Based on the PEMS and in-lab engine tests, the emissions and fuel use of two wheel loaders and two dump trucks were measured. Duty cycles were categorized based on power efficiency and working patterns. These were then used together with the measured emission and fuel use data to illustrate emission variations among different earthwork operations. Additionally, using the emission factors from real-world measurements, a DES framework was built to further analyze the emission and fuel consumption of the earthwork. Furthermore, the construction equipment fleet schedule was optimized to minimize the overall environmental impacts and energy usage:
  • There are significant differences between the real-world measured emissions and relevant legislative test cycle results. This indicates that the test duty cycles applied in emission certification cannot fully represent the real-world operating conditions of the construction equipment.
  • Compared to the high-load operating conditions, wheel loaders operating between 45% and 70% power efficiency can reduce half of their power-specific NOx emissions and around 6% of their fuel consumption. Moreover, the LW30 wheel loader with a smaller power rating is more likely to work in the high-load conditions.
  • In contrast to the loaders, the emission variability among different work modes of trucks are not significant. Although the upgraded emission control system reduced most pollutants of the EQ345 trucks, the after-treatment system also demands more energy supply, thereby increasing fuel consumption and CO2 emission.
  • The comparison of power-specific emission factors shows that the loaders’ emissions and fuel consumption were lower than that of the trucks. Moreover, the construction equipment with a higher engine power rating also had better emission and fuel performances.
  • Based on the validated DES, it can be found that about 80 tons of fuel were used for the earthwork activities in this project, with 302 tons of greenhouse gases emitted into the urban atmosphere.
  • Using a genetic algorithm, the equipment fleet planning was optimized to develop more sustainable earthwork operations. The optimized equipment fleet schedule increased the number of high-power equipment, especially for dump trucks. Compared with the baseline case, with a 5.2% increase in project time consumption, the most remarkable improvement was the reduction of greenhouse gas emissions and fuel use by 8.1% and 6.6%, respectively.

Author Contributions

Conceptualization, B.H. and L.L.; methodology, B.H.; software, B.H.; validation, B.H. and L.L.; formal analysis, B.H.; investigation, B.H.; resources, B.H. and L.L.; data curation, B.H. and L.L.; writing—original draft preparation, B.H.; writing—review and editing, B.H.; visualization, B.H. and L.L.; supervision, L.L.; project administration, L.L.; funding acquisition, L.L. All authors have read and agreed to the published version of the manuscript.

Funding

This research was funded by the School of Naval Architecture, Ocean and Energy Power Engineering, Wuhan University of Technology. The traveling of the first author for this research was supported by the Knut and Alice Wallenberg Foundation.

Institutional Review Board Statement

Not applicable.

Informed Consent Statement

Not applicable.

Data Availability Statement

Not applicable.

Acknowledgments

The authors would like to thank Shengkai Cai from Wuhan University of Technology China for his assistance with the field data collection and in-lab engine experiments. The kind support from technicians during the engine tests at Yuchai Advanced Technology Research Institute China is greatly acknowledged. The first author would also like to thank David Leffler from the KTH Royal Institute of Technology Sweden for his proofreading and instructive advice. The discussion with Xiaoliang Ma at the early stage of this study is also appreciated.

Conflicts of Interest

The authors declare no conflict of interest.

Abbreviations

HDHeavy-duty
NOxNitrogen oxides
HCHydrocarbon
COCarbon monoxide
PMParticulate matter
EPAEnvironmental Protection Agency
OBDOn-board diagnostics
GPSGlobal positioning system
FPGAField-programmable gate array
CANController area network
PEMSPortable emissions measurement system
rpmRevolutions per minute
DESDiscrete-event simulation
SCRSelective catalytic reduction
EGRExhaust gas recirculation
ECUEngine control unit
CRCommon-rail system
NRTCNonroad transient cycle
ESCEuropean stationary cycle
ETCEuropean transient cycle
SSSteady-state
RWReal-world

Appendix A. Emission Standards Referred to in This Study

The Chinese national nonroad Stage III emission standard (GB20891-2014) [6] was implemented in October 2015 for diesel nonroad equipment. The steady-state test cycle of China Stage III was established based on the ISO 8178 cycle in EU Stage IIIA [5]. Moreover, the Nonroad Transient Cycle (NRTC) used in this study as the transient cycle for nonroad machinery is from Chinese national nonroad Stage IV [29], which will be phased in in November 2022. The limits for the exhaust pollutants of the employed wheel loaders are listed as follows.
Table A1. Limits for exhaust pollutants of employed wheel loaders.
Emission StandardEngine Power (kW)NOx + HC (g/kWh)CO (g/kWh)PM (g/kWh)
Nonroad Stage III130 ≤ P ≤ 5604.03.50.2
75 ≤ P ≤ 1304.05.00.3
The Chinese national on-road Stage IV and V emission standards (GB 17691-2005) [7] for HD diesel engines were implemented in 2010 and 2016, respectively. The stationary test cycle in these standards is the European Stationary Cycle (ESC), while the transient test cycle is the European Transient Cycle (ETC) for on-road HD diesel-fueled vehicles. The limits for the exhaust pollutants of the employed dump trucks are listed as follows.
Table A2. Limits for exhaust pollutants of employed dump trucks.
Emission StandardTest CycleNOx (g/kWh)HC (g/kWh)CO (g/kWh)PM (g/kWh)
Stage IVESC3.50.461.50.02
ETC3.5-4.00.03
Stage VESC2.00.461.50.02
ETC2.0-4.00.03

Appendix B. Illustration of SimEvents Model

The DES framework for the earthwork project in the study was developed using the MATLAB and Simulink discrete-event simulation tool SimEvents [33]. The SimEvents earthmoving model structure is shown in Figure A1.
Figure A1. The SimEvents model for the earthwork project.
Sustainability 14 05326 g0a1

Appendix C. Optimization Based on SimEvents Model

The optimization problem for the earthwork project in the DES framework is formulated as follows:
min j j resource ( i emissions E i , j E i , j b + F j F j b ) + T T b s . t . j W j W ¯ T T ¯
where E, F, and T are the objective function denote emissions, fuel consumption, and total time for earthmoving. The superscript b denotes the results from the baseline case, which are listed in Table 6. i represents the emission compositions (e.g., NOx, HC, CO, or CO2), while j is the available construction equipment resources (i.e., wheel loaders and dump trucks) used in the project. W in the constraints refers to the total number of wheel loaders. Due to the space limitation in the construction site for the loading operation, the number of wheel loaders had an upper bound W ¯ . Similarly, the project time for earthmoving was also limited by T ¯ . These values were set as W ¯ = 6 and T ¯ = 14 days.
This multi-objective optimization problem included the emission levels, energy consumption, and project productivity. For each iteration, the values of E, F, and T were calculated in the DES framework. The real-world result of the current project as the baseline normalized these factors. The variable j for optimization is defined as the available wheel loaders and dump trucks used in the project.

References

  1. Lewis, P.; Rasdorf, W.; Frey, H.C.; Pang, S.H.; Kim, K. Requirements and incentives for reducing construction vehicle emissions and comparison of nonroad diesel engine emissions data sources. J. Constr. Eng. Manag. 2009, 135, 341–351. [Google Scholar] [CrossRef]
  2. Chen, C.; Zhu, Z.; Hammad, A. Critical Review and Road Map of Automated Methods for Earthmoving Equipment Productivity Monitoring. J. Comput. Civ. Eng. 2022, 36, 03122001. [Google Scholar] [CrossRef]
  3. Beltrami, D.; Iora, P.; Tribioli, L.; Uberti, S. Electrification of Compact Off-Highway Vehicles—Overview of the Current State of the Art and Trends. Energies 2021, 14, 5565. [Google Scholar] [CrossRef]
  4. Frey, H.C.; Rasdorf, W.; Lewis, P. Comprehensive Field Study of Fuel Use and Emissions of Nonroad Diesel Construction Equipment. Transp. Res. Rec. 2010, 2158, 69–76. [Google Scholar] [CrossRef]
  5. European Commission. Proposal for a Regulation of the European Parliament and of the Council on Requirements Relating to Emission Limits and Type-Approval for Internal Combustion Engines for Nonroad Mobile Machinery; European Commission: Brussels, Belgium, 2014. [Google Scholar]
  6. Ministry of Ecology and Environment of China. Limits and Measurement Methods for Exhaust Pollutants from Diesel Engines of Nonroad Mobile Machinery (III, IV); Ministry of Ecology and Environment: Beijing, China, 2014. [Google Scholar]
  7. Ministry of Ecology and Environment of China. Limits and Measurement Methods for Exhaust Pollutants from Compression Ignition and Gas Fuelled Positive Ignition Engines of Vehicles (II, IV, V); Ministry of Ecology and Environment: Beijing, China, 2007. [Google Scholar]
  8. Tu, R.; Li, T.; Meng, C.; Chen, J.; Sheng, Z.; Xie, Y.; Xie, F.; Yang, F.; Chen, H.; Li, Y.; et al. Real-world emissions of construction mobile machines and comparison to a nonroad emission model. Sci. Total Environ. 2021, 771, 145365. [Google Scholar] [CrossRef]
  9. Giakoumis, E.G. Driving and Engine Cycles; Springer: Berlin/Heidelberg, Germany, 2017; Volume 1. [Google Scholar]
  10. Sepasgozar, S.M.E.; Blair, J. Measuring nonroad diesel emissions in the construction industry: A synopsis of the literature. Int. J. Constr. Manag. 2021, 21, 582–597. [Google Scholar] [CrossRef]
  11. Ullman, T.L.; Webb, C.C.; Jackson, C.C.; Doorlag, M.H. Nonroad Engine Activity Analysis and Transient Cycle Generation. SAE Trans. 1999, 108, 176–186. [Google Scholar]
  12. Samulski, M.J.; Jackson, C.C. Effects of Steady-State and Transient Operation on Exhaust Emissions from Nonroad and Highway Diesel Engines. SAE Trans. 1998, 107, 2068–2080. [Google Scholar]
  13. Desouza, C.; Marsh, D.; Beevers, S.; Molden, N.; Green, D. Real-world emissions from nonroad mobile machinery in London. Atmos. Environ. 2020, 223, 117301. [Google Scholar] [CrossRef]
  14. Heidari, B.; Marr, L.C. Real-time emissions from construction equipment compared with model predictions. J. Air Waste Manag. Assoc. 2015, 65, 115–125. [Google Scholar] [CrossRef] [Green Version]
  15. Wang, X.; Chow, J.C.; Kohl, S.D.; Percy, K.E.; Legge, A.H.; Watson, J.G. Real-world emission factors for Caterpillar 797B heavy haulers during mining operations. Particuology 2016, 28, 22–30. [Google Scholar] [CrossRef]
  16. Wang, F.; Li, Z.; Zhang, K.; Di, B.; Hu, B. An overview of nonroad equipment emissions in China. Atmos. Environ. 2016, 132, 283–289. [Google Scholar] [CrossRef]
  17. Bie, P.; Ji, L.; Cui, H.; Li, G.; Liu, S.; Yuan, Y.; He, K.; Liu, H. A review and evaluation of nonroad diesel mobile machinery emission control in China. J. Environ. Sci. 2022. [Google Scholar] [CrossRef]
  18. Tan, D.; Tan, J.; Peng, D.; Fu, M.; Zhang, H.; Yin, H.; Ding, Y. Study on real-world power-based emission factors from typical construction machinery. Sci. Total. Environ. 2021, 799, 149436. [Google Scholar] [CrossRef]
  19. AbouRizk, S. Role of Simulation in Construction Engineering and Management. J. Constr. Eng. Manag. 2010, 136, 1140–1153. [Google Scholar] [CrossRef]
  20. Jabri, A.; Zayed, T. Agent-based modeling and simulation of earthmoving operations. Autom. Constr. 2017, 81, 210–223. [Google Scholar] [CrossRef] [Green Version]
  21. González, V.; Echaveguren, T. Exploring the environmental modeling of road construction operations using discrete-event simulation. Autom. Constr. 2012, 24, 100–110. [Google Scholar] [CrossRef]
  22. Liu, B.; Yang, B.; Xiao, J.; Zhu, D.; Zhang, B.; Wang, Z.; Dong, M. Review of Optimization Dynamically Applied in the Construction and the Application Potential of ICT. Sustainability 2021, 13, 5478. [Google Scholar] [CrossRef]
  23. Ahn, C.R.; Lee, S. Importance of Operational Efficiency to Achieve Energy Efficiency and Exhaust Emission Reduction of Construction Operations. J. Constr. Eng. Manag. 2013, 139, 404–413. [Google Scholar] [CrossRef]
  24. Ozcan-Deniz, G.; Zhu, Y. Multi-objective optimization of greenhouse gas emissions in highway construction projects. Sustain. Cities Soc. 2017, 28, 162–171. [Google Scholar] [CrossRef] [Green Version]
  25. Gwak, H.S.; Seo, J.; Lee, D.E. Optimal cut-fill pairing and sequencing method in earthwork operation. Autom. Constr. 2018, 87, 60–73. [Google Scholar] [CrossRef]
  26. Zhang, H. Discrete-Event Simulation for Estimating Emissions from Construction Processes. J. Manag. Eng. 2015, 31, 04014034. [Google Scholar] [CrossRef]
  27. Lewis, P.; Frey, H.C.; Rasdorf, W. Development and Use of Emissions Inventories for Construction Vehicles. Transp. Res. Rec. 2009, 2123, 46–53. [Google Scholar] [CrossRef]
  28. U.S. Environmental Protection Agency. User’s Guide for the Final NONROAD 2005 Model EPA420-R-05-013; Environmental Protection Agency: Washington, DC, USA, 2014. [Google Scholar]
  29. Ministry of Ecology and Environment of China. Revision on Limits and Measurement Methods for Exhaust Pollutants from Diesel Engines of Nonroad Mobile Machinery (III, IV); Ministry of Ecology and Environment: Beijing, China, 2020. [Google Scholar]
  30. Hong, B.; Ma, X. Path planning for wheel loaders: A discrete optimization approach. In Proceedings of the 2017 IEEE 20th International Conference on Intelligent Transportation Systems (ITSC), Yokohama, Japan, 16–19 October 2017; pp. 1–6. [Google Scholar] [CrossRef]
  31. Hong, B.; Ma, X. Path optimization for a wheel loader considering construction site terrain. In Proceedings of the 2018 IEEE Intelligent Vehicles Symposium (IV), Changshu, China, 26–30 June 2018; pp. 2098–2103. [Google Scholar] [CrossRef]
  32. Heywood, J.B. Internal Combustion Engine Fundamentals; McGraw-Hill Series in Mechanical Engineering; McGraw-Hill Education: New York, NY, USA, 1989. [Google Scholar]
  33. MathWorks. SimEvents Toolbox: User’s Guide(R2020a), MathWorks: Natick, MA, USA, 2020.
  34. Faber, P.; Drewnick, F.; Borrmann, S. Aerosol particle and trace gas emissions from earthworks, road construction, and asphalt paving in Germany: Emission factors and influence on local air quality. Atmos. Environ. 2015, 122, 662–671. [Google Scholar] [CrossRef]
  35. Luo, Q.; Huang, L.; Xue, X.; Chen, Z.; Zhou, F.; Wei, L.; Hua, J. Occupational health risk assessment based on dust exposure during earthwork construction. J. Build. Eng. 2021, 44, 103186. [Google Scholar] [CrossRef]
  36. Mendoza, J.; de-la Bandera, I.; Álvarez Merino, C.S.; Khatib, E.J.; Alonso, J.; Casalderrey-Díaz, S.; Barco, R. 5G for Construction: Use Cases and Solutions. Electronics 2021, 10, 1713. [Google Scholar] [CrossRef]
Figure 1. Chart flow of experiments’ schedule and data collection.
Sustainability 14 05326 g001
Figure 2. PEMS installed in dump trucks. The left is the gas analyzer units for measuring pollutants in the diluted exhaust; the right shows the sampling probes on the tailpipe with an exhaust mass flow meter.
Sustainability 14 05326 g002
Figure 3. Hauling-and-returning routes (blue lines) of dump trucks for earthmoving. The Chinese letters on the map refer to the names of local places.
Sustainability 14 05326 g003
Figure 4. The vehicle data acquisition system and engine accessory sensors used in wheel loaders.
Sustainability 14 05326 g004
Figure 5. In-lab test: the test bench control platform (left) and the engine measurement system (right).
Sustainability 14 05326 g005
Figure 6. Schematic of an operational cycle of a wheel loader. The curved arrows are the trajectory for a wheel loader to complete a loading task.
Sustainability 14 05326 g006
Figure 7. Percentages of event distributions of operational cycles during the earthwork. Numbers above bars count the event cases of the corresponding operational cycles.
Sustainability 14 05326 g007
Figure 9. DES model validations against the real-world measurement. Error bars above DES bars represent the variation among simulation results.
Sustainability 14 05326 g009
Figure 10. Timetable for 3.5 h of one DFL180 truck before and after the optimization.
Sustainability 14 05326 g010
Figure 11. Relative changes in terms of emissions and fuel consumption.
Sustainability 14 05326 g011
Table 1. Main parameters of the earthwork equipment.
Type: Wheel LoaderLW30Z50
Operation Weight (kg)10,60016,600
Bucket Capacity (m3)1.84.5
Rated Load (kg)32005000
Max. Breakout Force (kN)100190
Engine Rated Power92 kW @2300 rpm162 kW @2000 rpm
Fuel TypeDieselDiesel
Emission Control DevicesCR, EGRCR, SCR
Emission StandardNonroad Stage IIINonroad Stage III
Type: Dump TruckDFL180EQ345
Curb Weight (kg)12,00022,000
Dump Container Size (cm)540 × 250 × 120835 × 250 × 125
Rated Load (kg)25,00040,000
Max. Speed (km/h)8590
Engine Rated Power228 kW @2200 rpm385 KW @2500 rpm
Fuel TypeDieselBiodiesel & Diesel
Emission Control DevicesCR, SCRCR, SCR, DPF
Emission StandardStage IVStage V
Table 2. Operational cycles based on power efficiency.
Operational CyclesPower EfficiencyOperating Characteristics
Cycle #1 η P 70 % Full load, fast moving and loading, extreme conditions.
Cycle #2 45 % < η P 70 % Full load, normal moving and loading speed.
Cycle #3 20 % < η P 45 % Half or less load, trivial and small work.
Cycle #4 η P 20 % Idle or other low efficiency movement.
Table 3. Emission factors and fuel consumption of wheel loaders in operational cycles.
LW30K Wheel Loader
NOxHCCOCO2Fuel
g/kWhg/hg/kWhg/hg/kWhg/hg/kWhkg/hg/kWhkg/h
SS a3.73-0.22-0.95-769.99-261.81-
NRTC3.97-0.31-1.64-802.17-287.45-
RW b5.56306.90.2111.61.0859.6845.1246.7301.5616.6
Cycle #1 c4.64320.20.2013.81.2485.6864.1459.6279.6719.3
Cycle #24.28216.60.2412.10.9447.6781.9739.6306.4315.5
Cycle #33.5397.40.236.30.8423.2846.2423.4234.196.5
Cycle #48.67123.10.192.71.4612.8649.479.2196.572.8
Z50 Wheel Loader
NOxHCCOCO2Fuel
g/kWhg/hg/kWhg/hg/kWhg/hg/kWhkg/hg/kWhkg/h
SS a3.9-0.15-1.23-780.17-263.55-
NRTC4.07-0.27-1.84-813.42-277.45-
RW b4.34421.80.3231.11.73168.2821.5179.9262.5425.5
Cycle #1 c5.37652.50.3745.01.92233.3792.1796.2246.2129.9
Cycle #23.93318.30.3125.11.67135.3821.0666.5276.4222.4
Cycle #33.01195.00.2918.81.59103.0783.7850.8221.3614.3
Cycle #410.31334.00.206.52.3343.1402.3413.0174.145.6
Note: a Steady-state test using ISO-8178 test cycle for nonroad machines. b Emission and fuel data were measured in engine tests driven by the operation data recorded from real-world loading processes. c Emission and fuel data from the operational cycles were categorized using the power efficiency of the employed loaders.
Table 4. Emission factors and fuel consumption of dump trucks in working modes.
DFL180 Dump Truck
NOxHCCOCO2Fuel
g/kWhg/hg/kWhg/hg/kWhg/hg/kWhkg/hg/kWhkg/h
ESC a2.7-0.22-1.69-646.79-201.34-
ETC b3.39-0.24-1.65-702.61-209.54-
RW c3.74502.70.2736.31.98266.1754.3199.4200.1126.9
Mode #1 d3.07490.40.2844.71.87298.7784.49129.6199.1931.8
Mode #23.58546.30.2944.32.18332.6752.49103.0194.7429.7
Mode #33.78447.50.3339.12.30272.3824.9281.4215.2625.5
Mode #44.19478.60.2427.42.56292.4745.9768.2209.724.0
Mode #55.0977.60.446.73.7141.2737.128.7229.73.5
EQ345 Dump Truck
NOxHCCOCO2Fuel
g/kWhg/hg/kWhg/hg/kWhg/hg/kWhkg/hg/kWhkg/h
ESC a1.95-0.32-1.94-592.94-213.57-
ETC b2.01-0.41-1.26-603.09-224.85-
RW c2.18389.90.2950.81.95341.8616.41166.2229.4640.2
Mode #1 d2.25403.30.2137.61.45259.5613.19158.8204.2136.5
Mode #22.15411.00.3159.31.08206.6734.41201.2199.0938.1
Mode #31.85385.90.59123.21.86388.4609.72173.6229.1447.8
Mode #42.23392.50.61107.61.82320.9668.37189.3212.3237.4
Mode #52.7964.20.8720.12.3153.3596.658.6228.323.2
Note: a European Stationary Cycle for emission certification of heavy-duty diesel engines. b European Transient Cycle for emission certification of heavy-duty diesel engines. c Emissions and fuel consumption from real-world measurement of the employed trucks during earthmoving. d Emissions and fuel consumption of the working modes are extracted from the real-world data.
Table 5. Time distributions of activities for trucks and loaders used in the DES framework. The unit of time is seconds for wheel loaders and minutes for dump trucks.
EquipmentDuty CyclesTime Distributions
LW30 wheel loaderCycle #1Normal (47.7, 4.3)
Cycle #2Normal (61.1, 3.2)
Cycle #3Lognormal (2.92, 0.81)
Cycle #4
Z50 wheel loaderCycle #1Normal (45.7, 4.3)
Cycle #2Normal (59.3, 4.2)
Cycle #3Lognormal (2.46, 0.92)
Cycle #4
DFL180 dump truckHauling (Mode #1)Uniform (13.14, 16.83)
Returning (Mode #2)Uniform (10.75, 12.57)
Loading (Mode #3)Normal (6.19, 2.27) for LW30
Normal (4.75, 1.31) for Z50
Dumping (Mode #4)Normal (4.19, 0.71)
Waiting or Idle (Mode #5)
EQ345 dump truckHauling (Mode #1)Uniform (14.85, 19.67)
Returning (Mode #2)Uniform (13.46, 15.71)
Loading (Mode #3)Normal (8.37, 1.89) for LW30
Normal (7.64, 1.63) for Z50
Dumping (Mode #4)Normal (4.74, 0.82)
Waiting or Idle (Mode #5)
Table 6. Total emissions and fuel consumption during the earthwork.
LW30Z50DFL180EQ345Total
NOx (kg)43.3059.5270.9355.011071.34
HC (kg)1.644.395.127.17100.12
CO (kg)8.4123.7337.5548.23675.39
CO2 (ton)6.5911.2713.2623.42302.69
Fuel (ton)2.343.603.805.6780.03
Table 7. Equipment fleet schedule for the earthwork project.
LW30Z50DFL180EQ345
Baseline2286
Optimized1339
Publisher’s Note: MDPI stays neutral with regard to jurisdictional claims in published maps and institutional affiliations.

