
Differences in Fitness between Firefighter Trainee Academy Classes and Normative Percentile Rankings
by
 , ,
, ,
Robert George Lockie
1,* ,
,
Robin M. Orr
2 ,
,
Fernando Montes
3, 
Tomas Jason Ruvalcaba
1 and
J. Jay Dawes
4
1
Department of Kinesiology, California State University, Fullerton, Fullerton, CA 92831, USA
2
Tactical Research Unit, Bond University, Robina, QLD 4226, Australia
3
Los Angeles County Fire Department, Los Angeles, CA 90063, USA
4
School of Kinesiology, Applied Health and Recreation, Oklahoma State University, Stillwater, OK 74078, USA
*
Author to whom correspondence should be addressed.
Sustainability 2022, 14(11), 6548; https://doi.org/10.3390/su14116548
Submission received: 1 April 2022
/
Revised: 17 May 2022
/
Accepted: 25 May 2022
/
Published: 27 May 2022
(This article belongs to the Special Issue Physical Activity and Behavior: Training and Education Models for Sustainable Health and Performance)
Abstract
:Fire academy training classes may have trainees with a range of different fitness capabilities. Documentation of trainee fitness could indicate the need for flexibility in physical training emphases. Therefore, data from six academy classes (males = 274; females = 31) were analyzed, including: Illinois agility test (IAT), push-ups, pull-ups, leg tucks, multistage fitness test, backwards overhead 4.54 kg medicine ball throw (BOMBT), 10-repetition maximum deadlift, and 18 kg kettlebell farmers carry. A one-way ANOVA, with the Bonferroni post hoc test, calculated between-class fitness differences. Normative fitness test data were produced via percentile ranks. Classes 5 and 6 had the most females (n = 15). Class 1 completed the IAT faster than all classes (p ≤ 0.009). Classes 1 and 4 had a further BOMBT distance than Classes 5 and 6, and Class 3 outperformed Class 6 (p ≤ 0.044). Class 4 completed more leg tucks than Class 5 (p = 0.047). Class 1 had a greater deadlift than Classes 3, 4, and 6, and Class 2 outperformed Classes 3–6 (p ≤ 0.036). Class 3 was slower in the farmers carry compared to all classes (p ≤ 0.002). Percentile rankings showed that most females (48–100%) were in the 0–29% rank. Staff should implement individualized programs where appropriate for trainees as cohort fitness differences exist. Female trainees may need targeted maximal strength and power development.
1. Introduction
The tasks required during firefighting can be very physically demanding. Some of the critical job tasks that need to be completed by firefighters include driving vehicles, carrying equipment, raising ladders, climbing stairs, operating hose lines, forcible entries, crawling and searching, and victim drags [1,2,3,4,5,6]. What will exacerbate the demands of these tasks for the firefighter is the environment that they are often performed in. Austere environments (relative to factors such as temperatures over 570 °C and toxic smoke) and the requirement to wear and carry heavy and restrictive personal protective equipment and self-contained breathing apparatus (which can be upwards of 20 kg) makes typical firefighting tasks even more difficult [7,8,9]. As a result, it is essential for firefighters to have the physical capacity and skills necessary to perform their job tasks effectively in the field to ensure their safety, the safety of their colleagues, and the general population.
Trainees will typically complete fire academy training so they can learn the skills and procedures required for the profession [10,11]. Before being accepted to a fire academy, trainees must complete the Candidate Physical Ability Test (CPAT). The CPAT is a nationally recognized test in the USA that simulates firefighting job tasks (stair climb, hose drag, equipment carry, ladder raise and extension, forcible entry, search, rescue drag, and ceiling breach and pull) and measures a candidate’s ability to perform the demanding tasks of the profession [12]. The tasks are completed in succession about a course, and the candidate must finish within 10 min and 20 s. Due to the need to complete the CPAT prior to academy enrollment, most trainees should have some level of physical fitness. This is because qualities such as anaerobic capacity [3], maximal strength [2,9], and aerobic capacity [1,3] all contribute to successful completion of the CPAT. Accordingly, an important component of fire academies is physical training. The general goal of physical training is to develop the underlying fitness qualities that could ultimately benefit job task performance [11]. Additionally, improvements in fitness could also reduce the risk of injury for firefighter trainees [13,14]. The challenge for practitioners is designing appropriate fitness training programs that enhance the fitness of most trainees within a class, especially considering the likelihood of physical diversity within a cohort.
Indeed, even though trainees must complete the CPAT prior to being hired and trained by a fire department, they are still being recruited from the general population. Fitness can vary greatly for both men and women in the general population [15,16], and this is also likely true within specific populations such as firefighter trainees. To provide some examples, previous research in law enforcement has shown that there can be a wide range of fitness capabilities among recruit classes [17,18]. Specifically, Lockie et al. [17] compared 11 recruit classes from 1 law enforcement agency. One training class completed significantly fewer sit-ups than six of the other classes (p ≤ 0.033) and were slower in the 201 m and 2.4 km runs than five of the other classes (p ≤ 0.005). In custody assistant recruits, estimated maximal aerobic capacity (O2max) derived from the 2.4 km run across three classes ranged from 15.84 milliliters per kg body mass per minute (mL·kg−1·min−1) to 55.81 mL·kg−1·min−1 [18]. Relative to general population norms [15], the estimated maximal aerobic capacity for the custody assistant recruits ranged from very poor to good/excellent. It should be noted that firefighter and law enforcement populations may demonstrate significant differences in body composition (e.g., male police officers having greater body fat than male firefighters) and fitness (e.g., female firefighters having greater upper-body strength than female police officers) [19]. Accordingly, firefighter trainees should be specifically analyzed. However, no known research details the potential differences in fitness across different fire academy classes within a given department. These potential differences are important information to document, as they may reveal the need for flexibility in physical training emphasis among different fire academy classes. The results of this work may also inform those trained professionals (e.g., strength and conditioning coaches) who work with firefighter trainees and develop programs for their challenging environments (i.e., large classes with trainees with different abilities).
What could also aid in the design of firefighter physical training programs is the provision of established standards for high- and low-performers [17]. Established standards would provide context for establishing strengths and areas for improvement in firefighter trainees, and this information could be used in building physical training programs. Percentile ranking data for different fitness measures (e.g., push-ups, sit-ups, mountain climbers, pull-ups, 201 m run, and 2.4 km run) have been provided for law enforcement recruits [17], in addition to incumbent law enforcement officers [20,21]. However, normative percentile ranking data have not been presented for firefighter trainees at the start of academy. This type of information could be especially useful for trainees that may be lacking in certain fitness qualities (e.g., females tend to have lesser strength and power compared to males) [3], and the degree of improvement that should be targeted for a trainee. In addition, this information allows for a comparison between normative population values, other tactical (e.g., law enforcement) populations, and future firefighter populations. This has implications for the sustainable health, fitness, and performance of firefighters.
Therefore, the first objective of this study was to document the differences in physical fitness between distinct academy training cohorts from one fire department. This objective is important as it will document how fitness could vary between different academy classes, and what fitness qualities may need to be developed by fire academy training staff. The second objective of this study was to establish normative data via percentile rankings for firefighter trainees relative to the fitness tests used in this study. This objective is important as it will provide comparative fitness data for firefighter trainees from different academies and departments. This study was modeled off previous work by Lockie et al. [17] conducted on law enforcement recruits. The current research will provide specific analysis on firefighter trainees which was not provided by Lockie et al. [17], and this is needed due to the potential differences with law enforcement recruits [19]. Given the need for firefighters to demonstrate an array of different physical abilities when in the field [1,2,3,4,5,6], the fitness testing battery featured a range of assessments that were administered by the fire department training staff. The fire department analyzed in this study is large (more than 4500 personnel) and responsible for protecting the lives and property of 4.1 million residents living in 1.25 million housing units in 59 cities and the unincorporated areas of the county [22]. Accordingly, the firefighter trainee data should be a good representation of the population. The hypotheses for the study were obtained following considerations detailed by Lockie et al. [17]. Previous research has shown high variability between fitness assessment results in tactical personnel [17,23,24], with a greater tendency for female personnel to be in the lower fitness test percentiles [17,18,20,25]. Accordingly, the hypothesis in this study was modeled to reflect an a priori approach [17,26]. The first hypothesis for this study was that there would be significant differences in the fitness tests between the classes (e.g., there would be some classes that had superior muscular endurance measured by push-ups/some classes would have better estimated O2max). With regards to the percentile rank data, it was further hypothesized that female trainees would be in the lower percentile ranks.
2. Materials and Methods
2.1. Subjects
De-identified data from six academy classes from one fire department were released to the researchers for this retrospective study. This was a sample of convenience that included 305 trainees, incorporating 274 males and 31 females. Although the female sample size in this study was small, both sexes were identified as many fire departments in the USA are attempting to recruit and retain more women [27]. Thus, it is important to provide details about women who are training to become firefighters. Demographic information (age, height, and body mass) was not provided by the fire department to the researchers, which has occurred in previous research analyzing first responders [21,28,29,30]. Nevertheless, all trainees were above 18 years of age, and had completed a pre-placement medical evaluation [31]. Additionally, it could be expected that the trainees in this study would be similar to those from other US-based fire departments previously detailed in the literature [10,32,33]. All training cohorts started and finished their academy during 2020 in southern California, and all data were collected during this year. All available data were included in the study. Similar to previous research analyzing retrospective data, the exclusion criterion was datasets with clearly incorrectly entered data [21]. As secondary data were utilized in this study, G*Power software (v3.1.9.2, Universität Kiel, Germany) was used to confirm post hoc that the sample size of 305 (with groups of 31 and 29 participants) was sufficient for a one-way analysis of variance (ANOVA) with six groups such that data could be interpreted with a small effect level of 0.24 [34], and a power level of 0.91 when significance was set at 0.05 [35]. Based on the archival nature of this study, the institutional ethics committee approved the use of pre-existing data (HSR-17-18-401). The study conformed to the recommendations of the Declaration of Helsinki [36].
2.2. Procedures
A retrospective analysis of archived data for trainees belonging to six academy classes from one fire department was conducted. The first part of the analysis involved investigating the different cohorts of trainees, with a one-way ANOVA used to compare each class [17]. The second part of the analysis involved calculating firefighter trainee-specific normative data via percentile rankings for the fitness tests conducted by the training staff [17,20,25]. Data were pooled across the academy classes to produce the percentile ranks, and the number of male and female trainees within each percentile rank was detailed. The dependent variables for this study were: Illinois agility test (IAT) time, metronome push-up repetitions, leg-tuck repetitions, estimated O2max from the 20 m multistage fitness test (MSFT), backwards overhead medicine ball throw (BOMBT) distance, 10-repetition maximum (10RM) deadlift, and farmers carry time with 18 kg kettlebells over a 91.44 m (100 yards) course.
The fitness tests were completed by trainees as part of their employment requirements and were conducted within one 90-min physical training session for all academy classes. Testing was conducted at the start of the 16-week academy period at the training center located within the fire department’s headquarters. The session was overseen by a certified strength and conditioning specialist. The researchers did not have input into the fitness tests that were used as the study used archival data. Nonetheless, the fitness test battery was designed to encompass a range of assessments for different fitness qualities. In line with this, department training staff typically used the data to identify areas in need of improvement within the trainees. This approach of using fitness test data to inform fitness programming is recommended within the practice of strength and conditioning [37]. Further, this helps to illustrate why the general fitness tests were utilized within this fire department. The tests were completed in the order presented, which was standard practice for the department. Enough time was provided between test attempts to ensure adequate recovery. Testing occurred outdoors at the fire department’s training facility in the early morning (~6:00 a.m.). Internally, the fire department assigned scores relative to the performance in each of the fitness tests (60–100 points for each test). However, these scores were not included in this study.
2.3. Illinois Agility Test (IAT)
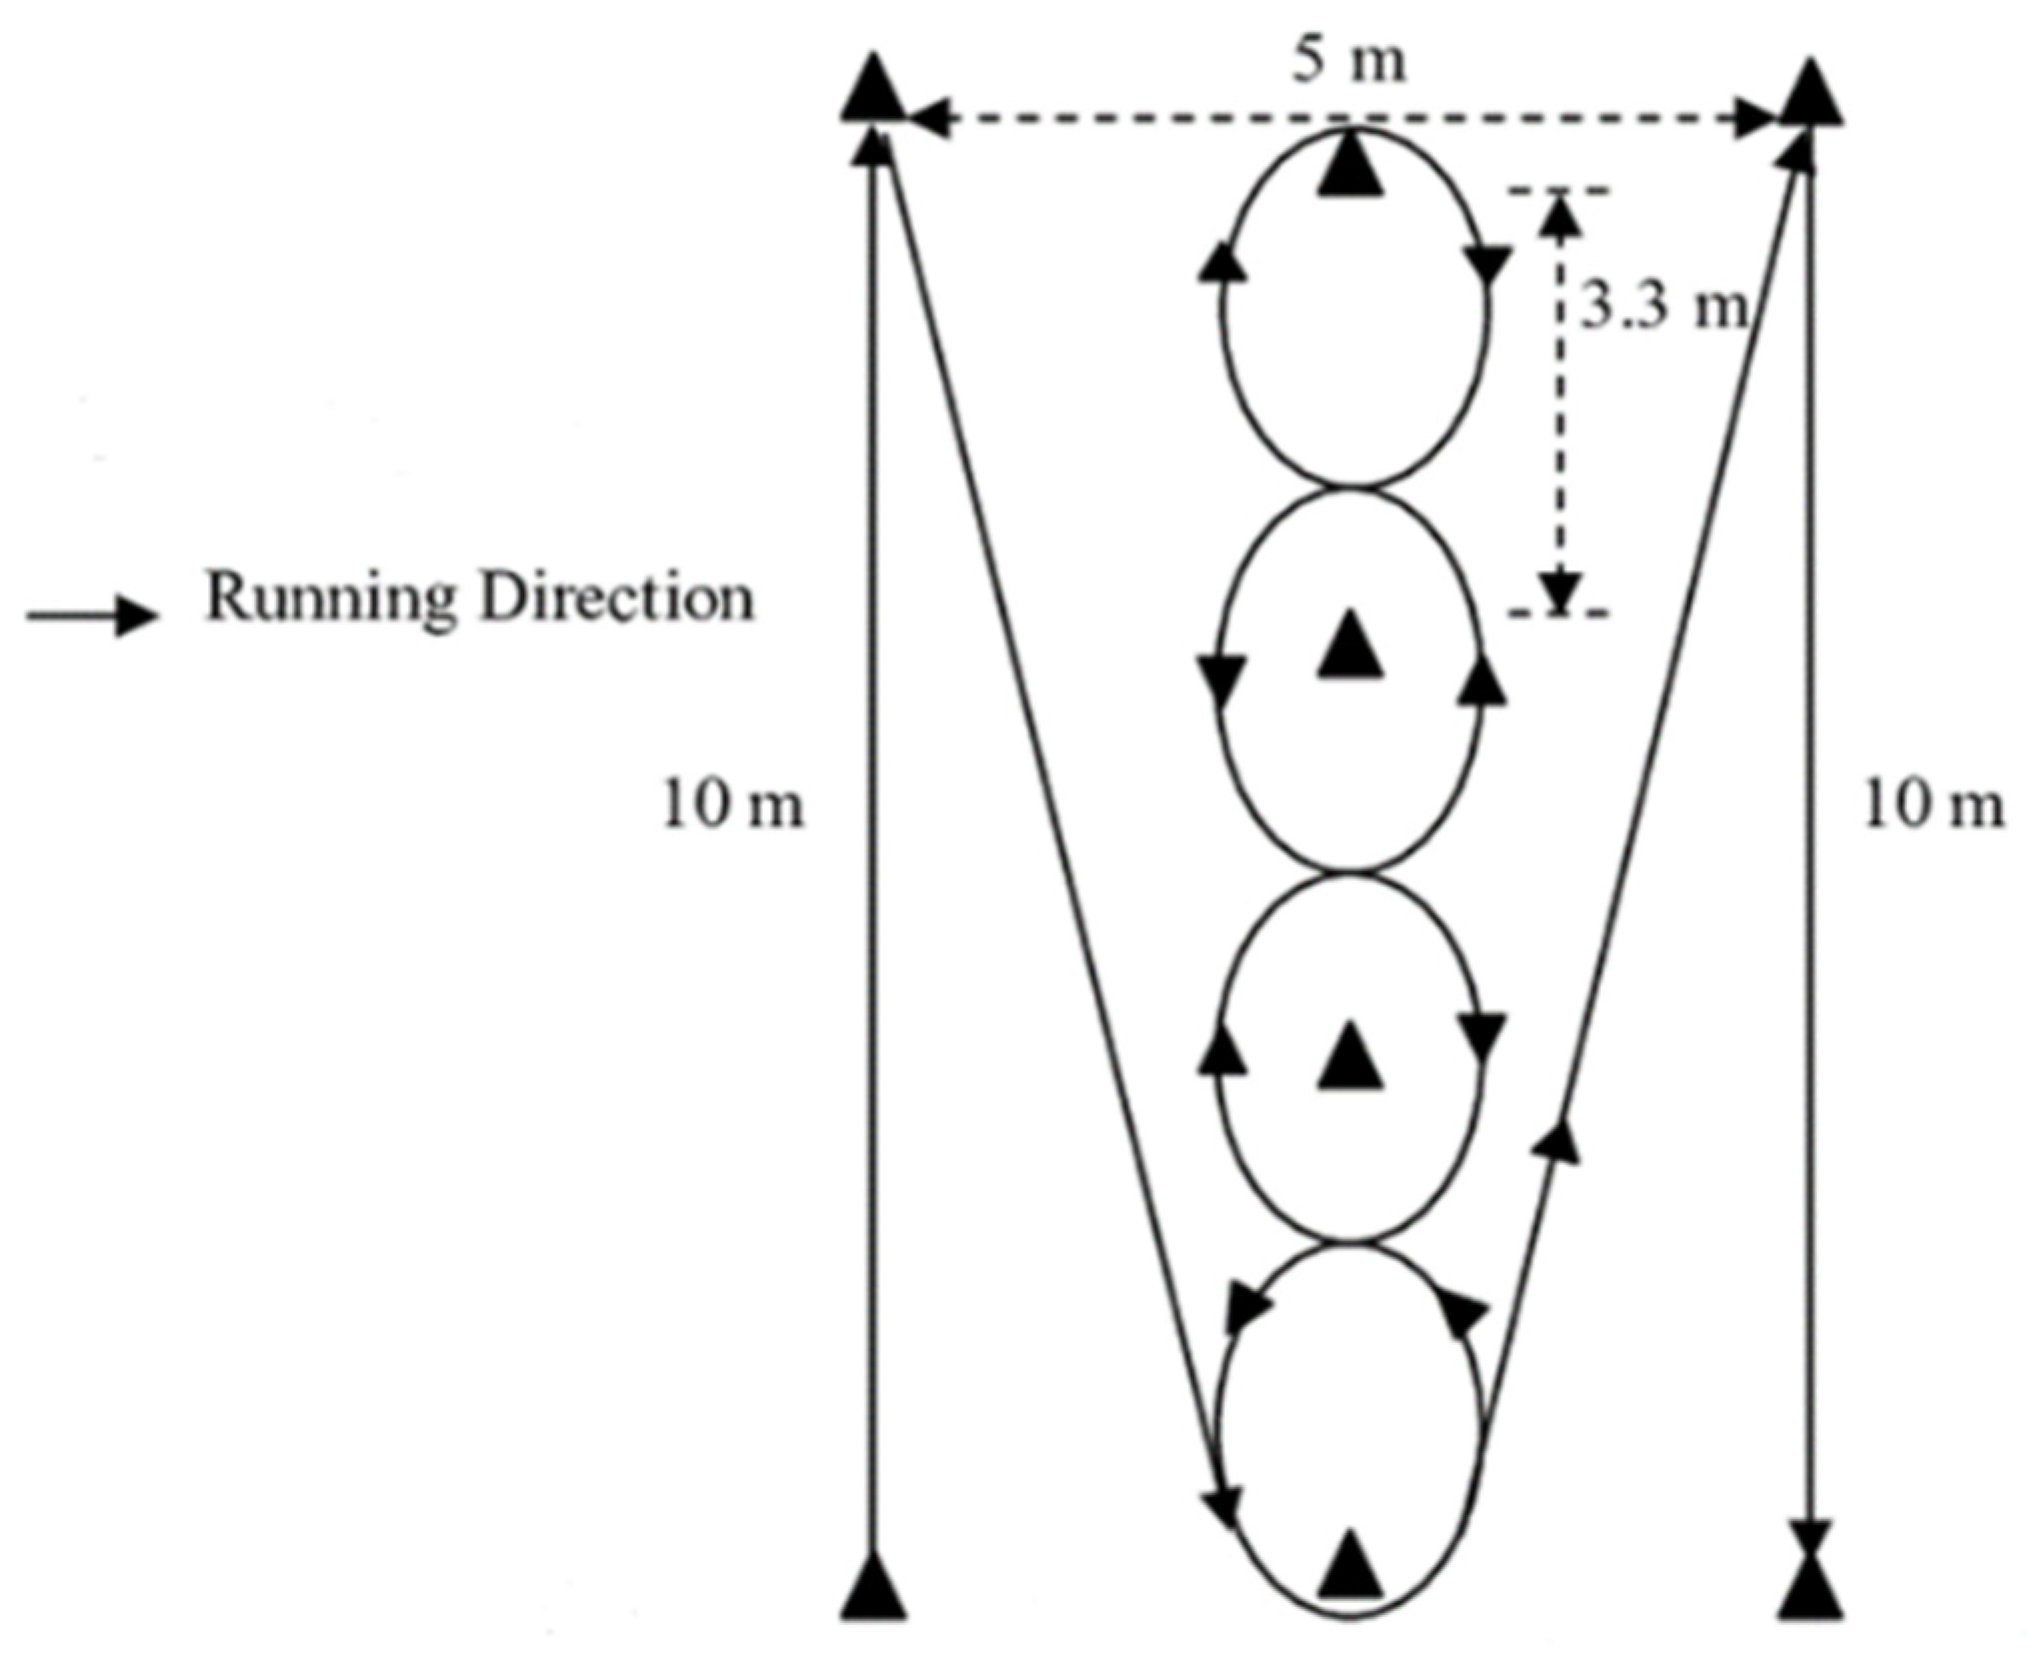
The IAT was used to measure change-of-direction speed [38,39,40] and has been adopted previously by tactical populations [41,42]. This test has been shown to have good reliability (intra-class correlation coefficient (ICC) = 0.80–0.84) [39,40]. The measurements and route direction for the IAT are shown in Figure 1. The IAT involved four markers being placed to indicate an area that was 10 m-long and 5 m-wide. In the center of the grid, four markers were placed 3.3 m apart. Trainees began in the prone position behind the start point, outside the first cone. The tester gave a preparatory command of “Ready”, before the command “Go”. The trainee then jumped to their feet and ran the course to the finish as quickly as possible. Trainees were instructed not to cut over or contact the markers but run around them and were to follow the prescribed route throughout the trial. If a trainee failed to follow these protocols, or they slipped during the trial, the trial was stopped and re-attempted. Time was recorded in seconds (s) via a stopwatch, from the initiation of movement until the trainee crossed the finish line. Testers trained in the use of stopwatch timing procedures can record reliable data [43,44]. Depending on time constraints, 1–2 trials were completed by trainees, with the fastest trial used.
2.4. Metronome Push-Ups
Maximal push-ups can provide a measure of upper-body muscular endurance [17,18], and have high trial-to-trial reliability (ICC = 0.95) [45]. For this department, push-ups were performed in time with a metronome at a cadence of 80 beats per minute. An audio file for the metronome was played during the test. Standard procedures were used for this test within the fire department. On the “Get ready” command, trainees assumed the kneeling push-up position with the arms extended. On the “Get Set” command, trainees adopted the standard ‘up’ position (body taut and straight, hands positioned shoulder-width apart, fingers pointed forwards) [46]. On the “Go” command and the initiation of the metronome, the trainee lowered themselves towards the ground by flexing the elbows until the upper arm was parallel to the ground. On the next metronome sound, the trainee immediately returned to the up position. On the next metronome sound, the trainee returned to the bottom position, and so on. The test was terminated when the trainee could no longer complete repetitions in time with the cadence. If the trainee maintained the cadence, but did not meet other standards (i.e., they did not fully extend the elbows, the upper arms were not parallel to the ground in the bottom position, or there was a pelvis/trunk sag), the grader repeated the number of the last correct repetition and told the trainee to make the appropriate correction. The number of correct repetitions performed was the score used for analysis. The maximum number of repetitions set for the push-up test was 100, so trainees did not have to complete more repetitions beyond this number.
2.5. Pull-Ups
The pull-up test provided a measure of upper-body pulling strength [47], and this test has been used previously in first responder populations [48,49,50]. Maximal pull-up tests have been found to demonstrate high reliability (ICC = 0.99) [51]. On the “Get ready” command, trainees positioned themselves in a free-hang position on the pull-up bar. Their hands were placed shoulder-width apart with a pronated grip, thumbs wrapped around the bar, and elbows extended. On the “Go” command, the trainee pulled their body upward with a vertical body alignment until the chin was above the bar to complete one repetition. The trainee then descended back to the start position with the arms fully extended and completed repetitions with this technique until they could no longer raise their chin above the bar. If the trainee kicked their way up, the pull-up involved was not counted. The score used for analysis was the number of correct repetitions performed.
2.6. Leg Tucks
The leg tuck provides a measure of grip, arm, shoulder, and trunk muscle strength and endurance [52], and this test has been found to have high reliability in tactical populations (ICC = 0.998–0.999) [53]. On the “Get ready” command, the trainee moved to a free-hang position, with their hands positioned with an alternated grip on the bar. The trainee’s body was extended and faced the length of the bar. On the “Go” command, the trainee lifted their lower body up so that their elbow flexed to an approximate 90° angle while simultaneously bringing their knees to contact their elbows (the leg tuck). The knees had to contact the elbows for a successful repetition. The trainee then returned to the hang position and repeated this movement as many times as possible. The trainee’s body was to be extended in the free-hang position between each repetition, and they could not rest the legs on the bar or swing past the starting position when they lowered themselves from the leg tuck. The analyzed score was the number of correct repetitions performed.
2.7. Estimated Maximal Aerobic Capacity (O2max)
Estimated O2max was derived from the MSFT, which was conducted according to established procedures [46,54]. The MSFT has very high reliability (ICC = 0.96) [55]. Trainees ran back and forth between two lines spaced 20 m apart, indicated by markers. The speed of running for the MSFT was standardized by pre-recorded auditory cues (i.e., beeps) played from an audio file. The test was terminated when the trainee was unable to reach the lines twice in a row in accordance with the auditory cues. This test was scored according to the final stage the trainee was able to achieve. From this, estimated O2max (mL·kg−1·min−1) for each trainee was derived from the table documented by Ramsbottom et al. [56].
2.8. Backwards Overhead Medicine Ball Throw (BOMBT)
The BOMBT with a 4.54 kg (10 lbs) medicine ball was used to assess combined upper- and lower-body power and coordination [57,58,59,60], and this test has been found to have reliability (ICC = 0.996) [60]. The procedures for this test have been described by Lockie et al. [59]. The trainee stood with their back to the throwing area, feet shoulder-width apart and heels on the start line. The medicine ball was held in front of the body, with the arms extended at shoulder height. In one continuous movement, the trainee flexed at the hips, knees, and trunk, and lowered the ball below the waist. The trainee then extended their legs and thrust the hips forwards, while flexing the shoulders and elevating the ball above shoulder height as they threw it back over their head as far as possible. Following the throw, the feet could leave the ground; however, the trainee’s body could not go past the start line. The horizontal distance was measured via a tape measure (in feet) from the start line to the point where the ball first contacted the ground. The score was converted to meters for this study.
2.9. 10-Repetition Maximum (10RM) Deadlift
The 10RM deadlift was used to measure lower-body strength [61,62,63,64]. Bilateral strength exercises have been found to have high reliability (ICC = 0.92) [65]. The movement was performed as described in the literature [61], although firefighter trainees self-selected their stance foot position and grip on the bar. Trainees performed warm-up sets as required with different loads (52 kg (115 lbs), 74 kg (175 lbs), 84 kg (185 lbs), 102 kg (225 lbs)). After the warm-up sets, the weight was progressively increased, and trainees completed 10 repetitions (counted by a staff member). A successful repetition was achieved when the trainee was standing erect via knee and hip extension, with their shoulders retracted and positioned behind the vertical orientation of the bar [61]. A pause of approximately 2 s was allowed at the top of the lift between repetitions. The trainee then lowered the weight with control to the ground. No rest was allowed between repetitions while the weight was grounded. The test was terminated if the trainee did not attain the correct upright position, they exceeded the approximate 2 s time limit at the top or bottom of a repetition, they dropped the weight, or they failed to keep the bar moving up during a repetition. Approximately 2–3 min was provided between attempts. The load for the last successful 10RM attempt was recorded in lbs, before being converted to kg.
2.10. Farmers Carry
As firefighters perform loaded carries as part of their job [1], the fire department staff included a farmers carry with kettlebells in their test battery. This action has been analyzed due to its application to strength-related activities such as strongman training [66,67,68]. Reliability data were not available for this test, but the farmer’s walk was an established assessment in the battery utilized by training staff for this fire department. The farmers carry was designed to assess a trainee’s ability to carry 36 kg (80 lbs) for 91.44 m (100 yards). To complete the test, trainees held an 18 kg (40 lbs) kettlebell in each hand and traversed four times up-and-back over a 22.86 m (25 yards) distance. The trainees were instructed to complete the four shuttles with the kettlebells as quickly as possible by walking, jogging, or running. To begin, the trainee stood at the start line with the kettlebells positioned on the ground on each side of the trainee. On the “Go” command, the trainee squatted down and lifted the two kettlebells and proceed to cover the 4 × 22.86 m course as quickly as possible. If a trainee dropped a kettlebell at any point, they could pick the kettlebell up and continue. Time was recorded in seconds via stopwatch from the initiation of movement until the trainee finished the course.
2.11. Statistical Analysis
Statistical analyses were processed using the Statistics Package for Social Sciences (SPSS), Version 28.0 (IBM Corporation, New York, NY, USA), and Microsoft Excel (Microsoft CorporationTM, Redmond, WA, USA). Descriptive statistics (mean ± standard deviation (SD); 95% confidence intervals (95% CI)) were calculated for each variable. Normality of the data was evaluated by visual analysis of Q-Q plots [69,70]. Within the datasets provided to the researchers, some tests did not have scores for all trainees. Nonetheless, all available data were used in this study. A one-way analysis of variance (ANOVA), with Bonferroni post hoc adjustment for multiple pairwise comparisons, was used to calculate any differences between the classes. This statistical analysis was used due to the sample size, and the robustness of the one-way ANOVA [17,71]. The sexes were combined if needed within each class as the fire department did not use any corrections for sex when awarding points for their fitness test battery. Nonetheless, the number of male and female trainees within a class was noted. Statistical significance was set a priori at p < 0.05.
For the second part of the analysis, Microsoft Excel was used to calculate the percentile ranks for each fitness assessment [17,21]. Bands of 10 percentile ranks (i.e., 0–9%, 10–19%, 20–29%, etc.) were used where possible. The number of male and female recruits within each percentile rank was documented.
3. Results
The data for each class are shown on Table 1. The number of trainees in each class with data who completed each test (e.g., sit-ups) varied for reasons not disclosed to the researchers. The n range across the tests is presented for each class. Classes 1–3 only had male trainees. There was one female trainee in Class 4, while Classes 5 and 6 each had 15 female trainees. The one-way ANOVA results indicated that there were significant interactions for the IAT (F5 = 8.736, p < 0.001), BOMBT (F5 = 7.097, p < 0.001), leg tuck (F5 = 2.667, p = 0.022), deadlift (F5 = 16.695, p < 0.001), and farmers carry (F5 = 9.276, p < 0.001). Class 1 completed the IAT significantly faster than all the other classes (p ≤ 0.009). Classes 1 (p ≤ 0.011) and 4 (p ≤ 0.004) had a significantly further BOMBT distance compared to Classes 5 and 6. Class 3 had a further BOMBT distance compared to Class 6 (p = 0.044). Class 4 completed significantly more leg-tuck repetitions than Class 5 (p = 0.047). With regards to the deadlift, Class 1 had a significantly greater 10RM compared to Classes 3, 4, and 6 (p ≤ 0.006). Class 2 had a greater 10 RM compared to Classes 3–6 (p ≤ 0.036). Class 4 had a lower 10 RM deadlift compared to Classes 5 and 6 (p ≤ 0.008). Class 3 completed the farmers carry significantly slower than all other classes (p ≤ 0.002). There were no significant interactions for push-ups, pull-ups, and estimated O2max.
The percentile rank data are shown in Table 2, Table 3, Table 4, Table 5, Table 6, Table 7, Table 8 and Table 9. Where possible, data were presented in bands of 10 percentile ranks. However, the spread of scores for each fitness test influenced the percentile ranks. This was notable for metronome push-ups (where the maximal number of repetitions was capped at 100; Table 3) and the deadlift (61 trainees lifted a load of 156.49 kg; Table 8). The number of males and females within each percentile band is recorded in each table. Depending on the test, the largest number of female trainees tended to be in the lower bands (0–19%). For the IAT (Table 2), the fastest time recorded by a trainee was 16 s, and the slowest time was 32 s. As stated, the highest number of repetitions for the metronome push-up test was 100, and the lowest was 0 (Table 3). The lowest number of repetitions for the pull-up test was also 0, and the highest was 28 repetitions (Table 4). The furthest BOMBT distance was 13.84 m, while the lowest was 4.02 m (Table 5). The best trainees in the leg-tuck test completed 30 repetitions, while the poorest completed no repetitions (Table 6). The highest estimated O2max recorded by these firefighter trainees was 61.2 mL·kg−1·min−1, and the lowest estimated O2max was 20.2 mL·kg−1·min−1 (Table 7). One trainee lifted 185.97 kg for their 10RM deadlift, while the lowest 10RM deadlift load was 90.72 kg (Table 8). The fastest farmers carry time was 21 s, while the slowest time was 49 s (Table 9).
4. Discussion
This study analyzed the fitness characteristics of six firefighter trainee academy classes to determine whether there were differences between the classes, and defined percentile ranks for the different fitness tests. Although the data were specific to one department, this fire department has a high number of employees and covers a large county [22]. Accordingly, the data presented should provide a good representation of firefighter trainees. The results indicated that there were some between-class differences in the fitness tests, which supports the findings from Lockie et al. [17] regarding law enforcement recruit academy classes. Additionally, the percentile rank data could be used to indicate high- and low-performers in each test within the department, and provide a point of comparison for other departments, tactical occupations, and against normative population data. What was also highlighted by the between-class analysis and percentile ranks were the challenges for female trainees, especially in tasks requiring high force output (i.e., IAT, BOMBT, and the deadlift). These results underscore the importance of designing physical training programs that are targeted towards the strengths and limitations of individual firefighter trainees. This research has pertinent applications for fire department training staff, and the sustainable health, fitness, and performance of firefighters.
The fire department in this study used the fitness test data to assist with their program design, which is common practice in strength and conditioning [37]. The results of this study emphasized the importance of this practice. For example, Class 1 outperformed all the other classes in the IAT, which evaluates multidirectional movement capabilities [38,39,41]. Classes 5 and 6 tended to perform the poorest in the BOMBT, which measures total-body power [57,58,59,60], and in the deadlift. The deadlift assessed lower-body strength [61,62,63,64], as the ability to lift a heavy load from the ground contributes to job-specific tasks such as body or victim drags [72]. Although the fitness tests by themselves may not represent the job tasks completed by firefighters, the qualities they measure (i.e., lower-body strength, anaerobic and aerobic capacity) are important contributors to occupational performance [1,2,3,6,9]. These data stress the need for fire department training staff to adjust the physical training programs to the needs of the trainees within each class. Although certain fire departments may have templates for their physical training which can be applied across multiple academy classes, it is important to adjust these relative to the needs of each cohort. Future research should analyze the effects that individualized physical training programs have upon the fitness of firefighter trainees, as this should confirm the effectiveness of this approach. Fire departments should ideally have personnel that can design programs in this manner. Indeed, practitioners who have attained strength and conditioning certifications must follow established guidelines in their practice to design safe, effective, and specific training programs for the individual [73]. This is essential for developing (and hopefully sustaining) the fitness and physical performance of firefighter trainees.
What should also be discussed is that Classes 5 and 6, who tended to have lesser performance in the IAT, BOMBT, and deadlift, had the greatest number of female trainees. Both classes had 15 female trainees in their cohort. The IAT, BOMBT, and deadlift all require the generation of high external force, whether initiating a change of direction [74], projecting a medicine ball [75], or picking up a heavy resistance [76]. When compared to male firefighters, females tend to demonstrate lesser anaerobic power and maximal strength [3]. It is possible the results from Classes 5 and 6 were influenced by the number of females in their cohort. It should be noted that all the female trainees successfully completed the CPAT, and therefore have the potential to be successful firefighters. However, these results also emphasize that female trainees may need to place a focus on developing their maximal strength and power. This should benefit job tasks that require manipulating an external resistance, such as victim drags [72] or raising a ladder [77], and as such are absolute task requirements extant of the firefighter’s sex [78]. Forthcoming studies should investigate the best approaches to physically prepare female firefighter trainees for the demands of the training academy and future occupation.
There were certain fitness variables that did not significantly differ between classes, including push-ups, pull-ups, and estimated O2max. Push-ups and pull-ups often feature in firefighter testing and training programs [10,29,32], so it is plausible that the trainees spent some time physically preparing for these exercises in the lead-up to academy. The importance of aerobic conditioning is stressed for firefighters, especially considering the challenging environments (i.e., heat, fire, smoke, and physical and mental stress) in which firefighters work. This is in part because superior aerobic fitness not only helps with job task performance [1,3,6], but can also reduce the risk of cardiovascular disease [79]. Gledhill and Jamnik [80] recommended a minimum O2max of 45 mL·kg−1·min−1 for applicants to a firefighting academy. All classes, except for Class 6 (44.08 ± 5.95 mL·kg−1·min−1), had a mean estimated O2max at or above this level. These data may indicate that most trainees, regardless of cohort, put some emphasis on ensuring that they had enough aerobic conditioning to complete the CPAT and prepare for academy.
Percentile ranking data are important to derive for a fire department, as this information can be used in the design of physical training programs [17]. Strengths and limitations of trainees can be underlined with this type of normative data. As previously noted, a minimum O2max of 45 mL·kg−1·min−1 has been recommended for applicants to a firefighting academy [80]. A trainee with this O2max would be placed in the 41–49% rank in this department (Table 6), which would mean that more than half of the trainees are superior to this recommended standard. Although the push-up test conducted by this department was completed in time with a metronome and capped at 100 repetitions, the trainees were still far superior to normative data for maximal push-ups from the general population [15]. Indeed, even the highest-ranking performance documented by Riebe et al. [15] for men (≥36 repetitions) and women (≥36 repetitions) aged 20–29 years would be placed within the 0–19% ranks from this department (Table 3). The pull-up ranks (Table 4) were similar to those presented by Lockie et al. [17] for law enforcement recruits. There were some novel fitness tests used relative to firefighter trainees by this department (IAT, BOMBT, leg tuck, deadlift, and farmers carry). The data presented in this study provide an initial profile, in addition to some context, for other departments who may use these tests.
What was also notable from the normative data was where the female trainees were positioned in the percentile ranks. Depending on the test, between 55% and 81% of all females were positioned in the bottom three percentile ranks (0–29%). This was true for all tests except the BOMBT, where 100% of the female trainees were in the 0–29% rank. These results are not unexpected, as females will generally have a physical disadvantage relative to males, as they tend to be smaller in body size and have less body and muscle mass compared to men [81,82]. Nevertheless, these data also support the findings from the between-class comparisons. Female trainees may require specific programs to optimize their physical capacity to prepare for a firefighting career. These results should not discourage women from becoming firefighters. Rather, they reinforce the need for specific training programs designed by appropriately trained personnel to improve the physical capacity of female trainees. Focusing on this physical development during fire academy training should also hopefully benefit the longer-term career of female firefighters. As noted, this requires further investigation. Research could entail the analysis of pre-academy strength and conditioning programs and the effects on fitness of the female firefighter trainee, as well as documentation of fitness changes during the academy period that occur with specific, individualized physical training.
There are study limitations that should be noted. This study only analyzed one fire department, although it was a large department within a major county [22]. The job demands within this county, and the subsequent focus of academy training, could vary from other parts of the country, and this could have impacted the fitness data detailed in the current research. Age, height, and body mass data were not provided to the researchers, so specific descriptive data of the participants could not be provided. Nonetheless, and as noted, it could be expected that the trainees would be similar in age, height, and body mass to those previously detailed in the literature [10,32,33]. There was a smaller pool of female firefighter trainees (n = 31) compared to male firefighter trainees (n = 274), although this is common in physically demanding first responder occupations [17,18,19,20,21,46,54,83,84]. However, and as stated, many fire departments are trying to recruit and retain more females [27]. As a result, it is essential that details for any female firefighter trainees are presented. Testing and environmental conditions may have varied across cohorts. However, similar to law enforcement research [17], this limitation is unavoidable given the need for this department to run academy classes year-round. The fitness tests were used as a general measure of physical capacity within this fire department. Future research could investigate relationships between these tests with job performance, in addition to factors such as academy graduation rates. As previously stated, within this department, scores were assigned relative to performance in each of the fitness tests. These scores were not included in this study as the researchers focused on the absolute test performance. However, the existence of the scoring system could have influenced the study results. For example, the metronome push-up test was capped at 100 repetitions, and 20% of trainees attained this maximum. A trainee achieved maximum points for the deadlift with a load of 170.10 kg, so they did not have to lift a greater 10RM beyond this if they did not want to. As such, ceiling effects may have impacted the mean results. Height and body mass data were not included in the datasets provided to the researchers. It is possible that tasks involving strength could be performed better by trainees with larger stature [6,85], although this cannot be confirmed with the current data. Similar to previous tactical research [54,85], is expected that any training recommendations applied to females with strength limitations could also be applied to males who have a smaller stature.
5. Conclusions
The results from this study indicated that performance in certain fitness tests (IAT, BOMBT, leg tuck, deadlift, and farmers carry) were significantly different between fire academy classes. These data demonstrated that within some classes, there may be trainees lacking in a certain fitness quality that requires specific attention from the training staff. With regards to the normative percentile rankings, the data documented a wide variance in fitness qualities between trainees, with female trainees tending to be positioned towards the bottom of the ranks. Although the female trainees had successfully completed the CPAT to enter the fire training academy, they may still be lacking in certain fitness qualities (e.g., running speed, maximal power, maximal strength) that could make the training academy process and firefighting occupation challenging. The results reinforced the need to use fitness testing data for program design to target and develop any weakness in trainees [17]. These data also support the need for trained strength and conditioning professionals to work with firefighter trainees. Fire departments should ensure they hire staff with the skills and knowledge to ensure their trainees receive the best possible training programs. This is especially important for female trainees, who may have some shortcomings in tasks requiring maximal force output. It is also recommended that fire departments develop their own normative data with their personnel. This will account for any specifics associated with the firefighting tasks completed within a certain city or county.
Author Contributions
Conceptualization, R.G.L.; Methodology, R.G.L., R.M.O., F.M., T.J.R. and J.J.D.; Investigation, R.G.L., R.M.O., F.M., T.J.R. and J.J.D.; Data Curation, R.G.L. and F.M.; Writing—Original Draft Preparation, R.G.L.; Writing—Review and Editing, R.G.L., R.M.O., F.M., T.J.R. and J.J.D. All authors have read and agreed to the published version of the manuscript.
Funding
This research received no external funding.
Institutional Review Board Statement
The study was conducted according to the guidelines of the Declaration of Helsinki and approved by the Institutional Review Board of California State University, Fullerton (protocol code: HSR-17-18-401 and date of approval: 7 March 2019).
Informed Consent Statement
Participant consent was waived due to the use of de-identified, pre-existing datasets provided by the law enforcement agency. The institutional review board approved the use of pre-existing data (protocol code: HSR-17-18-401 and date of approval: 7 March 2019).
Data Availability Statement
Restrictions apply to the availability of these data due to ethical, legal, and privacy concerns.
Conflicts of Interest
The authors declare no conflict of interest.
References
- Williams-Bell, F.M.; Villar, R.; Sharratt, M.T.; Hughson, R.L. Physiological demands of the firefighter Candidate Physical Ability Test. Med. Sci. Sports Exerc. 2009, 41, 653–662. [Google Scholar] [CrossRef] [PubMed]
- Rhea, M.R.; Alvar, B.A.; Gray, R. Physical fitness and job performance of firefighters. J. Strength Cond. Res. 2004, 18, 348–352. [Google Scholar] [PubMed]
- Sheaff, A.K.; Bennett, A.; Hanson, E.D.; Kim, Y.S.; Hsu, J.; Shim, J.K.; Edwards, S.T.; Hurley, B.F. Physiological determinants of the Candidate Physical Ability Test in firefighters. J. Strength Cond. Res. 2010, 24, 3112–3122. [Google Scholar] [CrossRef] [PubMed] [Green Version]
- Lane, C.L.; Hardwick, D.; Janus, T.P.; Chen, H.; Lu, Y.; Mayer, J.M. Comparison of the firefighter Candidate Physical Ability Test to weight lifting exercises using electromyography. Work 2019, 62, 459–467. [Google Scholar] [CrossRef]
- Johnson, Q.R.; Goatcher, J.D.; Diehl, C.; Lockie, R.G.; Orr, R.M.; Alvar, B.; Smith, D.B.; Dawes, J.J. Heart rate responses during simulated fire ground scenarios among full-time firefighters. Int. J. Exerc. Sci. 2020, 13, 374–382. [Google Scholar]
- Skinner, T.L.; Kelly, V.G.; Boytar, A.N.; Peeters, G.; Rynne, S.B. Aviation Rescue Firefighters physical fitness and predictors of task performance. J. Sci. Med. Sport. 2020, 23, 1228–1233. [Google Scholar] [CrossRef]
- Walker, A.; Pope, R.; Orr, R.M. The impact of fire suppression tasks on firefighter hydration: A critical review with consideration of the utility of reported hydration measures. Ann. Occup. Environ. Med. 2016, 28, 63. [Google Scholar] [CrossRef] [Green Version]
- Orr, R.; Simas, V.; Canetti, E.; Maupin, D.; Schram, B. Impact of various clothing variations on firefighter mobility: A pilot study. Safety 2019, 5, 78. [Google Scholar] [CrossRef] [Green Version]
- Michaelides, M.A.; Parpa, K.M.; Henry, L.J.; Thompson, G.B.; Brown, B.S. Assessment of physical fitness aspects and their relationship to firefighters’ job abilities. J. Strength Cond. Res. 2011, 25, 956–965. [Google Scholar] [CrossRef]
- Stone, B.L.; Alvar, B.A.; Orr, R.M.; Lockie, R.G.; Johnson, Q.R.; Goatcher, J.; Dawes, J.J. Impact of an 11-week strength and conditioning program on firefighter trainee fitness. Sustainability 2020, 12, 6541. [Google Scholar] [CrossRef]
- Cornell, D.J.; Gnacinski, S.L.; Meyer, B.B.; Ebersole, K.T. Changes in health and fitness in firefighter recruits: An observational cohort study. Med. Sci. Sports Exerc. 2017, 49, 2223–2233. [Google Scholar] [CrossRef] [PubMed]
- Firefighter Candidate Testing Center. Candidate Physical Ability Test. Available online: https://www.fctconline.org/departments/about-cpat/ (accessed on 3 March 2021).
- Poplin, G.S.; Roe, D.J.; Burgess, J.L.; Peate, W.F.; Harris, R.B. Fire fit: Assessing comprehensive fitness and injury risk in the fire service. Int. Arch. Occup. Environ. Health 2016, 89, 251–259. [Google Scholar] [CrossRef] [PubMed]
- Griffin, S.C.; Regan, T.L.; Harber, P.; Lutz, E.A.; Hu, C.; Peate, W.F.; Burgess, J.L. Evaluation of a fitness intervention for new firefighters: Injury reduction and economic benefits. Inj. Prev. 2016, 22, 181–188. [Google Scholar] [CrossRef] [PubMed] [Green Version]
- Riebe, D.; Ehrman, J.K.; Liguori, G.; Magal, M. ACSM’s Guidelines for Exercise Testing and Prescription, 10th ed.; Wolters Kluwer: Philadelphia, PA, USA, 2018. [Google Scholar]
- Ryan, E.D.; Cramer, J.T. Fitness Testing Protocols and Norms. In NSCA’s Essentials of Personal Training; Coburn, J.W., Malek, M.H., Eds.; Human Kinetics: Champaign, IL, USA, 2012; pp. 201–247. [Google Scholar]
- Lockie, R.G.; Dawes, J.J.; Orr, R.M.; Dulla, J.M. Recruit fitness standards from a large law enforcement agency: Between-class comparisons, percentile rankings, and implications for physical training. J. Strength Cond. Res. 2020, 34, 934–941. [Google Scholar] [CrossRef]
- Lockie, R.G.; Dawes, J.J.; Kornhauser, C.L.; Holmes, R.J. Cross-sectional and retrospective cohort analysis of the effects of age on flexibility, strength endurance, lower-body power, and aerobic fitness in law enforcement officers. J. Strength Cond. Res. 2019, 33, 451–458. [Google Scholar] [CrossRef]
- Boyce, R.W.; Ciulla, S.; Jones, G.R.; Boone, E.L.; Elliott, S.M.; Combs, C.S. Muscular strength and body composition comparison between the Charlotte-Mecklenburg Fire and Police Departments. Int. J. Exerc. Sci. 2008, 1, 125–135. [Google Scholar]
- Dawes, J.J.; Orr, R.M.; Flores, R.R.; Lockie, R.G.; Kornhauser, C.; Holmes, R. A physical fitness profile of state highway patrol officers by gender and age. Ann. Occup. Environ. Med. 2017, 29, 16. [Google Scholar] [CrossRef]
- Lockie, R.G.; Orr, R.M.; Dawes, J.J. Slowing the path of time: Age-related and normative fitness testing data for police officers from a health and wellness program. J. Strength Cond. Res. 2022, 36, 747–756. [Google Scholar] [CrossRef]
- Los Angeles County Fire Department. Los Angeles County Fire Department. January 2020. Available online: https://fire.lacounty.gov/wp-content/uploads/2020/02/Department-Overview-Booklet_Final_Sm.pdf (accessed on 15 September 2021).
- Lockie, R.G.; Fazilat, B.; Dulla, J.M.; Stierli, M.; Orr, R.M.; Dawes, J.J.; Pakdamanian, K. A retrospective and comparative analysis of the physical fitness of custody assistant classes prior to academy training. Sport Exerc. Med. Open J. 2018, 4, 44–51. [Google Scholar] [CrossRef]
- Lockie, R.G.; Stierli, M.; Dawes, J.J.; Cesario, K.A.; Moreno, M.R.; Bloodgood, A.M.; Orr, R.M.; Dulla, J.M. Are there similarities in physical fitness characteristics of successful candidates attending law enforcement training regardless of training cohort? J. Trainol. 2018, 7, 5–9. [Google Scholar] [CrossRef] [Green Version]
- Lockie, R.; Hernandez, E. The 75-yard pursuit run performed by law enforcement recruits–Percentile rankings and implications for training. TSAC Rep. 2020, 57, 16–22. [Google Scholar]
- Szucs, D.; Ioannidis, J.P.A. When null hypothesis significance testing is unsuitable for research: A reassessment. Front. Hum. Neurosci. 2017, 11, 390. [Google Scholar] [CrossRef] [PubMed]
- U.S. Fire Administration. Emerging Health and Safety Issues Among Women in the Fire Service. Available online: https://www.usfa.fema.gov/downloads/pdf/publications/emerging_health_safety_issues_women_fire_service.pdf (accessed on 4 March 2021).
- Orr, R.M.; Ford, K.; Stierli, M. Implementation of an ability-based training program in police force recruits. J. Strength Cond. Res. 2016, 30, 2781–2787. [Google Scholar] [CrossRef] [Green Version]
- Butler, R.J.; Contreras, M.; Burton, L.C.; Plisky, P.J.; Goode, A.; Kiesel, K. Modifiable risk factors predict injuries in firefighters during training academies. Work 2013, 46, 11–17. [Google Scholar] [PubMed]
- Orr, R.; Pope, R.; Peterson, S.; Hinton, B.; Stierli, M. Leg power as an indicator of risk of injury or illness in police recruits. Int. J. Environ. Res. Public Health. 2016, 13, 237. [Google Scholar] [CrossRef]
- Los Angeles County Fire Department. Your Path to Becoming a Firefighter. Available online: http://fire.lacounty.gov/wp-content/uploads/2019/08/fire-fighter-trainee.pdf (accessed on 12 February 2021).
- Roberts, M.A.; O’Dea, J.; Boyce, A.; Mannix, E.T. Fitness levels of firefighter recruits before and after a supervised exercise training program. J. Strength Cond. Res. 2002, 16, 271–277. [Google Scholar]
- Wynn, P.; Hawdon, P. Cardiorespiratory fitness selection standard and occupational outcomes in trainee firefighters. Occup. Med. 2012, 62, 123–128. [Google Scholar] [CrossRef] [Green Version]
- Hopkins, W.G. How to interpret changes in an athletic performance test. Sportscience 2004, 8, 1–7. [Google Scholar]
- Faul, F.; Erdfelder, E.; Lang, A.G.; Buchner, A. G*Power 3: A flexible statistical power analysis program for the social, behavioral, and biomedical sciences. Behav. Res. Methods 2007, 39, 175–191. [Google Scholar] [CrossRef]
- World Medical Association. World Medical Association Declaration of Helsinki. Recommendations guiding physicians in biomedical research involving human subjects. JAMA 1997, 277, 925–926. [Google Scholar] [CrossRef]
- McGuigan, M.R. Principles of Test Selection and Administration. In Essentials of Strength Training and Conditioning, 4th ed.; Haff, G.G., Triplett, N.T., Eds.; Human Kinetics: Champaign, IL, USA, 2015; pp. 249–258. [Google Scholar]
- Roozen, M. Illinois Agility Test. NSCA’s Perf. Train. J. 2004, 3, 5–6. [Google Scholar]
- Stewart, P.F.; Turner, A.N.; Miller, S.C. Reliability, factorial validity, and interrelationships of five commonly used change of direction speed tests. Scand. J. Med. Sci. Sports. 2014, 24, 500–506. [Google Scholar] [CrossRef] [PubMed]
- Lockie, R.G.; Schultz, A.B.; Callaghan, S.J.; Jeffriess, M.D.; Berry, S.P. Reliability and validity of a new test of change-of-direction speed for field-based sports: The Change-of-Direction and Acceleration Test (CODAT). J. Sports Sci. Med. 2013, 12, 88–96. [Google Scholar] [PubMed]
- Raya, M.A.; Gailey, R.S.; Gaunaurd, I.A.; Jayne, D.M.; Campbell, S.M.; Gagne, E.; Manrique, P.G.; Muller, D.G.; Tucker, C. Comparison of three agility tests with male servicemembers: Edgren Side Step Test, T-Test, and Illinois Agility Test. J. Rehabil. Res. Dev. 2013, 50, 951–960. [Google Scholar] [CrossRef] [PubMed]
- Orr, R.M.; Kukić, F.; Čvorović, A.; Koropanovski, N.; Janković, R.; Dawes, J.; Lockie, R. Associations between fitness measures and change of direction speeds with and without occupational loads in female police officers. Int. J. Environ. Res. Public Health 2019, 16, 1947. [Google Scholar] [CrossRef] [Green Version]
- Hetzler, R.K.; Stickley, C.D.; Lundquist, K.M.; Kimura, I.F. Reliability and accuracy of handheld stopwatches compared with electronic timing in measuring sprint performance. J. Strength Cond. Res. 2008, 22, 1969–1976. [Google Scholar] [CrossRef]
- Mann, J.B.; Ivey, P.J.; Brechue, W.F.; Mayhew, J.L. Validity and reliability of hand and electronic timing for 40-yd sprint in college football players. J. Strength Cond. Res. 2015, 29, 1509–1514. [Google Scholar] [CrossRef]
- Augustsson, S.R.; Bersås, E.; Thomas, E.M.; Sahlberg, M.; Augustsson, J.; Svantesson, U. Gender differences and reliability of selected physical performance tests in young women and men. Adv. Physiother. 2009, 11, 64–70. [Google Scholar] [CrossRef] [Green Version]
- Lockie, R.G.; Ruvalcaba, T.R.; Stierli, M.; Dulla, J.M.; Dawes, J.J.; Orr, R.M. Waist circumference and waist-to-hip ratio in law enforcement agency recruits: Relationship to performance in physical fitness tests. J. Strength Cond. Res. 2020, 34, 1666–1675. [Google Scholar] [CrossRef] [Green Version]
- Sanchez-Moreno, M.; Pareja-Blanco, F.; Diaz-Cueli, D.; González-Badillo, J.J. Determinant factors of pull-up performance in trained athletes. J. Sports Med. Phys. Fitness 2016, 56, 825–833. [Google Scholar]
- Lagestad, P.; van den Tillaar, R. A comparison of training and physical performance of police students at the start and the end of three-year police education. J. Strength Cond. Res. 2014, 28, 1394–1400. [Google Scholar] [CrossRef] [PubMed]
- Orr, R.M.; Caust, E.; Hinton, B.; Pope, R. Selecting the best of the best: Associations between anthropometric and fitness assessment results and success in police specialist selection. Int. J. Exerc. Sci. 2018, 11, 785–796. [Google Scholar] [PubMed]
- Williford, H.N.; Duey, W.J.; Olson, M.S.; Howard, R.; Wang, N. Relationship between fire fighting suppression tasks and physical fitness. Ergonomics 1999, 42, 1179–1186. [Google Scholar] [CrossRef] [PubMed]
- Coyne, J.O.; Tran, T.; Secomb, J.L.; Lundgren, L.; Farley, O.R.; Newton, R.; Sheppard, J.M. Reliability of pull up and dip maximal strength tests. J. Aust. Strength Cond. 2015, 23, 21–27. [Google Scholar]
- United States Army Center for Initial Military Training. Army Combat Fitness Test. Available online: https://www.army.mil/acft/ (accessed on 14 March 2022).
- Piddubny, A.; Velez, F.A.M.; Velez, M.A.M.; Zhanna, T.; Sergey, P.; Alexander, A.; Maxim, Y.; Artem, G. Reliability of alternative tests to assess the strength and endurance of the pectoral girdle (shoulder girdle) muscles of military personnel. Cienc. Lat. Rev. Cient. Multidiscip. 2022, 6, 1758–1773. [Google Scholar]
- Lockie, R.G.; Carlock, B.N.; Ruvalcaba, T.J.; Dulla, J.M.; Orr, R.M.; Dawes, J.J.; McGuire, M.B. Skeletal muscle mass and fat mass relationships with physical fitness test performance in law enforcement recruits before academy. J. Strength Cond. Res. 2021, 35, 1287–1295. [Google Scholar] [CrossRef]
- Aandstad, A.; Holme, I.; Berntsen, S.; Anderssen, S.A. Validity and reliability of the 20 meter shuttle run test in military personnel. Mil. Med. 2011, 176, 513–518. [Google Scholar] [CrossRef] [Green Version]
- Ramsbottom, R.; Brewer, J.; Williams, C. A progressive shuttle run test to estimate maximal oxygen uptake. Br. J. Sports Med. 1988, 22, 141–144. [Google Scholar] [CrossRef] [Green Version]
- Stockbrugger, B.A.; Haennel, R.G. Contributing factors to performance of a medicine ball explosive power test: A comparison between jump and nonjump athletes. J. Strength Cond. Res. 2003, 17, 768–774. [Google Scholar] [CrossRef]
- Marques, M.C.; van den Tillaar, R.; Gabbett, T.J.; Reis, V.M.; Gonzalez-Badillo, J.J. Physical fitness qualities of professional volleyball players: Determination of positional differences. J. Strength Cond. Res. 2009, 23, 1106–1111. [Google Scholar] [CrossRef]
- Lockie, R.G.; Schultz, A.B.; Callaghan, S.J.; Jeffriess, M.D. The effects of traditional and enforced stopping speed and agility training on multidirectional speed and athletic performance. J. Strength Cond. Res. 2014, 28, 1538–1551. [Google Scholar] [CrossRef] [PubMed] [Green Version]
- Stockbrugger, B.A.; Haennel, R.G. Validity and reliability of a medicine ball explosive power test. J. Strength Cond. Res. 2001, 15, 431–438. [Google Scholar] [PubMed]
- Lockie, R.G.; Moreno, M.R.; Lazar, A.; Risso, F.G.; Tomita, T.M.; Stage, A.A.; Birmingham-Babauta, S.A.; Torne, I.A.; Stokes, J.J.; Giuliano, D.V.; et al. The 1-repetition maximum mechanics of a high-handle hexagonal bar deadlift compared to a conventional deadlift as measured by a linear position transducer. J. Strength Cond. Res. 2018, 32, 150–161. [Google Scholar] [CrossRef] [PubMed]
- Stock, M.S.; Thompson, B.J. Sex comparisons of strength and coactivation following ten weeks of deadlift training. J. Musculoskelet. Neuronal Interact. 2014, 14, 387–397. [Google Scholar] [PubMed]
- Thompson, B.J.; Stock, M.S.; Shields, J.E.; Luera, M.J.; Munayer, I.K.; Mota, J.A.; Carrillo, E.C.; Olinghouse, K.D. Barbell deadlift training increases the rate of torque development and vertical jump performance in novices. J. Strength Cond. Res. 2015, 29, 1–10. [Google Scholar] [CrossRef] [Green Version]
- Winwood, P.W.; Keogh, J.W.; Harris, N.K. Interrelationships between strength, anthropometrics, and strongman performance in novice strongman athletes. J. Strength Cond. Res. 2012, 26, 513–522. [Google Scholar] [CrossRef] [Green Version]
- Blazevich, A.J.; Gill, N.D. Reliability of unfamiliar, multijoint, uni- and bilateral strength tests: Effects of load and laterality. J. Strength Cond. Res. 2006, 20, 226–230. [Google Scholar] [CrossRef]
- Keogh, J.; Kattan, A.; Logan, S.; Bensley, J.; Muller, C.; Powell, L. A preliminary kinematic gait analysis of a strongman event: The farmers walk. Sports 2014, 2, 24–33. [Google Scholar] [CrossRef]
- McGill, S.M.; McDermott, A.; Fenwick, C.M. Comparison of different strongman events: Trunk muscle activation and lumbar spine motion, load, and stiffness. J. Strength Cond. Res. 2009, 23, 1148–1161. [Google Scholar] [CrossRef]
- Winwood, P.W.; Cronin, J.B.; Brown, S.R.; Keogh, J.W.L. A biomechanical analysis of the farmers walk, and comparison with the deadlift and unloaded walk. Int. J. Sports Sci. Coach. 2014, 9, 1127–1143. [Google Scholar] [CrossRef] [Green Version]
- Orjalo, A.J.; Lockie, R.G.; Balfany, K.; Callaghan, S.J. The effects of lateral bounds on post-activation potentiation of change-of-direction speed measured by the 505 test in college-aged men and women. Sports 2020, 8, 71. [Google Scholar] [CrossRef] [PubMed]
- Callaghan, S.J.; Lockie, R.G.; Andrews, W.A.; Chipchase, R.F.; Nimphius, S. The relationship between inertial measurement unit-derived ‘force signatures’ and ground reaction forces during cricket pace bowling. Sport Biomech. 2020, 19, 307–321. [Google Scholar] [CrossRef] [PubMed]
- Gamage, J.; Weerahandi, S. Size performance of some tests in one-way ANOVA. Commun. Stat. Simul. Comput. 1998, 27, 625–640. [Google Scholar] [CrossRef]
- Lockie, R.G.; Balfany, K.; Denamur, J.K.; Moreno, M.R. A preliminary analysis of relationships between a 1RM hexagonal bar load and peak power with the tactical task of a body drag. J. Hum. Kinet. 2019, 68, 157–166. [Google Scholar] [CrossRef] [Green Version]
- National Strength and Conditioning Association. NSCA strength and conditioning professional standards and guidelines. Strength Cond. J. 2017, 39, 1–24. [Google Scholar] [CrossRef]
- Spiteri, T.; Hart, N.H.; Nimphius, S. Offensive and defensive agility: A sex comparison of lower body kinematics and ground reaction forces. J. Appl. Biomech. 2014, 30, 514–520. [Google Scholar] [CrossRef]
- Beckham, G.K.; Martin, E.; Layne, D.K.; Luke, R.; Mayhew, J.L. Assessing full body impulsive ability using a range of medicine ball loads for the backward overhead medicine ball throw. Sports Biomech. 2020, 1–12. [Google Scholar] [CrossRef]
- Camara, K.D.; Coburn, J.W.; Dunnick, D.D.; Brown, L.E.; Galpin, A.J.; Costa, P.B. An examination of muscle activation and power characteristics while performing the deadlift exercise with straight and hexagonal barbells. J. Strength Cond. Res. 2016, 30, 1183–1188. [Google Scholar] [CrossRef] [Green Version]
- Stevenson, R.D.; Siddall, A.G.; Turner, P.F.; Bilzon, J.L. Physical employment standards for UK firefighters: Minimum muscular strength and endurance requirements. J. Occup. Environ. Med. 2017, 59, 74–79. [Google Scholar] [CrossRef] [Green Version]
- Orr, R.M.; Lockie, R.; Milligan, G.; Lim, C.; Dawes, J. Use of physical fitness assessments in tactical populations. Strength Cond. J. 2022, 44, 106–113. [Google Scholar] [CrossRef]
- Baur, D.M.; Christophi, C.A.; Tsismenakis, A.J.; Cook, E.F.; Kales, S.N. Cardiorespiratory fitness predicts cardiovascular risk profiles in career firefighters. J. Occup. Environ. Med. 2011, 53, 1155–1160. [Google Scholar] [CrossRef] [PubMed]
- Gledhill, N.; Jamnik, V.K. Characterization of the physical demands of firefighting. Can. J. Sport Sci. 1992, 17, 207–213. [Google Scholar] [PubMed]
- Fryar, C.D.; Gu, Q.; Ogden, C.L.; Flegal, K.M. Anthropometric reference data for children and adults: United States, 2011–2014. Vital Health Stat. 2016, 3, 1–46. [Google Scholar]
- Miller, A.E.J.; MacDougall, J.D.; Tarnopolsky, M.A.; Sale, D.G. Gender differences in strength and muscle fiber characteristics. Eur. J. Appl. Physiol. Occup. Physiol. 1993, 66, 254–262. [Google Scholar] [CrossRef]
- Bloodgood, A.M.; Dawes, J.J.; Orr, R.M.; Stierli, M.; Cesario, K.A.; Moreno, M.R.; Dulla, J.M.; Lockie, R.G. Effects of sex and age on physical testing performance for law enforcement agency candidates: Implications for academy training. J. Strength Cond. Res. 2021, 35, 2629–2635. [Google Scholar] [CrossRef]
- Nazari, G.; MacDermid, J.C.; Sinden, K.E.; Overend, T.J. The relationship between physical fitness and simulated firefighting task performance. Rehabil. Res. Pract. 2018, 2018, 3234176. [Google Scholar] [CrossRef] [Green Version]
- Lockie, R.G.; Moreno, M.R.; Ducheny, S.C.; Orr, R.M.; Dawes, J.J.; Balfany, K. Analyzing the training load demands, and influence of sex and body mass, on the tactical task of a casualty drag via surface electromyography wearable technology. Int. J. Exerc. Sci. 2020, 13, 1012–1027. [Google Scholar]
Figure 1.
Measurements and running direction for the Illinois agility test. Distances are measured in meters (m).
Figure 1.
Measurements and running direction for the Illinois agility test. Distances are measured in meters (m).


Table 1.
Fitness test data (mean ± SD; 95% CI) and between-class comparisons for six trainee academy classes from one fire department. IAT: Illinois agility test; BOMBT: 4.54 kg backwards overhead medicine ball toss; Estimated O2max: maximal aerobic capacity estimated from the 20 m multistage fitness test. Significance was set a priori at p < 0.05.
| Class 1 (n = 29–36; 36 Males, 0 Females) | Class 2 (n = 50–51; 51 Males, 0 Females) | Class 3 (n = 56; 56 Males, 0 Females) | Class 4 (n = 53; 52 Males, 1 Female) | Class 5 (n = 54–55; 40 Males, 15 Females) | Class 6 (n = 54; 39 Males, 15 Females) | |
|---|---|---|---|---|---|---|
| IAT (s) | 17.13 ± 0.87 a (16.79–17.46) | 18.29 ± 2.17 (17.67–18.91) | 18.80 ± 1.00 (18.53–19.07) | 18.72 ± 1.13 (18.41–19.03) | 18.19 ± 1.04 (17.91–18.47) | 18.91 ± 1.27 (18.56–19.26) |
| Push-ups (No.) | 58.57 ± 26.50 (49.47–67.68) | 56.22 ± 22.64 (49.79–62.65) | 65.34 ± 21.87 (59.48–71.20) | 60.51 ± 22.61 (54.28–66.74) | 62.00 ± 24.18 (55.46–68.54) | 66.91 ± 20.97 (61.18–72.63) |
| Pull-ups (No.) | 11.97 ± 6.53 (9.76–14.18) | 11.08 ± 6.77 (9.17–12.98) | 12.88 ± 6.13 (11.23–14.52) | 12.66 ± 5.75 (11.08–14.25) | 11.36 ± 6.60 (9.58–13.15) | 10.28 ± 6.50 (8.50–12.05) |
| BOMBT (m) | 10.33 ± 1.58 b (9.75–10.90) | 9.48 ± 1.16 (9.16–9.81) | 9.66 ± 1.54 c (9.24–10.07) | 10.24 ± 1.26 b (9.89–10.59) | 9.07 ± 1.80 (8.58–9.56) | 8.72 ± 2.17 (8.13–9.32) |
| Leg Tuck (No.) | 10.61 ± 5.55 (8.73–12.49) | 11.52 ± 4.85 (10.14–12.90) | 12.46 ± 5.11 (11.09–13.83) | 14.26 ± 5.84 d (12.65–15.87) | 10.98 ± 6.80 (9.14–12.82) | 11.44 ± 5.90 (9.83–13.05) |
| Estimated O2max (mL·kg−1·min−1) | 45.77 ± 5.90 (43.77–47.76) | 46.98 ± 5.45 (45.43–48.53) | 47.13 ± 4.22 (46.00–48.26) | 46.12 ± 6.22 (44.40–47.83) | 45.87 ± 7.03 (43.97–47.77) | 44.08 ± 5.95 (42.46–45.70) |
| 10RM Deadlift (kg) | 153.50 ± 9.34 e (150.08–156.93) | 153.36 ± 10.95 f (150.25–156.47) | 138.02 ± 7.12 (136.11–139.93) | 133.47 ± 12.03 b (130.15–136.78) | 145.26 ± 18.89 (140.10–150.42) | 142.59 ± 17.06 (137.93–147.24) |
| Farmers Carry (s) | 27.65 ± 2.01 (26.91–28.38) | 28.97 ± 4.45 (27.71–30.22) | 31.89 ± 2.94 g (31.11–32.68) | 28.77 ± 4.40 (27.56–29.99) | 27.88 ± 4.05 (26.79–28.98) | 27.59 ± 4.26 (26.43–29.37) |
a Significantly different from Classes 2–6; b Significantly different from Classes 5–6; c Significantly different from Class 6; d Significantly different from Class 5; e Significantly different from Classes 3, 4, and 6; f Significantly different from Classes 3–6; g Significantly different from Classes 1, 2, and 4–6.
Table 2.
Percentile rankings for the Illinois agility test based on six firefighter trainee academy classes from one fire department.
Table 2.
Percentile rankings for the Illinois agility test based on six firefighter trainee academy classes from one fire department.
| Percentile Rank | Range (s) | Males (n = 237) | Females (n = 31) |
|---|---|---|---|
| 91–100 | 16.0–17.1 | 29 | 0 |
| 82–89 | 17.2–17.6 | 25 | 1 |
| 71–79 | 17.7–18.0 | 40 | 1 |
| 61–64 | 18.1–18.2 | 18 | 3 |
| 50–56 | 18.3–18.5 | 25 | 0 |
| 41–47 | 18.6–18.8 | 24 | 1 |
| 31–37 | 18.9–19.1 | 22 | 3 |
| 20–28 | 19.2–19.5 | 25 | 6 |
| 10–16 | 19.6–20.2 | 15 | 7 |
| 0–8 | 20.3–32.0 | 14 | 9 |
Table 3.
Percentile rankings for the metronome push-up test based on six firefighter trainee academy classes from one fire department.
Table 3.
Percentile rankings for the metronome push-up test based on six firefighter trainee academy classes from one fire department.
| Percentile Rank | Range (Repetitions) | Males (n = 238) | Females (n = 31) |
|---|---|---|---|
| 81–85 | 86–100 * | 51 | 2 |
| 72–79 | 75–85 | 20 | 3 |
| 60–69 | 67–74 | 28 | 3 |
| 50–59 | 60–66 | 24 | 4 |
| 41–49 | 53–58 | 23 | 2 |
| 30–38 | 49–52 | 27 | 2 |
| 22–29 | 43–48 | 19 | 2 |
| 10–19 | 33–42 | 30 | 3 |
| 0–8 | 0–32 | 16 | 10 |
* 100 repetition ceiling.
Table 4.
Percentile rankings for the pull-up test based on six firefighter trainee academy classes from one fire department.
Table 4.
Percentile rankings for the pull-up test based on six firefighter trainee academy classes from one fire department.
| Percentile Rank | Range (Repetitions) | Males (n = 238) | Females (n = 31) |
|---|---|---|---|
| 90–100 | 21–28 | 27 | 0 |
| 81–87 | 18–20 | 25 | 0 |
| 74–78 | 16–17 | 18 | 0 |
| 62–68 | 14–15 | 30 | 3 |
| 57 | 13 | 12 | 0 |
| 44–49 | 11–12 | 34 | 3 |
| 34–38 | 9–10 | 25 | 1 |
| 23–29 | 7–8 | 25 | 4 |
| 11–18 | 4–6 | 26 | 6 |
| 0–7 | 0–3 | 16 | 14 |
Table 5.
Percentile rankings for the 4.54 kg backwards overhead medicine ball toss (BOMBT) based on six firefighter trainee academy classes from one fire department.
Table 5.
Percentile rankings for the 4.54 kg backwards overhead medicine ball toss (BOMBT) based on six firefighter trainee academy classes from one fire department.
| Percentile Rank | Range (m) | Males (n = 238) | Females (n = 31) |
|---|---|---|---|
| 90–100 | 11.34–13.84 | 29 | 0 |
| 80–89 | 10.79–11.31 | 26 | 0 |
| 70–77 | 10.36–10.67 | 27 | 0 |
| 60–69 | 9.91–10.30 | 26 | 0 |
| 50–59 | 9.57–9.88 | 27 | 0 |
| 42–49 | 9.17–9.48 | 20 | 0 |
| 30–39 | 8.81–9.14 | 34 | 0 |
| 20–29 | 8.20–8.69 | 23 | 3 |
| 10–19 | 7.10–8.14 | 19 | 8 |
| 0–9 | 4.02–7.07 | 7 | 20 |
Table 6.
Percentile rankings for estimated maximal aerobic capacity from the 20 m multistage fitness test based on six firefighter trainee academy classes from one fire department.
Table 6.
Percentile rankings for estimated maximal aerobic capacity from the 20 m multistage fitness test based on six firefighter trainee academy classes from one fire department.
| Percentile Rank | Range (mL·kg−1 ·min−1) | Males (n = 231) | Females (n = 29) |
|---|---|---|---|
| 90–100 | 53.8–61.2 | 29 | 0 |
| 80–89 | 50.8–53.5 | 25 | 0 |
| 70–78 | 49.2–50.6 | 27 | 1 |
| 60–69 | 48.0–48.9 | 24 | 1 |
| 52–58 | 46.2–47.7 | 19 | 2 |
| 41–49 | 44.9–45.9 | 18 | 3 |
| 32–39 | 44.0–44.6 | 20 | 4 |
| 21–29 | 41.9–43.7 | 25 | 4 |
| 10–19 | 38.5–41.5 | 25 | 5 |
| 0–9 | 20.2–38.1 | 19 | 9 |
Table 7.
Percentile rankings for the leg-tuck test based on six firefighter trainee academy classes from one fire department.
Table 7.
Percentile rankings for the leg-tuck test based on six firefighter trainee academy classes from one fire department.
| Percentile Rank | Range (Repetitions) | Males (n = 238) | Females (n = 31) |
|---|---|---|---|
| 93–100 | 21–30 | 20 | 0 |
| 80–87 | 17–20 | 34 | 1 |
| 77 | 16 | 7 | 0 |
| 63–67 | 14–15 | 37 | 2 |
| 57 | 13 | 14 | 1 |
| 43–49 | 11–12 | 35 | 1 |
| 35 | 10 | 22 | 1 |
| 20–29 | 8–9 | 36 | 3 |
| 10–14 | 6–7 | 20 | 7 |
| 0–8 | 0–5 | 13 | 15 |
Table 8.
Percentile rankings for the 10-repetition maximum deadlift based on six firefighter trainee academy classes from one fire department.
Table 8.
Percentile rankings for the 10-repetition maximum deadlift based on six firefighter trainee academy classes from one fire department.
| Percentile Rank | Range (kg) | Males (n = 237) | Females (n = 30) |
|---|---|---|---|
| 95–100 | 158.76–185.97 | 13 | 1 |
| 72 | 156.49 | 60 | 1 |
| 60–65 | 147.42–154.22 | 29 | 4 |
| 59 | 145.15 | 0 | 1 |
| 33–34 | 140.61–142.88 | 71 | 0 |
| 10–18 | 122.47–133.81 | 53 | 8 |
| 0–9 | 90.72–120.20 | 11 | 15 |
Table 9.
Percentile rankings for the farmers carry test with 18 kg kettlebells over a 91.44 m course based on six firefighter trainee academy classes from one fire department.
Table 9.
Percentile rankings for the farmers carry test with 18 kg kettlebells over a 91.44 m course based on six firefighter trainee academy classes from one fire department.
| Percentile Rank | Range (s) | Males (n = 238) | Females (n = 31) |
|---|---|---|---|
| 92–100 | 21.0–24.0 | 33 | 0 |
| 80–87 | 24.5–25.2 | 22 | 0 |
| 75–79 | 25.3–26.0 | 32 | 0 |
| 65–68 | 26.2–27.0 | 25 | 0 |
| 50–58 | 27.5–28.6 | 23 | 2 |
| 43–49 | 28.7–30.0 | 26 | 6 |
| 33–37 | 30.1–31.0 | 20 | 6 |
| 20–27 | 31.2–33.0 | 24 | 4 |
| 12–17 | 33.2–35.0 | 15 | 6 |
| 0–9 | 35.1–49.0 | 18 | 7 |
Publisher’s Note: MDPI stays neutral with regard to jurisdictional claims in published maps and institutional affiliations. |
© 2022 by the authors. Licensee MDPI, Basel, Switzerland. This article is an open access article distributed under the terms and conditions of the Creative Commons Attribution (CC BY) license (https://creativecommons.org/licenses/by/4.0/).
Share and Cite
MDPI and ACS Style
Lockie, R.G.; Orr, R.M.; Montes, F.; Ruvalcaba, T.J.; Dawes, J.J. Differences in Fitness between Firefighter Trainee Academy Classes and Normative Percentile Rankings. Sustainability 2022, 14, 6548. https://doi.org/10.3390/su14116548
AMA Style
Lockie RG, Orr RM, Montes F, Ruvalcaba TJ, Dawes JJ. Differences in Fitness between Firefighter Trainee Academy Classes and Normative Percentile Rankings. Sustainability. 2022; 14(11):6548. https://doi.org/10.3390/su14116548
Chicago/Turabian StyleLockie, Robert George, Robin M. Orr, Fernando Montes, Tomas Jason Ruvalcaba, and J. Jay Dawes. 2022. "Differences in Fitness between Firefighter Trainee Academy Classes and Normative Percentile Rankings" Sustainability 14, no. 11: 6548. https://doi.org/10.3390/su14116548
Note that from the first issue of 2016, this journal uses article numbers instead of page numbers. See further details here.