
Corporate Nature, Financial Technology, and Corporate Innovation in China


1
School of Economics and Management, Pingdingshan University, Pingdingshan 467000, China
2
College of Business, Gachon University, Seongnam 13120, Korea
*
Author to whom correspondence should be addressed.
Sustainability 2022, 14(12), 7162; https://doi.org/10.3390/su14127162
Submission received: 17 April 2022
/
Revised: 8 June 2022
/
Accepted: 9 June 2022
/
Published: 10 June 2022
(This article belongs to the Special Issue Multinational Enterprises, Sustainability and Innovation)
Abstract
:Corporate innovation has become the main driving force for the long-term development of enterprises, but the characteristics of high risk, long cycle, and high capital demand of corporate innovation activities expose enterprises to high financial rejection. Financial technology, formed by combining digital technology with traditional financial services, is gradually changing the financial service model and providing new ideas for corporate investment and financing. In this study, using the data of non-financial and non-real estate listed companies in Shanghai and Shenzhen markets, A-shares from 2015 to 2020, we examine the effect of financial technology on corporate innovation through a fixed-effects model and investigate the influence of corporate characteristics on the relationship between financial technology and innovation through a moderating-effects model. The results show that financial technology enhances the ability to serve real enterprises by reshaping financial services, which in turn effectively drives an increase in corporate innovation, and the mechanism is conditionally heterogeneous. In addition, the moderating effect of the firm’s nature is found to be more significant in non-state-owned firms, high-technology firms, and firms in the growth and maturity stages by life cycle. The policy implications of this study are to continuously promote theoretical research, to guide the development of fintech, and to improve the construction of financial technology infrastructure. Additionally, to deepen the integration of financial technology with real enterprises and establish differentiated financial technology support tools, so as to improve the precision of promoting enterprise innovation.
1. Introduction
The endogenous driving effect of technological progress [1] argues that corporations can break the restriction of diminishing marginal benefits by improving their technological innovation ability. Technological innovation can effectively improve the production efficiency of enterprises by improving the three labor force factors, and it can also form a new innovative industry by relying on science and technology.
In recent years, science and technology globally have been developing rapidly and new breakthroughs have been made in key areas. Major economies around the world are accelerating the deployment of innovation development strategies, increasing innovation and R&D expenditures, and intensifying competition in the field of innovation [2]. As an important part of the innovation system, the increase in corporate innovation strongly supports the operation of the national innovation system and drives the global technological progress. Although the global spread of the epidemic has negatively impacted a large number of business operations, the overall level of corporate innovation continues to rise, and the number of patents and research investments continue to increase. Enterprises have become the most dynamic sector for global innovation development [3,4].
In China, corporate technological innovation mainly refers to the R&D, technological transformation, technology introduction, and technology promotion activities of enterprises, and the evaluation of corporate technological innovation includes two aspects: technological innovation activities and innovation output capacity; the former is mainly measured by the financial investment of enterprises in various aspects of technological innovation activities, and the latter is mainly measured by the number of corporate patents, which is the most direct and important index to evaluate the technological innovation capacity of enterprises [5]. By 2020, China’s total research and development (R&D) investment exceeded CNY 2.4 trillion, an increase of CNY 224.95 billion or 10.2% over 2019; however, owing to the influence of the COVID-19 outbreak and other factors, the growth rate fell by 2.3% from 2019. The intensity of R&D expenditure (R&D expenditure as a share of GDP) reached 2.40%, an increase of 0.16 percentage points from 2019, a new high over the past 11 years. This indicates that China attaches more importance to the need for independent innovation [6]. By the end of 2020, China’s participating R&D personnel had reached 7.5 million, and the total number of enterprises involved in R&D and innovation activities was 379,409, with a total of 346,491 domestic enterprises. Domestic firms are major players in R&D and innovation activities, accounting for 91.32% of the total number of innovative firms, with a share of over 90%, thus reflecting the strong innovation dynamics and willingness of Chinese firms [7]. In 2020, China’s total R&D spending was approximately 54% of that of the United States and 2.1 times that of Japan, ranking second in the world.
In recent years, China’s technological innovation achievements have grown rapidly, albeit “large quantity but low quality” and “strategic catering” characteristics exist in Chinese corporate technological innovation, which leads to the “low-end locking” dilemma of corporate innovation in the global technology chain [8]. From a financial perspective, the reasons for these are the adverse selection and moral hazard problems that are induced by the essential characteristics of innovation projects, such as high sunk costs, high uncertainty, long cycle time, and information asymmetry [9], which expose firms’ innovation activities to serious external financing challenges and high internal financial risks [10,11]. Then, how to further strengthen the willingness and ability to promote technological innovation of individual micro enterprises in the market and crack the financing dilemma of enterprise innovation becomes an important issue.
Financial technology is a new financial services business model formed by the transformation of modern scientific and technological achievements to innovate the business model and business processes of financial products [12,13], which has great potential in terms of financial services industry profits, regulators’ earnings, and consumers’ welfare [14]. In recent years, with the development of advanced technologies such as big data, cloud computing, and blockchain, the emergence of “finance + technology” (fintech) has provided new ideas for corporate financing [15]. By integrating the abovementioned technological means and combining the business concept of sharing economy, fintech has developed two terminal application models, namely, fintech crowdfunding financing and financial technology lending financing, which present several advantages, such as wide funding channels, full range of financing, and high service quality [16,17,18], which have a profound impact on alleviating financing constraints and enhancing enterprises’ financial stability. Financial technology can enable financial institutions to enhance information identification and screening of enterprises, provide financial support to enterprises with innovative potential, avoid financial mismatches, and improve the efficiency of credit fund usage. Moreover, a digital financial system can provide investors with more information about the current market conditions and industry prospects of investment projects, reducing the cost of information identification for investors and enhancing their willingness to invest [11,13]. As a new product formed by the way of traditional finance and technology enablement, digital finance supported by financial technology can effectively reduce financing costs, lower the financial risks of enterprises, and provide a sustainable and stable economic foundation for technological innovation of micro enterprises by continuously optimizing financial services, breaking down information barriers, and providing personalized products [19]. Digital finance supported by financial technology, as a new product formed by traditional finance through a technology-enabled approach, has a significant impact on the technological innovation of micro enterprises. The development of China’s fintech industry started late. However, with its rapid development speed, China’s financial technology development level has been ranked among the top in the world. According to the “2020 Global financial technology Index Report” published by Findexable, China ranks 21st in the world in overall financial technology strength, while the ranking of companies engaged in financial services as Internet companies shows that Chinese financial technology companies are ranked first in the world in terms of overall strength, with Ant Financial, Jingdong Digital, and Du Xiaoman Financial ranking 1st, 3rd, and 6th, respectively [20,21]. In view of China’s leading position in the world’s financial technology development scale and technology practice, under the general trend of the rapid development of big data, blockchain, artificial intelligence, and other technologies, an in-depth study on financial technology-driven corporate innovation has strong practical value and inspiring significance from a multidisciplinary-cum-intersectional research perspective.
Based on an analysis of the literature and real-world context, we construct a research sample with the data of non-financial non-real estate firms listed in A-shares in China’s Shanghai and Shenzhen markets from 2015 to 2020, to empirically examine the driving role and structural differences of financial technology on corporate innovation. The results show that financial technology can effectively drive corporate innovation and has a stronger promotion effect on substantive innovation than non-substantive innovation. The study further explores the impact of financial technology on innovation of firms with different attributes and in different life cycles through the moderating effect model test, and finds that the nature of firms has a moderating effect in the above impact relationship, and the promotion effect of financial technology on firm innovation is more significant in non-SOEs, high-technology firms, and firms in the growth and maturity stages.
The possible marginal contributions of this study are as follows: first, the driving effect of financial technology on corporate innovation is empirically tested to reveal the differential impact of financial technology on different levels of corporate innovation. Second, the role of the firm’s nature, such as ownership attributes, nature of technology, and stage of life cycle involved, in the relationship between financial technology and firm technological innovation is tested in economic practice. The heterogeneous effects of financial technology on corporate innovation performance are investigated along the lines of information economics theory, credit rationing theory, financial exclusion theory, technological innovation theory, and agency theory.
2. Theoretical Background and Hypotheses
2.1. Financial Technology and Corporate Innovation
Schumpeter [22] proposed a technological innovation theory wherein the optimal reorganization of production factors and conditions was first outlined as innovation and asserted that financial variables could affect economic growth by influencing corporate innovation. Later, Domar [23], Solow [24], and Hicks [25] further refined and developed the theory of economic growth, and they all concluded that the development of financial markets had a positive relationship with corporate technological innovation. The new growth theory of financial markets’ influence on corporate innovation points out that the more mature the financial market development, the lower the possibility of moral hazard in enterprise financing, the smaller the external financing constraints faced by enterprises, and, consequently, the higher the level of firm technological innovation [26,27,28]. Originally proposed by Bettinger [29], financial technology means “combining the expertise of banks with modern management technology and computers”, representing the fusion of finance and technology. The most evident feature that distinguishes it from traditional finance is “technologization”, and the financial services it provides combine several emerging technologies, such as artificial intelligence, big data, blockchain, and cloud computing [10,12], which can significantly reduce the transaction costs of financial services, break the time and space limitations, make information transparent and networked, and effectively alleviate the information asymmetry problem [30]. However, at the same time, the new business form of financial technology has broken through traditional financial regulatory boundaries, increased the difficulty of regulation, and, to some extent, expanded financial risks. Fintech can provide diversified financing methods for enterprises, which can solve the problem of difficult and expensive financing by widening financing channels and accelerating capital flow, as well as effective financial support for enterprises to achieve technological upgrades. It can also enhance the risk tolerance of enterprises, encourage them to invest more effectively in high-risk and high-return projects, and improve their investment efficiency [31]. Finance is a core part of the micro-subject of technological innovation environment, and effective financial supply directly affects the development of technological innovation activities [32]. Based on information asymmetry theory and financial exclusion theory, financial technology uses information technology, such as big data, cloud computing, and artificial intelligence, to improve the problems of high risk premiums and high operating costs of traditional finance due to information asymmetry [14,30,33], provide stable technical support for finance to expand its services, reduce financial exclusion of innovative enterprises, and increase their availability of funds [34]. Based on the abovementioned analysis, this study proposes the following hypothesis:
Hypothesis 1 (H1).
Fintech can effectively improve corporate innovation performance.
2.2. The Moderating Effect of Corporate Nature
Some structural mismatch problems exist in the traditional financial structure in economic activities, as mainly reflected in several aspects, including the nature of enterprise ownership, enterprise technology field, and enterprise life cycle. In the afore-stated analysis, financial technology can effectively promote corporate innovation activities, but its ability to effectively correct the target deviation problem existing in traditional finance and thus improve corporate innovation capacity deserves in-depth investigation. To further decompose the structural differences of enterprises, it is necessary to distinguish enterprises according to their individual characteristics. Many studies have also established that these natures are the main factors that influence corporate innovation activities [35,36,37].
2.2.1. Nature of Enterprise Ownership
The research on financial development, based on agency theory and the monitoring cost perspective, indicates that financial development is conducive to corporate innovation [31]. In the same financial environment, there may be differences in enterprise behavioral preferences and the performances of innovation output, and differences in enterprise ownership may affect the relationship between financial technology investment and innovation. State-owned enterprises (SOEs) have better economic strength and income, and they have national credit as support. Compared with non-SOEs, financial institutions can easily obtain financial support from financial institutions [38]. Moreover, SOEs assume more social responsibilities and undertake major issues of the national economy and people’s livelihoods, and their innovation activities are more inclined toward the main areas of the country. According to agency theory, SOE operators are more interested in their economic or political goals [39], which leads to their preference for projects with short return cycles and reflected performance, while less attention is paid to innovative projects with long return cycles and high risks; their willingness to innovate and financial exclusion is also lower. In contrast, non-SOEs face greater financial exclusion in economic activities and are more active in innovation activities, where the rise of fintech has a greater impact. Based on the abovementioned analysis, this study proposes the following hypothesis:
Hypothesis 2 (H2).
Fintech plays a smaller role in promoting corporate innovation performance in SOEs than in non-SOEs.
2.2.2. Nature of Enterprise Technology
The classification of firms into high-tech and non-high-tech firms when studying their innovation activities allows for a more accurate analysis of their influence mechanisms. The nature of enterprise technology is highly related to the development of innovation activities. The innovation of the high-tech industry is higher, the enterprise itself has a good foundation for innovation, and innovation activities are the main driving force to support the development of enterprises. Compared with non-high-tech enterprises, high-tech enterprises pay more attention to technological development and inherent innovation drive, while innovation itself is characterized by high uncertainty, high risk, and a long cycle, which require long-term sustainable financial support for high-tech enterprises, and the development of fintech can provide more convenient and low-cost financial support for high-tech enterprises. Aghion et al. [40] believe that venture capital institutions would help firms to solve the financing dilemma faced by technological innovation, thus promoting their growth. Han and Gu [41] empirically tested a panel model of data from high-technology industries by measuring the efficiency of innovation in different regions and show that fintech improves the efficiency of technological innovation. Canepa and Stoneman [42] point out that the technological innovation output of high-tech enterprises is more influenced by financial factors than in other industries, as well as the development of local banks [43]. Technological innovation theory considers financial variables as an important component of corporate innovation, and credit support is necessary for the development of corporate innovation [22]. In addition, the demand for innovation and the need for stable credit support is higher in high-technology firms than in non-high-technology firms, and the development of financial technology can meet this demand. Based on the above analysis, the following hypothesis is proposed:
Hypothesis 3 (H3).
Fintech plays a stronger role in promoting high-tech innovation performance than non-high-tech enterprises.
2.2.3. Enterprise Life Cycle
It is difficult to obtain effective financing in the financial market, as it is an activity with both high risk and positive externality. This financing dilemma is more centrally reflected in some specific periods of the enterprise. Based on enterprise life cycle theory, the enterprise can be regarded as an organization with a life state; that is, the enterprise is bound to go through the development stage from germination, growth, and maturity to decline [44]. According to enterprise life cycle theory, in different stages of the life cycle, there are significant differences in various aspects of cash flow, financing constraints, and R&D innovation needs [45,46], and firms at different life cycle stages reflect different characteristics in terms of corporate governance, operations, and finance; thus, firms need to choose varying problem-solving approaches and strategies [47]. When enterprises are in different life cycle stages, the impact of fintech on corporate technological innovation may differ. From the perspective of financing demand and corporate innovation willingness and ability, firms in the growth and maturity stages have stronger willingness and potential to innovate and greater financing demand than firms in the decline stage, but firms in the decline stage have lower expansionary demand, less subjective motivation to innovate, as well as a better operating system and relatively lower external financing demand [48]. Based on financial exclusion and life cycle theory, financial institutions will reduce their support to declining stage firms, and effective financial support can have a great contribution to the development of corporate innovation for growth stage and mature stage firms with high innovation demand. Based on the above discussion, limiting the study of the relationship between fintech and technological innovation to the same cross-sectional time characteristics will result in biased research findings and blunted policy orientation. In view of this, drawing on Ling et al. [35] and Caggese [49], this study introduces a “life cycle” variable into the discussion of fintech promoting corporate innovation and proposes the following hypothesis:
Hypothesis 4 (H4).
Compared with companies in decline periods, fintech plays a stronger role in promoting corporate innovation performance in the growth and maturity periods.
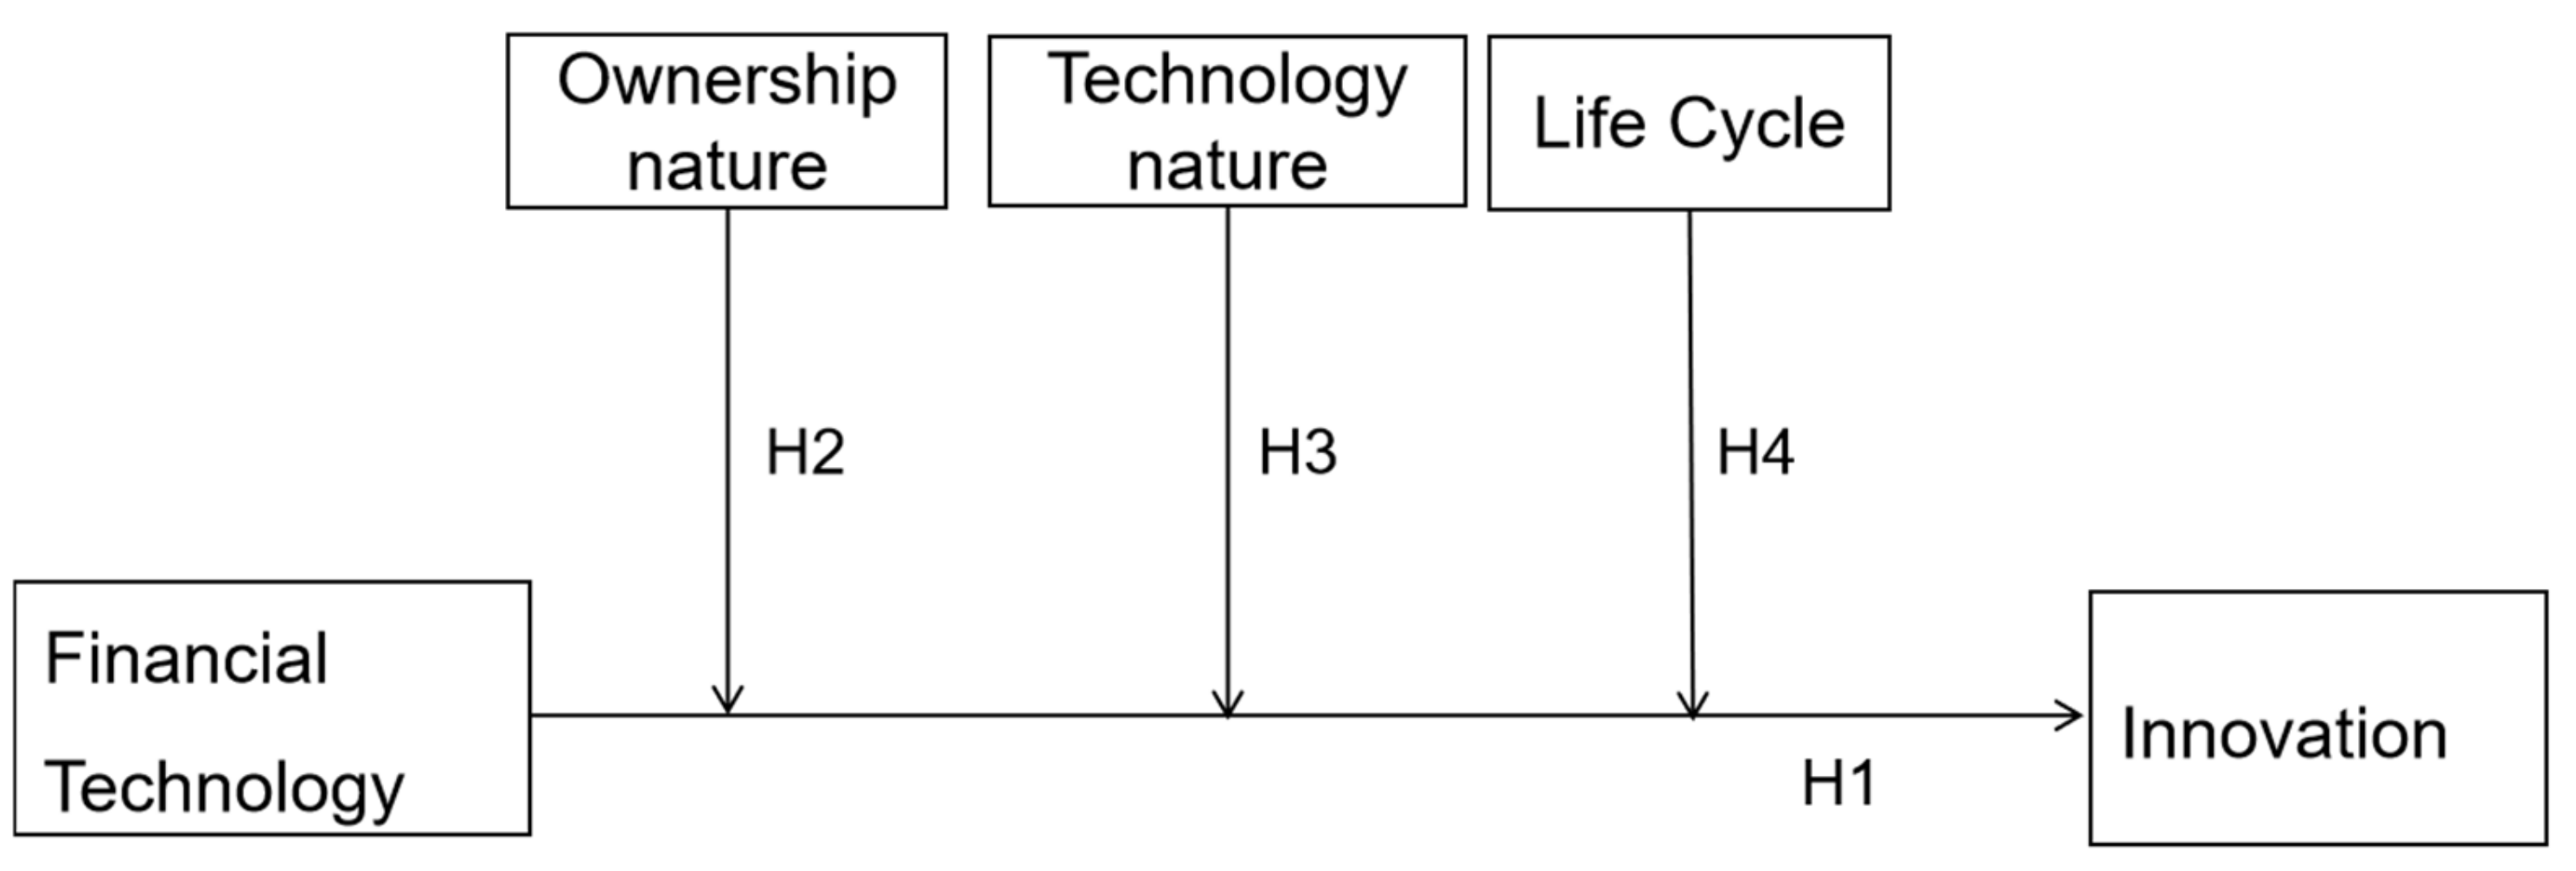
Figure 1 shows the model of this study.
3. Research Methods
3.1. Data and Samples
We constructed a panel dataset of 17,447 firm years from 2015 to 2020 using non-financial and non-real estate companies listed in Shanghai and Shenzhen as the research object. The enterprise-related data were obtained from the China Stock Market & Accounting Research (CSMAR) database. Enterprise patent data were obtained from the Chinese Research Data Services and Wind databases. The fintech proxy variable digital financial index was obtained from the Peking University Digital Inclusive Finance Index 2011–2020. To ensure the reliability of the research data, drawing on previous literature data processing, this study adopts the following data: (1) financial and real estate companies are excluded from the sample; (2) companies with ST, ST*, and PT during the study period were excluded; (3) variables in the data (excluding dummy variables) were winsorized to reduce the impact of outlier fluctuations; (4) samples with missing values were excluded; and (5) continuous variables were logarithmized to mitigate the interference of heteroskedasticity.
3.2. Definition and Measurement of Variables
3.2.1. The Explained Variable
The explanatory variable is firm innovation (Pat). Corporate innovation performance is generally represented by corporate R&D investment, share of intangible assets, and number of patent applications in the current year in previous studies [50,51]. However, due to the essential characteristics of long innovation activity cycles, high uncertainty, and the influence of data disclosure systems, enterprises have certain limitations as proxy variables of innovation performance [52]. Based on this, this study draws on Ling et al. [35] and Zhao et al. [53] to use patent innovation output data as a proxy variable to measure firms’ technological innovation performance. We divide the number of enterprise patents into three levels according to the available enterprise patent application data: (1) the total number of patent applications by enterprise in the current period (Patent); (2) the number of invention patent applications by enterprise in the current period (Pati), to indicate the substantive technological innovation output performance of enterprises; and (3) the total number of utility model patent applications and design patent applications by enterprise in the current period (Patud), which is mainly the number of low-end patent applications, indicating the non-substantial innovation output of enterprises. The group of enterprise innovation variables, denoted by Pat, includes three measurement dimension indicators, Patent, Pati, and Patud. Due to the large variation in the degree of innovation among firms, they were normalized (LnPatent, LnPati, and LnPatud), and the measurements are shown in Table 1.
3.2.2. The Explanatory Variable
3.2.3. The Moderating Variables
Different corporate natures have significant differences in various aspects of their business objectives, innovation areas, and capital needs. Drawing on the studies of Caggese [49], Guo et al. [56], and DeAngelo et al. [57], we selected here the natures of corporate ownership and technology, as well as the corporate life cycle as moderating variables.
The Nature of Corporate Ownership
Soe, the nature of enterprise ownership, is classified according to the nature of enterprise equity in the CSMAR database. A dummy variable is used, and it takes a value of 1 when the enterprise is state-owned; otherwise, it is 0.
The Nature of Enterprise Technology
The definition of “high technology industry”, first proposed by the Organization for Economic Cooperation and Development to make high-technology industry research internationally comparable, is divided into six industries: aerospace manufacturing, pharmaceutical manufacturing, computer and office equipment manufacturing, electrical machinery manufacturing, scientific instruments and instruments manufacturing, and electronic and communication equipment manufacturing. To accurately reflect the development of high-tech industries and improve the statistical system of high-tech industries, China has released the “Classification of High-tech Industries (Manufacturing) (2017)”, and added the information on chemical manufacturing industry to the “China High-tech Industries Statistical Yearbook.” Meanwhile, the proportion of the tertiary industry in the national economy is gradually increasing, and several high-tech service industries, such as electronic information and professional and technical services, have developed rapidly in recent years, which has significantly altered the production and lifestyle of enterprises and residents. According to the “Classification of High-Technology Industries (Service Industry) (2018)” by the State Council of China, high-tech service industry is a collection of service activities using high-tech means for society, including information services, e-commerce services, inspection and testing services, high-tech services of professional and technical service industry, R&D and design services, science and technology achievement transformation services, intellectual property and related legal services, environmental monitoring and governance services and other high-tech services, and so on, in nine categories. This study draws on the treatment method of Lin et al. [58] on high-tech industry classification, and corresponding to the “Industry Classification Guidelines of Listed Companies (2012 Revision)”, a total of 13 industries were selected as high-tech industries, with a value of 1, while other industries have a value of 0.
Enterprise Life Cycle
In the literature, with Chinese listed companies as the research sample, considering the strict requirements of the listing terms on enterprise profitability and establishment period, scholars generally believe that the sampled companies have passed the start-up period; thus, only the three divided stages of growth, maturity, and decline are retained. The academic circle has different definition standards regarding enterprise life cycle, but overall, they can be divided into the following three categories: single variable analysis, comprehensive financial index, and cash flow model methods. The cash flow method is more practical and exogenous than the single variable analysis and the financial composite index methods, and cash flow reflects the core vitality of the enterprise, which can comprehensively reflect the level of resource allocation, the strength to cope with risks, and the difference in the operating status of the enterprise in different growth stages [45]. This study adopts the cash flow-based classification method proposed by Dickinson [44] to judge the symbol of the life cycle proxy variable (Lifecycle) of the sample companies according to the requirements of Chinese listed companies (the specific results are detailed in Table 1). The start-up and growth periods are categorized as the growth period of the firm, and both the decline and elimination periods are categorized as the decline period of the firm. As the demand for external capital is higher in the growth and maturity periods than in the recession period, the demand for productivity improvement and increased innovation capacity is also higher in the growth and maturity periods than in the decline period. Therefore, the impact of fintech development on firms in the growth and maturity periods is significantly different from the impact on firms in decline. Based on the findings of Akcigit and Kerr [59], Chiang et al. [60], and Caggese [49] for fintech, digital finance, and the differences in firms’ demand for external funding in different life cycles, dummy variables were set. The value is 1 for firms in the growth and maturity stages, and 0 for firms in the decline stage.
3.2.4. Control Variables
According to the relevant literature, this study has added a series of variables that can influence corporate innovation [61,62]. The variables include enterprise size (Size), year of enterprise (Age), asset-liability ratio (Lev), equity concentration (SD), net profit growth rate (PG), capital intensity (CD), and enterprise growth capacity (Growth). Owing to the large differences in enterprise technological innovation level between the different industries, we introduce the industry effect (Industry), a dummy variable that takes a value of 1 if the enterprise belongs to this industry and 0 otherwise. With the change in the macro environment and policy, the level of technological innovation may have a large difference in each year; therefore, we introduce the year effect (Year) to set a dummy variable; if the company is in the year, the value is 1, otherwise it is 0. Table 2 shows he variable names and definition of this study.
3.3. Model Design
3.3.1. Benchmark Model
To analyze the impact of fintech on corporate innovation, based on the previous theoretical analysis and research hypotheses as well as with reference to the research of Makosa et al. [63], this study sets the following panel econometric model:
In the regression, Equation (1), subscripts i and t indicate the individual enterprise and year, respectively. The explained variable is the corporate innovation performance (Pat) of the enterprise; in the variable group Pat, three variables are included: overall innovation by enterprise (Patent), substantial innovation by enterprise (Pati), and non-substantial innovation by enterprise (Patud). The core explanatory variable is Fintech. To avoid endogeneity and reverse causality problems and to consider the lagged effect of Fintech on innovation activities, this study treats Fintech with a one-period lag (Fintech−1)). Control indicates a series of control variables that affect corporate innovation. In addition, to reduce the impact of individual heterogeneity and year characteristics on corporate innovation performance, this study considers industry fixed effects μi and year fixed effects γt, in addition to individual effects, to eliminate the effects of time-invariant corporate characteristics and time-invariant macroeconomic environment. ε is the model’s random error term.
3.3.2. Moderation Effect Model
To further verify the influence mechanism of heterogeneous enterprise nature on the role of fintech in promoting corporate innovation, the interaction term of enterprise nature variables and fintech was added to the benchmark regression model [55]. The following model was constructed:
Model (2) indicates that, based on Model (1), the corporate ownership nature variable Soe is added, and Model (3) represents the interaction term Fintech−1*Soe, with the nature of the firm’s ownership based on Model (2). Soe takes a value of 1 when the firm is state-owned and 0 when it is non-state-owned. If the coefficient β3 of the interaction item (Fintech−1*Soe) in Model (3) is negative and can pass the significance test, Fintech is less effective in promoting innovation in SOEs than in non-SOEs. Conversely, the role of Fintech in promoting firm innovation is considered to be stronger in SOEs.
Models (4) and (5) are based on Model (1), with the addition of the technology nature variable (Tech) and the interaction term (Fintech−1*Tech) between fintech and firm technology nature, in turn. Tech takes the value of 1 when the sample firm is a high-technology firm and 0 when the sample firm is a non-high-technology firm. If the coefficient φ3 of Fintech−1*Tech in Model (5) is positive and passes the significance test, it indicates that compared to non-high-tech firms, fintech is a stronger contributor to corporate innovation in high-tech firms.
Similarly, Models (6) and (7) add the enterprise life cycle variable (Life) and the interaction term between Fintech and enterprise life cycle (Fintech−1*Life), respectively, based on Model (1). When Life takes a value of 1, it means that the firm is in the growth and maturity stages; when Life takes a value of 0, it means that the firm is in the decline stage. If the coefficient, γ3, of Fintech−1*Life in Model (7) is positive and can pass the significance test, it means that the greater the contribution of Fintech to the innovation performance of the firm in the growth and maturity stages relative to the declining-stage firms, and vice versa, the greater the contribution of Fintech to the innovation of the firm when it is in the declining stage.
4. Empirical Analysis Results
4.1. Descriptive Statistics and Correlations
Table 3 presents the descriptive statistics. The mean value of the overall innovation performance index (Lnpatent) is 2.478, the median value is 2.565, the standard deviation is 1.682, the maximum value is 6.650, and the minimum value is 0. This indicates that there is a significant difference in the overall level of innovation performance among the sample firms, and the fact that the median is higher than the mean also reflects to a certain extent that the level of innovation of the firms is more concentrated in the low-level stage. There are also significant differences between firms’ substantive innovation (Lnpati) and firms’ non-substantive innovation (Lnpatud), and the difference between firms’ substantive innovation is slightly smaller than that of non-substantive innovation. The mean value of Fintech is 5.724, with a standard deviation of 0.192, which shows that the level of Fintech development varies greatly among provinces. For the enterprise nature variables, the mean value of Soe is 0.318, with a standard deviation of 0.466, the mean value of Tech is 0.425, with a standard deviation of 0.494, while the mean value of Life is 0.803, with a standard deviation of 0.398, indicating that there are significant differences in the individual characteristics of the sample companies. From the descriptive statistical results given above, the value range of the variables selected in this study is within reason, and there are no evident outliers or indicators that mainly violate the regression hypothesis, while the selected samples meet the requirements of the present study.
Before testing the impact of fintech on corporate innovation, the correlation among variables is preliminarily evaluated, judging whether there are multicollinearity problems and obtaining the Pearson correlation coefficient table (Table 4). In Table 4, the correlation coefficient of Fintech and the three dimensions of corporate innovation (Lnpatent, Lnpati, and Lnpatud) are 0.029, 0.031, and 0.0103, respectively, and pass the significance test, which can initially verify the correctness of the previous hypothesis. From the correlation analysis of the variables, the correlation coefficients between the variables are all below 0.8, indicating that the variables are relatively independent and there is no problem of multicollinearity, which has less influence on the errors arising from the subsequent regression analysis.
4.2. Analysis of the Empirical Results
4.2.1. Fintech and Corporate Innovation
According to the Hausman test results, the p-value is less than 0.05; therefore, this study chooses a fixed-effects model regression that controls for both year and industry fixed effects. Table 5 reports the results of the benchmark regression test for fintech and corporate innovation.
In Columns (1)–(3) of Table 5, the regression coefficients of Fintech−1 are found to be significantly positive, regardless of the level of technological innovation activities of enterprises, thereby indicating that the development of Fintech has a significant contribution to the patent innovation performance of enterprises. However, the magnitude and significance of the coefficient of Fintech (Fintech−1) in Column (3) are slightly lower than those of the previous two, indicating that the impact of the non-substantive patent innovation level on Fintech development enterprises is slightly weaker than that of substantive innovation. Second, the regression coefficients of Fintech−1 on total corporate innovation and corporate substantive technological innovation in Columns (4)–(6) are 0.435 and 0.502, respectively, both of which are significantly positive at the 1% level, indicating that the development of fintech can significantly enhance the performance of corporate substantive technological innovation. However, the regression coefficients on the level of corporate non-substantive patent innovation (Lnpatud) regression coefficients are positive at the 10% level of significance, indicating that the impact of fintech development on firms’ non-substantive innovation is slightly smaller than that of substantive innovation. The results indicate that the positive contribution of fintech to technological innovation activities in these three dimensions remains robust. This indicates that the increase in corporate innovation performance, especially the increase in firms’ substantive creativity, can be effectively promoted through the development of fintech, thus supporting H1.
4.2.2. The Moderating Effect of Corporate Nature on Fintech for Corporate Innovation
The operating objectives of enterprises with different natures are inconsistent. Facing the role of fintech under the same conditions, there may be differences in enterprise behavioral preference and its innovation output performance. Based on previous theoretical analysis and literature [6,64,65,66], enterprises are divided based on three different attributes—SOEs and non-SOEs (Soe), high-tech and non-high-tech enterprises (Tech), and enterprises with different life cycles (Life)—to identify the differential innovation-driven impact of Fintech on firms with different attributes.
Nature of Corporate Ownership
Table 6 reports the regression results of the moderating role of heterogeneous firm ownership attributes in the promotion of firm innovation by Fintech. The results in the table show that in the regression of the total number of corporate innovations (Lnpatent), the coefficient of Fintech−1 in Model (3) is 0.499, while the coefficient of the interaction term between fintech and firm equity attributes (Fintech−1*Soe) is −0.504, and both pass the significance test at the 1% level. The adjusted R2 of Model (3) increases from 0.4777 in Model (2) to 0.4783 after adding the interaction term, indicating that the moderating effect of the nature of corporate ownership on the promotion of corporate innovation by fintech is significant; that is, the promotion of fintech on the overall innovation performance of firms is weaker in SOEs compared to non-SOEs. In the regression of substantive corporate innovation (Lnpati), the coefficient of Fintech−1 in Model (3) is 0.547, while the coefficient of the interaction term (Fintech−1*Soe) between fintech and corporate equity attributes is −0.507, and they both pass the significance test at the 1% level. The adjusted R2 of Model (3) after adding the interaction term increases from 0.4375 in Model (2) to 0.4382, indicating that the moderating effect of corporate ownership nature on the promotion of substantive innovation by Fintech is significant; that is, the promotion of substantive innovation by Fintech in SOEs is weaker in SOEs compared to non-SOEs. In the regression of corporate non-substantial innovation (Lnpatud), the coefficient of the Fintech index (Fintech−1) in Model (3) is 0.253, which passes the 5% significance test, and the coefficient of the interaction term Fintech−1*Soe between the Fintech index and corporate equity attributes is −0.417, and it passes the significance test at the 1% level; after adding the interaction term, the adjusted R2 of Model (3) increases from 0.4658 in Model (2) to 0.4662, indicating that the moderating effect of corporate equity properties on the promotion of corporate non-substantive innovation by Fintech is significant; that is, the promotion of corporate non-substantive innovation by Fintech is weaker in SOEs compared to non-SOEs.
The regression results presented above show that the nature of enterprise ownership has a significant moderating effect on the promotion of corporate innovation performance at all three levels of fintech; that is, the promotion of corporate innovation by fintech is weaker in SOEs than in non-SOEs, thus supporting H2.
Technical Nature of the Enterprise
Table 7 reports the regression results on the moderating role of heterogeneous firm technology properties in fintech-driven corporate innovation. The results show that in the regression of the total number of corporate innovations (Lnpatent), the coefficient of Fintech index (Fintech−1) in Model (5) is 0.475, and the coefficient of the interaction term (Fintech−1*Tech) between Fintech and firm technology nature is 0.742, and they both pass the significance test at the 1% level. Then, the adjusted R2 value increases from 0.4678 in Model (4) to 0.4693 in Model (5) after the inclusion of the interaction term, indicating that the moderating effect of the nature of firm technology on the promotion of corporate innovation by fintech is significant; that is, compared with non-high-tech enterprises, high-tech enterprise fintech plays a stronger role in promoting the overall innovation performance of enterprises. In the regression on firm substantive innovation (Lnpati), the coefficient of the fintech index (Fintech−1) in Model (5) is 0.526, while the coefficient of the interaction term (Fintech−1*Tech) between fintech and firm equity attributes is 0.622, and they both pass the significance test at the 1% level. The adjusted R2 value increases from 0.4215 in Model (4) to 0.4228 in Model (5) after adding the interaction term, indicating that the moderating effect of the nature of firm technology on the promotion of substantive innovation by Fintech is significant; that is, compared to non-high-tech firms, the promotion of substantive innovation performance by Fintech in high-tech firms is stronger. In the regression of firms’ non-substantial innovation (Lnpatud), the coefficient of the fintech index (Fintech−1) in Model (5) is 0.235, which passes the 5% significance test, while the coefficient of the interaction term (Fintech−1*Tech) is 0.814 and passes the significance test at the 1% level, and the value of R2 increases from 0.4591 in Model (4) to 0.4661 in Model (5) after adding the interaction term. The value of R2 increases from 0.4591 in Model (4) to 0.4661 in Model (5) after adding the interaction term, indicating that the moderating effect of the nature of firm technology on the promotion of non-substantial innovation by fintech is significant, meaning that the contribution of fintech to the non-substantial innovation performance of firms is stronger in high-tech firms compared to non-high-tech firms.
The regression results presented above show that, regardless of the level of innovation performance of the explained variables, the promotion effect in high-tech enterprises is stronger than that in non-high-tech enterprises; that is, compared to non-high-tech firms, the contribution of fintech in high-tech firms to firms’ innovation performance is stronger, thus supporting H3.
Enterprise Life Cycle
When an enterprise is in different life cycle stages, its investment, financing, and operational funds show significant differences, and the business purpose of the enterprise is also different. Innovation activities indicate different aspects for each stage of the firm. Table 8 reports the regression results for the moderating role of heterogeneous corporate life cycle attributes in fintech-driven corporate innovation. The results show that in the regression of the total number of corporate innovations (Lnpatent), the coefficient of the fintech index (Fintech−1) in Model (7) is 0.400, while the coefficient of the interaction term (Fintech−1*Life) is 0.387, and they all pass the significance test at the 1% level. Then, the adjusted R2 value increases from 0.4773 in Model (6) to 0.4776 in Model (7) after adding the interaction term, indicating that the moderating effect of the nature of the firm’s technology on the contribution of fintech to the overall innovation of the firm is significant; that is, compared to the declining period firms, the contribution of fintech to the overall innovation performance of the firm is stronger in the growing and maturing period firms. In the regression of substantial corporate innovation (Lnpati), the coefficient of the fintech index (Fintech−1) in Model (7) is 0.454, while the coefficient of the interaction term (Fintech−1*Life) between fintech and the corporate life cycle is 0.294, and they pass the significance test at the 5% level. The adjusted R2 value after adding the interaction term increases from 0.4360 in Model (6) to 0.4361 in Model (7), indicating that the moderating effect of the nature of the firm’s technology on the promotion of substantive innovation by Fintech is significant, which means that the contribution of Fintech to the substantive innovation performance of firms in the growth and maturity periods is stronger than that of firms in the decline period. In the return to corporate non-substantial innovation (Lnpatud), the coefficient of the fintech index (Fintech−1) in Model (7) was 0.166, but it failed the significance test. The coefficient of the interaction term Fintech−1*Life between fintech and corporate life cycle is 0.407, and it passes the significance test at the 1% level, while the adjusted R2 value after adding the interaction term value increases from 0.4657 in Model (6) to 0.4660 in Model (7), indicating that the moderating effect of the nature of firm technology on the promotion of non-substantial innovation by fintech is significant; that is, compared to firms in decline, fintech has a stronger contribution to the non-substantial innovation performance of firms in growth and maturity periods.
Based on the results presented above, it can be seen that regardless of the dimension of patent innovation activities for enterprises, the effect of fintech in promoting corporate innovation in the growth and maturity periods is higher than that of enterprises in the decline period, thus supporting H4.
4.3. Robustness Test
To further verify the robustness of this study’s findings related to the promotion of corporate innovation performance via fintech, the main effects regression of this study is tested for robustness by varying the sample interval and 2SLS.
4.3.1. Test Based on Sample Interval Adjustment
The global COVID-19 outbreak in late 2019 has had a huge impact on social and economic growth in all countries. With the implementation of various restrictive epidemic prevention policies, the operation of enterprises has been greatly restricted. Big data information, contactless service models, and online Internet products have developed rapidly during the COVID-19 pandemic. Fintech can use its Internet technology to provide more diversified financial products and services to demanders without contact. Therefore, in 2020, an important period after the COVID-19 outbreak, notable differences in the production, operation, and technological innovation of enterprises as well as the development of fintech were evident. The sample observation value may lead to bias in the study findings; therefore, this study uses sample firms excluding 2020 to conduct robustness tests to verify the reliability of the abovementioned empirical analysis findings.
Table 9 reports the regression analysis results of fintech promoting corporate innovation after excluding the sample of enterprises in 2020. As can be seen from the results of Columns (1)–(3), the regression coefficients of fintech on the overall innovation level, substantive innovation, and non-substantive innovation are 0.517, 0.521, and 0.288, respectively, all of which pass the significance test, indicating that fintech has a significant promoting effect on firm innovation, which is consistent with the results of the previous regression analysis.
4.3.2. Test Based on a Two-Stage Least Squares Model
In this study, when benchmark regressions are used to study the impact of fintech on corporate innovation performance, endogeneity problems may arise due to differences in the selection of control variables, omitted variables, and reciprocal causality. According to previous research, fintech development can effectively enhance firms’ innovation performance, but the enhancement of firm innovation may also affect the level of fintech development. To avoid the reverse causality problem, this study uses the lags of fintech as explanatory variables for fixed effects regression, but it is necessary to conduct further endogeneity tests on the model to make the research results more credible. Therefore, this study uses 2SLS regression with a lagged second period of Fintech (Fintech-t-2) as the instrumental variable. The 2SLS regression is conducted using the same test for the identifiability of instrumental variables and the presence of weak instrumental variables.
Table 10 presents the 2SLS regression results. The results show that at a significance level of 1%, the regression coefficient of Fintech−1 on the overall innovation performance of enterprises is 9.752, and the regression coefficient increases after solving the endogenous nature of variables, indicating that the development of fintech has a significant effect on promoting corporate innovation performance. At the 5% significance level, the regression coefficient of fintech on firms’ substantive innovation is 8.676, and the regression coefficient of fintech on firms’ non-substantive innovation is 8.576; that is, fintech significantly contributes to corporate innovation, and its contribution to firms’ substantive innovation is stronger than that of non-substantive innovation. The benchmark regression results with the inclusion of instrumental variables are generally consistent, further indicating the reliability of the results. Moreover, in Table 10, the Kleibergen–Paap rk LM statistic for Models (1)–(4) is 259.802, which corresponds to a p-value of 0, indicating that the instrumental variables are identifiable. Meanwhile, the Cragg–Donald Wald F statistic of 387.686 is much larger than the Stock–Yogo weak ID test critical values at the 10% level of judgment of 16.38; thus, there is no weak instrumental variable problem.
5. Discussion and Conclusions
5.1. Discussion
The rapid development of digital technology has promoted the integration of finance and technology, giving rise to a series of new financial business models. The study found that the development of fintech has reduced the financing dilemma faced by innovative subjects, further enhanced enterprises’ willingness to innovate technology, and enabled technological innovation. We argue that, first, fintech fills the gaps in traditional financial services. Financial institutions can provide more diversified and personalized financial services for enterprises, enabling them to obtain a more stable flow of funds to support their innovation projects and achieve the optimal allocation of financial resources [18]. Second, the development of financial technology can effectively crack the information asymmetry within enterprises, between enterprises, and between enterprises and financial institutions. It enhances the information recognition ability of enterprises, helps them judge the innovation direction and market potential, as well as maintain customers, etc., and improves the efficiency of enterprise innovation decisions [19,33]. Furthermore, due to the profit-seeking nature of capital, firms will pay more attention to the improvement of core innovation competitiveness and focus their resources on these innovation activities, with little impact on those non-substantial innovations with less economic potential (e.g., utility model patents and design patents) [30].
Differences in corporate nature lead to large differences in business goals, innovation motivation, and innovation behavior, and such differences can similarly affect the role of fintech in driving corporate innovation [6,65]. We argue that SOEs are more likely to receive policy support than non-SOEs, and that the incentives they receive from fiscal, tax, and subsidy sources expose them to lower financial exclusion from traditional financial services [36]. Therefore, the impact of fintech on SOEs’ economic activities has clear boundary limits [38,39]. In terms of technological nature, high-tech enterprises face fiercer competition than non-high-tech enterprises, have stronger technology development requirements and an intrinsic innovation drive, and pay more attention to the improvement of innovation capability, which makes high-tech enterprises have higher requirements for long-term sustainable funding, and the development of fintech effectively meets this demand [42]. From the perspective of enterprise life cycle, enterprises in the growth stage develop rapidly and have high innovation creativity, but lack sufficient funds to transform into real innovation results. Firms at this stage have higher technological and operational risks, growth in earnings lags behind revenue growth, and external investors are more cautious or require higher risk premiums, limiting the possibility of obtaining funding. Therefore, firms in the growth stage have a higher degree of demand for financial resources, and the development of financial technology enables investors to more accurately identify the development capabilities of firms and increase the availability of capital [44,47]. Upon entering the maturity stage, the internal organizational structure of enterprises tends to be perfected, management is gradually standardized, market share reaches its highest level, the trend of capital expansion gradually slows down, and the innovation capacity of enterprises reaches its highest level at this stage, where fintech can play its facilitating role more effectively [45]. The differences in the nature of enterprises prompt the development of fintech to consider the differences in the nature of innovation subjects, and through personalized services can effectively play its promotional role, which is of great practical significance for the study of how fintech can promote enterprise innovation.
5.2. Conclusions, Implications, and Limitations Section
This study empirically examines the promoting effect of fintech on corporate innovation and the moderating effect of corporate characteristics by using Chinese A-share non-financial and non-real estate listed companies from 2015 to 2020. The study finds that fintech has a significant facilitative effect on corporate innovation, supporting hypothesis 1. In-depth comparisons reveal that this facilitative effect reflects structural differences, with fintech having a stronger facilitative effect on corporate substantive innovation than non-substantive innovation, extending previous studies in the literature. Further research finds that corporate nature has a moderating effect on the promotion of corporate innovation by fintech. The difference in firm ownership makes the role of fintech in promoting firm innovation weaker in SOEs than in non-SOEs. Differences in technology nature result in differences in firms’ willingness to innovate and financial needs, making the promotion effect stronger for high-tech firms than for non-high-tech firms. Similarly, the promotion effect of financial technology on firm innovation is stronger in firms in the growth and maturity stages than in firms in the decline stage. Hypotheses H2, H3, and H4 are supported.
The findings of this study provide the following theoretical and practical implications for promoting fintech development and enabling corporate innovation. First, it is imperative to accelerate theoretical research on fintech and provide constructive guidance for macro-policy formulation to promote the reform and development of the financial industry. Second, we actively promote the development of financial technology and build a healthy fintech ecosystem to promote the innovation performance of enterprises [67]. The key to the development of financial technology lies in the effective combination of finance and technology, and technology companies and financial institutions should target frontier areas, actively participate in the research of emerging technologies, establish specialized technology research teams, and increase investment in talents and funds, especially strategic resources such as global financial technology talents, patents, and standards. Third, from a life cycle perspective, growing firms need to make full use of fintech to obtain diversified financing channels through new fintech products and services, such as equity and accounts receivable financing [48,66]. Enterprises in the mature stage should face up to their technological shortcomings, promote the integration of financial technology innovation and enterprise technological innovation, and mobilize their innovative energy [68]. For enterprises in decline, we should strengthen the identification function of financial technology for declining enterprises, encourage financial institutions to provide targeted financial support for innovation, and encourage enterprises to actively explore new R&D fields to achieve sustainable development.
There are limitations in the research on the moderating effect of corporate nature in this study, as there are other micro and macro factors on corporate innovation performance, such as financial regulation, regional capital market development level, and regional capital market development level, in the previous literature, which are not fully incorporated in this study and can be explored more deeply and extensively in future research.
Author Contributions
Data curation and draft, Y.G.; methodology, review, and editing, S.J. All authors have read and agreed to the published version of the manuscript.
Funding
This study received no external funding.
Institutional Review Board Statement
Not applicable.
Informed Consent Statement
Not applicable.
Data Availability Statement
Not applicable.
Conflicts of Interest
The authors declare no conflict of interest.
References
- Romer, P.M. Endogenous Technological Change. J. Political Econ. 1990, 98, S71–S102. [Google Scholar] [CrossRef]
- Csedo, Z.; Magyari, J.; Zavarko, M. Dynamic Corporate Governance, Innovation, and Sustainability: Post-COVID Period. Sustainbility 2022, 14, 3189. [Google Scholar] [CrossRef]
- Ma, D.; Yu, Q.; Li, J.; Ge, M. Innovation diffusion enabler or barrier: An investigation of international patenting based on temporal exponential random graph models. Technol. Soc. 2021, 64, 101456. [Google Scholar] [CrossRef]
- Arifin, M.R.; Raharja, B.S.; Nugroho, A.; Aligarh, F. The Relationship Between Corporate Innovation and Corporate Governance: Empirical Evidence from Indonesia. J. Asian Financ. Econ. Bus. 2022, 9, 105–112. [Google Scholar]
- Chen, S.S.; Huang, C.W.; Hwang, C.Y.; Wang, Y.Z. Voluntary disclosure and corporate innovation. Rev. Quant. Financ. Account. 2022, 58, 1081–1115. [Google Scholar] [CrossRef]
- Yang, D.; Wang, J.; Chen, H. Earnings guidance: Market pressure or corporate governance? Evidence from corporate innovation in China. Nankai Bus. Rev. Int. 2021, 12, 409–433. [Google Scholar] [CrossRef]
- Gao, Y.; Lin, R.; Lu, Y. A visualized analysis of the research current hotspots and trends on innovation chain based on the knowledge map. Sustainbility 2022, 14, 1708. [Google Scholar] [CrossRef]
- Guan, J.; Xu, H.; Huo, D.; Hua, Y.; Wang, Y. Economic policy uncertainty and corporate innovation: Evidence from China. Pac.-Basin Financ. J. 2021, 67, 101542. [Google Scholar] [CrossRef]
- Haddad, C.; Hornuf, L. The emergence of the global fintech market: Economic and technological determinants. Small Bus. Econ. 2019, 53, 81–105. [Google Scholar] [CrossRef]
- Leong, K.; Sung, A. Fin tech (Financial technology): What is it and how to use technologies to create business value in fintech way? Int. J. Innov. Manag. Technol. 2018, 9, 74–78. [Google Scholar] [CrossRef]
- Alkhazaleh, A.M.K.; Haddad, H. How does the fintech services delivery affect customer satisfaction: A scenario of jordanian banking sector. Strateg. Change 2021, 30, 405–413. [Google Scholar] [CrossRef]
- Schueffel, P. Taming the beast: A scientific definition of fintech. J. Innov. Manag. 2016, 4, 32–54. [Google Scholar] [CrossRef]
- Lee, I.; Shin, Y.J. Fintech: Ecosystem, business models, investment decisions, and challenges. Bus. Horiz. 2018, 61, 35–46. [Google Scholar] [CrossRef]
- Anagnostopoulos, I. Fintech and regtech: Impact on regulators and banks. J. Econ. Bus. 2018, 100, 7–25. [Google Scholar] [CrossRef]
- Gimpel, H.; Rau, D.; Röglinger, M. Fintech-geschäftsmodelle im visier. Wirtsch. Manag. 2016, 8, 38–47. [Google Scholar] [CrossRef]
- Zavolokina, L.; Dolata, M.; Schwabe, G. The fintech phenomenon: Antecedents of financial innovation perceived by the popular press. Financ. Innov. 2016, 2, 16. [Google Scholar] [CrossRef]
- Cristina, C.V.; Luis, F.A. Fintech and sustainability: Do they affect each other? Sustainbility 2021, 13, 7012. [Google Scholar]
- Valentin, B.; Ana, G.; Manju, P. On the rise of fintechs: Credit scoring using digital footprints. Rev. Financ. Stud. 2019, 32, 3401–3450. [Google Scholar]
- Li, J.W.; Li, N.; Cheng, X. The Impact of Fintech on Corporate Technology Innovation Based on Driving Effects, Mechanism Identification, and Heterogeneity Analysis. Discret. Dyn. Nat. Soc. 2021, 2021, 7825120. [Google Scholar] [CrossRef]
- Chorzempa, M.; Huang, Y. Chinese fintech innovation and regulation. Asian Econ. Policy Rev. 2022, 7, 1–19. [Google Scholar] [CrossRef]
- Takeda, A.; Ito, Y. A review of fintech research. Int. J. Technol. Manag. 2021, 86, 67. [Google Scholar] [CrossRef]
- Schumpeter, J.A. The theory of economics development. J. Political Econ. 1934, 1, 170–172. [Google Scholar]
- Domar, E.D. Capital expansion, rate of growth, and employment. Econometrica 1946, 14, 137–147. [Google Scholar] [CrossRef]
- Solow, R.M. A contribution to the theory of economic growth. Q. J. Econ. 1956, 70, 86–94. [Google Scholar] [CrossRef]
- Hicks, J.R. A Theory of Economic History; OUP Catalogue: Oxford, UK, 1969. [Google Scholar]
- Blackburn, K.; Hung, V. A theory of growth, financial development and trade. Economica 1998, 65, 107–124. [Google Scholar] [CrossRef]
- Wamda; PAYFORT. Fintech in MENA: Unbundling the Financial Services Industry. Findevgateway. Available online: https://www.wamda.com/research/fintech-mena-unbundling-financial-services-industry (accessed on 16 March 2017).
- Gomber, P.; Kauffman, R.J.; Parker, C. On the fintech revolution: Interpreting the forces of innovation, disruption and transformation in financial services. J. Manag. Inf. Syst. 2018, 35, 220–265. [Google Scholar] [CrossRef]
- Bettinger, A. Fintech: A series of 40time shared models used at manufacturers handover trust company. Interfaces 1972, 2, 62–63. [Google Scholar]
- Chowdhury, R.H.; Min, M. Financial market development and the effectiveness of r&d investment: Evidence from developed and emerging countries. Res. Int. Bus. Financ. 2012, 26, 258–272. [Google Scholar]
- Morales, M.F. Financial intermediation in a model of growth through creative destruction. Macroecon. Dyn. 2003, 7, 363–393. [Google Scholar] [CrossRef]
- He, J.; Tian, X. Finance and corporate innovation: A survey. Asia-Pac. J. Financ. Stud. 2018, 47, 165–212. [Google Scholar] [CrossRef]
- Grennan, J.; Michaely, R. Fintechs and the market for financial analysis. J. Financ. Quant. Anal. 2021, 56, 1877–1907. [Google Scholar] [CrossRef]
- Blach, J.; Klimontowicz, M. The determinants of paytech’s success in the mobile payment market: The case of BLIK. J. Risk Financ. Manag. 2021, 14, 422. [Google Scholar] [CrossRef]
- Ling, S.X.; Han, G.S.; An, D.; Akhmedov, A.; Wang, H.; Li, H.; Hunter, W.C. The effects of financing channels on corporate innovation and life cycle in chinese a-share listed companies: An empirical analysis. Sustainbility 2020, 12, 6704. [Google Scholar] [CrossRef]
- Aghion, P.; Van Reenen, J.; Zingales, L. Innovation and Institutional Ownership. Am. Econ. Rev. 2013, 103, 277–304. [Google Scholar] [CrossRef]
- Chi, J.; Liao, J.; Yang, J. Institutional stock ownership and firm innovation: Evidence from China. J. Multinatl. Financ. Manag. 2019, 50, 44–57. [Google Scholar] [CrossRef]
- Borisova, G.; Brockman, P.; Salas, J.M.; Zagorchev, A. Government ownership and corporate governance: Evidence from the eu. J. Bank. Financ. 2012, 36, 2917–2934. [Google Scholar] [CrossRef]
- Shleifer, A.; Vishny, R.W. A survey of corporate governance. J. Financ. 1997, 52, 737–783. [Google Scholar] [CrossRef]
- Aghion, P.; Howitt, P. Some thoughts on capital accumulation, innovation, and growth. Ann. Econ. Stat. 2017, 125/126, 57–78. [Google Scholar] [CrossRef]
- Han, H.Y.; Gu, X.M. Linkage between inclusive digital finance and high-tech corporate innovation performance: Role of debt and equity financing. Front. Psychol. 2021, 12, 4408. [Google Scholar] [CrossRef]
- Canepa, A.; Stoneman, P. Financial constraints to innovation in the uk: Evidence from cis2 and cis3. Oxf. Econ. Pap. 2008, 60, 394–398. [Google Scholar] [CrossRef]
- Benfratello, L.; Schiantarelli, F.; Sembenelli, A. Banks and innovation: Microeconometric evidence on italian firms. Boston Coll. Work. Pap. Econ. 2007, 90, 197–217. [Google Scholar]
- Dickinson, V. Cash flow patterns as a proxy for firm life cycle. Account. Rev. 2011, 86, 1969–1994. [Google Scholar] [CrossRef]
- Chang, J. The economics of crowdfunding. Am. Econ. J. Microecon 2020, 12, 257–280. [Google Scholar] [CrossRef]
- Mclean, R.D.; Zhao, M.X. The Business Cycle, Investor Sentiment, and Costly External Finance. J. Financ. 2014, 69, 1377–1409. [Google Scholar] [CrossRef]
- Greiner, L.E. Evolution and revolution as organizations grow. Harv. Bus. Rev. 1998, 76, 55–64. [Google Scholar] [PubMed]
- Yang, C.; Hua, Y.; Hua, Z. R&D investment along the firm life-cycle: New evidence from high-tech industries. Int. J. Technol. Manag. 2022, 88, 353–388. [Google Scholar]
- Caggese, A. Financing constraints, radical versus incremental innovation, and aggregate productivity. Am. Econ. J. Macroecon. 2019, 11, 275–309. [Google Scholar] [CrossRef]
- Acharya, V.; Xu, Z. Financial dependence and innovation: The case of public versus private firms. J. Financ. Econ. 2016, 124, 223–243. [Google Scholar] [CrossRef]
- Zu, Y.; Zhang, R. Supplier change, market competition and corporate innovation. Eur. J. Innov. Manag. 2022. ahead-of-print. [Google Scholar] [CrossRef]
- Kleinknecht, A.; Montfort, V.; Brouwer, K. The non-trivial choice between innovation indicators. Econ. Innov. New Technol. 2002, 1, 109–121. [Google Scholar] [CrossRef]
- Zhao, J.S.; Li, X.H.; Yu, C.H.; Chen, S.; Lee, C.C. Riding the fintech innovation wave: FinTech, patents and bank performance. J. Int. Money Financ. 2022, 122, 102552. [Google Scholar] [CrossRef]
- Deng, L.R.; Lv, Y.B.; Liu, Y.; Zhao, Y.W. Impact of fintech on bank risk-taking: Evidence from China. Risks 2021, 9, 27. [Google Scholar] [CrossRef]
- Guo, H.; Pan, Z.; Tian, G.G. State ownership and the risk-reducing effect of corporate derivative use: Evidence from China. J. Bus. Financ. Account. 2021, 48, 1092–1133. [Google Scholar] [CrossRef]
- Liu, H.M.; Wu, S.; Zhong, C.W.; Liu, Y. The sustainable effect of operational performance on financial benefits: Evidence from chinese quality awards winners. Sustainbility 2020, 12, 1966. [Google Scholar] [CrossRef]
- DeAngelo, H.; DeAngelo, L.; Stulz, R.M. Seasoned equity offerings, market timing, and the corporate lifecycle. J. Financ. Econ. 2010, 95, 275–295. [Google Scholar] [CrossRef]
- Lin, R.H.; Xie, Z.Y.; Hao, Y.H.; Wang, H.J. Improving high-tech corporate innovation in big data environment: A combinative view of internal and external governance. Int. J. Inf. Manag. 2020, 50, 575–585. [Google Scholar] [CrossRef]
- Akcigit, U.; Kerr, W.R. Growth through heterogeneous innovations. J. Political Econ. Univ. Chic. Press 2018, 126, 1374–1443. [Google Scholar] [CrossRef]
- Chiang, S.; Lee, P.; Anandarajan, A. Corporate governance and innovative success: An examination of the moderating influence of a firm’s life cycle stage. Innov. Manag. Policy Pract. 2013, 15, 500–514. [Google Scholar] [CrossRef]
- Hasan, I.; Hoi, C.K.S.; Wu, Q.; Zhang, H. Is social capital associated with corporate innovation? Evidence from publicly listed firms in the US. J. Corp. Financ. 2020, 62, 101623. [Google Scholar] [CrossRef]
- Jin, S.; Gao, Y.Y.; Xiao, S. Corporate governance structure and performance in the tourism industry in the COVID-19 pandemic: An empirical study of Chinese listed companies in China. Sustainbility 2021, 13, 11722. [Google Scholar] [CrossRef]
- Makosa, L.; Sun, J.; Bonga, W.G.; Jachi, M.; Sitsha, L. Does economic policy uncertainty aggravate financial constraints? S. Afr. J. Account. Res. 2021, 35, 151–166. [Google Scholar] [CrossRef]
- Wang, R.; Ma, S.; Xu, X.; Song, P. Heterogeneous shareholders participation, COVID-19 impact, and innovation decisions of state-owned firms: Evidence from China. Sustainbility 2021, 13, 4406. [Google Scholar] [CrossRef]
- Wang, S. How does stock market liberalization influence corporate innovation? Evidence from stock connect scheme in China. Emerg. Mark. Rev. 2020, 47, 100762. [Google Scholar] [CrossRef]
- Shahzad, F.; Ahmad, M.; Fareed, Z.; Wang, Z. Innovation decisions through firm life cycle: A new evidence from emerging markets. Int. Rev. Econ. Financ. 2022, 78, 51–67. [Google Scholar] [CrossRef]
- Castro, P.; Rodrigues, J.P.; Teixeira, J.G. Understanding FinTech ecosystem evolution through service innovation and socio-technical system perspective. In International Conference on Exploring Services Science; Springer: Cham, Switzerland, 2020; pp. 187–201. [Google Scholar]
- Ryu, S.L.; Won, J. The Value Relevance of Operational Innovation: Insights from the Perspective of Firm Life Cycle. Sustainability 2022, 14, 2058. [Google Scholar] [CrossRef]
Figure 1.
The Study Model.


Table 1.
Combination of the cash flow characteristics of companies in different life cycle periods.
| Life Cycle | Net Cash Flow from Operations | Net Cash Flow from Investments | Net Cash Flow from Financing | |
|---|---|---|---|---|
| Growth period | Start-up | − | − | + |
| Growth | + | − | + | |
| Maturity period | Maturity | + | − | − |
| Recession period | Decline | − | − | − |
| Decline | + | + | + | |
| Decline | + | + | − | |
| Elimination | − | + | + | |
| Elimination | − | + | − |
Note: When cash flows from financing are 0, depending on the characteristics of cash flows from operations and investments, they are included in the maturity, elimination, and decline periods. When the investment cash flow is 0, depending on the characteristics of operating and financing cash flows, the maturity, elimination, and recession periods are included.
Table 2.
Variable Names and Definition.
| Variable | Symbol | Name | Definition |
|---|---|---|---|
| Explained variable | Lnpatent | Total number of enterprise patents | Ln (Total number of enterprise patents in the current period + 1) |
| Lnpati | Substantial innovation performance | Ln (Total number of invention patents of enterprise in the current period + 1) | |
| Lnpatud | Non-substantial innovation performance | Ln (Current period number of utility model patent applications + number of design patent applications + 1) | |
| Explanatory variable | Fintech | Digital finance index | The Digital Inclusive Finance Index of Peking University Digital Financial Research Center, 2011–2020 |
| Moderating variable | Soe | Equity nature of the enterprise | 1 = State-owned enterprise, and 0 = non-State-owned enterprise |
| Tech | Technical nature of the enterprise | 1 = High-tech enterprise 0 = Non-high-tech enterprise | |
| Life | Enterprise life cycle | Cash flow mode method to measure it | |
| Controlled variable | Growth | Enterprise growth ability (%) | Main business income of this period/previous main business income of this period-1 |
| Age | The year of the establishment | (Study year—Establishment year) + 1 | |
| Lev | Asset–liability ratio | Total liabilities/Total assets | |
| SD | Equity concentration | The largest shareholder holds the shareholding proportion | |
| Size | Total assets scale | Natural log of (millions of total assets disclosed in financial statements) | |
| PG | Net profit growth rate | (Current net profit-net profit of the previous period)/previous net profit of × 100% | |
| CD | Capital intensity | The ratio of total assets to operating income |
Table 3.
Descriptive statistics.
| Variable | n | Mean | p 50 | SD | Min | Max |
|---|---|---|---|---|---|---|
| Lnpatent | 17,447 | 2.478 | 2.565 | 1.682 | 0 | 6.650 |
| Lnpati | 17,447 | 1.811 | 1.792 | 1.493 | 0 | 5.969 |
| Lnpatud | 17,447 | 1.850 | 1.792 | 1.609 | 0 | 5.974 |
| Fintech | 17,447 | 5.724 | 5.739 | 0.192 | 5.325 | 6.068 |
| Soe | 17,447 | 0.318 | 0 | 0.466 | 0 | 1 |
| Tech | 17,447 | 0.425 | 0 | 0.494 | 0 | 1 |
| Life | 17,447 | 0.803 | 1 | 0.398 | 0 | 1 |
| Size | 17,447 | 8.411 | 8.251 | 1.249 | 6.228 | 12.29 |
| CD | 17,447 | 2.390 | 1.916 | 1.768 | 0.424 | 11.42 |
| Lev | 17,447 | 0.404 | 0.395 | 0.191 | 0.062 | 0.852 |
| SD | 17,447 | 33.67 | 31.49 | 14.51 | 8.540 | 73.56 |
| PG | 17,447 | −0.251 | 0.050 | 3.557 | −22.00 | 13.27 |
| Growth | 17,447 | 0.173 | 0.091 | 0.546 | −0.790 | 3.735 |
| Age | 17,447 | 19.51 | 19 | 5.461 | 8 | 34 |
Table 4.
Correlation matrix.
| 1 | 2 | 3 | 4 | 5 | 6 | 7 | 8 | 9 | 10 | 11 | 12 | 13 | 14 | ||
|---|---|---|---|---|---|---|---|---|---|---|---|---|---|---|---|
| 1 | Lnpatent | 1 | |||||||||||||
| 2 | Lnpati | 0.903 *** | 1 | ||||||||||||
| 3 | Lnpatud | 0.905 *** | 0.701 *** | 1 | |||||||||||
| 4 | Fintech | 0.029 *** | 0.031 *** | 0.103 *** | 1 | ||||||||||
| 5 | SOE | 0.027 *** | 0.052 *** | 0.036 *** | −0.098 *** | 1 | |||||||||
| 6 | Tech | 0.114 *** | 0.174 *** | 0.009 *** | 0.054 *** | −0.157 *** | 1 | ||||||||
| 7 | Life | 0.088 *** | 0.080 *** | 0.081 *** | −0.067 *** | −0.030 *** | 0.015 ** | 1 | |||||||
| 8 | Size | 0.347 *** | 0.370 *** | 0.324 *** | 0.031 *** | 0.385 *** | −0.205 *** | 0.101 *** | 1 | ||||||
| 9 | CD | −0.153 *** | −0.129 *** | −0.137 *** | −0.058 *** | 0.029 *** | 0.005 *** | −0.099 *** | 0.018 *** | 1 | |||||
| 10 | Lev | 0.161 *** | 0.159 *** | 0.182 *** | −0.012 | 0.266 *** | −0.209 *** | 0.072 *** | 0.516 *** | −0.097 *** | 1 | ||||
| 11 | SD | 0.014 *** | −0.007 *** | 0.048 *** | −0.032 *** | 0.230 *** | −0.141 *** | 0.039 *** | 0.170 *** | −0.068 *** | 0.034 *** | 1 | |||
| 12 | PG | 0.047 *** | 0.042 *** | 0.044 *** | −0.020 *** | −0.017 *** | 0.008 *** | 0.062 *** | 0.043 *** | −0.080 *** | −0.080 *** | 0.053 *** | 1 | ||
| 13 | Growth | 0.063 *** | 0.057 *** | 0.068 *** | −0.047 *** | −0.051 *** | 0.025 *** | 0.069 *** | 0.077 *** | −0.099 *** | 0.062 *** | 0.001 *** | 0.219 *** | 1 | |
| 14 | Age | −0.077 *** | −0.043 *** | −0.081 *** | 0.161 *** | 0.244 *** | −0.127 *** | −0.074 *** | 0.153 *** | 0.023 *** | 0.134 *** | −0.051 *** | −0.025 *** | −0.038 *** | 1 |
Note: n = 17,447; *** p < 0.01, ** p < 0.05.
Table 5.
The impact of fintech on corporate innovation: fixed-effects regression.
| (1) | (2) | (3) | (4) | (5) | (6) | |
|---|---|---|---|---|---|---|
| Variables | Lnpatent | Lnpati | Lnpatud | Lnpatent | Lnpati | Lnpatud |
| Fintech−1 | 0.572 *** (4.20) | 0.606 *** (4.80) | 0.295 ** (2.32) | 0.435 *** (3.75) | 0.502 *** (4.66) | 0.191 * (1.70) |
| Size | 0.711 *** (66.55) | 0.667 *** (67.23) | 0.586 *** (56.70) | |||
| CD | −0.100 *** (−14.51) | −0.074 *** (−11.58) | −0.092 *** (−13.79) | |||
| Lev | −0.329 *** (−4.72) | −0.369 *** (−5.69) | −0.089 (−1.32) | |||
| SD | −0.001 * (−1.92) | −0.002 ** (−2.52) | 0.000 (0.19) | |||
| PG | 0.003 (1.05) | 0.002 (0.56) | 0.003 (1.05) | |||
| Growth | −0.089 *** (−3.57) | −0.067 *** (−2.91) | −0.080 *** (−3.32) | |||
| Age | −0.009 *** (−4.46) | −0.005 ** (−2.57) | −0.008 *** (−4.19) | |||
| Constant | −0.734 (−0.95) | −1.580 ** (−2.20) | 0.188 (0.26) | −5.377 *** (−8.06) | −6.162 *** (−9.95) | −3.769 *** (−5.84) |
| Year FX | Yes | Yes | Yes | Yes | Yes | Yes |
| Industry FX | Yes | Yes | Yes | Yes | Yes | Yes |
| Obs | 13,947 | 13,947 | 13,947 | 13,947 | 13,947 | 13,947 |
| R-squared | 0.267 | 0.206 | 0.302 | 0.478 | 0.434 | 0.468 |
| Adj. R2 | 0.263 | 0.202 | 0.298 | 0.475 | 0.430 | 0.465 |
Notes: t-statistics in parentheses; *** p < 0.01, ** p < 0.05, * p < 0.1.
Table 6.
The regulating role of the ownership nature of enterprises.
| (2) | (3) | (2) | (3) | (2) | (3) | |
|---|---|---|---|---|---|---|
| Variables | Lnpatent | Lnpatent | Lnpati | Lnpati | Lnpatud | Lnpatud |
| Fintech−1 | 0.529 *** (4.53) | 0.499 *** (4.26) | 0.578 *** (5.32) | 0.547 *** (5.03) | 0.278 ** (2.46) | 0.253 ** (2.24) |
| Soe | −0.120 *** (−4.41) | −0.151 *** (−5.36) | −0.165 *** (−6.55) | −0.197 *** (−7.50) | −0.062 ** (−2.34) | −0.088 *** (−3.21) |
| Fintech−1*Soe | −0.504 *** (−4.03) | −0.507 *** (−4.37) | −0.417 *** (−3.44) | |||
| Constant | −6.023 *** (−9.04) | −5.790 *** (−8.66) | −6.582 *** (−10.63) | −6.348 *** (−10.22) | −4.462 *** (−6.92) | −4.269 *** (−6.60) |
| Control | Yes | Yes | Yes | Yes | Yes | Yes |
| Year FX | Yes | Yes | Yes | Yes | Yes | Yes |
| Industry FX | Yes | Yes | Yes | Yes | Yes | Yes |
| Obs | 13,947 | 13,947 | 13,947 | 13,947 | 13,947 | 13,947 |
| R-squared | 0.4810 | 0.4816 | 0.4410 | 0.4418 | 0.4692 | 0.4696 |
| Adj. R2 | 0.4777 | 0.4783 | 0.4375 | 0.4382 | 0.4658 | 0.4662 |
Notes: t-statistics in parentheses; *** p < 0.01, ** p < 0.05.
Table 7.
The moderating effect of the nature of the firm’s technology.
| (4) | (5) | (4) | (5) | (4) | (5) | |
|---|---|---|---|---|---|---|
| Variables | Lnpatent | Lnpatent | Lnpati | Lnpati | Lnpatud | Lnpatud |
| Fintech−1 | 0.468 *** (4.08) | 0.475 *** (4.15) | 0.521 *** (4.91) | 0.526 *** (4.97) | 0.227 ** (2.05) | 0.235 ** (2.12) |
| Tech | −1.246 *** (−6.66) | −1.198 *** (−6.41) | −0.957 *** (−5.54) | −0.917 *** (−5.31) | −1.315 *** (−7.29) | −1.263 *** (−7.01) |
| Fintech−1*Tech | 0.742 *** (6.25) | 0.622 *** (5.67) | 0.814 *** (7.11) | |||
| Constant | −4.790 *** (−7.37) | −4.816 *** (−7.42) | −5.622 *** (−9.36) | −5.645 *** (−9.41) | −3.176 *** (−5.06) | −3.205 *** (−5.12) |
| Control | Yes | Yes | Yes | Yes | Yes | Yes |
| Year FX | Yes | Yes | Yes | Yes | Yes | Yes |
| Industry FX | Yes | Yes | Yes | Yes | Yes | Yes |
| Obs | 13,947 | 13,947 | 13,947 | 13,947 | 13,947 | 13,947 |
| R-squared | 0.4711 | 0.4726 | 0.4251 | 0.4264 | 0.4625 | 0.4645 |
| Adj. R2 | 0.4678 | 0.4693 | 0.4215 | 0.4228 | 0.4591 | 0.4611 |
Notes: t-statistics in parentheses; *** p < 0.01, ** p < 0.05.
Table 8.
The moderating effect of the enterprise life cycle.
| (6) | (7) | (6) | (7) | (6) | (7) | |
|---|---|---|---|---|---|---|
| Variables | Lnpatent | Lnpatent | Lnpati | Lnpati | Lnpatud | Lnpatud |
| Fintech−1 | 0.486 *** (4.18) | 0.400 *** (3.32) | 0.519 *** (4.79) | 0.454 *** (4.04) | 0.256 ** (2.27) | 0.166 (1.42) |
| Life | −0.077 *** (−2.93) | −2.276 *** (−2.80) | −0.058 ** (−2.39) | −1.729 ** (−2.29) | −0.049 * (−1.92) | −2.361 *** (−3.01) |
| Fintech−1*Life | 0.387 *** (2.71) | 0.294 ** (2.21) | 0.407 *** (2.94) | |||
| Constant | −5.966 *** (−8.95) | −5.480 *** (−7.94) | −6.531 *** (−10.53) | −6.161 *** (−9.59) | −4.428 *** (−6.86) | −3.917 *** (−5.86) |
| Control | Yes | Yes | Yes | Yes | Yes | Yes |
| Year FX | Yes | Yes | Yes | Yes | Yes | Yes |
| Industry FX | Yes | Yes | Yes | Yes | Yes | Yes |
| Obs | 13,947 | 13,947 | 13,947 | 13,947 | 13,947 | 13,947 |
| R-squared | 0.4806 | 0.4809 | 0.4395 | 0.4397 | 0.4691 | 0.4694 |
| Adj. R2 | 0.4773 | 0.4776 | 0.4360 | 0.4361 | 0.4657 | 0.4660 |
Notes: t-statistics in parentheses; *** p < 0.01, ** p < 0.05, * p < 0.1.
Table 9.
Robustness test: the regression results of the adjusted sample interval.
| (1) | (2) | (3) | |
|---|---|---|---|
| Variables | Lnpatent | Lnpati | Lnpatud |
| Fintech−1 | 0.517 *** (3.86) | 0.521 *** (4.23) | 0.288 ** (2.22) |
| Size | 0.715 *** (56.28) | 0.666 *** (57.12) | 0.594 *** (48.33) |
| CD | −0.122 *** (−13.66) | −0.093 *** (−11.33) | −0.114 *** (−13.09) |
| Lev | −0.338 *** (−4.15) | −0.391 *** (−5.25) | −0.064 (−0.82) |
| Share | −0.002 *** (−2.65) | −0.003 *** (−3.22) | −0.000 (−0.45) |
| PG | 0.004 (0.69) | 0.000 (0.10) | 0.006 (1.18) |
| Growth | −0.085 ** (−2.44) | −0.067 ** (−2.10) | −0.083 ** (−2.48) |
| Age | −0.011 *** (−4.58) | −0.007 *** (−3.08) | −0.009 *** (−4.00) |
| Constant | −5.667 *** (−7.42) | −6.095 *** (−8.69) | −4.199 *** (−5.68) |
| Year FX | yes | yes | yes |
| Industry FX | yes | yes | yes |
| Obs | 10,813 | 10,813 | 10,813 |
| R-squared | 0.481 | 0.433 | 0.477 |
| Adj. R2 | 0.476 | 0.429 | 0.473 |
Notes: t-statistics in parentheses; *** p < 0.01, ** p < 0.05.
Table 10.
Robustness test: two-stage least squares regression results.
| First Stage | Second Stage | |||
|---|---|---|---|---|
| (1) | (2) | (3) | (4) | |
| Variables | Fintech−1 | Lnpatent | Lnpati | Lnpatud |
| Fintech−2 | 0.077 *** (12.042) | |||
| Fintech−1 | 9.752 *** (2.62) | 8.676 ** (2.53) | 8.576 ** (2.18) | |
| Size | 0.001 (1.001) | 0.450 *** (7.81) | 0.429 *** (8.10) | 0.329 *** (5.79) |
| CD | −0.000 (−1.19) | −0.029 (−1.53) | −0.020 (−1.23) | −0.015 (−0.82) |
| Lev | 0.002 (1.0204) | −0.273 * (−1.68) | −0.282 * (−1.93) | −0.075 (−0.45) |
| SD | 0.000 (0.61) | 0.006 ** (2.16) | 0.003 (1.33) | 0.006 ** (2.01) |
| PG | 0.000 *** (5.05) | −0.018 *** (−3.51) | −0.015 *** (−3.25) | −0.010 * (−1.82) |
| Growth | −0.000 (−1.160) | 0.002 (0.05) | −0.012 (−0.35) | 0.021 (0.50) |
| Age | −0.008 ** (−2.31) | 0.015 (0.38) | −0.007 (−0.21) | −0.004 (−0.10) |
| Year FX | yes | yes | yes | yes |
| Industry FX | yes | yes | yes | yes |
| Obs | 10,582 | 10,582 | 10,582 | 10,582 |
| R-squared | 0.212 | 0.065 | 0.313 | |
| Kleibergen–Paap rk LM statistic | 259.802 (Chi-sq(1) p-value = 0.0000) | |||
| Cragg–Donald F statistic | 387.686 | |||
| Kleibergen–Paap rk Wald F statistic | 237.755 | |||
| 10% maximal IV size | 16.38 | |||
Notes: t-statistics in parentheses; *** p < 0.01, ** p < 0.05, * p < 0.1.
Publisher’s Note: MDPI stays neutral with regard to jurisdictional claims in published maps and institutional affiliations. |
© 2022 by the authors. Licensee MDPI, Basel, Switzerland. This article is an open access article distributed under the terms and conditions of the Creative Commons Attribution (CC BY) license (https://creativecommons.org/licenses/by/4.0/).
Share and Cite
MDPI and ACS Style
Gao, Y.; Jin, S. Corporate Nature, Financial Technology, and Corporate Innovation in China. Sustainability 2022, 14, 7162. https://doi.org/10.3390/su14127162
AMA Style
Gao Y, Jin S. Corporate Nature, Financial Technology, and Corporate Innovation in China. Sustainability. 2022; 14(12):7162. https://doi.org/10.3390/su14127162
Chicago/Turabian StyleGao, Yuying, and Shanyue Jin. 2022. "Corporate Nature, Financial Technology, and Corporate Innovation in China" Sustainability 14, no. 12: 7162. https://doi.org/10.3390/su14127162
Note that from the first issue of 2016, this journal uses article numbers instead of page numbers. See further details here.