Article

Travel Behaviour and Barriers to Active Travel among Adults in Yaoundé, Cameroon

1
MRC Epidemiology Unit, University of Cambridge, Cambridge CB2 0SL, UK
2
Health of Populations in Transition (HoPiT) Research Group, Faculty of Medicine and Biomedical Sciences, University of Yaoundé I, Yaoundé P.O. Box 8046, Cameroon
3
Center for Global Health Research, Kenya Medical Research Institute (KEMRI), Kisumu 40100, Kenya
*
Author to whom correspondence should be addressed.
Sustainability 2022, 14(15), 9092; https://doi.org/10.3390/su14159092
Submission received: 14 May 2022 / Revised: 16 June 2022 / Accepted: 21 July 2022 / Published: 25 July 2022
(This article belongs to the Section Sustainable Transportation)

Abstract

:
The literature on urban travel behaviour in Africa is sparse, limiting our understanding of how urban transport policies respond to human and planetary needs. We conducted a cross-sectional household telephone survey on 1334 participants, using a 24 h time-use diary, to investigate travel behaviour and barriers to active travel (walking and cycling) in Yaoundé, Cameroon. We found that two-thirds of all participants reported at least one trip; the median (IQR) numbers of trips per capita and per participant with trips were 2 (0–3) and 2 (2–3), respectively. The main trip modes were shared taxi (46%), walking (27%), private cars (11%), and motorcycle taxis (10%), with 25%, 56%, and 45% of all participants reporting the use of active, motorised, and public transport, respectively. The mean (IQR) trip duration was 48 (30–60) min; for participants who reported trips, the daily overall and active travel durations were 121 (60–150) and 28 (0–45) min, respectively. Women were less likely to travel, making fewer and shorter trips when they did. Participants in less wealthy households were more likely to travel. The primary barriers to both walking and cycling were the fear of road traffic injuries and the inconvenience of active travel modes. Therefore, local urban transport authorities need to improve the safety and convenience of active mobility and promote gender equity in transport. Restrictions to movements during the COVID-19 pandemic and the relatively small survey sample might have biased our results; thus, a representative travel survey could improve current estimates. More generally, high-quality research on travel behaviours and their correlates is needed in low-resource settings.

Graphical Abstract

1. Introduction

The literature on urban travel behaviours is sparse on the African continent, particularly in central Africa [1]. Since urban travel behaviour reflects the situation of urban transport systems, the lack of knowledge about urban travel behaviour limits our understanding of how urban transport sectors on the continent are responding to access, economic, health, and planetary needs. Climate change, noncommunicable diseases (NCDs), and road traffic injuries are major global problems that disproportionately affect low- and middle-income countries (LMICs) and require urgent actions across the board. Beyond its direct responsibility for road traffic injuries, the transport sector contributes to climate change through greenhouse gas emissions and to NCDs through changes in population exposure to air pollutants, noise, and physical activity [2,3]. Understanding these effects requires data on travel behaviour and how these vary across the population. The lack of information on urban travel behaviour stalls our ability to monitor, evaluate, and predict/model the effects of transport policies. As is argued in the approaches for creating urban indicators, what gets measured gets done [4].
One African country that exemplifies the sparseness of information on urban travel behaviour is Cameroon, which has just over 26 million people. The country has had only one travel survey from one city (Douala) in almost two decades [5]. This raises the question of what evidence guides current urban transport policies in the country. At the same time, the available indicators do not reflect adequate transport planning. For example, there are high and increasing rates of road traffic injuries [6], physical inactivity [7], and air pollution concentrations [8]. These poor transport-related indicators and the lack of basic information on urban travel behaviour and barriers to active travel underscore the need to gather new data and research on urban travel in Cameroon.
We surveyed the travel behaviour characteristics and barriers to active travel (i.e., walking and cycling) of residents of Yaoundé, the capital city of Cameroon. Our specific objectives were, firstly, to describe the individual travel behaviour characteristics of residents of Yaoundé. Secondly, we examined how travel behaviour characteristics differed by demographic and socioeconomic groups. The third objective was to describe the main self-reported factors influencing active travel among residents of Yaoundé.

2. Literature on Travel Behaviour in Africa

Our recent systematic review on the socioeconomic and gendered inequities in travel behaviour in Africa [1] showed that only 3 out of 54 countries (Nigeria, Ghana, and South Africa) had more than 15 studies on travel behaviours; 20 countries with a total of over 225 million people had no traceable published literature. Repeated travel surveys are rare and were only traceable to two cities: Cape Town (2001, 2013, and 2021) and Nairobi (2004, 2013). While other data sources are available for some settings, such as time-use surveys [9] and increasing mobile phone data [10,11], these do not yet substitute for comparable travel behaviour statistics, including trip characteristics. The limited data explain why insights on urban travel in Africa are largely based on small-scale, one-time surveys that may notadequately represent the relevant population.
Time-use surveys are of growing interest in this regard [9,12]. Research from higher-income countries has shown that travel behaviour estimates from these data are comparable to those from travel surveys [13,14]. The United Nations and other high-level equity and development organisations support these surveys because they estimate time spent on all forms of activities, including activities related to domestic and care work, paid work, community work and volunteering, leisure, and travel [15]. Since 1997, 13 African countries have conducted time-use surveys (not including the pilot surveys in two countries). Among the time-use surveys conducted, seven countries were standalone, and six were complete modules of regular household surveys [9]. However, only one study has reported travel behaviours from these data on the continent [16].
In the African context, there is a tendency to generalise across heterogeneous and changing contexts. Often reported is that a large proportion of trips in urban Africa are on foot, albeit the quality of the walking environment is poor—lack of dedicated pedestrian tracks and the competition of the few available paths with two-wheelers and street vendors. Travel surveys report walking trip mode shares close to 70% in many cities, including Douala (Cameroon), Conakry (Guinea), Dakar (Senegal), Niamey (Niger), Addis-Ababa (Ethiopia), Lusaka (Zambia), Kampala (Uganda), and Kisumu (Kenya) [5,17,18].
The second often discussed feature is that congestion occurs at low levels of car ownership, resulting in long, unpredictable tripand daily travel durations for those using motor vehicles [19]. However, we are not aware of any systematic review on the level of congestion in cities. While examples of congested cities are provided, it is not clear if they are representative across the country let alone the continent. For instance, in Nairobi, traffic models estimate that vehicle speeds are 8.3 km/h and 7.6 km/h during the morning and evening peaks, respectively [20]. In Dar es Salaam, average daytime speeds are 8–15 km/h [21], and the duration of a 30 min trip can increase six-fold depending on the traffic conditions in the city [22]. Gonzales et al. [20] argue that congestion occurs in these cities because the road networks are much smaller compared to cities with similar populations in higher-income settings. Road networks generally have limited alternate routes such that everyone is simply stuck when there is a crash or other blockage on one major road.
Finally, there are gender and socioeconomic differences in mobility patterns in Africa. Females make fewer trips and are less likely to travel by car, motorbike (as a driver) or bicycle (as a rider) but more likely to travel by walking and paratransit [1]; their perceived travel barriers include violence and household responsibilities [1,23]. Lower-income households tend to live on the urban periphery and face more challenges in travel [24]. Lower socioeconomic status individuals are more likely to travel by walking, paratransit and bike and less likely to travel by private vehicle [25,26]. There is some limited evidence that lower-income households are less likely to travel or more likely to make fewer trips; it is unclear if total travel time differs by socioeconomic status [1].

3. Materials and Methods

3.1. Study Design

We conducted a cross-sectional household telephone survey in the city of Yaoundé (Cameroon) in August and September 2021. Using a 24 h time-use diary and Computer-Assisted Telephone Interviewing (CATI), we captured the time people spent on different activities including travel activities and modes used for travelling. In addition, we captured information related to the perception of active travel infrastructure and barriers to active travel. The study protocol was approved by the Centre Regional Committee of Ethics for Research on Human Health (Yaoundé) (reference CE No. 2179 CRERSHC/2021). We report the results according to STROBE guidelines [27].

3.2. Setting

The study was based in Yaoundé, the political capital and second-most populous city of Cameroon Its 2021 population was around 4 million. Similarly to most African cities, Yaoundé has a transport landscape that is changing to cope with its increasing size (population and land area), changing land use and urban settlement patterns, and the distribution of socioeconomic activities. Researchers [28] described urbanisation in Yaoundé as being largely uncontrolled and characterised by the spontaneous development of settlements in multiple locations without respect for urban planning rules. The new unplanned human settlement easily strain the provision of public goods and services. The main economic activities in Yaoundé are trade, public service, and diplomatic services. Its GDP per capita is USD 1529, and there are 58 cars and 18 motorcycles per 1000 inhabitants [29].
The city is generally hilly and spread around seven major hills. Although it is located near the equator, the temperatures are moderate and fairly constant (average temperature is 27 °C) because of its high elevation of 750 m above sea level. It has a tropical wet and dry climate, with dusty roads in the dry season when precipitation is at its minimum (19 mm in January) and torrential rains in the wet season when precipitation is at its highest (294 mm in October).
In 2010, the Yaoundé Urban Council estimated that the city had a surface area of 300 square kilometres and a total road network mileage of 2536 km (Figure 1). The urban road network was 752.75 km and is divided as follows: 61 km of national roads, 159 km of main roads concentrated in the city centre, 57 km of secondary roads connecting the city centre to surrounding areas, and 478 km of tertiary roads connecting the surrounding areas. Secondary and primary roads are concentrated in the city’s core, with the latter extending from the Central Business District (CBD) to the periphery.
The residents of Yaoundé travel mainly by personal transport modes such as walking, personal cars, and motorcycles or by public transport modes such as motorcycle taxis and shared taxis. The motorcycle taxis typically transport one or two passengers and run on secondary and tertiary roads, although they often encroach into the CBD. The shared taxis are four-seat vehicles that run mainly on the primary and secondary roads. Taxis are often shared by up to five passengers, who board and alight at different points and negotiate fares based on distances. Other less frequent, transport modes include minibuses and four-seat cars (opeps) used for longer commutes between the CBD and nearby towns.

3.3. Participants

The study population comprised members of households in Yaoundé. We considered individuals as household members if they regularly shared meals, lived together, and pooled all or part of their monetary or other resources. All adult members in the households aged 18+ years who consented to the study were interviewed. We excluded households headed by children under the age of 18 years and potential participants who could not be reached by telephone after three attempts.

3.4. Sampling

Since budget often constrains the sample size of household travel surveys, and there is no consensus on sample size estimation for travel surveys, we considered that a sample size of 1000 households was acceptable for Yaoundé, which has approximately 4 million inhabitants. With an estimated response rate of 50% for telephone surveys in Africa [30], we aimed to contact a minimum of 2000 households.
We sampled particiapnts and collected data in collaboration with the National Institute of Statistics (NIS), a Cameroonian government agency. Samples proportionate to the size of the municipality were selectrd from each of the seven municipalities in Yaoundé. The sampling frame was based on the Fourth Cameroon Household Survey (EC-ECAM4), conducted in 2015 and the Cameroonian DHS-2018 database. We sampled the phone numbers and addresses of 2000 households. Research assistants contacted the households by telephone to obtain consent for participation in the survey.

3.5. Data Collection

Trained research assistants who had previously collected data for other NIS surveys contacted adult family members to obtain their consent. Once the consent was received, the research assistants set a day with the participants to administer the questionnaires by telephone using CATI built on the CSPro 7.4 platform. The NIS has previously used this platform to collect and clean survey data. The data were extracted for further management and analysis in the R statistical software.

3.6. Survey Instruments

Participants provided information on household assets, individual sociodemographic characteristics, and perceived barriers to active travel, as well as completing a 24 h time-use diary.
Previous-day time-use diaries (Table 1) were completed on the day of the appointment. Each diary started at 7 am and covered a full 24 h period in 30 min time slots. For each time slot, the participant reported one primary activity they undertook (“Activity” variable). The “Duration” variable captured how many minutes the activity lasted within the 30 min slot since some activities lasted for less than 30 min or were started in one slot and ended in another. The participant also reported their location (“Location” variable) for each time slot, for example, home, work, or travelling. If they were travelling, the mode of travel was reported under the “Mode of travel” variable. All responses were coded into individual codes a priori.

3.7. Variables

3.7.1. Household Variables

The household characteristics were household size (number of persons and continuous), sex of household head (male and female), age of household head (years), education of household head (≤primary, middle, secondary, and ≥high school), occupation of household head (not employed/not applicable, employed, student, and other), and household socioeconomic status (SES).
The household SES was described using a household wealth index. We composed the wealth index from 15 household asset variables using principal component analysis. The household asset variables were quality of water supply (high, medium, or low), quality of toilet facility (high, medium, or low), quality of cooking facility (high, medium, or low), and own (yes/no) dwelling, electricity, radio, television, landline telephone, computer, refrigerator, watch, mobile phone, bicycle, motorcycle, and car. We used a limited number of variables compared to the DHS [31], but we were able to adequately represent the wealth index for LMICs as recommended by validity studies using shortened, simplified household asset questionnaires [32,33]. We ranked the wealth indices into tertiles (poorer, middle, and richer).

3.7.2. Individual Variables

Individual demographic and socioeconomic characteristics included age (years) and age group (24–, 25–34, 35–44, 45–54, and 55+ years), sex (male, female), occupation (not employed/not an applicable, employed, student, and other), education (≤primary, middle, secondary, and ≥high school), and marital status (never married, formerly married, living together, and married).

3.7.3. Trip Characteristics

Trip characteristics were trip duration and trip mode. A trip was defined as one travel activity or a block of travel activities occurring over contiguous 30 min slots; it could comprise multiple stops and changes of transport modes. The transport modes were walking, bicycle, personal motorcycle, motorcycle taxi, personal car, taxi, bus, and minibus (opep). Only one transport mode was reported for each 30 min slot, and this was the largest vehicle used by the participant during that slot. The trip duration was defined as the total time (minutes) for an entire trip. This resulted from summing the durations of the different legs within a trip. The trip mode was defined as the transport mode used for the longest duration during the trip.

3.7.4. Individual Travel Behaviour

Individual travel characteristics were aggregates of individual trip characteristics for the survey day. These included number of trips (continuous and categorical: 0, 1, 2, 3, or 4+); daily travel duration, defined as the sum of all trip durations by an individual (minutes/day); use of active transport (walking/cycling) (yes/no) and time spent in active transport (minutes/day); use of motorised transport (motorcycle, tricycle, car, taxi, mini-bus, and bus (yes/no)) and time spent using motorised transport (minutes/day); and use of public transport (yes/no) and time spent using public transport (minutes/day). Daily time spent in each transport mode was the sum of all the travel durations in that during the day.

3.7.5. Barriers to Active Travel

Perceived barriers to active travel were perception of the adequacy of primary, secondary, and neighbourhood roads for walking and cycling (very good, good, fair, poor, and very poor). The importance of key barriers to active travel (safety, infrastructure, convenience, time, and weather) was ranked from one through five by each participant.

3.8. Statistical Analysis

We reported the frequencies, means, medians, and interquartile ranges of varaibles for our summary statistics. We reported the means instead of the medians for most skewed variables to avoid uninformative all zero estimates, which could result from the high zero prevalence in many variables. We reported estimates per capita, where the denominator was all survey participants and per participants who travelled where the denominator was only participants who reported at least one trip. We weighted our estimates using post-stratification weights. We derived these weights using population age and sex distributions from the 2018 Cameroon Demographic and Health Surveys. We conducted all analyses in R statistical software using the “svryr” package (version 0.3.1), which allows for weighted survey analyses.

4. Results

4.1. Characteristics of Survey Households and Participants

We surveyed 1199 households in Yaoundé. The median (IQR) household size was three (1–4) persons. Most (72%) of the households were headed by males; 64% of the household heads were employed, and 47% of them had at least a high school education. A third (35%) of the households had access to a vehicle (i.e., at least one household member owning a vehicle) (Table 2). Compared to the 2018 Cameroon Demographic and Health Surveys, our survey captured a lower median household size (3 (1–4) vs. 6 (4–8)), the same proportion of households headed by males (72%), and a higher household vehicle ownership (8% vs. 5% for bicycles, 12% vs. 8% for motorcycles, 21% vs. 18% for cars, and 35% vs. 25% for any vehicle).
A total of 1334 participants were interviewed; most were males (54%). The mean (standard deviation) age of participants was 36 (13) years, with over three-quarters of participants in the <45 years age group. About half (49%) of the participants were married or living with partners, two-thirds had at least a secondary education, and 55% were employed (Table 2).

4.2. Trip Characteristics

A total of 2153 trips were reported by 1334 individuals. Weighted estimates showed that taxis were the most popular trip mode (46%). The next popular trip modes were walking (27%), car (11%), and motorcycle taxi (10%). Compared to males, females were more likely to use taxis and motorcycle taxis but were less likely to use private cars and motorcycles. Walking shares were similar in both sexes. The mean (IQR) trip duration was 48 (30–60) min and was higher in males compared to females (50 (30–60) vs. 45 (30–60) min, p < 0.001) (Table 3). A high proportion of trips were unimodal, with over 80% of shared taxi and motorcycle trips being unaccompanied by any other mode, while only 15% of walking trip stages were accompanying other modes (Table 4).

4.3. Individual Travel Behaviour

4.3.1. Number of Trips

Overall, just above a third (37%) of all participants reported no travel (zero trips). Compared to participants reporting any travel, those reporting no travel were more likely to be females, have a partner, and be from a household with a vehicle or richer households, but less likely to be employed (Table 5).
Of the 847 (66%) participants who reported trips, 13%, 48%, 20%, and 19% reported 1, 2, 3, and 4+ trips, respectively. The median (IQR) trips per capita and per participant who reported trips were 2 (0–3) and 2 (2–3), respectively. Males were more likely to report more trips than females, and residents of poorer households were more likely to report more trips than their richer households counterparts (Table 5).

4.3.2. Use of Active, Motorised, and Public Transport Modes

Any active travel and active travel exceeding 30 min were reported by only 25% and 19% of all participants, respectively. Walking was the main mode of active travel (24.7% of all participants), while cycling was reported by a very small proportion of participants (0.1%). The active travel rate among participants who reported any form of travelling was 38%. The individual characteristics of participants who reported no active travel were similar to those of participants reporting no travel, with the exception that participants with no active travel were more likely to be employed compared to participants with any active travel (Table 6).
Motorised transport use was reported in over half (56%) of all participants, with 39%, 15%, 10%, and 2% of participants reporting the use of taxis, motorcycles, private cars, and public buses, respectively. Less than 1% of participants reported the use of minibuses (opeps). Compared to participants who did not report the use of a motorised vehicle, those who did were more likely to be males, have higher education, and be employed, but they were less likely to be from richer households or households with vehicles (Table 6).
Public transport use was reported by 44% of participants. Compared to those who did not use public transport, users were more likely to be younger, more educated, employed and lived in households without vehicles. Participants in poorer households were likelier to report public transport (Table 6).

4.3.3. Overall Travel Duration and Duration in Active, Motorised, and Public Transport

The mean (lower–upper quartile) daily travel durations per capita and per participant who travelled were 77 (0–120) and 121 (60–150) min. Males and participants living in households with no vehicles reported longer travel durations. Participants in poorer households travelled for longer durations (Table 7).
Active travel times per capita and per participant who reported travel were 18 (0–0) and 28 (0–45) min, respectively. The active travel time was longer in males, younger participants, and those living in households with no vehicles. Participants in poorer households reported longer durations of active travel (Table 7).
Motorised travel durations per capita and per participant who travelled were 56 (0–90) and 88 (30–120) min, respectively. Motorised travel time was longer in males, older participants, participants with higher education and employment, and those in households with cars and motorcycles. Participants in the middle-wealth households travelled for longer durations in motorised transport (Table 7).
Public transport travel duration per capita and per participant who travelled were 43 (0–60) and 67 (0–90) min, respectively. Public transport duration was longer among those in households without vehicles. Participants in richer households travelled for a shorter duration in public transport (Table 7).

4.4. Barriers to Active Travel

4.4.1. Perception of Active Travel Infrastructure

Figure 2 shows the perception of the suitability of different road categories for walking and cycling. For walking, over a third of participants either perceived primary roads as poorly or very poorly designed for walking. They perceived smaller roads as the more suitable roads, with almost no participant perceiving that their neighbourhoods had very poor walking infrastructure. These perceptions were similar in both males and females but compared to those who reported no active travel, those who reported perceived the roads to be in better condition. The perceptions were in the opposite direction for cycling, with over a quarter of participants either perceiving primary roads as poorly or very poorly designed for cycling. Participants perceived smaller roads as less suitable for cycling, with about 60% of them perceiving that their neighbourhoods either had poor or very poor cycling infrastructure. The perceptions of the state of roads for cycling were similar in both males and females but compared to those who reported no active travel, those who reported perceived roads to be less suitable for cycling.

4.4.2. Perception of Key Barriers to Active Travel

Figure 3 shows the perception of major barriers to walking and cycling by sex and active travel status. For walking, participants ranked road injury safety as the primary concern among the key barriers to walking, with almost a quarter of all participants ranking safety concerns in the first position. Females were marginally more concerned about road injury safety for walking than males and the patterns were similar for both those who reported active travel and those who did not. The ranking of barriers was similar for cycling, albeit there was more concern about the cycling infrastructure.

5. Discussion

5.1. Summary of Findings

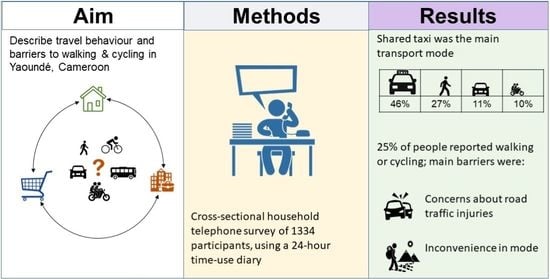
Our study aimed to describe travel behaviour characteristics in Yaoundé, which is the only second detailed account of travel behaviour in a Cameroonian city in nearly two decades. We also investigated the barriers to active travel in the city. Two-thirds of all participants reported at least one trip per day. The main trip modes were taxi (46%), walking (27%), private cars (11%), and motorcycle taxis (10%), with only a quarter of the participants reporting active travel (almost exclusively walking) on that day. The daily travel time per capita was 77 (0–120) min, and the active travel time was 28 (0–45) min in participants who reported trips.
Females were less likely to report trips, and when they did, they reported fewer and shorter duration trips. Their trips were more likely to be made by taxis and motorcycle taxis but less likely by private cars and motorcycles. Overall, females were less likely to use motorised transport, and there was no gender difference in active and public transport use. Males reported longer daily travel durations overall, but their daily travel durations were shorter when we looked at active and public transport.
Participants in richer households were more likely than those in poorer households to report both overall travel and travel in active, motorised, and public transport modes. They also reported a higher number of trips and longer daily travel durations in all modes except motorised transport modes. Notably, participants in households that owned vehicles were less likely to report travel, even in motorised transport modes.
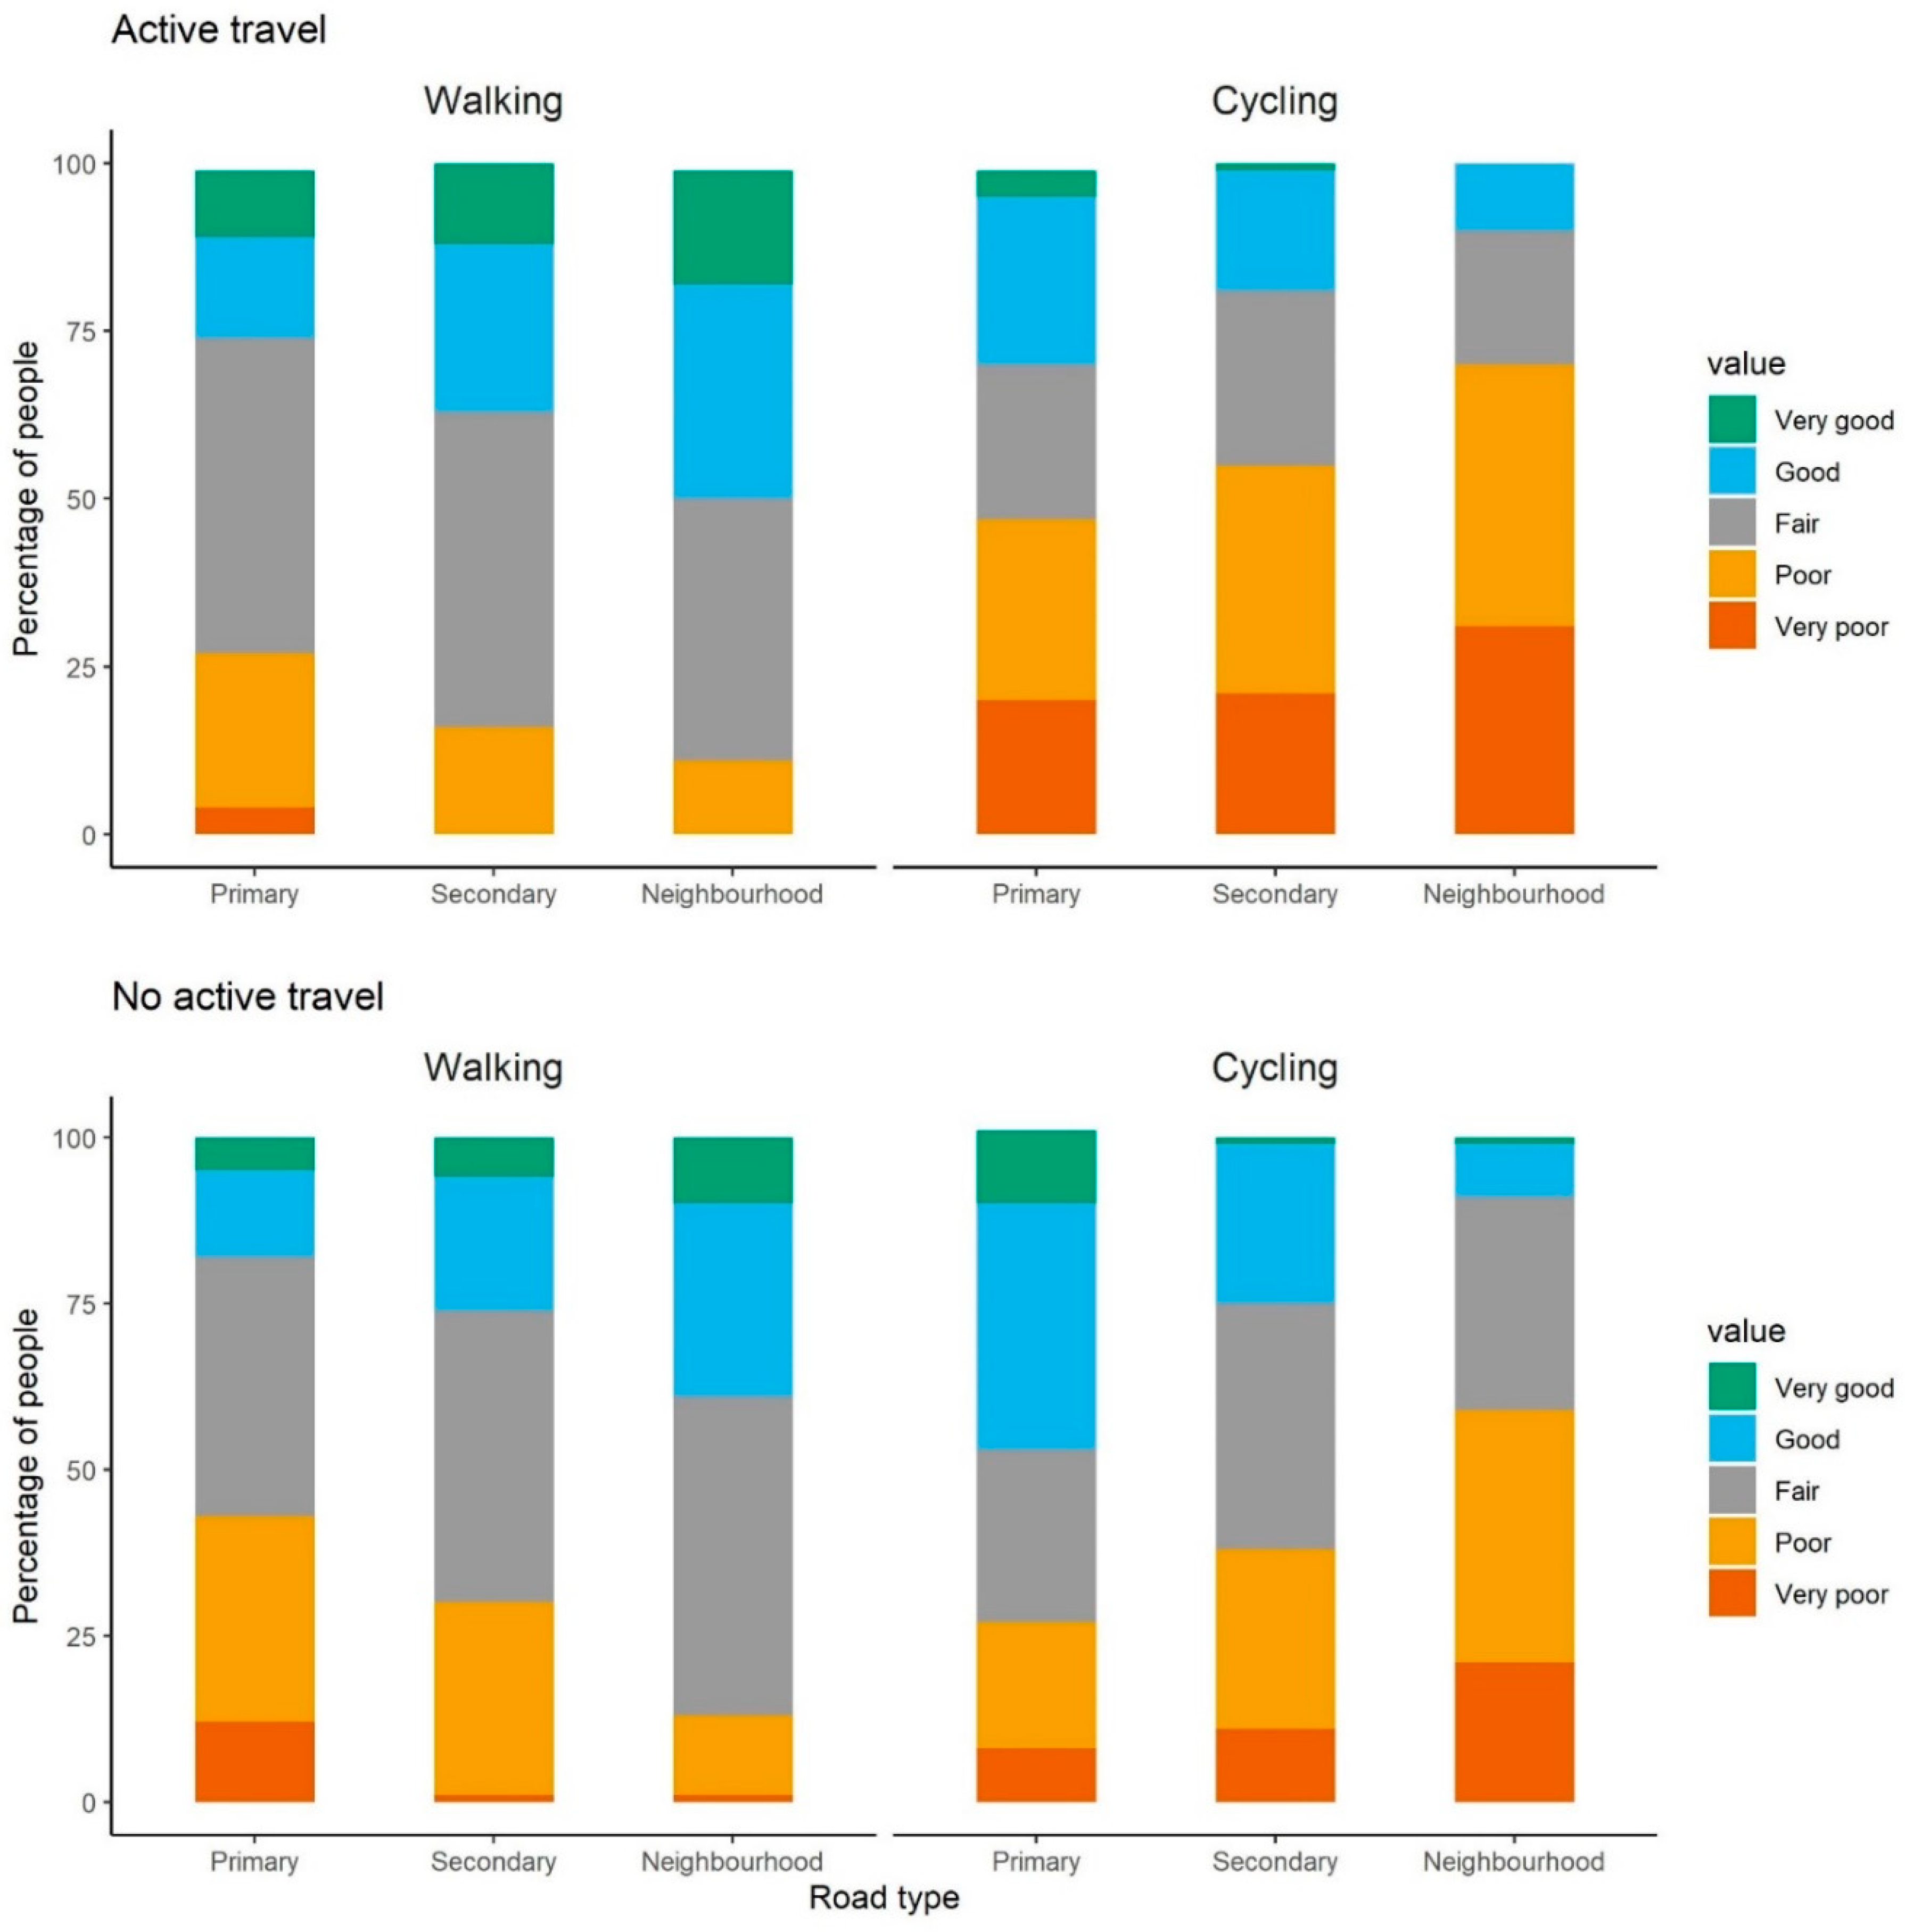
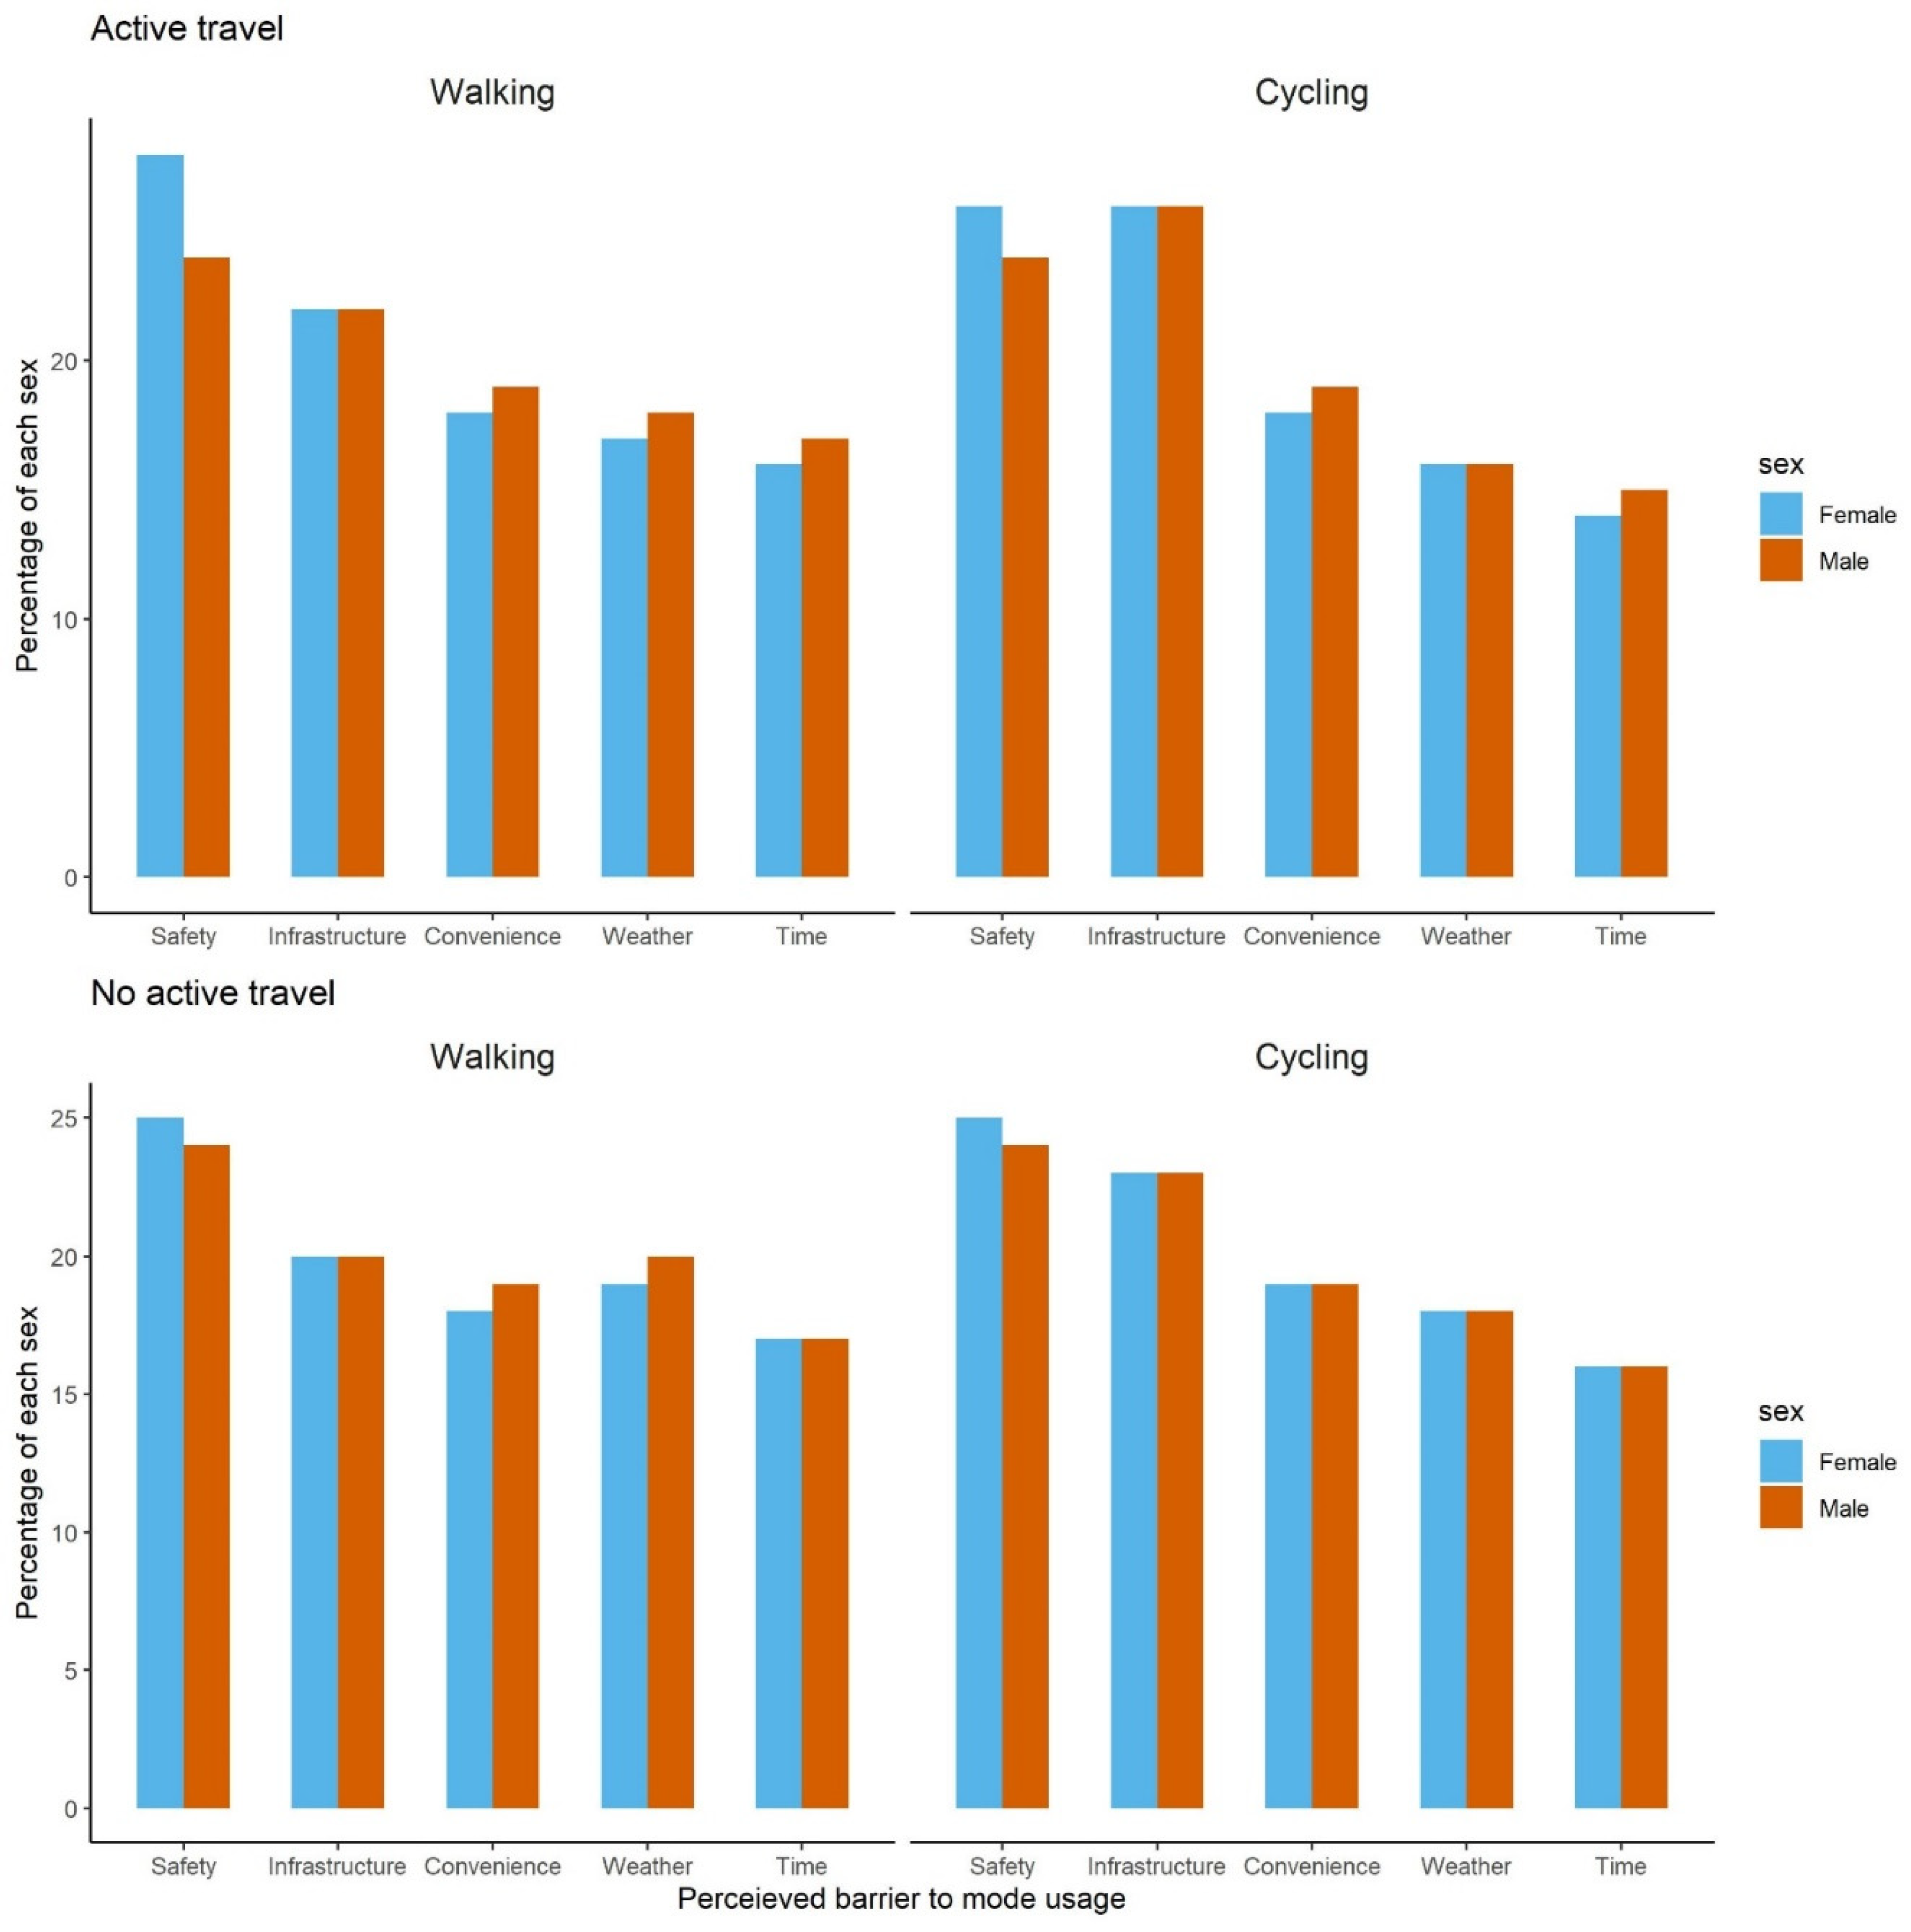
Safety from road traffic injuries was the most common concern for both walking and cycling. There were opposite trajectories for the perception of the state of the road for walking vs. cycling, with participants perceiving that the larger roads were less suitable for walking but more suitable for cycling while smaller roads were more suitable for walking but less suitable for cycling.

5.2. Study Limitations

Despite filling the important literature gap on travel behaviour in Cameroon, our study does have limitations. First, the lockdown of cities and the restriction of movements and social interactions to control the COVID-19 pandemic limited peoples’ activities and the use of some transport modes. This could affect the estimation of routine trips and the use of modes, particularly for public transport modes. Although we allowed an ample buffer time of one-year post-lockdown before launching our data collection, it is likely that the ongoing pandemic continued to affect peoples’ behaviour. Second, despite ensuring the maximum sample size that was allowed by budget, our sample size was relatively small and could misrepresent population estimates. Our sample had more males and fewer younger participants compared to the representative 2018 demographic and health surveys. After weighting our survey with the demographic and health survey estimates, our sample still had higher vehicle ownership. Third, the time-use design (compared with a traditional travel survey) likely impacted how trips were captured. The time-use diary prioritised one among multiple activities within the same time slots, and some activities may be more interesting for the participants to report to the detriment of travel activities. It is also more difficult to differentiate trips in the time-use surveys on whether, for instance, multiple travel activities are legs of the same trips or if they are independent trips. Furthermore, we used 30 min slots in our diary instead of the 10–15 min slots commonly used in other surveys; this coarse time resolution could miss short trips and overestimate trip duration. Short walking trips (particularly walking to access other modes) are likely to be missed in this coarse resolution as participants are more likely to prioritise other modes. Third, we only captured trip frequency and duration but no trip distance, despite having no prior knowledge of travel distances in the city. As such, our study offers little information about travel speeds and road traffic congestion in the city. Finally, the survey was relatively lengthy and relied on recalling a large amount of information; thus, it was prone to soft refusal and recall bias.

5.3. Interpretation of Findings

Our finding that only one-quarter of all trip main modes were on foot contradicts our expectation of a high proportion of walking trips since high walking rates have been reported from travel surveys in some African cities, including those in Cameroon. For example, studies with varying definitions of trips report that walking rates can be as high as 70% in cities such as Douala (Cameroon), Conakry (Guinea), Dakar (Senegal), Niamey (Niger), Addis-Ababa (Ethiopia), Lusaka (Zambia), Kampala (Uganda), and Kisumu (Kenya) [5,17,18]. The only analysis for time-use survey data we are aware of (our own analysis of the 2009 Accra time-use survey) showed high walking trip rates of 58% [34]. The observed low walking trip rates could result from the under-reporting of trip stage modes, especially walking as a component of public transport trips. One indication of possible under-reporting of walking comes from the gap between walking and public transport trip rates—public transport trips almost double walking trips. One would expect that most residents would walk to public transport in cities road networks, such as Yaoundé. Thus, the walking rate should be closer or higher than public transport. This analysis shows that almost 90% of shared taxi trips do not have any accompanying mode. If all shared taxi trips were to be accompanied by a walking stage, stage mode shares would increase from 22% to 44%. Even when the use of motorcycle taxis (which tend to provide doorstep transport services) is high, walking rates should still be higher than the rates we observed. For example, in Ouagadougou (Burkina Faso), where 39% of trips were on motorcycles, 42% were still on foot [5]. As hinted earlier, the 30 min time slot in the time-use survey could encourage the under-reporting of short walking trips. Nonetheless, low walking rates have been reported in African cities, with about one-third of daily trips being walking in Nairobi and Mombasa (Kenya) [35,36] and one-quarter in Cape Town (South Africa) [17]. Outside of Africa, this walking stage mode share is similar to 21% in London [37] but higher than 14% in Canberra, Australia [38].
With the relatively low levels of daily walking and practically non-existent cycling, only one-fifth of the population travels actively for ≥30 min daily. Active travel is the second most important source of physical activity after work-related physical activity in LMICs [39]. Low levels of physical activity have already been highlighted as a problem in Cameroon, with one-third of adults not meeting the recommended levels of physical activity. Suggested interventions by participants for improving active travel included improving active transport infrastructure and making active transport safer from road traffic injuries and more convenient to use. These should serve as a starting point for improving physical activity for the transport sector in Cameroon since the sector has not previously expressed physical activity goals in its policies [40].
The high share of public transport modes (mainly shared taxis and motorcycle taxis) is a logical observation, given that walking is low in a context where we expected low use of private vehicles. Large buses are nearly absent (less than 2%). The taxi trip mode share of 46% is the highest reported in Africa, and the second is Abidjan (Côte d’Ivoire) with only 30%; trip mode shares are usually around 10% in most cities, including Douala [41]. The average motorcycle share in urban Africa is 12% and goes up to 58% [41]. The 9% for motorcycle taxis observed in Yaoundé is similar to the reported average motorcycle trip mode share in urban Africa. Other public transport modes such as buses and minibuses that contribute an average of 7 and 30% of trips in African cities are nearly absent in Yaoundé. The predominant modes in Yaoundé have important implications on the transport indicator worth mentioning. The shared taxis have low-carrying capacities; although higher than private cars, it adds to the problem of road congestion. The motorcycles are suitable for navigating smaller roads in the neighbourhoods, but they are associated with increased road traffic injuries.
We note a longer daily travel duration of 83 min/capita/day, compared to the global average of 60 min/person/day [42]. While the time-use survey could overestimate the time, travel duration in African cities is generally thought of as long and unpredictable and this is partly associated with the congestion patterns for motorised trips, the long walks with a lack of choice, and poor land-use planning. While the general tendency of car-centric transport planning is to decrease travel times, Tranter [43] argues that access and not speed should be key and that travelling faster causes more health harms beyond road traffic fatalities and should not be the development goal.
Our finding of gender differences in mobility patterns is consistent with findings from other studies in Africa. Females make fewer trips and are less likely to travel by car, motorbike (as the driver), and bicycle (as operator) but more likely to travel by walking and paratransit. Some of the perceived barriers to female travel have included male violence, patriarchal beliefs that travelling can increase promiscuity, and household responsibilities [1,44]. For example, Salon and Gulyani [23] showed that women in Nairobi’s slums were less likely to use motorised modes, even after accounting for differences between men and women in both childcare responsibilities and education levels. The gender disparity in travel calls for gender-responsive urban design interventions to support active travel.
In Yaoundé, lower economic households were more likely to travel, overall, and in different modes. This contrasts with findings from multiple studies summarised in our recent systematic review [1]. The review looked at socioeconomic inequities in travel behaviour in Africa and found that lower-income households tend to live at the periphery and face more challenges in travelling. Although evidence from the review is not conclusive in most instances, it shows some limited evidence that lower-income households are less likely to travel and more likely to make fewer trips. It also shows limited and mixed evidence that total travel time differed by socioeconomic status. While high income might increase opportunities for travelling, it may be as people become wealthier, they relocated to live in places where less travel is needed.

5.4. COVID-19 and the Future of Urban Mobility in Africa

Work from home and hybrid remote working models have grown in many sectors following the COVID-19 stay-at-home strategy adopted by many governments around the world [45,46,47]. However, in most African countries, COVID-19 lockdowns and travel restrictions measures were rather brief, as countries were under pressure to reopen their dominant informal sectors [46,48]. This underscores the importance of adapting transport response strategies to similar epidemics in these settings where most of the working population is engaged in the informal sector. Emphasis should, therefore, be on developing the transport infrastructure that will allow the disadvantaged [49] to meet their mobility needs without exposing them to higher risks of infectious diseases, violence, and injury risk. Cycling is a logical option for trips up to around 8 to 10 Km. In Yaoundé, the climate is not too hot but because it comprises hilly terrain, electric-assist bikes may be more useful. Long-distance travels in expanding cities still require the use of shared modes of transportation including informal public buses, where physical distance protocols are not realisable with low-capacity vehicles [50]. There is an opportunity to reshape housing and land-use designs in these growing cities towards compact cities that allow for active travel and reduce the need for long-distance travel for daily activities.
Beyond building transport infrastructures that are resilient to epidemics, future transport management and control policies need to address the mobility inequity that makes travelling difficult for some population groups, especially females. In addition, more considerations should be made about introducing large-capacity public transport vehicles to curb growing problems of road traffic congestion, albeit there are known drawbacks of forcing a formal public transport system in systems that are dominated by the informal sector.

6. Conclusions

We have detailed the main travel patterns and barriers to active travel in Yaoundé, Cameroon, as one example of the many African cities that lack a description of their travel behaviours. Our study highlights low walking and high use of shared taxis and motorcycle taxis in Yaoundé. It also shows gender and socioeconomic inequity in mobility, illustrated by the lower mobility and higher use of “low-class” modes in females and by higher trip frequency and durations in the poor. Safety from road traffic injuries is the most common concern for both walking and cycling. These findings suggest that African urban transport authorities need to consider interventions that improve active mobility and gender equity in mobility, especially road safety interventions and public transport development. Adequate public transport improvement will also cater the needs of females and poorer residents who rely on this mode of transportation. The COVID-19 pandemic, the relatively small survey sample size, and the lengthy recall diary might have biased our observations. A representative travel survey is needed to triangulate the current findings, and more generally, high-quality data from well-designed surveys are needed for accurate descriptions of urban travel behaviours in Africa.

Author Contributions

Conceptualization, L.T., Y.W., M.P., T.O., L.F., E.M., C.O., J.C.M., J.W. and F.A.; methodology, L.T., Y.W., M.P., T.O., L.F, J.W. and F.A.; formal analysis, L.T., M.P. and F.A.; investigation, L.T., Y.W., M.P., T.O. and F.A.; resources, T.O., J.C.M., J.W. and F.A.; data curation, L.T., Y.W. and M.P.; writing—original draft preparation, L.T.; writing—review and editing, L.T., Y.W., M.P., T.O., L.F., E.M., C.O., J.C.M., J.W. and F.A.; supervision, T.O., J.C.M., J.W. and F.A.; project administration, L.T., Y.W. and M.P.; funding acquisition, T.O., J.C.M., J.W. and F.A. All authors have read and agreed to the published version of the manuscript.

Funding

This research was funded by the National Institute for Health Research (NIHR) (GHR: 16/137/34) using UK aid from the UK Government to support global health research. The views expressed in this publication are those of the authors and not necessarily those of the NIHR or the UK government.

Institutional Review Board Statement

The study was conducted in accordance with the Declaration of Helsinki and approved by the Centre Regional Committee of Ethics for Research on Human Health (Yaoundé) (reference CE No. 2179 CRERSHC/2021).

Informed Consent Statement

Informed consent was obtained from all subjects involved in the study.

Data Availability Statement

The data presented in this study are available upon request from the corresponding author.

Acknowledgments

We are grateful to the Global Diet and Activity Research (GDAR) network for steering the study.

Conflicts of Interest

The authors declare no conflict of interest.

References

  1. Foley, L.; Brugulat-Panés, A.; Woodcock, J.; Govia, I.; Hambleton, I.; Turner-Moss, E.; Mogo, E.R.I.; Awinja, A.C.; Dambisya, P.M.; Matina, S.S.; et al. Socioeconomic and Gendered Inequities in Travel Behaviour in Africa: Mixed-Method Systematic Review and Meta-Ethnography. Soc. Sci. Med. 2021, 292, 114545. [Google Scholar] [CrossRef] [PubMed]
  2. Glazener, A.; Sanchez, K.; Ramani, T.; Zietsman, J.; Nieuwenhuijsen, M.J.; Mindell, J.S.; Fox, M.; Khreis, H. Fourteen Pathways between Urban Transportation and Health: A Conceptual Model and Literature Review. J. Transp. Health 2021, 21, 101070. [Google Scholar] [CrossRef]
  3. Hamilton, I.; Kennard, H.; McGushin, A.; Höglund-Isaksson, L.; Kiesewetter, G.; Lott, M.; Milner, J.; Purohit, P.; Rafaj, P.; Sharma, R.; et al. The Public Health Implications of the Paris Agreement: A Modelling Study. Lancet Planet. Health 2021, 5, e74–e83. [Google Scholar] [CrossRef]
  4. Giles-Corti, B.; Moudon, A.V.; Lowe, M.; Adlakha, D.; Cerin, E.; Boeing, G.; Higgs, C.; Arundel, J.; Liu, S.; Hinckson, E.; et al. Creating Healthy and Sustainable Cities: What Gets Measured, Gets Done. Lancet Glob. Health 2022, 10, e782–e785. [Google Scholar] [CrossRef]
  5. Diaz Olvera, L.; Plat, D.; Pochet, P. The Puzzle of Mobility and Access to the City in Sub-Saharan Africa. J. Transp. Geogr. 2013, 32, 56–64. [Google Scholar] [CrossRef] [Green Version]
  6. World Health Organisation Global Status Report on Road Safety 2018. Available online: https://www.who.int/publications-detail-redirect/9789241565684 (accessed on 4 September 2021).
  7. Guthold, R.; Stevens, G.A.; Riley, L.M.; Bull, F.C. Global Trends in Insufficient Physical Activity among Adolescents: A Pooled Analysis of 298 Population-Based Surveys with 1·6 Million Participants. Lancet Child Adolesc. Health 2020, 4, 23–35. [Google Scholar] [CrossRef]
  8. Antonel, J.; Chowdhury, Z. Measuring Ambient Particulate Matter in Three Cities in Cameroon, Africa. Atmos. Environ. 2014, 95, 344–354. [Google Scholar] [CrossRef]
  9. Charmes, J. Time-Use Surveys in Africa: Problems and Prospects. In Mainstreaming Unpaid Work; Oxford University Press: Delhi, India, 2017; ISBN 978-0-19-946825-6. [Google Scholar]
  10. Poushter, J.; Oates, R. Cell Phones in Africa: Communication Lifeline. In Pew Research Center’s Global Attitudes Project; Pew Research Center: Washington, DC, USA, 2015. [Google Scholar]
  11. Wesolowski, A.; Eagle, N.; Noor, A.M.; Snow, R.W.; Buckee, C.O. The Impact of Biases in Mobile Phone Ownership on Estimates of Human Mobility. J. R. Soc. Interface 2013, 10, 20120986. [Google Scholar] [CrossRef]
  12. Ortiz-Ospina, E.; Giattino, C.; Roser, M. Time Use; Our World in Data: Oxford, UK, 2020. [Google Scholar]
  13. Hubert, J.-P.; Toint, P.L. From Average Travel Time Budgets to Daily Travel Time Distributions: Appraisal of Two Conjectures by Kölbl and Helbing and Some Consequences. Transp. Res. Rec. 2006, 1985, 135–143. [Google Scholar] [CrossRef]
  14. Hubert, J.; Armoogum, J.; Axhausen, K.W.; Madre, J. Immobility and Mobility Seen through Trip-Based Versus Time-Use Surveys. Transp. Rev. 2008, 28, 641–658. [Google Scholar] [CrossRef]
  15. Global Centre of Excellence on Gender Statistics Measuring Time Use: An Assessment of Issues and Challenges in Conducting Time-Use Surveys with Special Emphasis on Developing Countries. Available online: https://data.unwomen.org/publications/measuring-time-use-assessment-issues-and-challenges-conducting-time-use-surveys (accessed on 12 June 2022).
  16. Garcia, L.; Johnson, R.; Johnson, A.; Abbas, A.; Goel, R.; Tatah, L.; Damsere-Derry, J.; Kyere-Gyeabour, E.; Tainio, M.; de Sá, T.H.; et al. Health Impacts of Changes in Travel Patterns in Greater Accra Metropolitan Area, Ghana. Environ. Int. 2021, 155, 106680. [Google Scholar] [CrossRef] [PubMed]
  17. Behrens, R.; Olvera, L.D.; Plat, D.; Pochet, P. Meta-Analysis of Travel of the Poor in West and Southern African Cities. In Proceedings of the WCTRS, ITU. 10th World Conference on Transport Research—WCTR’04, Istanbul, Turkey, 4–8 July 2004; WCTRS: Montréal, QC, Canada, 2004; p. 19. [Google Scholar]
  18. World Bank. Planning for Uganda’s Urbanization; World Bank: Washington, DC, USA, 2012. [Google Scholar]
  19. Rwakarehe, E.E. Review of Strategies for Curbing Traffic Congestion in Sub-Saharan Africa Cities: Technical and Policy Perspectives. Tanzan. J. Eng. Technol. 2022, 40, 24–32. [Google Scholar] [CrossRef]
  20. Gonzales, E.; Chavis, C.; Li, Y.; Daganzo, C.F. Multimodal Transport in Nairobi, Kenya: Insights and Recommendations with a Macroscopic Evidence-Based Model. In Proceedings of the Transportation Research Board 90th Annual Meeting, Washington, DC, USA, 23–27 January 2011. [Google Scholar]
  21. Melbye, D.C.; Møller-Jensen, L.; Andreasen, M.H.; Kiduanga, J.; Busck, A.G. Accessibility, Congestion and Travel Delays in Dar Es Salaam—A Time–Distance Perspective. Habitat Int. 2015, 46, 178–186. [Google Scholar] [CrossRef]
  22. Andreasen, M.H.; Møller-Jensen, L. Access to the City: Mobility Patterns, Transport and Accessibility in Peripheral Settlements of Dar Es Salaam. J. Transp. Geogr. 2017, 62, 20–29. [Google Scholar] [CrossRef] [Green Version]
  23. Salon, D.; Gulyani, S. Mobility, Poverty, and Gender: Travel ‘Choices’ of Slum Residents in Nairobi, Kenya. Transp. Rev. 2010, 30, 641–657. [Google Scholar] [CrossRef]
  24. Janusz, K.; Kesteloot, C.; Vermeiren, K.; Van Rompaey, A. Daily Mobility, Livelihoods and Transport Policies in Kampala, Uganda: A Hägerstrandian Analysis. Tijdschr. Voor Econ. En Soc. Geogr. 2019, 110, 412–427. [Google Scholar] [CrossRef]
  25. Tembe, A.; Nakamura, F.; Tanaka, S.; Ariyoshi, R.; Miura, S. The Demand for Public Buses in Sub-Saharan African Cities: Case Studies from Maputo and Nairobi. IATSS Res. 2019, 43, 122–130. [Google Scholar] [CrossRef]
  26. Evans, J.; O’Brien, J.; Ch Ng, B. Towards a Geography of Informal Transport: Mobility, Infrastructure and Urban Sustainability from the Back of a Motorbike. Trans. Inst. Br. Geogr. 2018, 43, 674–688. [Google Scholar] [CrossRef]
  27. Von Elm, E.; Altman, D.G.; Egger, M.; Pocock, S.J.; Gøtzsche, P.C.; Vandenbroucke, J.P. The Strengthening the Reporting of Observational Studies in Epidemiology (STROBE) Statement: Guidelines for Reporting Observational Studies. Lancet 2007, 82, 251–259. [Google Scholar] [CrossRef] [Green Version]
  28. Valérie, O.; Epo, B. Suburbanization and Inequality in Transport Mobility in Yaoundé, Cameroon: Drawing Public Policy for African Cities; Global Development Network: New Delhi, India, 2013. [Google Scholar]
  29. Yaounde SUMP Summary. Available online: https://www.mobiliseyourcity.net/sites/default/files/2021-03/Yaounde%20SUMP%20Summary_final.pdf (accessed on 15 June 2022).
  30. Himelein, K.; Eckman, S.; Lau, C.; McKenzie, D. Mobile Phone Surveys for Understanding COVID-19 Impacts: Part II Response, Quality, and Questions. Available online: https://blogs.worldbank.org/impactevaluations/mobile-phone-surveys-understanding-covid-19-impacts-part-ii-response-quality-and (accessed on 21 February 2022).
  31. Demographic and Health Surveys The DHS Program—Wealth-Index-Construction. Available online: https://dhsprogram.com/topics/wealth-index/Wealth-Index-Construction.cfm (accessed on 26 February 2022).
  32. Chakraborty, N.M.; Fry, K.; Behl, R.; Longfield, K. Simplified Asset Indices to Measure Wealth and Equity in Health Programs: A Reliability and Validity Analysis Using Survey Data From 16 Countries. Glob. Health Sci. Pract. 2016, 4, 141–154. [Google Scholar] [CrossRef] [Green Version]
  33. Smits, J.; Steendijk, R. The International Wealth Index (IWI). Soc. Indic. Res. 2015, 122, 65–85. [Google Scholar] [CrossRef]
  34. Dake, F.; Tatah, L.; Goel, R.; Woodcock, J. Travel Behaviour Characteristics from a Time Use and Travel Diary Survey in Accra, Ghana; MRC Epidemiology Unit, University of Cambridge: Cambridge, UK, 2022. [Google Scholar]
  35. Tatah, L.; Foley, L.; Oni, T.; Pearce, M.; Lwanga, C.; Were, V.; Assah, F.; Wasnyo, Y.; Mogo, E.; Okello, G.; et al. Travel Behaviour Characteristics and Correlates in Nairobi and Kisumu, Kenya; MRC Epidemiology Unit, University of Cambridge: Cambridge, UK, 2022. [Google Scholar]
  36. Salon, D.; Gulyani, S. Commuting in Urban Kenya: Unpacking Travel Demand in Large and Small Kenyan Cities. Sustainability 2019, 11, 3823. [Google Scholar] [CrossRef] [Green Version]
  37. Greater London Authority. Travel Patterns and Trends; London Datastore: London, UK, 2012.
  38. Australian Capital Territory Governmnet ACT and Queanbeyan-Palerang Household Travel Survey (ACTQP HTS). Available online: https://www.transport.act.gov.au/about-us/planning-for-the-future/household-travel-survey (accessed on 15 June 2022).
  39. Strain, T.; Wijndaele, K.; Garcia, L.; Cowan, M.; Guthold, R.; Brage, S.; Bull, F.C. Levels of Domain-Specific Physical Activity at Work, in the Household, for Travel and for Leisure among 327 789 Adults from 104 Countries. Br. J. Sports Med. 2020, 54, 1488–1497. [Google Scholar] [CrossRef] [PubMed]
  40. Tatah, L.; Mapa-Tassou, C.; Shung-King, M.; Oni, T.; Woodcock, J.; Weimann, A.; McCreedy, N.; Muzenda, T.; Govia, I.; Mbanya, J.C.; et al. Analysis of Cameroon’s Sectoral Policies on Physical Activity for Noncommunicable Disease Prevention. Int. J. Environ. Res. Public Health 2021, 18, 12713. [Google Scholar] [CrossRef] [PubMed]
  41. Kumar, A.; Barrett, F. Africa Infrastructure Country Diagnostic. Stuck in Traffic:Urban Transport in Africa; World Bank and Sub-Saharan Transport Policy Program (SSATP): Washington, DC, USA; Bamako, Mali, 2008. [Google Scholar]
  42. Joly, I. Travel Time Budget—Decomposition of the Worldwide Mean. In Proceedings of the IATUR, ISTAT. Italian National Statistical Institute. Time Use: What’s New in Methodology and Application Fields? Rome, Italy, 27–29 October 2004; p. 23. [Google Scholar]
  43. Tranter, P.J. Speed Kills: The Complex Links Between Transport, Lack of Time and Urban Health. J. Urban Health 2010, 87, 155–166. [Google Scholar] [CrossRef] [Green Version]
  44. Ng, W.-S.; Acker, A. Understanding Urban Travel Behaviour by Gender for Efficient and Equitable Transport Policies; International Transport Forum Discussion Paper; OECD: Paris, France, 2018. [Google Scholar]
  45. Bartlett, L. Specifying Hybrid Models of Teachers’ Work During COVID-19. Educ. Res. 2022, 51, 152–155. [Google Scholar] [CrossRef]
  46. Ozimek, A. The Future of Remote Work; Social Science Research Network: Rochester, NY, USA, 2020. [Google Scholar]
  47. Triyason, T.; Tassanaviboon, A.; Kanthamanon, P. Hybrid Classroom: Designing for the New Normal after COVID-19 Pandemic. In Proceedings of the 11th International Conference on Advances in Information Technology, Bangkok, Thailand, 1–3 July 2020; Association for Computing Machinery: New York, NY, USA, 2020; pp. 1–8. [Google Scholar]
  48. Teachout, M.; Zipfel, C. The Economic Impact of COVID-19 Lockdowns in SubSaharan Africa. Available online: https://www.theigc.org/wp-content/uploads/2020/05/Teachout-and-Zipfel-2020-policy-brief-.pdf (accessed on 9 June 2022).
  49. Brooks, J.H.M.; Tingay, R.; Varney, J. Social Distancing and COVID-19: An Unprecedented Active Transport Public Health Opportunity. Br. J. Sports Med. 2021, 55, 411–412. [Google Scholar] [CrossRef]
  50. Klopp, J.; Mitullah, W. Politics, Policy and Paratransit: A View from Nairobi. In Paratransit in African Cities; Routledge: London, UK, 2015; ISBN 978-1-315-84951-5. [Google Scholar]
Figure 1. Network of larger roads on a background of residential roads in Yaoundé (2022). (Source: the map was drawn by authors from OpenStreetMap and pictures of sample roads were obtained from Google Street Views).
Sustainability 14 09092 g001
Figure 2. Perception of the suitability of different road types for walking and cycling in Yaoundé, Cameroon (2021).
Sustainability 14 09092 g002
Figure 3. Ranking of key barriers to walking and cycling in Yaoundé, Cameroon (2021).
Sustainability 14 09092 g003
Table 1. Example from the time-use diary used in the survey in Yaoundé, Cameroon (2021).
TimeActivity
  • Sleep
  • Leisure PA
  • Leisure Screen
  • Self-Care
  • Paid Work/Study
  • Household Chores/Care
  • Travel
  • Other
Duration
(minutes)
Location
  • Home
  • Someone’s House
  • School/College
  • Workplace
  • Other
  • Travelling
Mode of Travel
  • Walking
  • Bicycle
  • Private Car
  • Private Motorcycle/Scooter
  • Mototaxi/Boda Boda
  • Public Bus
  • Taxi
  • Train
  • Opep Minibus/Matatu
  • Opep Cars
  • Tuk Tuk
  • Boda Boda (Bicycle)
  • Skateboard/Rollerblade
  • Other
  • Not Travelling
Who with
  • On Own
  • With Child
  • With Other Family Member
  • With Friend
  • With Work Colleague
  • Other
7:00–7:30
7:30–8:00
8:00–8:30
8:30–9:00
9:00–9:30
Table 2. Characteristics of households and participants in the 2021 time-use survey in Yaoundé, Cameroon.
Summary of Household CharacteristicsSummary of Individual Characteristics
UnweightedWeighted
n1199n13341334
Household size (median (IQR)3 (1–4)Female (%)505 (38)616 (46)
Households headed by females = Yes (%)302 (28)Age (mean (SD))38 (12)36 (13)
Education of household head (%) Age group (%)
  Primary school or less130 (12)  ≤24 years85 (6)255 (19)
  JHS/middle school227 (21)  25 to 34 years523 (39)491 (37)
  SHS/secondary school224 (20)  35 to 44 years385 (29)287 (22)
  High school515 (47)  45 to 54 years197 (15)157 (12)
  ≥55 years144 (11)144 (11)
Occupation of the house heads (%) Education (%)
  Employed696 (64)  Primary school or less164 (12)172 (13)
  Student102 (9)  JHS/middle school278 (21)269 (20)
  Not employed or not applicable119 (11)  SHS/secondary school282 (21)273 (21)
  Other179 (16)  High school610 (46)621 (47)
Household vehicle ownership Marital status (%)
  Any vehicle415 (35)  Never married458 (34)561 (42)
  Car256 (21)  Formerly married127 (10)126 (9)
  Motorcycle139 (12)  Living together280 (21)263 (20)
  Bicycle96 (8)  Married469 (35)384 (29)
Household Wealth Occupation (%)
  Poorer400 (33)  Employed815 (61)735 (55)
  Middle400 (33)  Student141 (11)218 (16)
  Richer399 (33)  Not employed or not applicable177 (13)204 (15)
  Other201 (15)177 (13)
Relationship to head (%)
  Head1096 (82)1015 (76)
  Spouse149 (11)161 (12)
  Son or daughter51 (4)96 (7)
  other38 (3)63 (5)
Any vehicle in house = Yes (%)471 (35)434 (33)
Cars/motorcycles in house = Yes (%)424 (32)388 (29)
Household Wealth
  Poorer435 (33)479 (36)
  Middle450 (34)444 (33)
  Richer449 (34)411 (31)
Table 3. Summary of trips reported in the 2021 time-use survey in Yaoundé, Cameroon.
Both SexesFemalesMales
Trip ModeShare (%) (n = 2153)Mean (IQR) MinutesShare (%) (n = 907)Mean (IQR)Share (%) (n = 1245)Mean (IQR) Minutes
Walk26.641 (30–60)27.540 (30–60)25.943 (30–60)
Bicycle0.236 (30–30)0.336 (30–30)
Motorcycle542 (30–60)0.849 (20–90)841 (30–60)
Motorcycle taxis10.339 (30–30)11.837 (30–30)9.241 (30–30)
Car10.659 (30–60)4.849 (30–60)14.862 (30–60)
Taxi45.750 (30–60)5448 (30–60)39.751 (30–60)
Public bus0.6146 (60–210)0.1360 (360–360)1129 (60–210)
Opep0.855 (30–60)0.930 (30–30)0.778 (30–120)
Other0.352 (30–80)0.552 (30–80)
Overall10048 (30–60)10045 (30–60)10050 (30–60)
Table 4. Characteristics of walking and modes contributing to walking in Yaoundé.
CharacteristicPercentage
Participants (n= 1334)
  % People reporting walking25%
Walking trip stages (n = 845)
  % Of walking as the main mode85%
  % Of walking accompanying taxi12%
  % Of walking accompanying motorcycle2%
  % Accompanying other modes1%
Shared taxi trips (n = 999)
  % Accompanied by walking6%
  % Accompanied by motorcycle2%
  % Accompanied by other mother modes3%
  % Unaccompanied by other modes89%
Motorcycle taxi trips (n = 207)
  % Accompanied by walking6%
  % Unaccompanied by other modes83%
Table 5. Trip making and the number of trips by population subgroup.
Made TripNumber of Trips Made
NoYesp1 Trip2 Trips3 Trips4+ Trips
n (%)487 (37)847 (63) 108 (13)409 (48)172 (20)153 (19)
Female (%)54420.0048463239
Age group (%) 0.00
  ≤24 years2516 1717198
  25 to 34 years2942 41394446
  35 to 44 years2221 19201828
  45 to 54 years1112 11121312
  ≥55 years1210 111266
Education (%) 0.66
  ≤ Primary school 1412 9121313
  Middle school2020 20202021
  Secondary school2120 24221817
  ≥High school4548 46474949
Marital status (%) 0.32
  Never married4043 43394949
  Formerly married119 79611
  Living together2119 15192216
  Married2829 35322324
Occupation (%) 0.00
  Employed4462 54655862
  Student1915 1616159
  Not employed 1814 2091816
  Other1910 119913
Relationship (%) 0.00
  Head6781 73759092
  Spouse198 131223
  Son or daughter96 9853
  Other64 6531
Any vehicle (%)41280.0031292427
Car/motorcycle (%)36250.0029262224
Household Wealth 0.00
  Poorer2741 35375047
  Middle3433 38323035
  Richer3926 28312118
Table 6. Travel in different modes by population subgroup in the 2021 time-use survey in Yaoundé, Cameroon.
Any Active TravelActive Travel ≥ 30 minMotorised TransportPublic Transport
NoYespNoYespNoYespNoYesp
n(%)1001 (75)333 (25) 1078 (81)256 (19) 636 (48)698 (52) 753 (56)580 (44)
Female (%)47420.1847420.2052410.0046460.93
Age group (%) 0.30 0.10 0.00 0.00
  ≤24 years1920 1822 2613 2314
  25 to 34 years3542 3543 3043 2948
  35 to 44 years2318 2219 2023 2320
  45 to 54 years1211 139 1113 1310
  ≥55 years1110 127 139 138
Education (%) 00.10 0.67 0.00 0.00
  ≤ Primary school 1216 1215 179 169
  Middle school1923 2020 2120 2218
  Secondary school2118 2118 2021 2021
  High school4843 4647 4350 4352
Marital status (%)0 0.00 0.00 0.12 0.04
  Never married3757 3763 4539 4144
  Formerly married108 106 109 910
  Living together2213 2211 1920 1822
  Married3122 3120 2631 3225
Occupation (%) 0.06 0.06 0.00 0.00
  Employed5653 5651 4366 4864
  Student1619 1521 2112 1814
  Not employed 1419 1419 1912 1812
  Other1510 149 1611 1610
Relationship (%) 0.01 0.00 0.00 0.13
  Head7482 7483 6982 7380
  Spouse145 144 159 1410
  Son or daughter77 85 96 86
  Other46 48 73 64
Any vehicle (%)36210.0035220.0036300.0245170.00
Car/motorcycle (%)33180.0032170.0032270.0741140.00
Household Wealth 0.00 0.00 0.09 0.00
  Poorer3053 3156 3438 3143
  Middle3529 3527 3234 3136
  Richer3518 3417 3428 3822
Table 7. Daily travel durations in various modes for population subgroups in the 2021 time-use survey in Yaoundé, Cameroon.
All ParticipantsParticipants Who Travelled
CharacteristicsOverallActiveMotorisedPublicOverallActiveMotorisedPublic
All77 (0–120)18 (0–0)56 (0–90)43 (0–60)121 (60–150)28 (0–45)88 (30–120)67 (0–90)
Sex
  Male88 (0–120)18 (0–30)66 (0–90)44 (0–60)129 (60–150)27 (0–40)96 (40–120)65 (0–90)
  Female63 (0–90)16 (0–0)45 (0–60)41 (0–60)110 (60–150)29 (0–60)78 (30–120)71 (10–120)
Age group (years)
  ≤24 years49 (0–80)18 (0–30)28 (0–60)27 (0–60)95 (60–120)35 (0–60)55 (0–60)51 (0–60)
  25 to 34 years87 (0–120)19 (0–30)64 (0–90)54 (0–90)121 (60–150)27 (0–40)90 (30–120)75 (30–120)
  35 to 44 years84 (0–120)12 (0–0)68 (0–100)47 (0–60)135 (60–150)20 (0–30)109 (60–120)75 (0–120)
  45 to 54 years82 (0–120)18 (0–0)60 (0–90)36 (0–60)126 (60–150)27 (0–30)93 (50–120)56 (0–90)
  ≥55 years73 (0–120)21 (0–0)49 (0–60)33 (0–60)127 (60–150)35 (0–60)85 (0–120)58 (0–90)
Education
  ≤Primary school74 (0–120)30 (0–30)41 (0–60)32 (0–60)125 (60–150)51 (0–60)70 (0–90)54 (0–90)
  Middle school77 (0–120)22 (0–30)52 (0–90)39 (0–60)123 (60–150)34 (0–60)83 (30–120)62 (0–100)
  Sec school70 (0–120)16 (0–0)50 (0–60)37 (0–60)111 (60–150)26 (0–30)79 (30–120)59 (0–90)
  High school80 (0–120)13 (0–0)65 (0–90)50 (0–90)124 (60–150)20 (0–30)99 (60–120)77 (0–105)
Occupation
  Employed82 (0–120)16 (0–0)63 (0–90)47 (0–85)116 (60–150)23 (0–30)89 (45–120)67 (0–100)
  Student62 (0–90)20 (0–30)39 (0–60)38 (0–60)110 (60–120)36 (0–60)69 (0–90)66 (0–90)
  Not employed73 (0–120)22 (0–30)47 (0–90)37 (0–60)129 (60–180)39 (0–60)83 (0–120)65 (0–120)
  Other76 (0–120)14 (0–0)59 (0–90)37 (0–60)156 (60–180)29 (0–30)121 (60–150)76 (0–120)
Marital status
  Never married77 (0–120)23 (0–30)51 (0–80)45 (0–60)117 (60–150)36 (0–60)77 (0–120)68 (0–90)
  Formerly married67 (0–120)18 (0–0)48 (0–90)39 (0–60)117 (60–150)31 (0–60)83 (40–120)68 (30–105)
  Living together76 (0–120)13 (0–0)61 (0–90)48 (0–90)126 (60–150)21 (0–30)100 (60–135)80 (30–120)
  Married80 (0–120)12 (0–0)64 (0–90)38 (0–60)124 (60–150)19 (0–20)99 (60–120)58 (0–90)
Vehicle in house
  No vehicle 79 (0–120)22 (0–30)55 (0–90)52 (0–90)117 (60–150)32 (0–60)80 (30–120)76 (30–120)
  Any vehicle 71 (0–120)9 (0–0)59 (0–90)24 (0–0)131 (60–160)17 (0–30)109 (60–150)45 (0–60)
  Car/Motorcycle72 (0–120)7 (0–0)62 (0–90)23 (0–0)132 (60–160)13 (0–15)113 (60–150)43 (0–60)
Household Wealth
  Poorer85 (0–120)27 (0–60)55 (0–90)50 (0–80)117 (60–150)38 (0–60)76 (10–120)69 (0–100)
  Middle79 (0–120)15 (0–0)61 (0–90)47 (0–90)126 (60–150)24 (0–30)97 (60–120)75 (0–120)
  Richer65 (0–90)9 (0–0)52 (0–90)30 (0–45)121 (60–150)17 (0–15)97 (60–120)55 (0–90)
Publisher’s Note: MDPI stays neutral with regard to jurisdictional claims in published maps and institutional affiliations.

