

A New Restoration Strategy in Microgrids after a Blackout with Priority in Critical Loads


1
Department of Electrical and Electronics Engineering Educators, ASPETE—School of Pedagogical and Technological Education, 14121 N. Heraklion, Greece
2
Department Fundamentals of Electrical Engineering, Technical University of Sofia, 8 Kliment Ohridski Blvd., Block 12, 1000 Sofia, Bulgaria
*
Author to whom correspondence should be addressed.
Sustainability 2023, 15(3), 1974; https://doi.org/10.3390/su15031974
Submission received: 2 December 2022
/
Revised: 10 January 2023
/
Accepted: 17 January 2023
/
Published: 19 January 2023
(This article belongs to the Special Issue Challenges and Issues of the Smart Grid Technologies Implementation: Targeting Grid Resilience with Digitalization)
Abstract
:The danger of a total blackout in a wide area or, even worse, in a country is always present. The restoration methods after a blackout mainly focus on the strategy that the dispatchers in the control centers of the Transmission System Operator will follow than the abilities that the distribution’s microgrids have. This study suggests a restoration technique to improve distribution system resilience following a blackout, using distributed generation for the restoration of important loads. The goal of the restoration problem is to maximize the number of critical loads that are restored following the catastrophic incident. Under the restrictions of the DGs and the network, the DGs with good black start capability are restored first. Load weight and node importance degree are suggested during the recovery path selection procedure, while taking node topological importance and load importance into account. A mixed-integer linear program (MILP) is used to simulate the issue, and the modified IEEE 39-bus test system is used to verify the efficacy of the suggested restoration approach.
1. Introduction
To maintain a constant system frequency, which is 50 cycles per second in Europe, a power grid must constantly have the correct balance between generation and load (or demand). The frequency will always alter when there is an imbalance. In the event of a generator failure, the load will immediately surpass the generation capacity, causing the frequency to decrease. It is possible to maintain grid functioning if the loss of generation is within a manageable range by raising generation from the system’s hot reserve capacity, which is accessible from the running power plants, and/or by turning to load-shedding. On the other hand, if a sizable amount of load is dropped, the system will have extra generation, which will increase the frequency. To lower the frequency to the appropriate level in that situation, the generation capacity must be decreased [1].
A disturbance may be started by the tripping of a heavily laden line or transformer, a bus fault, or a line fault with a nonoperational breaker. High-speed protection systems allow the localization of faults and the discriminating clearing of errors. Therefore, variables like outages on transmission lines, relay faults, equipment tripping due to overloads, etc., could spread the disturbance and have a greater impact, causing blackout. The blackout state is described as, “the state where the operation of part or all of the transmission system is terminated” by the European Network of Transmission System Operators for Electricity (ENTSO-E) [2]. A blackout has a significant negative effect since it affects water, transportation, and communications. Additionally, factories, shops, petrol stations, ATMs, banks, and other services are out of service. Given that Europe is energy-dependent, the conflict in Ukraine and the natural gas supply issue [3] enhanced the likelihood that such an event will occur soon. Additionally, a blackout can always be brought on by a terrorist strike or a cyber-attack [4,5,6,7].
The development of a distribution system in islands can assist in lessening the negative effects in the event of a widespread blackout. There is frequently the potential to supply at least a portion of the typical load, even if the extent of local generation capacity is constrained [8,9]. Damage to the customers serviced can be minimized if a portion of the power system can continue to run as an island without interruption. Even if the initial disturbance disconnects users, shortening the duration of the local outage has considerable advantages. The resilience of distribution islands may be enhanced by the growing penetration of Distributed Energy Resources (DERs). Operational difficulties arise from the scattered nature of many renewable generators. A Distribution System Operator (DSO) may encounter a greater variety of potential scenarios due to the stochastic, weather-dependent availability of energy from sources like solar and wind power, which further complicates issues [10,11,12].
Battery storage systems might enable more loads to be connected more frequently, but there will still be remaining unavailability due to empty storage capacity unless they provide dedicated reserves for power system restoration. Storage systems that typically maintain their optimal depth of discharge across long lifetimes may be able to offer extra reserves in times of need. However, there is not currently any regulation that may encourage these storage system operation modes. Power outages can coincide with the destruction of some communication equipment since blackouts may be caused by a natural disaster, such as extreme weather conditions. Fast and reliable restoration of as many loads as possible may be facilitated by DERs’ restoration-friendly behavior [13,14].
The focus on the restoration process within power system research is to restore the power grid as we have known it for decades. Microgrid (MG) black start research is currently in its early stages. The viability of choosing MGs as black start (BS) power is examined in reference [15]. To find the extended BS pathways, uses the Dijkstra algorithm. However, it primarily focuses on the conventional bulk power grid, which is connected to Distributed Generators (DGs) and MGs.
The types of micro sources and their mitigation techniques are studied in [16]. The serial restoration approach with a lengthy restoration period is used to give a BS strategy. The issue of BS restoration protocols for MGs to use after a blackout occurs is addressed in [17]. The analysis of the control tactics results in the identification of the set of guidelines and requirements.
A dynamic model for micro sources and inverters is established in [18]. It suggests a multi-agent technology-based restoration plan for the BS and subsequent islanded functioning of MGs. Numerical simulations are used to identify and assess the collection of rules and conditions. In [19], a series of steps for a successful BS operation including microgeneration units has been recognized as improving distribution network resilience. The control of the BS process, rather than the quantity of DGs, loads, and lines, is the focus in the aforementioned sources.
In the literature, there are other restoration techniques after a blackout. To determine the significance of nodes, the method of node contraction is introduced in [20]. The ideal skeleton networks are created using a discrete particle swarm, with the network reconfiguration efficiency as the optimization aim. Ref. [21] proposes a fuzzy chance constrained model to deal with the ambiguity of operating time and operational lines. This model is resolved using a hybrid fuzzy simulation approach that combines particle swarm optimization (PSO) with the Dijkstra algorithm. According to the requirements of hierarchical scheduling in the power system, reference [22] provides a hierarchical collaborative optimization approach. The goals are described as total power generation and network reconfiguration level. In [23], power system restoration plans are graphically visualized to aid in assessing the restoration duration and the scheduled critical route. A novel approach to estimate recovery time is applied in [24] and is based on machine learning techniques used on prior restoration events. A unique restoration technique built on the A* Algorithm is provided in [25] with a focus on the quick and dependable supply of consumers following a blackout. This work tries to combine the restoration techniques previously mentioned, trying to create skeleton networks in islands, where the BS units are restored first in order to help the non-black start (NBS) units restart, combining the MILP solver method with Multi-Criteria Decision Making (MCDM) to evaluate the electric load weight. The proposed algorithmic technique shows how MGs can work independently from the distribution system or the transmission grid when a blackout occurs, until it will be fully restored.
2. Past Blackouts and Future Threats for the Power Systems
The process of resuming generation without off-site power as part of system restoration after a partial or complete shutdown is referred to in the power industry as a “black start” (BS). Even though they are uncommon, these events have major economic and societal impact, which makes the money and time invested in preparation for system restoration using BS resources worthwhile. Table 1 gives a list of recent blackouts along with the amount of damage these outages have caused [26,27].
Most of the incidents shown in Table 1 did not lead to a total system failure. However, employing BS resources frequently accelerated the healing process. Reconnecting the system’s energized portion(s) will typically be the main goal of the restoration operation to restart additional generating. After that, as soon as new resources became available, priority loads were restored. Blackouts can occur from a variety of causes, such as bad weather conditions, equipment malfunction, falling of trees and other objects getting in the way of electricity lines, damage from accidents and vandalism, and many more.
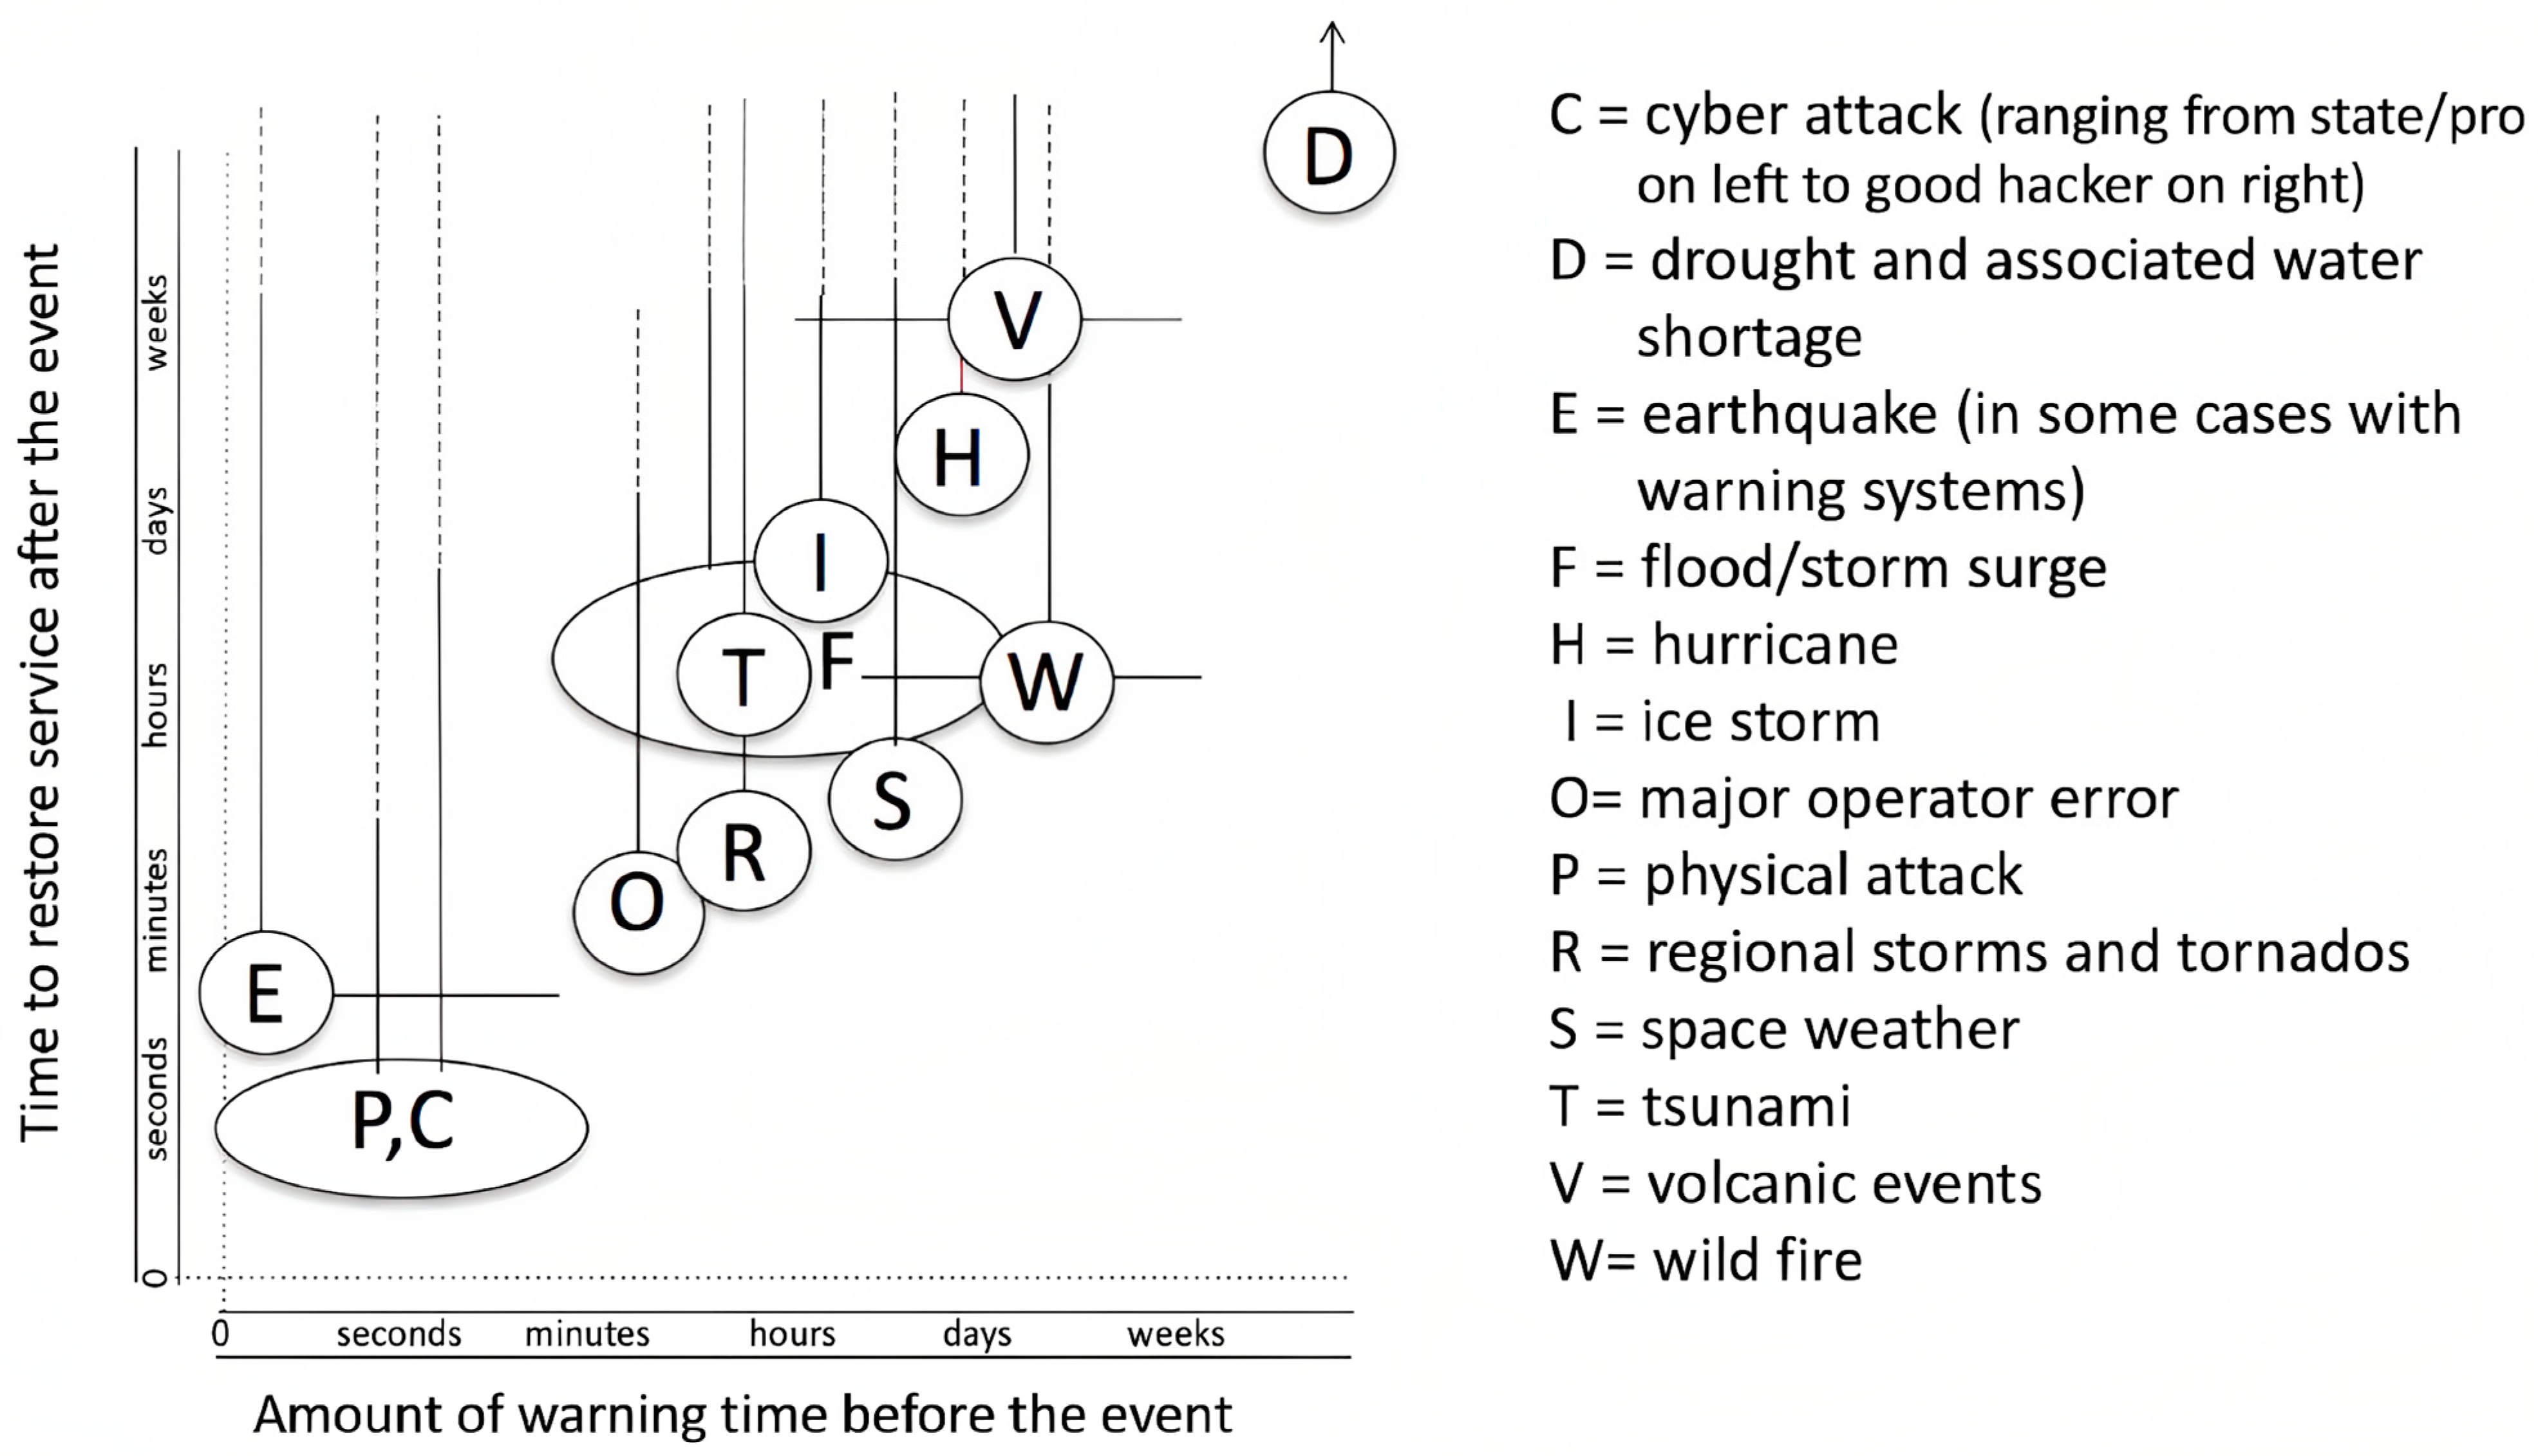
In Figure 1, the warning and restoration times before a blackout event are presented. It is obvious that for some events, such as regional storms, tornados, tsunamis, etc., there is enough time (from hours to days) to be prepared for such an event. However, there are events such as cyber-attacks or physical attacks where there is not enough time for remedial actions.
The preferred BS units have historically been gas turbines and hydropower units. Historically, power system generating has included coal, natural gas, nuclear, and hydropower plants. These plants are simple to start on their own and run under control so that any discrepancy between power supply and demand is quickly decreased by unit dispatch. Additionally, because of the inertia brought on by these traditional power plants, system-wide outages have been extremely infrequent. Therefore, since a lot of the equipment designed to restore power service will not function reliably, especially in context of a long-duration large-area grid outage, it is necessary to develop the ability for much expanded reliance on “smart grid” capabilities.
The non-dispatch ability of renewable energy sources is one of the key obstacles to their integration into the electrical grid. Furthermore, most contemporary renewable energy sources are connected to the grid via power electronics and, as a result, have no intrinsic inertia, unlike synchronous production which has it naturally due to its rotating mass. Due to this drop in system inertia, the system may be more susceptible to significant disruptions that could cause widespread blackouts. To preserve system reliability, substantial changes in operational procedures for the power system are needed.
Integrating wind and solar power at this phase of system repair can destabilize the system due to the previously mentioned characteristics of these sources as the system is substantially less stable during this phase of system restoration. Additionally, it might be challenging to retain enough conventional plants to restart the system conventionally as non-dispatchable renewable sources continue to penetrate the grid. Due to this, it is crucial to carefully plan for system BS operation with non-dispatchable renewable energy sources by adding weather forecast information and by using the right tools to manage the intermittent nature of these sources as much as it is practicable [11,12].
3. Microgrid Development and Their Value to the Power System
The goal in the development of power systems is the transformation of conventional power systems, which are based on centralized power generation and automation for supervision and control, to decentralized and more flexible systems with dispersed power generation and the expansion of automation at the power distribution level. The goal is also to efficiently manage both the production of electricity from distributed energy sources and the consumption at Medium Voltage (MV) and High Voltage (HV) levels [28].
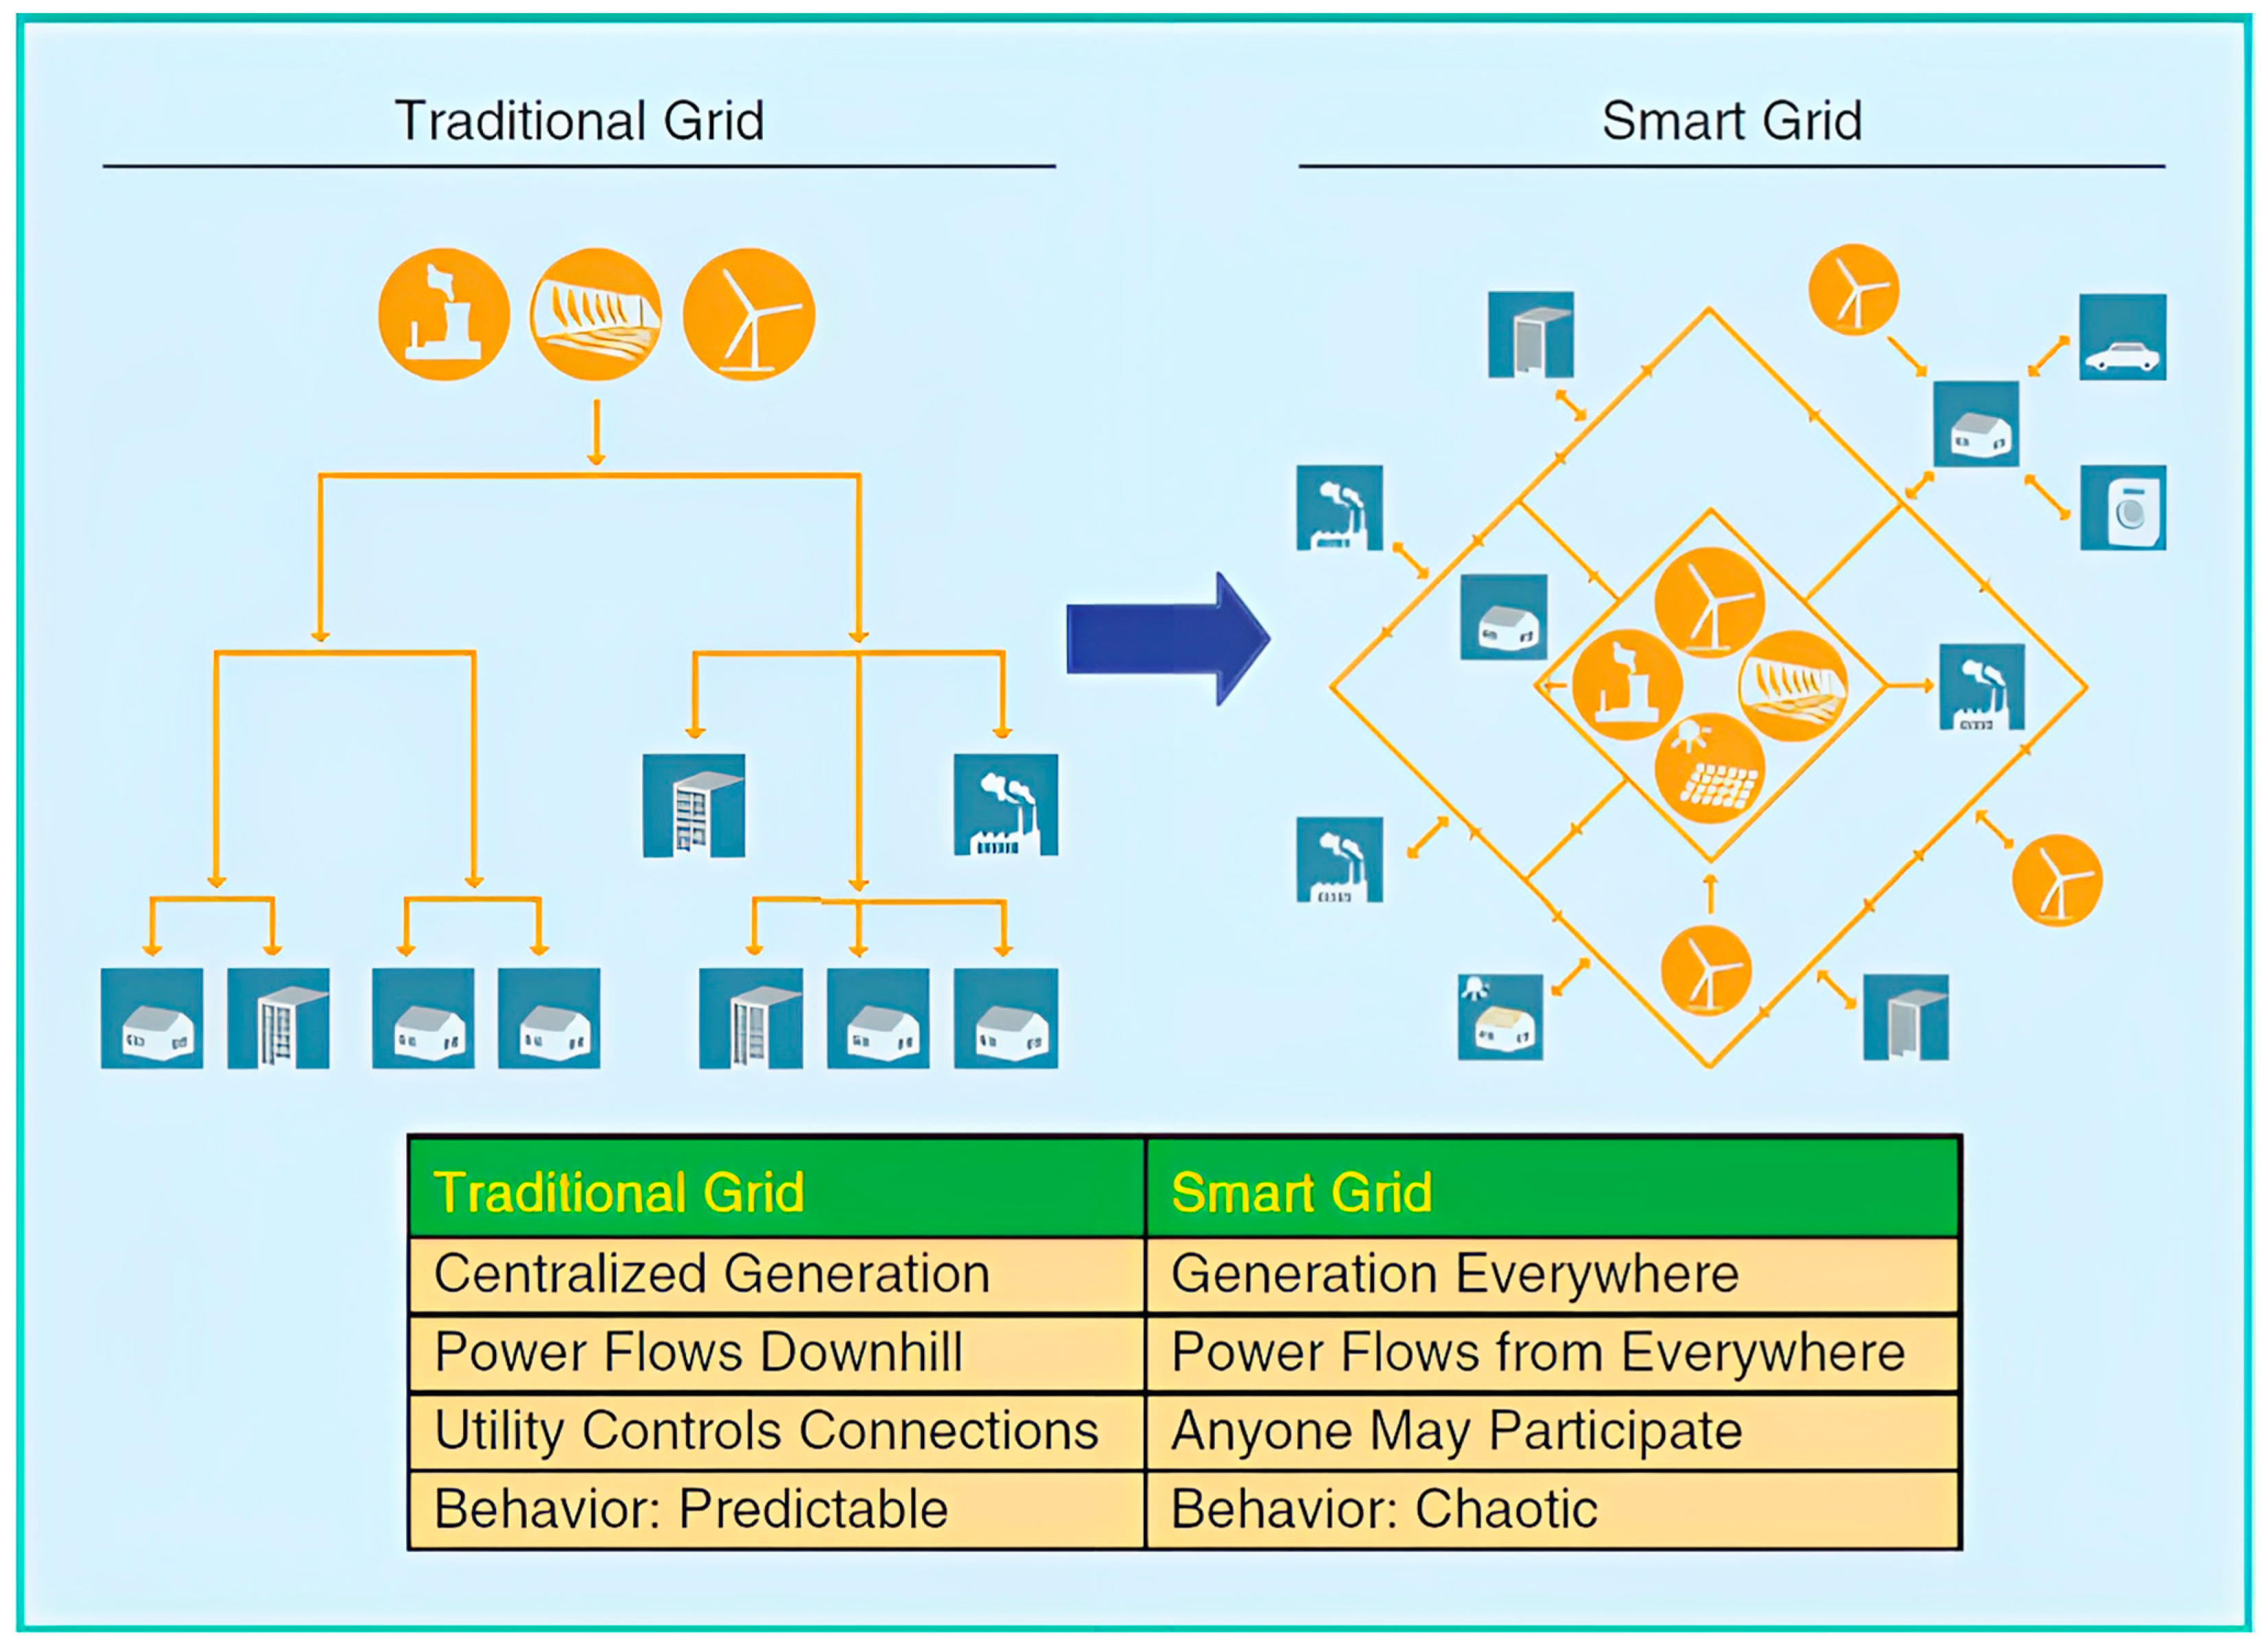
Given their complex structure, the upgrading of distribution networks at the level of supervision and control is a demanding process, the goal of which is to transform them from passive systems, with the exclusive role of servicing load demand, to active systems with distributed energy generation and automation in the context of a unified power system in the smart grid standards [29,30]. In Figure 2, the main changes included in the evolution of modern power systems into smart grids are briefly given. The concept of “intelligence” refers to the ability to process information—to decide and control remotely in real time through the use of information and communication technologies [31].
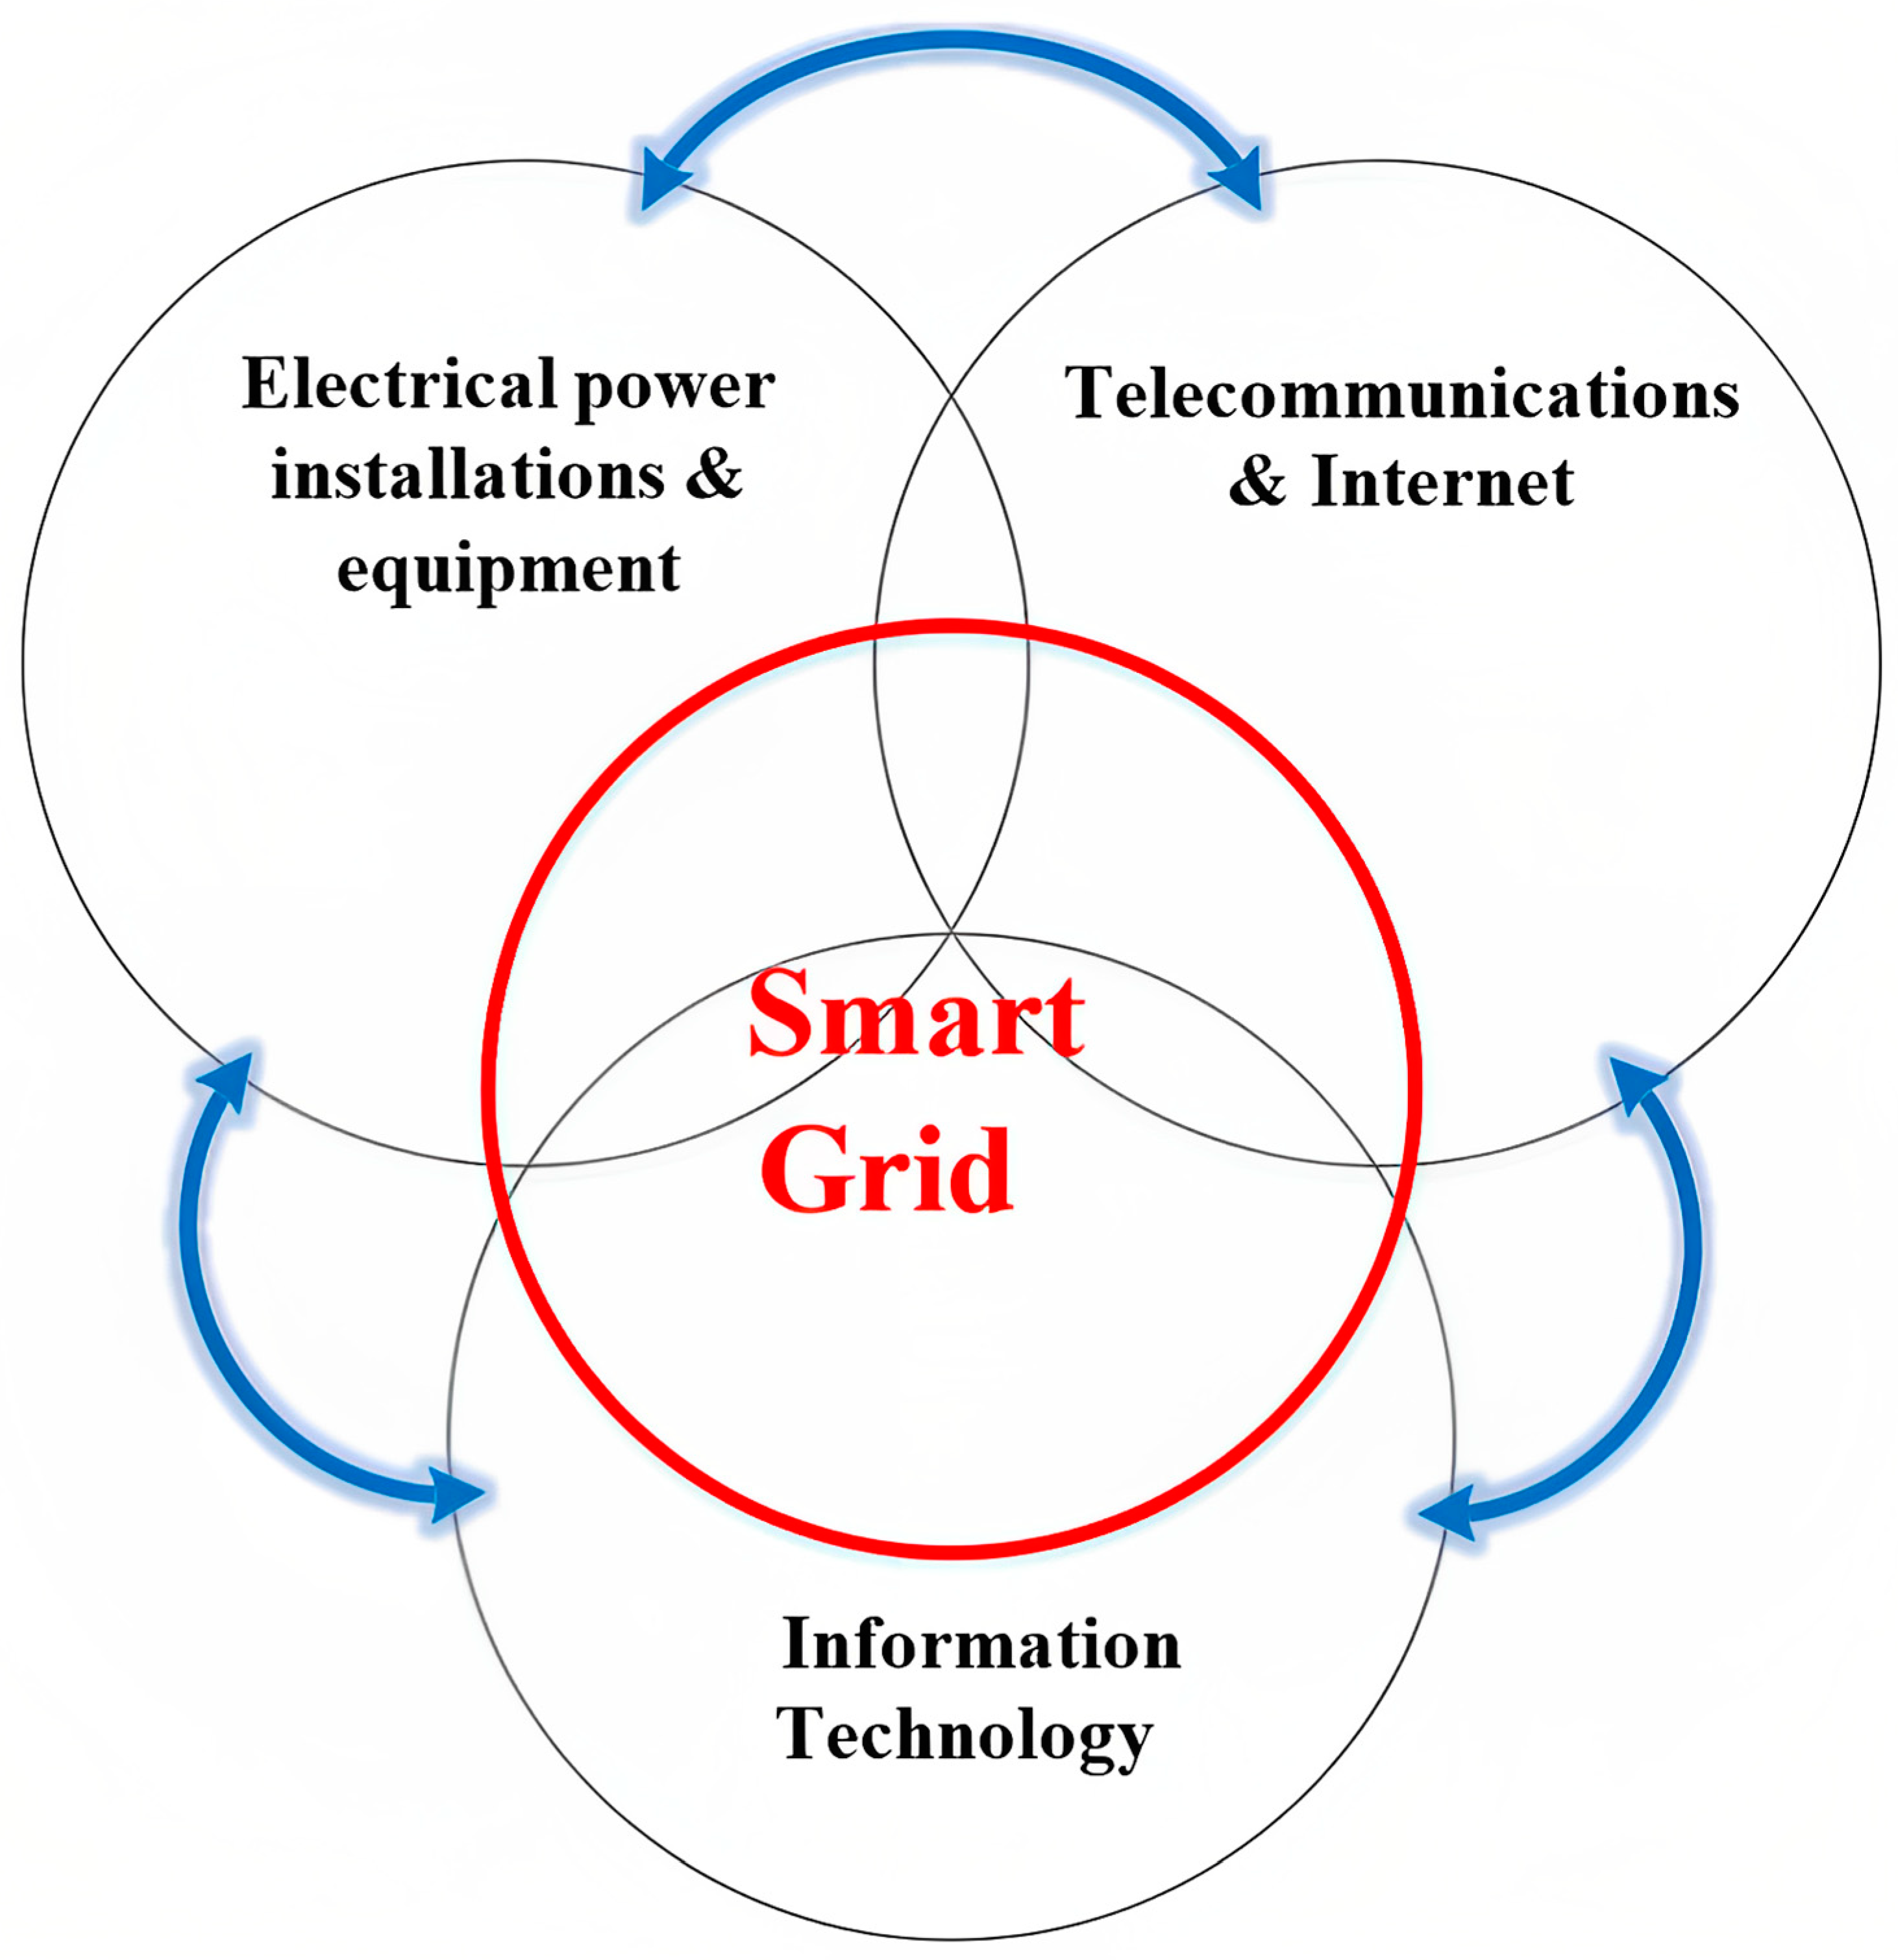
A central axis in the effort to upgrade the power systems into smart grids, as it is illustrated in Figure 3, is the achievement of a two-way flow of information from the control centers to the users—electricity producers and consumers—and vice versa, using advanced telecommunications [32]. The Internet can contribute valuable services both in the storage and transmission of information, as well as in energy management at the distribution voltage level, while the evolving technological trend of the Internet of Things (IoT), which systematizes the interaction of devices and devices with integrated sensors and actuators on a local scale, is expected to contribute to the creation of islands of advanced automation. The service of electricity markets, operators of the distribution grids or transmission systems, power companies, independent producers, large consumers, high voltage consumers, etc., creates increased demands on the computing power and reliability of the tools of a modern power control center [33].
The development of advanced measurement and automation systems across the entire range of electric power systems constitutes the third axis for the transition to intelligent electricity networks. In terms of transport systems, the installation of high-precision sensors with advanced capabilities, such as synchronized recording and access in the case of Phasor Measurement Units (PMUs) or extended functionality (measurement, remote control, protection, and debugging), under the general designation Intelligent Electronic Devices (IED) provides the necessary network of terminal units for the development of wide-area monitoring, control, and protection systems [34]. These systems are intended to integrate the individual SCADA systems of the generating stations and the transmission system and their unified operation. Therefore, IEDs are the evolution of Remote Terminal Units (RTUs), which are used in SCADA systems, and shape the dominant trend that mandates the use of devices that combine sensor and actuator functions acting as carriers of distributed intelligence. In the same vein, the classic actuators used in automation—primarily, switching means for coupling (disconnectors, loads, and power switches) and protection (switches driven by relays)—are being upgraded through the ability to take measurements.
During the last twenty years, remotely accessible metering devices have been widely used in distribution networks to record the electricity consumption of MV and HV users. These are the Automatic Meter Reading systems (AMR systems) which support a one-way flow of information from the meters to the control centers [35]. An evolution of this early technology is Advanced Metering Infrastructure systems (AMI systems) that base their operation on distributed smart meters, which are now being installed massively at MV and HV consumers and support the two-way flow of information to and from the control centers in almost real time. Therefore, they can support remote control functions, incorporating actuator functions in the same unit according to the commands they receive from the control centers. Overall, AMI systems offer the most comprehensive telemetry and control infrastructure at the level of electricity distribution and, together with pre-existing DSCADA systems serving the downstream parts of distribution networks, ensure, for the first time, adequate supervision and control of the power systems up to the final consumers.
There are two central principles that guide the process of restoring the electricity grid after a blackout [36,37]:
Bottom-up: By using BS units to self-reactivate the region in islands, ready for resynchronization with another area, the affected areas are recovered. BS units are isolated power plants with the capacity to start on their own and perform independently when more local loads are added.
Top-down: The energy from a safe system is transferred via interconnection lines to a largely isolated system with a significant disturbance in order to reactivate it. The disrupted TSO in this situation must ensure that it will comply to the restrictions on active and reactive power flows on the interconnection lines set included in bilateral agreements.
The disrupted TSO in this situation must guarantee its intention to adhere to the limits of active and reactive power flows on the interconnection lines set forth in bilateral agreements. Due to the great dependability of the end loads in a distribution system from the TSOs and the DSOs in case of a blackout, there have been various studies [38,39,40] examining strategy techniques in power restoration of MGs, which can operate as autonomous grids. In the following section, a new restoration strategy technique of MGs is described in case of a blackout.
4. Problem Setup
The following presumptions are used to create the critical restoration strategy:
- Distribution systems function radially, yet have a mesh structure. As a result, it is presumable that the distribution topology is radial following the blackout.
- All the simulation instances involve DGs running in islanded mode since the main grid power is unavailable following the catastrophic event.
- The MGs would use their reserve power to power the other essential loads on the distribution feeder they are connected to after first serving their own critical loads.
- The combined output of the distributed generation inside the MGs, which is constant, and the reserve energy for the duration of a simulation case make up the expected power output of the MGs.
- Open/close switches are present on distribution lines.
- The loads are fixed amounts based on their highest demand.
- The restoration method is decided on just once, just after the extreme event, and is kept the same until the main grid power is restored to avoid frequent switching operations.
The distribution network is represented using a graph-theoretic approach, and the network is reconfigured following fault isolation. The network is represented as a weighted undirected graph, in which vertices represent load nodes and generation nodes (MGs), edges represent distribution lines, including tie-lines, and also includes weighting of the edges using their line impedances. The suggested approach uses the minimal spanning tree (MST) once the sites of the extreme event and fault have been identified and eliminated from the network [40]. In order to create a tree post-fault, radial architecture with minimal power losses and more power available to be used restores the maximum number of important loads. The approach looks for a path with the least amount of impedance from the MG node to all the nodes. The model uses the discovered topology to determine a resilient restoration strategy based on the quantity of important loads recovered.
4.1. Electric Load Weight Evaluating Process Using Multi-Criteria Decision Making
In an MG, there are various loads served, each with different criticality. Multi-Criteria Decision Making (MCDM) can help us understand how critical each load is and therefore should be prioritized during network restoration. MCDM is a research field that involves the evaluation of many possible options in a circumstance or study topic that includes everyday life, social sciences, engineering, medicine, and many other disciplines [41,42]. The MCDM approach used for efficient load selection is detailed in the following paragraphs.
Step 1. Create a matrix for decision making: Assume m different loads and n assessment criteria for rating the loads. Xij is the value of the criterion j for the load i, as these are presented in Table 2.
Step 2. Calculate the Criterion Weight: Weight estimation might be subjective or objective. Variations in criterion weights are employed in the accepted technique to analyze the divergence in the scale of alternative load supply. Wj denotes the weight assigned to criterion j. This method takes into consideration both sorts of weights. The objective weight technique employs mathematical models such as entropy analysis [43], which may be used to measure the level of uncertainty. Specifics of this method are provided below.
To avoid the impact of criterion units or measurement scales, the criteria must be standardized using equations of relative optimal membership degree. Equation (1) can be used to standardize the matrix values of the criterion j in the load i (i, j refer to Table 2).
where:
- Sij: the value of the criterion j, after standardization, of the load i.
- Xij: the value of the criterion j for the load i.
The choice matrix is presented as follows standardizing all evaluation criteria:
Ej is the weight of the criterion j, as defined by the concept of entropy, and is determined by the following equation:
Therefore, the criterion for the load weight, Wj, is:
The evaluation criterion is more significant the higher its entropy weight.
4.2. Evaluation of Distributed Generation (DG) and Black Start
The distinction between typical power systems and MGs stems mostly from the distinction between DGs and gas or coal power plants, hence MGs are not able to easily replicate the conventional power system’s BS approach. As a result, while establishing an MG BS plan, the features of DGs must be considered. When compared to thermal power plants, DGs have the following distinguishing features:
- i.
- The output power of DGs is variable. Using wind power and solar power as examples, the output will vary depending on wind speed and light intensity.
- ii.
- iii.
- DGs start up without the need for an external power supply. Using a wind turbine, when the wind speed meets the minimal need, energy is created automatically without the need for external power.
- iv.
- The cylinder temperature divides the startup of typical coal or gas power plants into cold, warm, and hot start. As a result, the traditional power system’s BS strategy must consider the beginning time limits of thermal power producing units. DGs, on the other hand, are not limited by beginning times; hence, MG recovery times are lower.
The BS capability of DGs is that they have their own beginning power sources and supply limited loads. In this work, the BS capacity evaluation model of DGs based on the variation coefficient technique is built, considering the features of DGs. It uses real-time output power, starting time, load capacity, and State of Charge (SOC) of DGs. The variation coefficient approach is used to provide weight to each indicator, and the diversity sequence method is used to pick DGs with strong BS capacity.
Since the capacity of DGs is affected by ambient conditions it does not refer to output power in real time, but rather to the higher capability of its output power, which differs from coal or gas power plants. Since restarting DGs with more load capacity means more loads can be supplied simultaneously, this DGs’ load capacity must be considered. DGs with strong voltage and frequency modulation capability may offer voltage and frequency reference to the network, stabilizing it during the early BS stage.
The variation coefficient [47], as an objective weighing technique, calculates the index data to determine the weight of each index. Indices with a high difference, according to the variation coefficient technique, could be a quality indication of the assessed items and represent valuable information on the index data change, thus higher weight is given to the index. The following are the steps of the proposed method:
- Create an assessment matrix
The index vector to evaluate object i is written as Xi = [xi1, xi2, xi3, …, xim], where n and m are the objects and evaluation indices, respectively. The matrix of evaluation is X = [xij]nxm. ωj is the index weight of index j while the vector of index weights is denoted by ω = [ω1, ω2, …, ωm]T.
- Indices normalization
To exclude the influence of the dimension of the index, the original index value must be normalized. It is preferable for a positive index, often known as an “efficiency” index, to have a higher index value:
A negative index, sometimes known as a “cost” index, should have a lower index value:
In (5) and (6), i = 1, 2, …, n; j = 1, 2, …, m; rij is the value of the index j of the object i after normalization.
- Calculation of the index weight
Equations (7) and (8) calculate the average value and standard deviation of each index after normalizing it:
Equation (9) computes the variation coefficient of each index:
where Vj is the variation coefficient of the index j, is the average value of index j and sj is the standard deviation of index j.
Each index weight is:
- Receive a complete score
The comprehensive score vector G of each item is given by the following equation:
where:
G = Xω
- X: the evaluation matrix.
- ω: the weight vector.
Following this thorough assessment technique’s score of DGs, the DGs with strong BS capacity are additionally picked out by the diversity sequence method and chosen to be first during restoration.
4.3. Mathematical Formulation
The problem is formulated as a mixed-integer linear programming (MILP) optimization problem after the post-fault topology has been chosen, with the goal of maximizing the number of critical loads restored weighted by their priority for the shortest amount of time while considering power flow, service time, operation, and connectivity constraints. Based on the ranking of the loads (i.e., non-critical, semi-critical, and critical) and the voltage stability index of the loads, MILP optimization generates the best load shedding method [48]. The accuracy of the solution provided by an MILP Solver method is its significant advantage. If the problem is clearly specified, the solution obtained with the MILP Solver is the optimum one [49].
In the current work, the linear load flow has been used. Many researchers created techniques to get linear power flow equations by making various assumptions and approximations [50,51,52,53]. These calculations are typically quicker than nonlinear power flow (NPF) calculations, although they could be less accurate because the nonlinear equations have been simplified. When utilized to solve extremely large networks such as the ones examined in this paper and in real-time simulations, these linearized techniques may be preferable to NPF calculations despite the accuracy loss. Consequently, linear load flow offers easy implementation, reasonable accuracy, and low computational effort.
4.3.1. Objective Function
The complete load recovery process is broken down into several recovery steps to simplify the decision-making process. The output constraint on each phase’s generators is the key factor limiting the recovery load amount. By using load priorities, the system should aim to optimize load pickup. So, the definition of the objective function is as follows:
where:
- F: the objective function.
- i: node number.
- k: index for MGs.
- N: total node number in the distribution network.
- wi: priority weighting factor of critical loads.
- ri: critical load status variable at node i.
- lk: denotes the statues of MG k, which should be either 0 or 1.
The above-mentioned parameters are subject to certain constraints as they are discussed in Section 5.1 and Section 5.2.
4.3.2. Power Flow Constraints
The complex power flows at each node i are described through the power flow equations from [54] as follows:
where:
- : active power flowing from MG k to node i.
- : reactive power flowing from MG k to node i.
- : voltage at node i which is supplied by MG k.
- V0: nominal voltage.
- : variable node–MG assignment.
- Pi: active power that node i demands.
- Qi: reactive power that node i demands.
- j: index for children nodes.
- N: node number.
- Y: set of children nodes .
- rij: resistance between nodes i and j.
- xij: reactance between nodes i and j.
4.3.3. Operation Constraints
If node i is a part of MG k, the voltage at that node should be within the range stated in Equation (16) throughout the restoration procedure. The reactive power Q is a magnitude that affects the voltage in the microgrid. By offering reactive power in the microgrid (e.g., using capacitors), the voltage in the microgrid increases. When absorbing reactive power (e.g., using reactors), the voltage in the microgrid decreases. Consequently, reactive power and the voltage in the nodes affect each other. At the time of restoration, the entire sum of the loads handled by MG k should not exceed its maximum active and reactive power capacity, as Equations (17) and (18) describe.
where:
- : capacity of active power of MG k (in kW).
- : capacity of reactive power of MG k (in kVar).
4.3.4. Connectivity Constraints
Because the loads connected at each node in this study are radial, a radial topology should be preserved during the restoration process, which means that a load can only be serviced by one MG via a unique path:
5. Numerical Results
5.1. Restoration Strategy
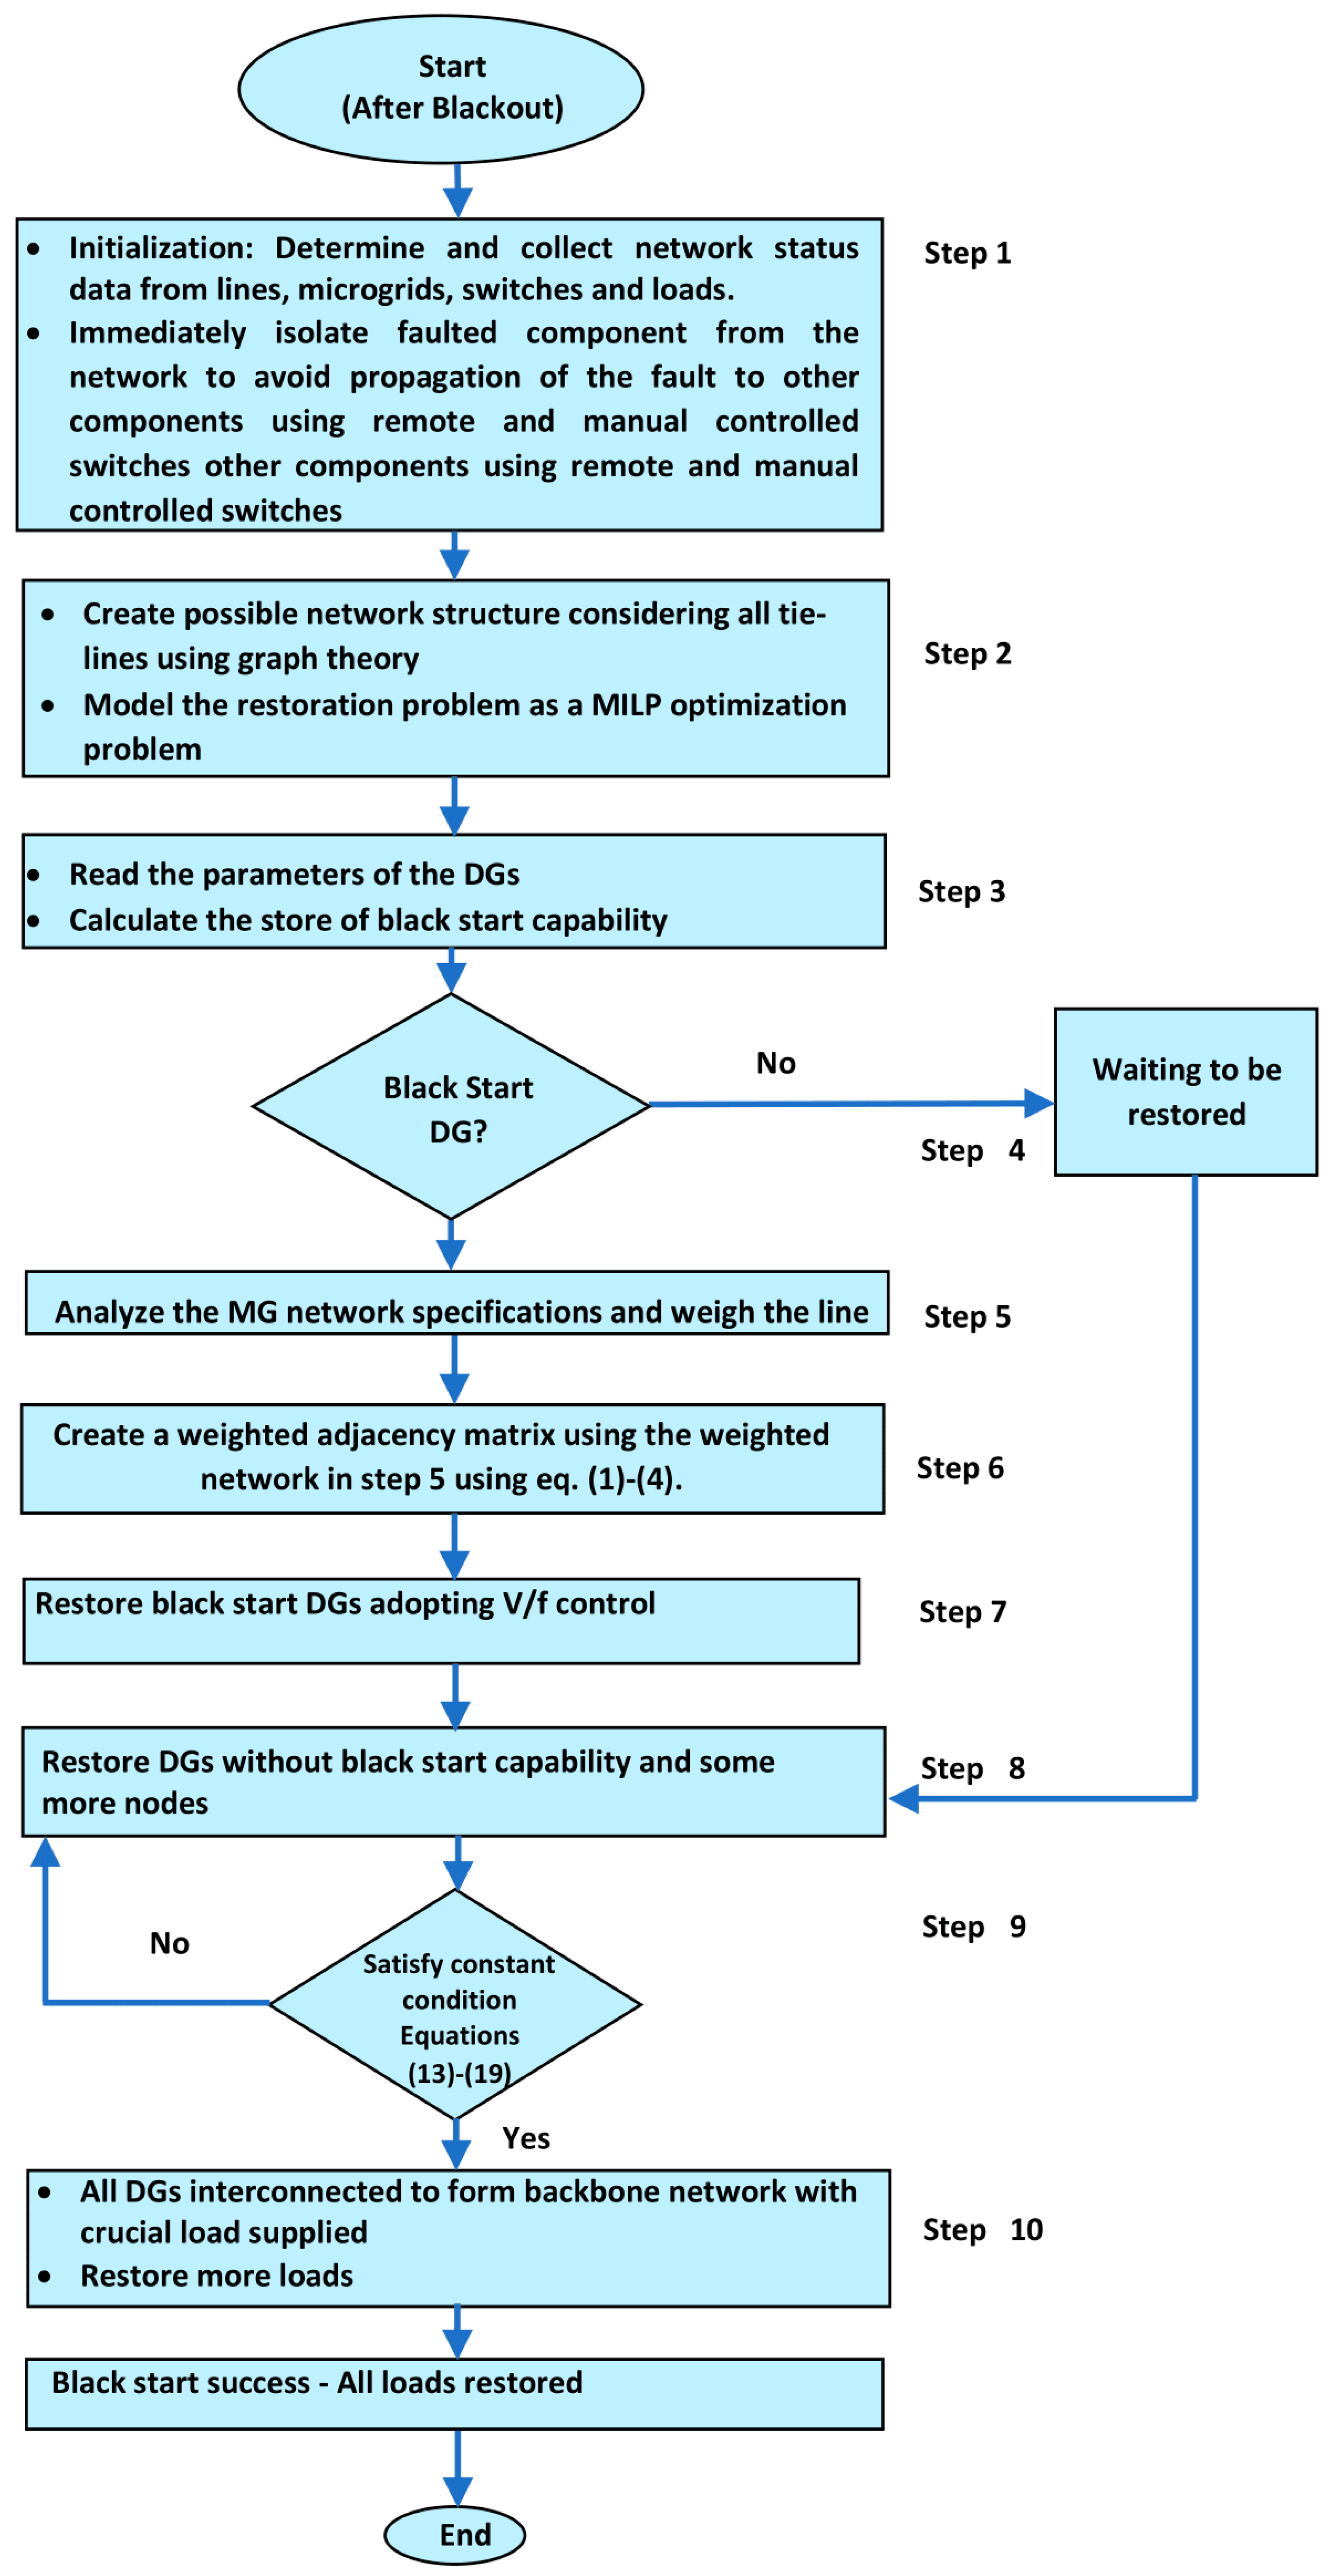
The steps for parallel restoration with respect to critical loads as it was described in Section 4 can be summarized into the following steps:
Step 1 (Initialization): Determine and collect network status data from lines, MGs, switches, and loads. Immediately isolate faulted component from the network to avoid propagation of the fault to other components using remote and manual controlled switches.
Step 2: Create possible network structure considering all tie-lines using graph theory. Model the restoration problem as an MILP optimization problem.
Step 3: Read in the parameters of each DG in an MG, including the SOC of the energy storage device on DG, real-time output power, and load capacity. These parameters are given in Table 3.
Step 4: DGs with strong BS capability are chosen to be restored first in accordance with the complete score of BS capability.
Step 5: Analyze the MG network specifications and weigh the line based on how long it has been operational.
Step 6: Create a weighted adjacency matrix using the weighted network in step 5 (Equations (1)–(4)). Equation (4) is used to determine each node’s relevance degree. This work chooses the highest node value significance degree (max Wk) as the significance degree of the power supply node because the node of the power supply must be restored in priority during network restoration.
Step 7: Restore the BS units using V/f control by the BS DGs to maintain a constant voltage and frequency. The grid is connected in PQ control mode with the DGs that need to be restored. High-BS DGs use a V/f control method to maintain constant voltage and frequency, while those with poor scores use PQ control once the connection between BS DGs is established.
Step 8: Restore DGs without BS capability and some more nodes containing critical loads.
Step 9: To maintain the steady operation of the network throughout the restoration process, it is required to first provide the critical loads with a certain priority. It is also necessary to assess whether the restrictions (13)–(19) are satisfied. Based on the restored lines and nodes, go back to Step 8 and choose a new recovery path if a line operation fails during the restoration process. Repeat Step 8 until the backbone network can be formed by connecting all DGs. Once the BS procedure is successful and the MGs are fully back in operation, activate the last loads.
Step 10: Since all DGs are interconnected forming a backbone network with crucial load supply, restore more loads until all loads are restored.
Figure 4 depicts the flow chart for this restoration strategy.
5.2. Simulation Results
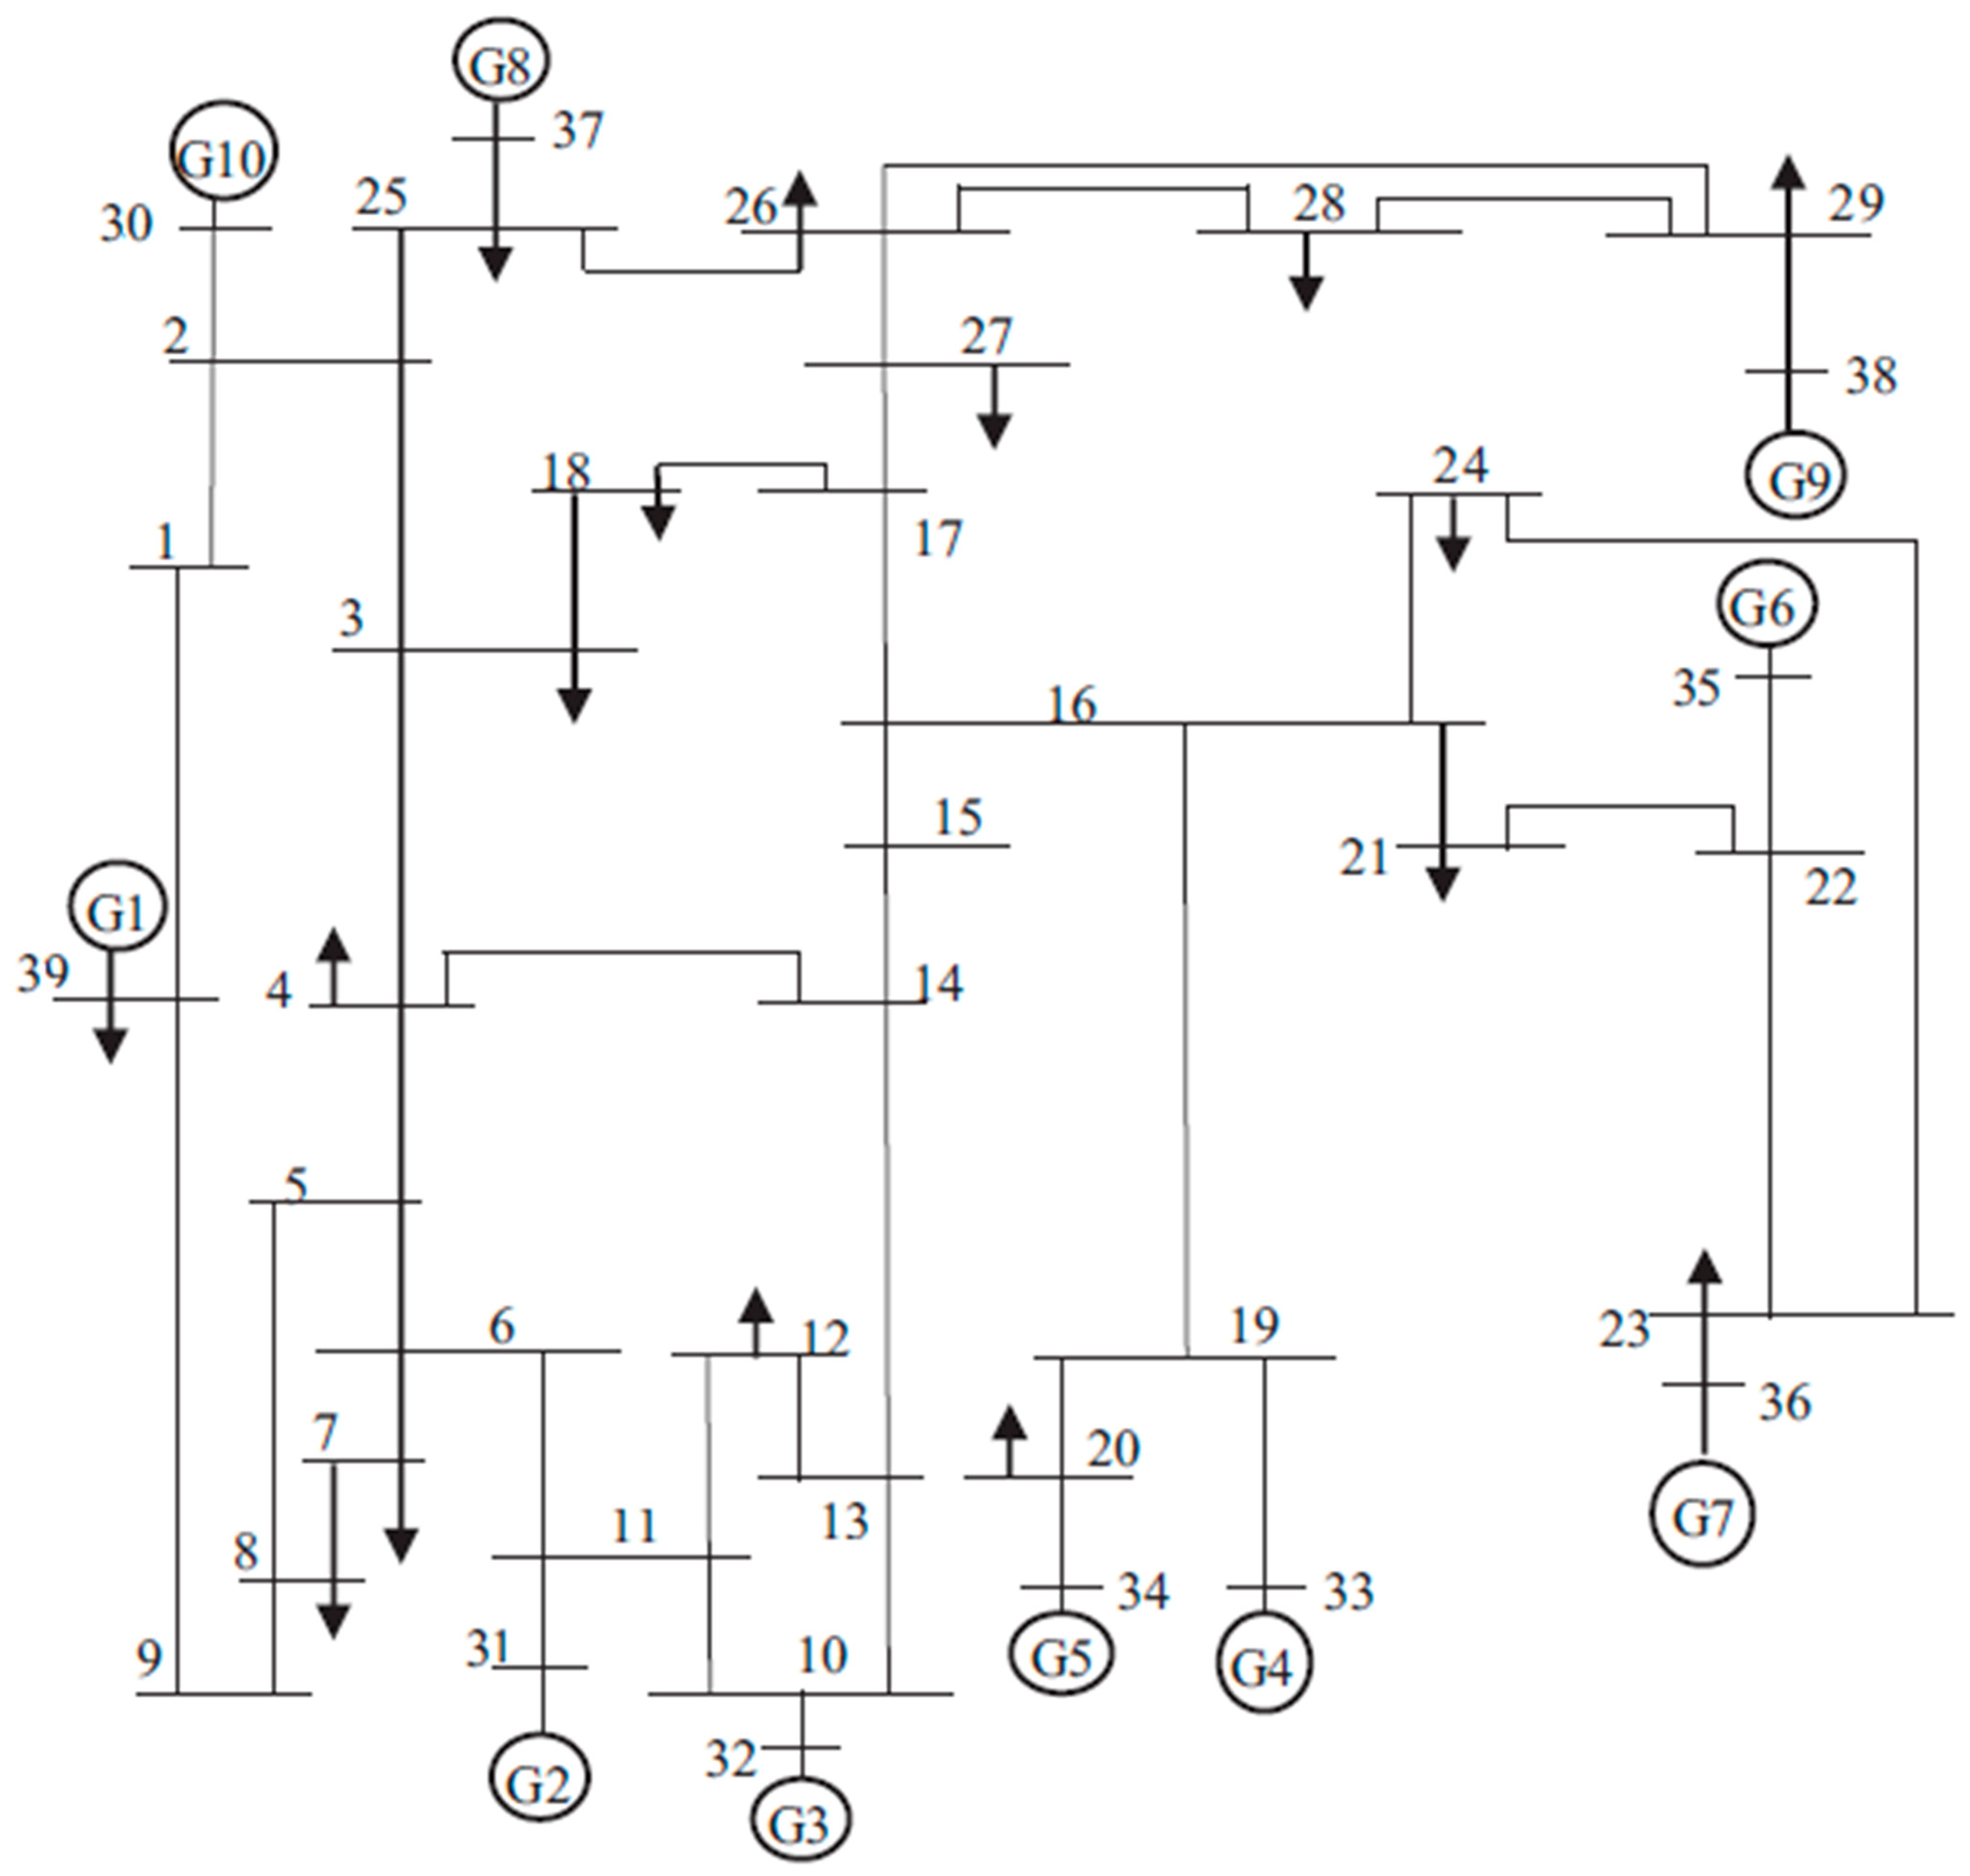
The suggested restoration approach is verified using the IEEE 39-bus system [55] depicted in Figure 5. The IEEE 39-bus system represents a grid (containing microgrids) after a major blackout. Before the blackout occurs, this bus system is connected to the rest of the distribution system of the local Distribution System Operator (DSO) and the Transmission System Operator (TSO). There are 10 generators in the system, of which 3 are BS units. The generators’ data (DG type, the real-time output power, the capacity of the load, and the SOC of each DG) are given in Table 3. The MILP problem in this paper is solved using MATLAB R2022a.
The BS capability evaluation model for each DG is constructed in accordance with Section 5.2, and the total score for the DGs’ BS capability (score) is determined. This score is displayed also in Table 3. There are two DG groups: those with and without BS capabilities. In Table 4, the importance degree of nodes in the 39-bus MG system is shown.
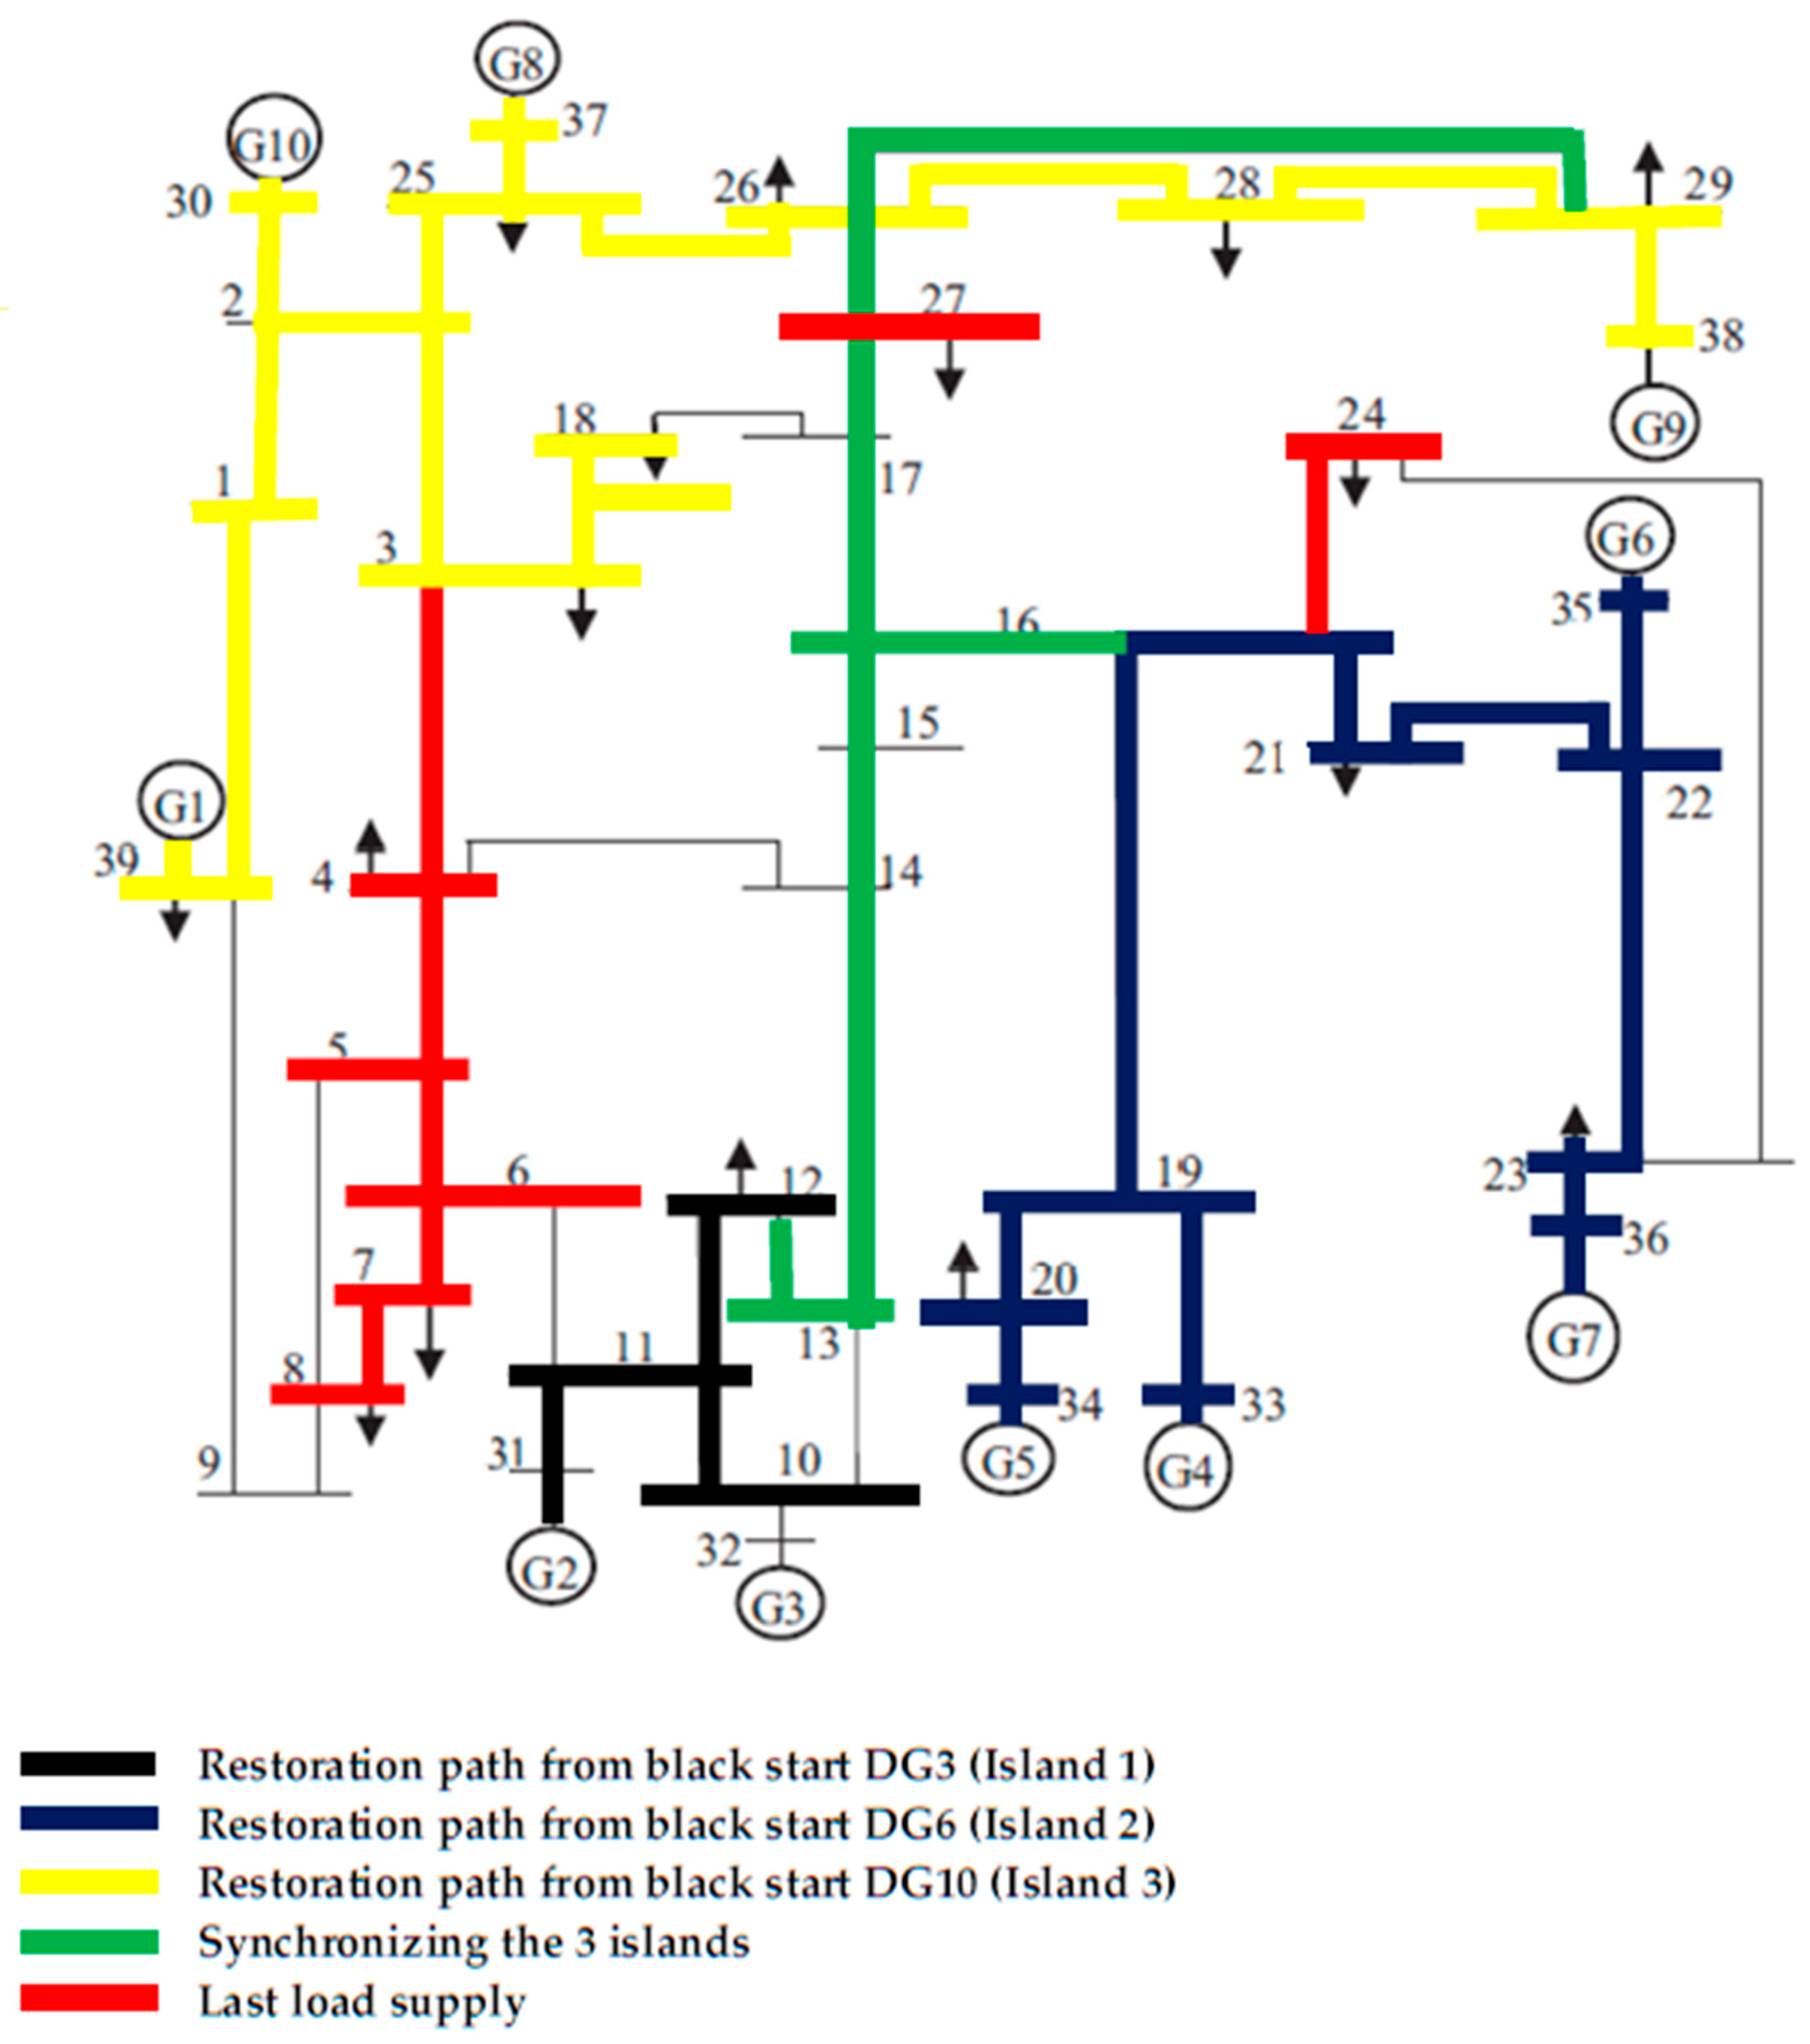
DGs without a BS capability must wait to be restored while DG3, DG6, and DG10, which are BS power sources, are restored first. This way, the most critical loads are restored, and three separate islands are created. The optimal restoration path represents the route that derives from the restoration algorithm presented in the flow chart of Figure 4. The BS unit of each island energizes the node from which both the rest NBS units will retrieve the required voltage to start operating and to feed the most critical loads derived from the MILP in the same island. These optimum restoration paths are presented in Table 5. After that, more loads are supplied, and the three islands are synchronized. These different restoration steps are depicted in Figure 6.
In Table 6, the total energizing time of each island and for the method presented in this work is shown. Comparing the restoration time of each island, we find that Island 1 has the lowest energizing time, which is 115 min, while for Island 2 and Island 3 the restoration times are 145 min and 165 min, respectively. Thus, Island 1 is selected first and the other two follow next. After having created the 3 islands, they are then synchronized.
A comparison with previous publications [56,57,58] where different methods have been applied demonstrates the benefit of the proposed method presented in this work, shown in Table 6. The approach in [56] focuses on coordinating the loading level of the generators with the pickup of important loads. This optimization model is resolved using the global-best harmony search (GHS). In [57], a unique graph theory based method for restoring large-scale power systems that have been affected by total blackouts is presented. The method then applies power system restoration, restoring the created islands in parallel. A method based on the structure of the community of the complex network theory is used for creating islands in [58]. The above-mentioned methods have also been applied to the IEEE 39-bus system, and each of them has also created 3 separate islands during its application. The findings demonstrate that, although the findings are similar (similar islanding, etc.), the suggested approach in the current work can find restoration paths more efficiently and faster than the previous research works [56,57,58].
6. Discussion
The efficiency of the proposed method has been compared with other methods for parallel restoration of separated islands in [56,57,58]. Comparisons were made for the IEEE 39-bus test scenario where critical loads and NBS generators are utilized in accordance with the suggested methodology to produce several islands that will subsequently be synchronized. The primary goal of an MG restoration is always the quick restoration of NBS units. The proposed method has advantages in comparison to other methods in terms of recovering critical loads. Since the initial restored system is vulnerable and has a small amount of generation capacity, it is practical for system operators to only take on a few crucial loads during the power system restoration. In comparison to other methods, the critical loads are picked up much faster using the proposed method and the MCDM.
Given the way switches operate, the load characteristics and the unpredictable behavior of electricity consumers, it is generally improbable that the power loads will change unpredictably following a blackout. Therefore, the most significant aspects that will impact the restoration procedure and determine the load of the generators are the pick-up characteristics of loads and the balance between demand and generation. Even after a critical load’s substation is restored, the load cannot be picked up until the restoration subsystem’s total active power output reaches a specific level. The suggested approach has a strong theoretical basis and may be used to help operators plan for power system restoration using a bottom-up approach.
7. Conclusions
In this study, a restoration method for MG BS is suggested. First, the electric load’s weight is evaluated using Multi-Criteria Decision Making. Afterwards, a variation coefficient method is used to create the evaluation model of DGs’ black start capacity. A diversity sequence technique eliminates DGs with strong BS capability. The importance level of nodes is presented, helping to select the best recovery path under the constraints of DGs and the grid. The BS power unit uses a V/f control method to give the parallel-restored DGs reference voltage and frequency. A modified IEEE 39-bus MG system is used to confirm the feasibility of the suggested strategy. The suggested method can be applied to other radial distribution networks and can be tested on a real system to see how well it works in real-world scenarios.
Author Contributions
Conceptualization, V.V. and G.F.; methodology, G.F.; software, C.P.; validation, V.V., G.F., C.P. and V.M.; formal analysis, V.V., G.F., C.P. and V.M.; investigation, V.V. and G.F.; resources, V.V., G.F., C.P. and V.M.; writing—original draft preparation, V.V. and G.F.; writing—review and editing, V.V. and G.F.; visualization, V.V. and G.F.; supervision, V.M. All authors have read and agreed to the published version of the manuscript.
Funding
This research received no external funding.
Conflicts of Interest
The authors declare no conflict of interest.
References
- Weedy, B.M.; Cory, B.J.; Jenkins, N.; Ekanayake, J.B.; Strbac, G. Electric Power Systems, 5th ed.; Wiley: Hoboken, NJ, USA, 2012. [Google Scholar]
- ENTSO-E. Draft Network Code for Operational Security. 2012. Available online: https://eepublicdownloads.entsoe.eu/clean-documents/pre2015/consultations/Network_Code_OS/120817-AS-NC_OS-Draft_Network_Code.pdf (accessed on 30 October 2022).
- Osička, J.; Černoch, F. European energy politics after Ukraine: The road ahead. Energy Res. Soc. Sci. 2022, 91, 102757. [Google Scholar] [CrossRef]
- Liang, G.; Weller, S.R.; Zhao, J.; Luo, F.; Dong, Z.Y. The 2015 Ukraine Blackout: Implications for False Data Injection Attacks. IEEE Trans. Power Syst. 2017, 32, 3317–3318. [Google Scholar] [CrossRef]
- Sullivan, J.E.; Kamensky, D. How cyber-attacks in Ukraine show the vulnerability of the US power grid. Electr. J. 2017, 30, 30–35. [Google Scholar] [CrossRef]
- Ten, C.-W.; Yamashita, K.; Yang, Z.; Vasilakos, A.V.; Ginter, A. Impact Assessment of Hypothesized Cyberattacks on Interconnected Bulk Power Systems. IEEE Trans. Smart Grid 2018, 9, 4405–4425. [Google Scholar] [CrossRef] [Green Version]
- Bråten, D.P. Taser or Shock Collar? Energy as a Weapon and Interdependence in the Ukraine Crisis 2014–2015. Master’s Thesis, University of Oslo, Oslo, Norway, 2017. [Google Scholar]
- Kreishan, M.Z.; Fotis, G.P.; Vita, V.; Ekonomou, L. Distributed Generation Islanding Effect on Distribution Networks and End User Loads Using the Load Sharing Islanding Method. Energies 2016, 9, 956. [Google Scholar] [CrossRef] [Green Version]
- Ekonomou, L.; Fotis, G.; Vita, V.; Mladenov, V. Distributed Generation Islanding Effect on Distribution Networks and End User Loads Using the Master-Slave Islanding Method. J. Power Energy Eng. 2016, 4, 1–24. [Google Scholar] [CrossRef] [Green Version]
- Fotis, G.; Dikeakos, C.; Zafeiropoulos, E.; Pappas, S.; Vita, V. Scalability and Replicability for Smart Grid Innovation Projects and the Improvement of Renewable Energy Sources Exploitation: The FLEXITRANSTORE Case. Energies 2022, 15, 4519. [Google Scholar] [CrossRef]
- Zafeiropoulou, M.; Mentis, I.; Sijakovic, N.; Terzic, A.; Fotis, G.; Maris, T.I.; Vita, V.; Zoulias, E.; Ristic, V.; Ekonomou, L. Forecasting Transmission and Distribution System Flexibility Needs for Severe Weather Condition Resilience and Outage Management. Appl. Sci. 2022, 12, 7334. [Google Scholar] [CrossRef]
- Sijakovic, N.; Terzic, A.; Fotis, G.; Mentis, I.; Zafeiropoulou, M.; Maris, T.I.; Zoulias, E.; Elias, C.; Ristic, V.; Vita, V. Active System Management Approach for Flexibility Services to the Greek Transmission and Distribution System. Energies 2022, 15, 6134. [Google Scholar] [CrossRef]
- Ghaithi, H.M.; Fotis, G.; Vita, V. Techno-Economic Assessment of Hybrid Energy Off-Grid System—A Case Study for Masirah Island in Oman. Int. J. Power Energy Res. 2017, 11, 103–116. [Google Scholar] [CrossRef]
- Sambhi, S.; Sharma, H.; Kumar, P.; Fotis, G.; Vita, V.; Ekonomou, L. Techno-Economic Optimization of an Off-Grid Hybrid Power Generation for SRM IST, Delhi-NCR Campus. Energies 2022, 15, 7880. [Google Scholar] [CrossRef]
- Wu, Z.; Zhang, D.; Lin, X. Research on the Extended Black-Start Scheme of Power System with Microgrid. IJREAT Int. J. Res. Eng. Adv. Technol. 2016, 4, 203–215. [Google Scholar]
- Xu, Z.; Yang, P.; Zheng, Q.; Zeng, Z. Study on black start strategy of microgrids with PV and multiple energy storage systems. In Proceedings of the IEEE International Conference on Electrical Machines and Systems, Pattaya, Thailand, 25–28 October 2016; pp. 402–408. [Google Scholar]
- Moreira, C.L.; Resende, F.O.; Lopes, J.A.P. Using Low Voltage MicroGrids for Service Restoration. IEEE Trans. Power Syst. 2007, 22, 395–403. [Google Scholar] [CrossRef] [Green Version]
- Cai, N.; Xu, X.; Mitra, J. A hierarchical multi-agent control scheme for a black start-capable microgrids. In Proceedings of the IEEE Power and Energy Society General Meeting, Detroit, MI, USA, 24–29 July 2011; pp. 1–7. [Google Scholar]
- Lopes, J.A.P.; Moreira, C.L.; Madureira, A.G.; Resende, F.O.; Wu, X.; Jayawarna, N.; Zhang, Y.; Jenkins, N.; Kanellos, F.; Hatziargyriou, N. Control strategies for microgrids emergency operation. In Proceedings of the IEEE International Conference on Future Power Systems, Amsterdam, The Netherlands, 18 November 2005; pp. 1–6. [Google Scholar]
- Liu, Y.; Gu, X.P. Skeleton-network reconfiguration based on topological characteristics of scale-free networks and discrete particle swarm optimization. IEEE Trans. Power Syst. 2007, 22, 1267–1274. [Google Scholar] [CrossRef]
- Zhang, X.L.; Liang, H.P.; Zhu, T.; Zhao, C.; Li, W.; Gu, X. Optimization of power network reconfiguration based on fuzzy chance constrained programming. Autom. Electr. Power Syst. 2015, 39, 68–74. [Google Scholar] [CrossRef]
- Cao, X.; Wang, H.T.; Liu, Y.T. A hierarchical collaborative optimization method for transmission network restoration. Proc. CSEE 2015, 35, 4906–4917. [Google Scholar]
- Mota, A.A.; Mota, M.T.M.; Morelato, A. Visualization of power system restoration plans using CPM/PERT graphs. IEEE Trans. Power Syst. 2007, 22, 1322–1329. [Google Scholar] [CrossRef]
- Duffey, R.B.; Ha, T. The probability and timing of power system restoration. IEEE Trans. Power Syst. 2013, 28, 3–9. [Google Scholar] [CrossRef]
- Fotis, G.; Vita, V.; Maris, T.I. Risks in the European Transmission System and a Novel Restoration Strategy for a Power System after a Major Blackout. Appl. Sci. 2023, 13, 83. [Google Scholar] [CrossRef]
- Haes Alhelou, H.; Hamedani-Golshan, M.E.; Njenda, T.C.; Siano, P. A Survey on Power System Blackout and Cascading Events: Research Motivations and Challenges. Energies 2019, 12, 682. [Google Scholar] [CrossRef] [Green Version]
- IEC. Microgrids for Disaster Preparedness and Recovery—With Electricity Continuity Plans and Systems. 2014. Available online: https://www.iec.ch/basecamp/microgrids-disaster-preparedness-and-recovery-electricity-continuity-plans-and-systems (accessed on 24 October 2022).
- Hatziargyriou, N.; Amantegui, J.; Andersen, B.; Armstrong, M.; Boss, P.; Dalle, B.; De Montravel, G.; Negri, A.; Nucci, C.A.; Southwell, P. Cigre wg network of the future, electricity supply systems of the future. Electra 2011, 256, 42–49. [Google Scholar]
- CEN/CENELEC/ETSI Joint Working Group (2011), Final Report on Standards for Smart Grids. Available online: https://www.etsi.org/images/files/Report_CENCLCETSI_Standards_Smart_Grids.pdf (accessed on 24 October 2022).
- Energy Independence and Security Act of 2007: Title XIII—Smart Grid, Public Law 110–140, 110th Congress of the United States. December 2007. Available online: https://www.govinfo.gov/content/pkg/PLAW-110publ140/pdf/PLAW-110publ140.pdf (accessed on 24 October 2022).
- Slootweg, C.J.; Montes, C.; Portela; Morren, J. Smart grids—Intelligence for sustainable electrical power systems. In Proceedings of the 33rd IEEE International Telecommunications Energy Conference (INTELEC), Amsterdam, The Netherlands, 9–13 October 2011; pp. 1–8. [Google Scholar]
- Wang, W.; Xu, Y.; Khanna, M. A survey on the communication architectures in smart grid. Comput. Netw. 2011, 55, 3604–3629. [Google Scholar] [CrossRef]
- Wu, F.F.; Moslehi, K.; Bose, A. Power System Control Centers: Past, Present, and Future. Proc. IEEE 2005, 93, 1890–1908. [Google Scholar] [CrossRef]
- Ekanayake, J.; Liyanage, K.; Wu, J.; Yokoyama, A.; Jenkins, N. Smart Grid: Technology and Applications; John Wiley and Sons: New York, NY, USA, 2012. [Google Scholar]
- Farhangi, H. The path of the smart grid. IEEE Power Energy Mag. 2010, 8, 18–28. [Google Scholar] [CrossRef]
- Liu, Y.; Fan, R.; Terzija, V. Power system restoration: A literature review from 2006 to 2016. J. Mod. Power Syst. Clean Energy 2016, 4, 332–341. [Google Scholar] [CrossRef] [Green Version]
- Sidhu, T.S.; Tziouvaras, D.A.; Apostolov, A.P.; Castro, C.H.; Chano, S.R.; Horowitz, S.H.; Kennedy, W.O.; Kim, S.; Martilla, R.J. Protection issues during system restoration. IEEE Trans. Power Deliv. 2005, 20, 47–56. [Google Scholar] [CrossRef]
- Noludwe, S.; Folly, Κ.A. Using Microgrids for Critical Load Restoration in Distribution Systems. IFAC-PapersOnLine 2020, 53, 12894–12899. [Google Scholar] [CrossRef]
- Wang, M.; Wu, T. Load restoration optimization based on entropy weight method. In Proceedings of the IEEE International Conference on Power and Renewable Energy (ICPRE), Shanghai, China, 21–23 October 2016; pp. 368–372. [Google Scholar] [CrossRef]
- Li, J.; Ma, X.-Y.; Liu, C.-C.; Schneider, K.P. Distribution System Restoration with Microgrids Using Spanning Tree Search. IEEE Trans. Power Syst. 2014, 29, 3021–3029. [Google Scholar] [CrossRef]
- Rehman, A.U.; Abidi, M.H.; Umer, U.; Usmani, Y.S. Multi-Criteria Decision-Making Approach for Selecting Wind Energy Power Plant Locations. Sustainability 2019, 11, 6112. [Google Scholar] [CrossRef] [Green Version]
- Fotis, G.; Kontargyri, V.T.; Gonos, I.F.; Stathopulos, I.A. Selection of the Optimal Insulator Type for a new Overhead Transmission Line, using the Method of the Multicriterial Decision Making. In Proceedings of the 38th International Universities Power Engineering Conference (UPEC 2003), Thessaloniki, Greece, 1–3 September 2003; pp. 101–104. [Google Scholar]
- Zhou, M.; Liu, X.-B.; Yang, J.-B.; Chen, Y.-W.; Wu, J. Evidential reasoning approach with multiple kinds of attributes and entropy-based weight assignment. Knowl.-Based Syst. 2019, 163, 358–375. [Google Scholar] [CrossRef]
- Li, D.; Zhao, B.; Wu, Z.; Zhang, X.; Zhang, L. An improved droop control strategy for low-voltage microgrids based on distributed secondary power optimization control. Energies 2017, 10, 1347. [Google Scholar] [CrossRef]
- Malik, S.M.; Ai, X.; Sun, Y.; Zhengqi, C.; Shupeng, Z. Voltage and frequency control strategies of hybrid AC/DC microgrids: A review. IET Gener. Transm. Distrib. 2017, 11, 303–313. [Google Scholar] [CrossRef]
- Xiao, Z.; Li, T.; Huang, M.; Shi, J.; Yang, J.; Yu, J.; Wu, W. Hierarchical MAS based control strategy for microgrids. Energies 2010, 3, 8–9. [Google Scholar] [CrossRef]
- Adibi, M.M.; Kafka, R.J.; Milanicz, D.P. Expert system requirements for power system restoration. IEEE Trans. Power Syst. 1994, 9, 1592–1600. [Google Scholar] [CrossRef]
- Sarwar, S.; Mokhlis, H.; Othman, M.; Muhammad, M.A.; Laghari, J.A.; Mansor, N.N.; Mohamad, H.; Pourdaryaei, A. A Mixed Integer Linear Programming Based Load Shedding Technique for Improving the Sustainability of Islanded Distribution Systems. Sustainability 2020, 12, 6234. [Google Scholar] [CrossRef]
- Yip, J.; Garcia, M.; Pierre, B.; Kutanoglu, E.; Santoso, S. Optimal Black-Start Restoration Assisted by Mobile Energy Storage. In Proceedings of the IEEE Power & Energy Society General Meeting (PESGM), Denver, CO, USA, 17–21 July 2022; pp. 1–5. [Google Scholar] [CrossRef]
- Martν, J.R.; Ahmadi, H.; Bashualdo, L. Linear power-flow formulation based on a voltage-dependent load model. IEEE Trans. Power Deliv. 2013, 28, 1682–1690. [Google Scholar] [CrossRef]
- Montoya, O.D.; Grisales-Norena, L.; Gonzalez-Montoya, D.; Ramos-Paja, C.; Garces, A. Linear power flow formulation for low-voltage DC power grids. Electr. Power Syst. Res. 2018, 163, 375–381. [Google Scholar] [CrossRef]
- Montoya, O.D.; Gil–González, W.; Grisales–Noreña, L.F. Linear–based Newton–Raphson Approximation for Power Flow Solution in DC Power Grids. In Proceedings of the 9th IEEE Power, Instrumentation and Measurement Meeting (EPIM), Salto, Uruguay, 14–16 November 2018; pp. 1–6. [Google Scholar] [CrossRef]
- Liu, K.; Wang, C.; Wang, W.; Chen, Y.; Wu, H. Linear power flow calculation of distribution networks with distributed generation. IEEE Access 2019, 7, 44686–44695. [Google Scholar] [CrossRef]
- Baran, M.E.; Wu, F.F. Network reconfiguration in distribution systems for loss reduction and load balancing. IEEE Trans. Pow. Del. 1989, 4, 1401–1407. [Google Scholar] [CrossRef]
- Athay, T.; Podmore, R.; Virmani, S. A Practical Method for the Direct Analysis of Transient Stability. IEEE Trans. Power Appar. Syst. 1979, PAS–98, 573–584. [Google Scholar] [CrossRef]
- Liu, W.; Lin, Z.; Wen, F.; Chung, C.Y.; Xue, Y.; Ledwich, G. Sectionalizing strategies for minimizing outage durations of critical loads in parallel power system restoration with bi-level programming. Electr. Power Energy Syst. 2015, 71, 327–334. [Google Scholar] [CrossRef]
- Quiros-Tortos, J.; Terzija, V. A graph theory based new approach for power system restoration. In Proceedings of the IEEE Power Technology, Grenoble, France, 16–20 June 2013; pp. 1–6. [Google Scholar]
- Lin, Z.Z.; Wen, F.S.; Wong, K.P.; Zhou, H. Division algorithm and interconnection strategy of restoration subsystems based on complex network theory. IET Gener. Transm. Distrib. 2011, 5, 674–683. [Google Scholar] [CrossRef]
Figure 1.
Warning and restoration times before a blackout event.

Figure 2.
The main changes in structure and operation between conventional control centers and smart grids.
Figure 2.
The main changes in structure and operation between conventional control centers and smart grids.

Figure 3.
The three axes of development of smart grids.

Figure 4.
Flow chart of the restoration strategy.

Figure 5.
IEEE 39-bus system.

Figure 6.
Optimal restoration paths in the IEEE 39-bus system.


Table 1.
Significant blackouts in the 21st century.
| Date | Country/Region | Outage Cause | Affected People in Millions | Duration |
|---|---|---|---|---|
| February 2021 | USA | Loss of generation due to cold weather | 4.5 | 4 days |
| August 2019 | Indonesia | Fault in the transmission system, affecting Jakarta | 21.3 | 9 h |
| June 2019 | Uruguay | Cascading failures due to bad weather conditions | 3.4 | 4 h |
| December 2018 | Canada | High winds (up to 100 km/h) | 0.6 | 4 h |
| July 2018 | Azerbaijan | Unexpectedly high temperatures | 8 | 8 h |
| March 2018 | Brazil | Transmission line failure | 10 | 1 h |
| January 2018 | Sudan | Cascading failures | 41.5 | 1 day |
| September 2017 | USA | Hurricanes Maria & Irma | 6.7 | 10 days |
| March 2017 | USA | High winds (up to 100 km/h) | 1 | 9 days |
| June 2016 | Kenya | Transformer short circuit due to animal approach | 10 | 4 h |
| March 2016 | Sri Lanka | Severe thunderstorm | 10 | 16 h |
| December 2015 | Ukraine | Cyber-attack | 0.2 | 6 h |
| November 2015 | Ukraine | Power system failure | 1.2 | 6 h |
| March 2015 | Turkey | Power system failure | 70 | 4 h |
| January 2015 | Pakistan | Plant technical fault | 140 | 2 h |
| November 2014 | Bangladesh | HVDC station outage | 150 | 1 day |
| August 2013 | Philippines | Voltage collapse | 8 | 12 h |
| May 2013 | Thailand | Lightning strike | 8 | 10 h |
| May 2013 | Vietnam | Crane operator | 10 | 10 h |
| October 2012 | USA | Hurricane Sandy | 8 | 8 days |
| July 2012 | India | Cascading failure | 620 | 12 h |
| September 2011 | USA | Cascading failure caused by the loss of a 500 kV line and subsequent operational error | 2.7 | 12 h |
| November 2008 | Western Europe | Cascading failure caused by poor planning of power systems operations | 15 | 2 h |
| August 2005 | Indonesia | Cascading failure caused by loss of a single line | 100 | 7 h |
| September 2003 | Italy | Cascading failure caused by the loss of a single line due to a storm | 56 | 12 h |
| August 2003 | USA, Canada | Series of faults caused by tree falls on power lines in combination with human error and software failure | 55 | 4 days |
| January 2001 | India | Substation failure | 226 | 12 h |
Table 2.
Decision matrix with weighted criteria for the loads of each node.
| Assessment j Criterion → Alternative Load (i) ↓ | 1 | 2 | 3 | … | n |
|---|---|---|---|---|---|
| 1 | X11 | X12 | X13 | … | X1n |
| 2 | X21 | X22 | X23 | … | X2n |
| 3 | X31 | X32 | X33 | … | X3n |
| … | … | … | … | … | … |
| m | Xm1 | Xm2 | Xm3 | … | Xmn |
| Weight of the criterion → | W1 | W2 | W3 | … | Wn |
Table 3.
DG data for the IEEE 39-bus system and its classification.
| Node No | DG | DG Type | Output (kW) | Starting Time (min) | Load Capacity (%/min) | SOC | Black Start DG | Control Strategy | Score |
|---|---|---|---|---|---|---|---|---|---|
| 39 | G1 | Wind turbines with no energy storage | 570 | 3.50 | 6.28 | 0.0 | NO | PQ | 0.25698 |
| 31 | G2 | Wind turbines with no energy storage | 650 | 4.80 | 4.10 | 0.0 | NO | PQ | 0.26789 |
| 32 | G3 | Battery | 630 | 3.90 | 4.02 | 0.7 | YES | V/f | 0.81546 |
| 33 | G4 | Wind turbines with no energy storage | 506 | 3.40 | 6.02 | 0.0 | NO | PQ | 0.27456 |
| 34 | G5 | PV without energy storage | 650 | 4.10 | 4.31 | 0.0 | NO | PQ | 0.28974 |
| 35 | G6 | Micro gas turbine | 560 | 4.70 | 4.02 | 1.0 | YES | V/f | 0.94587 |
| 36 | G7 | PV without energy storage | 540 | 4.10 | 4.31 | 0.0 | NO | PQ | 0.28758 |
| 37 | G8 | Wind turbines with no energy storage | 830 | 3.80 | 6.73 | 0.0 | NO | PQ | 0.27895 |
| 38 | G9 | PV without energy storage | 1000 | 4.30 | 4.71 | 0.0 | NO | PQ | 0.28654 |
| 3 | G10 | PV with energy storage | 250 | 4.20 | 3.89 | 0.8 | YES | V/f | 0.74658 |
Table 4.
Importance degree of nodes in the 39-bus MG system.
| Node No. | Importance Degree of the Node | Node No. | Importance Degree of the Node | Node No. | Importance Degree of the Node |
|---|---|---|---|---|---|
| 1 | 0.4997 | 14 | 0.6593 | 27 | 0.7499 |
| 2 | 0.5005 | 15 | 0.7002 | 28 | 0.7509 |
| 3 | 0.7539 | 16 | 0.7109 | 29 | 0.7520 |
| 4 | 0.7527 | 17 | 0.7255 | 30 | 0.4250 |
| 5 | 0.5768 | 18 | 0.7636 | 31 | 0.5999 |
| 6 | 0.5799 | 19 | 0.6293 | 32 | 0.4652 |
| 7 | 0.7452 | 20 | 0.7485 | 33 | 0.5492 |
| 8 | 0.7399 | 21 | 0.7598 | 34 | 0.5559 |
| 9 | 0.6435 | 22 | 0.7386 | 35 | 0.4359 |
| 10 | 0.4793 | 23 | 0.7496 | 36 | 0.5656 |
| 11 | 0.5876 | 24 | 0.7589 | 37 | 0.5099 |
| 12 | 0.7631 | 25 | 0.5198 | 38 | 0.5293 |
| 13 | 0.6097 | 26 | 0.7590 | 39 | 0.7390 |
Table 5.
Optimal restoration paths.
| Black Start DGs | DGs to Be Restored | Critical Loads to Be Restored | Optimal Restoration Path |
|---|---|---|---|
| DG10 | DG8 | 18 | 30→2→25→37 |
| DG1 | 30→2→1→39 | ||
| DG9 | 30→2→25→26→28→29→38 | ||
| DG6 | DG7 | 2 | 35→22→23→36 |
| DG4 | 35→22→21→16→19→33 | ||
| DG5 | 35→22→21→16→19→20→34 | ||
| DG3 | DG2 | 12 | 32→10→11→31 |
Table 6.
Methods for microgrid restoration after a blackout.
| Method | Island No | Generation Bus | Total Energizing Time (min) |
|---|---|---|---|
| Proposed method | 1 | 31, 32 | 115 |
| 2 | 33, 34, 35, 36 | 145 | |
| 3 | 30, 37, 39 | 165 | |
| Ref [56] | 1 | 31, 32 | 165 |
| 2 | 33, 34, 35, 36 | 185 | |
| 3 | 30, 37, 38, 39 | 200 | |
| Ref [57] | 1 | 31, 32, 39 | 195 |
| 2 | 30, 37, 38 | 195 | |
| 3 | 33, 34, 35, 36 | 180 | |
| Ref [58] | 1 | 31, 32, 39 | 195 |
| 2 | 30, 37, 38 | 195 | |
| 3 | 33, 34, 35, 36 | 180 |
Disclaimer/Publisher’s Note: The statements, opinions and data contained in all publications are solely those of the individual author(s) and contributor(s) and not of MDPI and/or the editor(s). MDPI and/or the editor(s) disclaim responsibility for any injury to people or property resulting from any ideas, methods, instructions or products referred to in the content. |
© 2023 by the authors. Licensee MDPI, Basel, Switzerland. This article is an open access article distributed under the terms and conditions of the Creative Commons Attribution (CC BY) license (https://creativecommons.org/licenses/by/4.0/).
Share and Cite
MDPI and ACS Style
Vita, V.; Fotis, G.; Pavlatos, C.; Mladenov, V. A New Restoration Strategy in Microgrids after a Blackout with Priority in Critical Loads. Sustainability 2023, 15, 1974. https://doi.org/10.3390/su15031974
AMA Style
Vita V, Fotis G, Pavlatos C, Mladenov V. A New Restoration Strategy in Microgrids after a Blackout with Priority in Critical Loads. Sustainability. 2023; 15(3):1974. https://doi.org/10.3390/su15031974
Chicago/Turabian StyleVita, Vasiliki, Georgios Fotis, Christos Pavlatos, and Valeri Mladenov. 2023. "A New Restoration Strategy in Microgrids after a Blackout with Priority in Critical Loads" Sustainability 15, no. 3: 1974. https://doi.org/10.3390/su15031974
Note that from the first issue of 2016, this journal uses article numbers instead of page numbers. See further details here.