
Study of the Energy Efficiency of Compressed Air Storage Tanks


Faculty of Mechatronics and Mechanical Engineering, Kielce University of Technology, al. Tysiaclecia Panstwa Polskiego 7, 25-314 Kielce, Poland
Sustainability 2024, 16(4), 1664; https://doi.org/10.3390/su16041664
Submission received: 8 January 2024
/
Revised: 14 February 2024
/
Accepted: 15 February 2024
/
Published: 17 February 2024
(This article belongs to the Section Energy Sustainability)
Abstract
:This study focusses on the energy efficiency of compressed air storage tanks (CASTs), which are used as small-scale compressed air energy storage (CAES) and renewable energy sources (RES). The objectives of this study are to develop a mathematical model of the CAST system and its original numerical solutions using experimental parameters that consider polytropic charging and discharging processes, changes in the time of the temperature, flow parameters of the inlet and outlet valves under choked and subsonic conditions, and the characteristics of the air motor. This model is used to select CAST as an energy storage system for compressed air generated by compressors and recycling, as well as an energy source to drive DC generators and a pneumatic propulsion system (PPS). A measuring test rig is built to verify the polytropic pressure and temperature variations during CAST charging and discharging obtained from numerical solutions. The topic of discussion is the functional model of a high-pressure air system (HPAS) that contains a CAST connected to an air motor coupled to a mechanical drive for a DC generator or PPS. Such a system is used in small-scale CASTs, which currently respond to socio-economic demands. The presented CAST energy efficiency indicators are used to justify the storage of compressed air energy on a small scale. Small-scale compressed air storage in CASTs is currently important and relevant due to the balance between peak electricity demand and the development of wind energy, photovoltaics, and other renewable energy sources.
1. Introduction
Optimal and effective storage of compressed air energy (CAE) is consistent with the energy efficiency recommendations of the Energy Efficiency Directive (EED) [1]. The European Union (EU) has made energy efficiency a priority and legal obligation, requiring member states to reduce energy consumption by 9% by 2030 compared to 2020 levels. The European Green Deal (EGD) should be synonymous with greater solidarity with climate neutrality [2]. Complete decarbonization of the EU economy can be achieved through action on energy efficiency. The announcement of the European Commission’s Work Programme also covers the implementation of the “Fit for 55” package. The European Commission (EC) has made some suggestions to improve EU policies on climate, energy, transportation, and taxes. The goal is to reduce greenhouse gas emissions by at least 55% by 2030 compared to 1990 levels. In the EU, CAE accounts for approximately 10% of total industrial energy consumption [3]. In Poland, the national energy and climate plan for 2021–2030 includes, among others, reducing emissions and increasing energy efficiency. It has been assumed that a new annual energy savings threshold of 1.5% of total energy consumption will be achieved by 2024. The importance of small-scale CASE in future storage energy systems will increase significantly, especially as distributed energy storage systems. The transition to a low-carbon economy aims to create a storage energy sector that stimulates economic growth, innovation, and job creation. At the same time, it will contribute to improving quality of life, increasing the offer available to consumers and exercising their rights, and ultimately reducing energy bills. The development of a storage energy policy in the EU should move away from the assumptions of decarbonization and toward energy reindustrialization. The development of a storage energy policy may become an incentive for further integration of the Member States, but it must take into account the specificity of individual energy systems and be focused on several areas, including completing the implementation of the concept of a common energy market, reaching a common agreement on the development of the nuclear energy sector, and limiting primary fossil energy sources and financial support for national policies. The EU’s storage energy policy is based on international commitments, both in the Paris Agreement and in accordance with the established Sustainable Development Goals (SDGs). Ultimately, achieving an agreement on a sustainable energy policy and the implementation of its goals will be a difficult task due to the divergent interests of the member states. The 2030 SDGs are the blueprints for achieving a better and more sustainable future.
An increase in CAST energy efficiency is possible by implementing innovative solutions to optimize compressed air consumption, recover and recycle exhausted compressed air, and store CAE on a small scale in tanks, while considering social needs and economic and environmental factors. Optimizing compressed air consumption and improving the energy efficiency of compressed air systems require guidelines and good practices. By improving the CAST energy efficiency, energy waste can be eliminated, which will reduce electricity costs for compressed air production and life cycle cost (LCC) pneumatic devices, which has an impact on increasing the competitiveness of enterprises. Improving the energy efficiency of CASTs will help protect the environment, which is the most effective way to stop climate change and a key element to achieve zero CO2 emissions. The energy consumption of the compressor is approximately 12% of the total energy consumption in the EU. International CAE audit practices are defined in [4], while best practices for energy system management are defined in [5]. Small-scale CAESs are important and are currently relevant as an alternative energy source to electric batteries. The following important arguments support the use of small-scale CASTs in Poland: the development of wind energy and photovoltaic energy, mitigation of the effects of integrating renewable energy sources into the power system, and balance of peak demand for electricity. As a storage energy, CASTs respond to socioeconomic needs. CASTs are used to store energy at high pressures ranging from 100 to 500 bar (10 to 50 MPa) and at low pressures up to 10 bar (0.1 MPa), depending on the specific demand. Low pressure is used in most industrial, technological, transportation, and medical applications [6]. Compressed air system (CAS) networks consist of three main parts: a compressor with a tank, a pipeline, and end users [7,8]. Depending on the pneumatic installation, tanks, also called receivers, reservoirs, vessels, or containers, are used to store and deliver compressed air. In addition, CASs provide greater compressed air efficiency and provide a reserve of compressed air when the compressor is off. However, CASs can also be used for “sudden demand events”. CASTs can be a primary or secondary tank located near the compressor or among the largest air users [9]. Various factors that affect compressed air demand should be considered, such as air consumption, working pressure, leakage, pressure loss, utilization factor, and otter [10]. CASTs can, on the one hand, reduce energy losses and, on the other hand, contribute to energy savings, for example, by reducing leakage, pressure losses, and compressed air demand [11]. The main cause of energy waste in CASs is compressed air leakage, which causes a pressure drop and affects the operation of the CAS [12]. Greater energy savings can be achieved by increasing the size of CASTs [13]. The energy efficiency of CASTs is determined by the efficiency with which compressed air energy is converted into output work [14]. The higher energy efficiency of CASTs results in lower energy consumption, lower energy costs, and lower environmental impact [15].
2. Utilization of Stored Energy in CASTs
Energy storage in CASTs is one of the available energy storage technologies, including electrical, thermal, electrochemical, mechanical, and hydro-pumped. In [16], the use of CASTs as a potential replacement for electrochemical batteries was evaluated. A CAST with a storage pressure of 80 to 100 bar and a capacity of 12 m3 is equal to that of a 12 V electric battery. The CAST compressed air energy storage technology is the most suitable energy storage technology for long-term and full-scale applications. The most suitable energy storage technology for long-term and full-scale applications is CAES [17,18]. In CAES technology, compressed air is stored in underground structures (abandoned mines, aquifers, and rock caverns) or in surface tanks. However, standalone CASTs are used for small-scale compressed air energy storage [19]. Compared with other energy storage technologies, CAST energy storage has high durability, a long service life, and various sizes. The use of CASTs in various pneumatic systems is advantageous because of their different storage volumes, rapid filling, easy energy storage, energy recovery from compressed air, low cost, and ease of operation. In [20], compressed air storage tanks (CASTs) were reviewed to improve the energy efficiency of various pneumatic systems such as measurement systems (MSs), CAS, CAES, PPS, pneumatic brake systems (PBSs), and compressed air vehicles (CAVs). The air tank charging and discharging processes are used as alternative methods to determine the flow characteristics of pneumatic valves [21]. Instantaneous mass flow rate, sonic conductance, critical pressure ratio of pneumatic components, and tank charging and discharging times can be measured using air tank methods [22,23]. In [24], the charge and discharging of an isothermal air tank were used to test the flow in different pressure regulators. In [25], a calculation method was proposed to determine the flow rate characteristics of pneumatic valves during the isothermal discharge of air tanks. In [26,27,28], a new indirect method was proposed to estimate the flow rate of compressed air leakage based on the measurement of the pressure drop ratio in a branch of CAS pipelines. In [29,30], the possibility of recovering and storing compressed air energy was investigated in a pneumatic control system by introducing additional CASTs. Energy savings of approximately 40% in pneumatic control systems are associated with a reduction in compressed air consumption in pneumatic cylinders. In pneumatic braking systems for tractor trailers, supply tanks, main tanks located in the rear, secondary tanks located in the front, and parking tanks are used [31]. The pressure in the parking tank when the engine is idle should not be less than 0.2 bar below the shutdown pressure in five minutes. The charging time of the reserve air tank and the average pressure increase time must be in accordance with the regulations developed by the Working Group on Agricultural Tractors (WGAT) of the EC [32]. In [33], the operation of a multi-actuator pneumatic system with energy recovery in a CAST was discussed by collecting and reusing compressed air. Compared to a standard pneumatic control system in an energy-recovery pneumatic control system, air consumption was reduced by 37%. In the new exhausted air recycling system (EARS) collected in CASTs, energy consumption is reduced by almost 50%, and noise levels are reduced by 40% to 80% compared to traditional pneumatic systems [34]. In [35], low-pressure air was recovered from a pneumatic actuator system and used to convert mechanical energy into electrical energy. In this device, called an energy-harvesting unit (EHU), approximately 20–50% of the exhaust air was recovered. In [36], the working principles of exhaust recycling were introduced in a pneumatic system. In each exhaust recycling cycle, the pressure in the CAST gradually increased after five cycles, reaching 4.36 bar. In [37], the recovery of exhaust energy in CAST was found to increase the energy efficiency of the pneumatic system from 7.2% to 15.3% in the air pressure range of 3.5 to 6.4 bar. In [38], an elastic CAST was used to receive exhaust air from a primary pneumatic cylinder, from which the secondary cylinder was powered. Application of elastic CASTs to improve the energy efficiency of pneumatic systems has been reported. Typical CASTs have energy densities that are too low for effective exhaust air recovery. CASTs are used as power sources in many small vehicles, such as motorcycles, bicycles, tricycles, and four-wheelers [39]. CAST-powered pneumatic motors and pneumatic cylinders are used to drive bicycles or three-wheeled vehicles [40,41,42]. In [43], the concept of motorcycle propulsion was proposed using piston-type compressed air engines supplied by two CASTs. Due to the low efficiency and low energy density of CAST, it is difficult to use compressed air in CAV [44]. An example of a CAV is the AirPod car from Motor Development International (MDI, Luxembourg, Luxembourg), which takes about three minutes to fill the CAST and costs only 1.5 euros in electricity [45]. The limited use of air propulsion systems is due to the low efficiency of the compressed air engine (CAE) due to the low air consumption and insufficient expansion of compressed air inside the cylinder [46]. In a pneumatic hybrid vehicle (PHV), compressed air is stored under pressure in CASTs during regenerative braking [47]. The energy stored in CAST can be used to drive the wheels directly through air engines. Hybrid compressed air technology is promising, has great potential, and can be used in the future to improve the performance of the air engine and fuel efficiency [48].
Section 3 contains the technical calculation of the CAST. Section 4 contains the CAST charging and discharging model, the pneumatic valve model, the determination of the polytropic index, and the CAST temperature change model. Section 5 contains numerical solutions of the CAST charging process through the inlet valve under choked and subsonic conditions. Section 6 contains numerical solutions of the CAST discharging process through the outlet valve under choked and subsonic conditions. Section 7 contains experimentally verified polytropic pressure and temperature variations during CAST charging and discharging, obtained from numerical solutions. Section 8 defines the energy efficiency indicators for CAST, which can be used to justify the benefits of storing compressed air energy on a small scale in CAST. Section 9 discussed the functional model of an HPAS that contains a CAST connected to an air motor (pneumatic motor) coupled to a mechanical drive. Section 9 summarizes the results of the study.
3. Materials and Methods for Calculating CAST
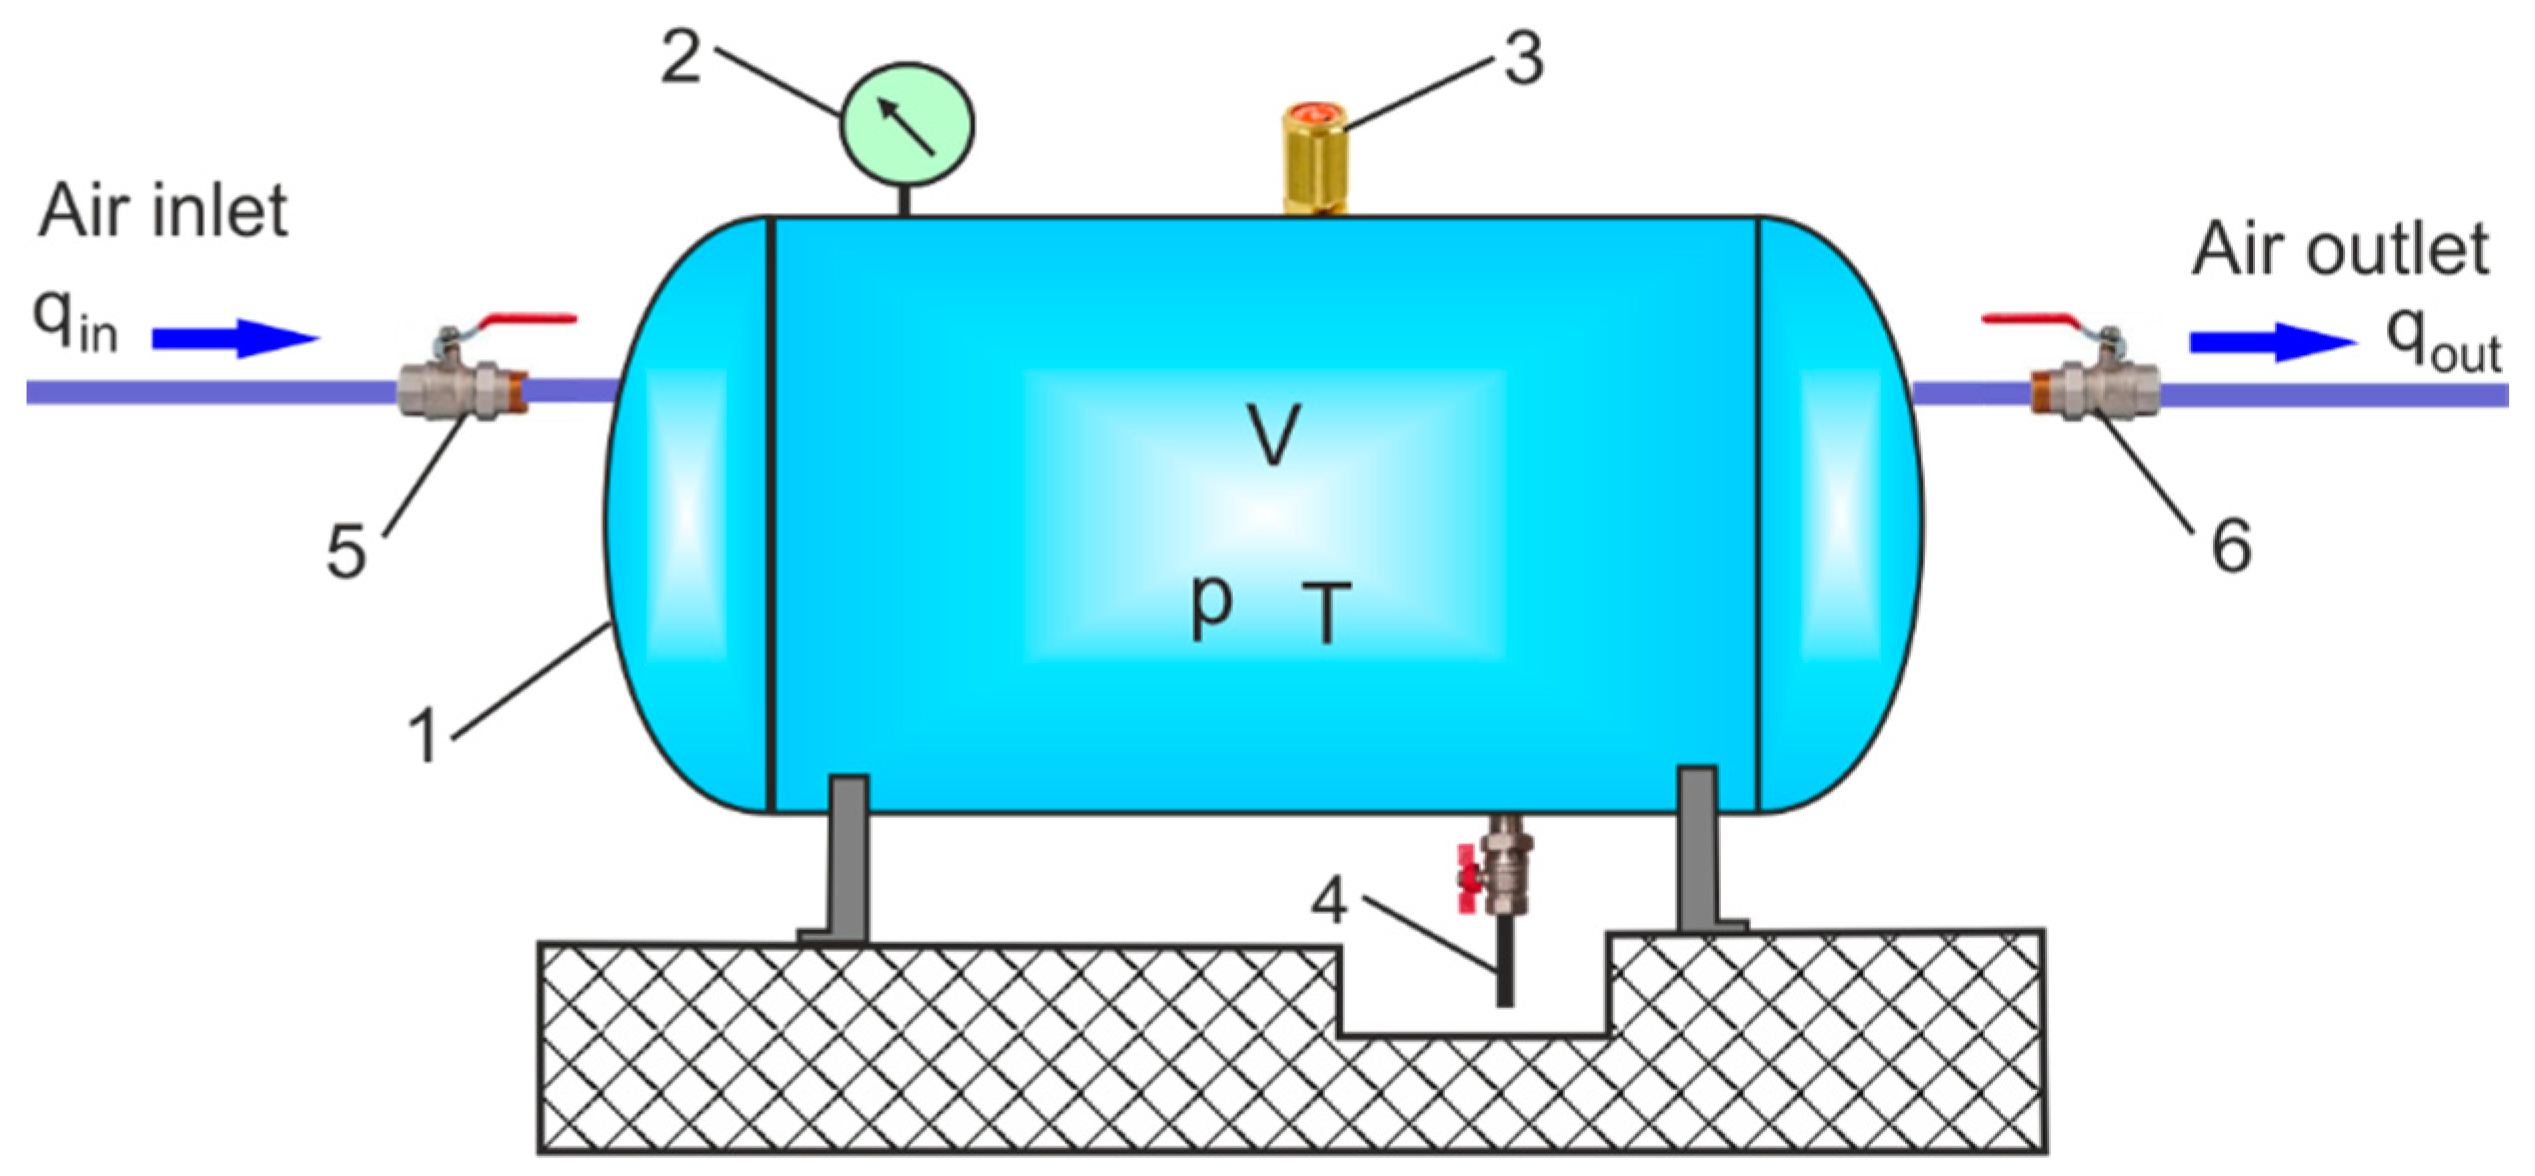
A CAST is a type of pressure vessel that holds compressed air under pressure and stores the CAE for use in various pneumatic systems. The primary role of CAST is to provide temporary storage for CAE. Storing compressed air allows the CAS to average the peaks in compressed air demand. CAST is treated as a CAE storage device but not as an energy accumulator. The air in the CAST is accessible even if the compressor is not running. Compressed air storage in a CAST reduces the sudden demand for compressed air and prolongs the actuation of pneumatic devices. The CAST may also use a smaller horse-power compressor. The CAST eliminates the short cycle of compressor operation and provides a more consistent system pressure for control. The application of these CAST sizes substantially reduces the compressor cycle frequency and saves a significant amount of power. CAST is treated as a CAE storage device but not as an energy accumulator. A diagram of the CAST model is shown in Figure 1.
Following the recommendations of the Compressed Air Challenge [49], the volume of the CAST should range from 20 to 40 L, with a compressor capacity of 30 L/min. When choosing CAST pressures, the rule of thumb is that the pressure produced by the compressor must be higher than the pressure needed to operate the pneumatic devices. Any compressor compresses the air in the CAST to the maximum operating pressure pmax and then shuts it off. The compressor was then started when the pressure in the CAST dropped to pmin. The difference between the pmax and pmin pressures is 2 bar.
For the isochoric process (the storage volume V is constant) of an ideal gas, the flow rate is as follows:
where qin is the flow rate at the inlet, qout is the flow rate at the outlet, Δt is the time interval for mass change and ρa is the average air density in the tank.
where pin is the average pressure, Tin is the average temperature and R is the individual gas constant of dry air.
Δm is the change in air mass inside a storage volume, calculated using the following equation:
where ρ1 is the initial storage air density, ρ2 is the final storage air density, p1 is the initial storage pressure, p2 is the final storage pressure, T1 is the initial storage temperature and T2 is the final storage temperature.
Taking into account the relationships (2) and (3) in (1), assuming temperature T1 = T2 and time Δt = t, the equation of mass balance in a CAST is presented as follows.
In technical calculations, the influence of temperature on the calculation of the volume of the storage tank is ignored because it is not measured. Based on (4), the required volume of the storage tank was calculated after it was pre-charged and since qin = 0, then
where Δp is the pressure decreased in the storage tank.
The time of pressure drop in the tank is calculated according to
The pressure drop rate in storage tanks is important information for end users.
where K is the constant factor, K = pin/V.
The volume of a storage tank can be calculated using various technical formulas recommended in company catalogues and guides. The air tank is always sized according to the largest compressor when the CAS contains several compressors. For compressors with variable speed drive (VSD), the required air storage volume is substantially reduced.
The following formula can be used for the volume of compressed air under different conditions:
where V is the capacity of the tank in m3, pa is the gauge pressure in kPa, p1 is the initial pressure in kPa, p2 is the final pressure in kPa, and t is the time allowed for pressure drop in minutes, qd is the consumption of compressed air in m3/min and qc is the compressor capacity in m3/min.
Note: In (8) US units, it was converted to metric units.
When selecting the volume of the storage tank for compressors with offloading/loading regulations, the following equation is relevant [50]:
where V is the capacity of the tank in L, qC is the free air delivery (FAD) of a compressor in L/s, p1 is the compressor inlet pressure in bar, T1 is the maximum compressor inlet temperature in K, T0 is the compressed air temperature in the tank in K, pU − pL is the set pressure difference between unload and load and fmax is the maximum load frequency (1 cycle every 30 s applies to Atlas Copco compressors).
The characteristic cycle frequency of the load/unload compressor depends on the pressure drop range and the volume of the storage tank. The load/unload mode compressor requires the volume of the storage tank to be calculated as follows [51]:
where pmax is the maximum cut-off pressure in kPa, pmin is the minimum cut-in pressure in kPa, fc is the compressor load/unload cycle in 1/h, and σ is the ratio of the compressor capacity to the demand air consumption.
By selecting the correct CAST volume, leakage compensation and pressure equalization are ensured, which leads to greater energy flexibility in the pneumatic system. Manufacturers recommend the following volume range when selecting CAST [52]:
where tL is the load and unload period in min, qc is the compressor capacity in L/min, pa is the gauge pressure in bar, Δp is the difference between the upper pressure and the lower pressure in bar, x is the load ratio, the rate of air consumption versus the compressor discharge air flow and ζ is the safety factor to be applied to absorb any uncertainties or future demand growth.
The maximum CAST volume is determined for a load ratio of x = 50%.
The CAST charging and discharging configurations are illustrated in Figure 2. In the case of the air inlet, the tank is charging; in the case of the air outlet, the tank is discharging; and in the case of the air inlet and inlet, the tank is charging and discharging. However, in the case of the two tanks, one was discharged while the other was charged simultaneously.
Companies in the compressed air system industry provide online calculators for technical CAST calculations. The SMC manufacturer’s calculator is used online to select the air tank charging and discharging parameters [53]. The SMC calculator will help determine the charge and discharge times of the air tank you choose, as well as the pressure conditions of isothermal and adiabatic processes. In the CAST charge process, tank volume, initial and supply pressures, ambient temperature and flow parameters air inlet valve are introduced. In the CAST discharge process, tank volume, inlet and exhaust pressures, ambient temperature, and flow parameters of the air outlet valve are introduced. The Kaeser calculator tools can be used to correctly configure and determine compressors, storage tanks, and pipelines to save energy, avoid leaks, and improve efficiency [54]. In this calculator, the thermodynamic processes, the temperature changes, and the flow parameters of the inlet and outlet valves were ignored. The UC Berkeley EH&S calculator is also used to determine the energy stored under pressure in the CAST from a safety perspective. Uncontrolled release of energy stored in the CAST can result in injury or damage. Stored energies that exceed 100 kJ are considered highly hazardous. It should be remembered that one gram of TNT contains 4.62 kJ of energy.
In [55], analytical solutions for the tank charge and discharge process (under choked and unchoked conditions) are developed using adiabatic and isothermal models of the processes. As a result of integration of the flow continuity equation, dimensionless pressure changes for dimensionless time were obtained for isothermal and adiabatic processes under throttling conditions.
The solution obtained for the tank discharge process is as follows:
Under adiabatic choked conditions
Under isothermal choked conditions
where κ is the specific heat ratio, p is the pressure in the tank, pi is the initial pressure, t is the time during the discharging process and tch is the time of the final discharging process under choked conditions.
where V is the volume of the tank, A is the area of the nozzle throat, and a is the speed of sound.
Under adiabatic unchoked conditions
Under isothermal unchoked conditions
where pcr is the critical pressure, t is the time during the charging process, tun is the time of the final charging process under unchoked conditions and Ae is the area of the nozzle throat-to-exit.
The variable parameters x and a constant parameter xu were introduced into (16) and (17) as follows:
The solution obtained for the tank charging process:
Under adiabatic choked conditions
Under isothermal choked conditions
where κ is the specific heat ratio, p is the pressure of the tank during the charging process, pi is the initial pressure, ps is the constant source pressure, Ti is the initial temperature, Ts is the constant source temperature, t is the time during the charging process and tch is the time of final charging.
Under adiabatic unchoked conditions
Under isothermal unchoked conditions
where tun is the time of the final charging process under unchoked conditions.
Original analytical solutions presented for the tank charge and discharge process (under choked and unchoked conditions) using adiabatic and isothermal models of the processes give results similar to those measured experimentally.
In [56], a typical approach is presented to select the CAST size for the CAES system connected to the hybrid wind photovoltaic system, in which the throttling conditions are neglected. With these assumptions, the following solutions are presented:
Solution for the charge time tch of the tank
where p is the storage pressure, pa is the atmospheric pressure, n is the polytropic exponent, N is the number of compressions stages and λch is the compression coefficient.
K(p) is the function of pressure p:
Solution for the time constant τch during the charging process
where Vch is the volume of compressed air produced, Pc is the power consumed by the compressor, cp is the mass heat of compressed air, and R is the gas constant.
Solution for the tank volume Vch during the charging process
Solution for the discharge time tdch of the tank
where pin is the initial pressure, pout is the outlet pressure, n is the polytropic exponent, N is the number of expansion stages and λdch is the expansion coefficient.
Solution for the time constant τdch during the discharging process
where Vdch is the volume of the compressed air tank, PM is the power produced by the air motor, cp is the mass heat of the expansion air, and R is the gas constant.
Solution for the tank volume Vdch during the charging process
A typical approach to the calculation of the CAST parameters for the CAES system is to use the air compressor power during the tank charging process and the air motor power during the tank discharging process.
Taking into account existing solutions, computational methods based on numerical solutions were proposed. Computational methods based on numerical solutions have scientific aspects that pertain to the implementation of computational algorithms, automatic measurement algorithms, identification algorithms, and control algorithms to monitor the CAES system [28]. The creation of specialized software applications can be performed to meet the specific needs of CAES system users. The proposed computational methods are particularly useful for analyzing the efficiency of compressed energy use in CAST, CAS and CAES systems.
4. CAST Charging and Discharging Processes
4.1. CAST Charging and Discharging Model
The course of the CAST charging and discharging process depends on the flow parameters of the inlet and outlet valves. In pneumatic valves, the flow under choked and subsonic conditions is different; therefore, a precise solution to this problem is only possible through numerical solutions.
Figure 3 shows the calculation model diagram used to numerically solve the CAST charging and discharging processes.
The mass flow balance equation for the CAST calculation model is obtained as follows:
where qm is the instantaneous mass flow in the tank, qm(in) is the mass flow rate in the tank inlet, and qm(out) is the mass flow rate in the tank outlet.
The differential equation of mass flow in CASTs is as follows:
where ϑ is the specific volume.
Since the CAST has a constant volume V (dV = 0), from (34), it follows that
The CAST charging and discharging process is a basic thermodynamic polytropic process.
Taking into account the derivative of the polytropic process,
Substituting (36) for (35), the mass flow equation is as follows:
where n is the polytropic exponent, p is the pressure, T is the temperature, and R is the individual gas constant of dry air.
Finally, Equation (33) is as follows:
4.2. Pneumatic Valve Model
The selection of pneumatic valves is based on their operating parameters, which include pressure, temperature, and flow parameters. When selecting the mass flow rate qm(in) through the air valve, two flow parameters were used: sonic conductance C and critical pressure ratio b.
The mass flow rate qm through the air valves specified for choked and subsonic flow conditions is determined according to the ISO standard [57]:
where p1 is the absolute upstream pressure, T1 is the absolute upstream temperature, p2 is the absolute downstream pressure, b is the critical pressure ratio, C is the volume flow sonic conductance, TN is the normal temperature, and ρN is the normal density.
The normal parameters of compressed air according to the standard reference atmosphere conditions ANR (Atmosphere Normale de Reference) specified in the ISO standard [58] are as follows: pN = 100 kPa, TN = 293.15 K, RN =288 J , and ρN = 1.185 kg/m3 at RH = 65%.
The value of the adiabatic critical pressure ratio b is as follows:
where κ is the heat capacity ratio and the adiabatic index of the air (diatomic gas) κ = 1.4.
The volume flow sonic conductance C is as follows:
where Ψmax is the maximum flow function under adiabatic flow.
K is the constant factor:
S is the effective cross-sectional area:
where Cd is the discharge coefficient of the valve and An is the cross-sectional area calculated for the nominal diameter dn of the valve, as given in the manufacturer’s data sheet.
Then, the conversion of C to S and vice versa is the following:
C = 0.002 S ⇒ S = 500 C
According to the JIS B 8390: 2016 standard [59], the effective cross-sectional area S in mm2 converted to the sonic conductance C in dm3 s−1∙bar−1 is S = 5 C.
The maximum value of the discharge coefficient is Cd = 1.0 when there are no friction losses in the valve orifice and the pressure energy is converted into kinetic energy.
The nominal diameter dn (in technical practice, the designation DN is used according to the French name diamètre nominal) is the standard parameter.
Sonic conductance C and critical pressure ratio b can be calculated using measurements of the flow parameter from the test bench [60], as follows:
where is a measure of the mass flow rate at the critical pressure ratio, p1 is the constant upstream pressure, is the measuring absolute upstream temperature, and is the mass flow rata corresponding to the pressure drop Δp = 1 bar (100 kPa).
The flow parameters C and b based on the nominal flow rate qvn are measured at the pressure drop Δp = 7 6 = 1 bar (100 kPa), and the pressure ratio p2/p1 = 6/7 = 0.857:
The volume flow sonic conductance C for p1 = 700 kPa is calculated as follows:
where b is the critical pressure ratio for technical calculations, where b = 0.5.
Under technical conditions, the flow coefficients Cv and KV are also used [61]. The ANSI/ISA standard [62] defines the flow coefficient as the Cv factor, which is the basis for the selection of industrial air valves.
The value of the sonic conductance C in m3/sPa as a function of the coefficient Kv in m3/h and the pressure ratio b is expressed by formula [63].
Individual elements of the pneumatic system, that is, valves, fittings, and tubes, have different flow parameters (Cv, Kv, S, C and b). When these pneumatic elements are connected sequentially (in series), complex flow parameters are calculated [64].
4.3. Determination of the Polytropic Index
Polytropic processes were considered, which indicate heat transfer during the CAST charging or discharging processes. The Poisson relation between pressure p and volume V in the polytropic process is as follows:
where n is the polytropic index in the value range of 0 to 1.4.
Since the volume of CAST is constant (V = constant), there is a pressure and temperature relationship for the polytropic process.
where T1 is the initial temperature, p1 is the initial pressure, T2 is the final temperature, and p2 is the final pressure.
The polytropic exponent n is calculated using the following logarithmic formula:
where Kn is the slope of logarithmic characteristics.
Experimental verification of the polytropic exponent n during CAST charging and discharging can be performed using the logarithmic Formula (53). In [65], theoretical solutions for the instantaneous polytropic index n were presented for tank discharge processes. In [66], experimental methods were used to determine the values of the polytropic index n in the discharge process of an air tank.
4.4. Temperature Change Model in CAST
The compressed gas in the CAST gives thermal energy to the surroundings, and the expanded gas in the CAST absorbs the thermal energy from the surroundings.
According to the first law of thermodynamics, for a closed system, the following equation can be used:
where Q is the heat flux (Q > 1 flux into the surroundings, Q < 1 flux from the surroundings), U is the internal energy and W is the work performed by the system, which is the product of pressure p and the change in volume V.
Since heat exchange occurs in an isochoric process, V = const and dV = 0. The CAST thermal model considers the change in heat time.
where u is the specific internal energy, m is the mass of gas, ρ is the density of the gas, cv is the specific heat capacity of the gas at constant volume, and T is the temperature of the gas.
The amount of Q heat transferred from or to the CAST during a given time is determined by the temperature difference between the compressed/expander gas temperature and the ambient temperature.
where A is the surface of heat exchange, h is the heat transfer coefficient, and Ta is the constant ambient temperature.
This equates to expressions for the heat transfer.
A lumped-parameter model (LPM) was adopted, which assumes that the air is uniformly heated or cooled during CAST charging or discharging, and the temperature in time is described by a first-order linear differential equation (LDE).
Equation (57) is transformed into the form of a first-order linear differential equation (LDE) as follows:
where τ is the thermal time constant of the CAST.
This lumped-parameter model (LPM) assumes that the temperature changes uniformly as the air is heated or cooled during its compression or expansion in the CAST charging or discharging processes.
Variable substitution ΔT ≡ (T − Ta) Equation (58) is as follows:
By solving (60), the temperature change ΔT(t) in CAST is obtained as follows:
where ΔTmax is the maximum temperature difference.
The thermal time constant τ is determined from the experimental curve of T(t) of the CAST processes. The thermal time constant τ is expressed as the time when the temperature T(t) reaches 63.2% of the maximum temperature difference ΔTmax.
During CAST charging and discharging, the difference between the final temperature Tfin and the initial temperature Tin was taken into account.
When the CAST charging temperature changes from T1 to T2, T(t) can be derived from (62):
where τc is the thermal time constant for the CAST charging.
When the CAST discharging temperature changes from T2 to T1, T(t) can be derived from (62):
where τd is the thermal time constant for the CAST discharging.
5. Numerical Solutions of the CAST Charging Process
During the CAST charging process through the inlet valve, the inlet pressure pin remained constant, while the instantaneous pressure p in the storage tank increased. In the compression process, the external pressure pin is greater than the CAST pressure p, so (38) is as follows:
The choked and subsonic mass flow rate through the air inlet valve is:
where qm1(in) is the mass flow rate under chocked flow, qm2(in) is the mass flow rate under subsonic flow, pin is the pressure at the storage tank inlet, Tin is the temperature at the inlet, p is the instantaneous pressure in a storage tank, bin is the critical pressure ratio and Cin is the sonic conductance.
where Sin is the effective sectional area, Cdin is the discharge coefficient, and Anin is the cross-sectional area.
where dnin is the nominal diameter.
According to (53), the polytropic exponent nc of the charging process is as follows:
where Knc is the slope of the logarithmic charging characteristic p = f(T).
where pc0, Tc0 are the initial pressure and temperature before CAST charging and pc2, Tc2 are the final pressure and temperature after CAST charging.
During CAST charging, the temperature changes from Tc0 to Tc2, and the Tc(t) over time is as follows:
where τc is the thermal time constant during CAST charging.
5.1. Choked Flow Conditions
Under choked flow conditions in the inlet valve, the integration of differential Equation (55) yields the following equation:
where τc1 is the time constant under choked flow conditions.
where Tc1 is the temperature under choked flow conditions.
where a is the exponent; a = n/(n − 1).
From the integral Equation (72), the CAST charging time interval Δtc1 under throttled flow conditions in the inlet valve is calculated as follows:
From (74), the pressure p1(t) during the CAST charge is obtained in the range of pc0 to pc1 and the time interval Δtc1.
5.2. Subsonic Flow Conditions
Under subsonic flow conditions in the inlet valve, the integration of differential Equation (65) gives the following:
where τc2 is the time constant under subsonic flow conditions.
where Tc2 is the temperature under subsonic flow conditions.
The conversion of the integral function (77) is given below.
where fC(p) is the integrand function.
To obtain the fC function after solving the integration function (81) in the range <pc2, pc1>, a quad numerical Matlab function was used based on the Simpson method.
Based on the knowledge of the fC function of (80), the CAST charging time Δtc2 was determined under subsonic flow in the inlet valve.
The integral function (80) was converted to the derivative of the charge pressure dp2/dt) within the range of pc1 to pc2 = pin in the time interval Δtc2
The differential Equation (83) was solved using the Runge–Kutta numerical function ode45. In the time interval Δtc2, pressure p2(t) was obtained in the pressure range of <pd2, pd1>.
The sum of the time intervals Δtc1 and Δtc2 from (75) and (82) determines the total charge time tc of the CAST.
The proposed numerical solution for the CAST charging process is useful for pneumatic systems with air inflow to the CAST through the inlet valve.
6. Numerical Solutions of the CAST Discharge Process
During the CAST discharge process through the outlet valve, the instantaneous pressure p in the storage tank decreased, whereas the outlet pressure pout was constant. In a decompression process, the external pressure pout is less than the pressure p of the CAST; therefore, (38) is as follows:
The choked and subsonic mass flow rate through the air outlet valve is
where qm1(out) is the mass flow rate under chocked flow, qm2(out) is the mass flow rate under subsonic flow, p is the instantaneous pressure in a storage tank, Ts is the initial temperature in a storage tank, pout is the pressure in the storage tank outlet, bout is the critical pressure ratio, and Cout is the sonic conductance.
where Sout is the effective sectional area, Cdout is the discharge coefficient, and Anout is the cross-sectional area.
where dnout is the nominal diameter.
According to (53), the polytropic exponent nd of the discharge process is
where Knd is the slope of the logarithmic discharge characteristic, p = f(T).
where pd0, Td0 are the initial pressure and temperature before CAST discharge and pd2, Td2 are the final pressure and temperature after CAST discharge.
When the CAST is discharged, the cooling of the expanded gas can affect the operation of the pneumatic valves and the performance of the air motor.
During the discharging of the CAST, the temperature changes from Td0 to Td2, and the temperature Td(t) over time is
where τd is the thermal time constant during CAST discharging.
6.1. Choked Flow Conditions
Under choked flow conditions in the outlet valve, the integration of differential Equation (85) gives
where τd1 is the time constant under choked flow conditions.
where Td1 is the temperature change under choked flow conditions.
From the integral Equation (92), the CAST discharge time interval Δtd1 under throttled flow conditions in the outlet valve is calculated as follows:
From (95), the pressure p1(t) during CAST discharge is obtained in the range of pd0 = ps to pd1 and the time interval Δtd1.
6.2. Subsonic Flow Condition
Under subsonic flow conditions in the outlet valve, the integration of differential Equation (85) gives the following:
where τd2 is the time constant under subsonic flow conditions.
where Td2 is the temperature under subsonic flow conditions.
The conversion of the integral function (97) is given below.
where fD(p) is the integrand function.
To obtain the FD function after solving the integration function (100) in the range <pd2, pd1>, a Matlab quad numerical function based on the Simpson method was used.
Based on knowledge of the fD function of (101), the CAST discharging time Δtd2 was determined under the subsonic flow in the outlet valve.
The integral function (97) was converted to the derivative of the discharge pressure dp2/dt within the range of pd1 to pd2 = pout in the time interval Δtd2.
The differential Equation (103) was solved using the Runge–Kutta numerical function ode45. In the time interval Δtd2, pressure p2(t) was obtained in the pressure range of <pd2, pd1>.
The sum of the time intervals Δtd1 and Δtd2 from (95) and (102) determines the total discharge time td of the CAST.
The proposed numerical solution for the CAST discharging process is applicable to pneumatic systems with air outflow from the CAST through the outlet valve.
7. Experimental Verification of Numerical Solutions
The polytropic pressure and temperature variations during CAST charging and discharging obtained from numerical solutions were experimentally verified. The experimental charge and discharge curves of CAST were measured using a test rig. A view and diagram of the test stand during the charging and discharging phases of the CAST are shown in Figure 4.
The main components of the test stand included the tested CAST, pneumatic air inlet/outlet valves, pressure transmitter, temperature transmitter, measuring device, and computer with measurement software.
A stand-alone horizontal pressure tank with a capacity of 50 dcm3 (0.05 m3) was used to store compressed air at a pressure of up to 11 bar (1.1 MPa) in the temperature range of 10 °C to 60 °C.
The same pneumatic valve was used for the inlet and outlet valves. The SMS direct operated two-way solenoid valve model VX210AAA that was normally closed (NC), with a nominal diameter dn = 3 mm, sonic conductance C = 1.05 dm3 s−1 bar−1 (1.05 10–8 m3 s−1 Pa−1), pressure ratio b = 0.68, maximum operating pressure 10 bar (1 MPa) and 24 VDC power supply was used [67].
A Hydac HDA 4748-H-0600 pressure transmitter with a Hydac sensor interface (HSI) was used to measure pressure in the range of 0 to 600 bar, with an analog signal of 4 to 20 mA, and accuracy ≤ ±0.1 % FS max. The Hydac ETS 4548-H-000 temperature transmitter with an HSI interface was used to measure the temperature in the range of −25 °C to 100 °C, with an analog signal of 4 to 20 mA, and accuracy ≤ ±0.1 % FS max.
Hydac HMG 3000 was used to measure tasks on the test stand [68]. The HMG 3000 portable measuring instrument allows us to perform basic measurement data processing tasks, as well as more complex functions due to configuration procedures. In addition to recording the current parameter values, it enables reading of their average, maximum, and minimum values, as well as calculating the differences in the indications of two transducers of the same type. The HMG 3000 devices enable the export of recorded measurement data to the HMGWIN 3000 software, which can be displayed in the form of a graph or spreadsheet. HMGWIN is a software package that is easy, simple, and convenient to use to analyze and archiving data, curves, and logs recorded using the HMG 3000 device. The PC can transmit measurement data through Wi-Fi communication to the cloud for remote monitoring of CAST processes.
During CAST charging and discharging, the pressure and temperature curves on the test bench were measured, from which the polytropic exponent (n) and thermal time constant (τ) were determined. Figure 5 compares the pressure and temperature curves obtained from the numerical solutions and measurements during the CAST charge. Figure 6 compares the pressure and temperature curves during the CAST discharge obtained from numerical solutions and measurements.
During experimental validation, tests were first performed on a test stand, where the pressure and temperature curves were measured during the CAST charging and discharging processes. Initial and final pressure and temperature values were measured from the pressure and temperature curves of the CAST charging process, and nc was calculated using (49). Initial and final pressure and temperature values were measured from the pressure and temperature curves of the CAST discharging process and nd was calculated using (69). From the temperature curves, the thermal time constants τc and τd were determined according to the known principle, which is “the time required to change 63.2% of the difference between the initial and final temperatures”. The measurement values obtained were then entered into the numerical model defined in Section 5 and Section 6. There were no limitations to the test or numerical methods used. The only technical limitation was the size of the available tank and valve.
Experimental studies have only included small CASTs, which are used in exhausted air recycling systems (EARS), energy harvesting units (EHU), small-scale CAES, and CAV. From the comparison of the numerical solution and the measurement of the CAST charging and discharging processes, it follows that the applied numerical solution methods are useful for selecting CASTs that can be used in various pneumatic systems.
8. Energy Stored in the CAST
When the CAST is charged, the energy of compressed air is stored. The stored internal energy (US) in CAST results from the average kinetic energy of the forward motion of the gas molecules.
where: N is the number of gas molecules in volume V of the CAST, Ek is the kinematic energy of the gas molecule, mmol is the mass of the gas molecules, and vamol is the average speed of the gas molecules.
For each degree of freedom of the molecules of an ideal gas, the average kinematic energy is
where i is the degrees of freedom of an ideal gas, i = 5 for air as a diatomic gas, kB is the Boltzmann constant in J , kB = B/NA, B is the molar gas constant in J , NA is the Avogadro’s constant in , B = M R, M is the molar mass in kg , R is the individual gas constant in J and T is the temperature of the gas.
Finally, the internal energy (US) stored in the CAST is
where n is the number of moles in mol, n = N/NA = m/M, m is the mass of the gas in kg, and ps is the pressure of compressed air in Pa.
CAST energy efficiency indicators are defined, which can be used to justify the benefits of storing compressed air energy on a small scale in CASTs. The defined dimensionless CAST energy efficiency indicators have practical significance when comparing various processes for compressing and expanding gases in CAST. Dimensionless energy indicators can also be used to compare the efficiency of energy storage in a CAST with that of other storage systems and technologies. The CAST energy efficiency indicators are related to the scope of parameter changes on the test stand.
Energy recovery and storage are influenced by the air compression process in CASTs. The technical work (W) on gas compression in CASTs from pressure pa to ps in polytropic, adiabatic, and isothermal processes is given below.
The pV product is included in the regulations of the Pressure Equipment Directive (PED), which is intended to ensure the quality and safety of pressure equipment used in the European Economic Area (EEA) [69].
The work quotient (WQ) was introduced, which is the relationship between gas compression work and a psV product.
Maximum WQmax values were determined by calculating .
For WQmax, useful formulas were formulated to calculate the energy stored (ES) in the CAST during polytropic, adiabatic, and isothermal gas compressions.
Polytropic gas expansion from the initial stored pressure ps to the atmospheric pressure pa allows for a full recovery of the energy stored in CAST. The energy expansion (EE) during the CAST polytropic discharging process is as follows:
In practice, kilowatt hour (kWh) is used instead of joule (J), because joule is an extremely small amount of energy. Since energy in kWh is easy to convert to any type of energy consumption, (117) can be written as follows:
where Ke is the conversion energy unit from J to kWh, Ke = 2.778 .
In the adiabatic expansion of the gas in CASTs (without heat transfer of Q = 0 and for n = κ = 1.4) used in technical calculations, the equation is as follows:
In the full-pressure work in CASTs that occurs according to the gas isochoric expansion (V = const and n → ∞), the work (76) can be expressed as follows:
In the isothermal gas expansion of CASTs (T = const and n = 1), the work is as follows:
In isothermal expansion, the temperature remains constant, and hence there is no change in the internal energy.
The energy factor (EF) is the ratio of EE to energy capacity as the product psV.
For polytropic gas expansion
For adiabatic gas expansion
For isochoric gas expansion
For isothermal gas expansion
Figure 8 shows the curves of the CAST energy factor as a function of the pressure ratio of the expanding gas.
The energy factors for the various expansion processes differ significantly. The amount of work performed in the isothermal expansion was greater than that in the adiabatic system for the same final volume.
The energy ratio (ER) between the polytropic and adiabatic gas expansion and the isochoric gas expansion is as follows:
According to (126), for the case of ps/pa = 7, for the expansion of the gas in the polytropic process with n = 1.15, the EREP is 2.0.
According to (127), for the case of ps/pa = 7, for the expansion of the gas in the adiabatic process with n = κ = 1.4, the EREA is 1.74.
The energy ratio between the isothermal gas expansion and the isochoric gas expansion is as follows:
According to (128), for the case of ps/pa = 7, for the expansion of the gas in the isothermal process with n = 1, the ERE is 2.26.
Figure 9 shows the curves of the CAST energy ratio as a function of the pressure ratio of the expanding gas.
The energy recovery from CAST is influenced by the actual air expansion conditions.
Energy density (ED), defined as the energy per volume V, is considered when selecting CASTs.
Typically, the volumetric energy density is expressed as kilowatt hours per cubic meter (kWh ).
The energy density EDEP in CASTs depends on the storage pressure ps.
Figure 10 shows the CAST energy density EDEP curves according to stored pressure ps for polytropic and adiabatic processes.
The CAST energy density varies greatly with pressure, ranging from 0.5 kWh/m3 for 5 MPa to 52 kWh/m3 for 50 MPa. Compared to traditional CAST batteries, they have a lower energy density [70]. The ED of CAST is lower than that of batteries such as lead acid (Pb–acid), nickel metal hydride (Ni-MH), and lithium ion (Li-ion). For comparison, the cost of an 840 kWh CAST installation is USD 23,000, and the cost of a 1400 kWh lead acid battery is USD 130,000.
In CAES installations, the CAST pressure does not decrease to atmospheric pressure pa, but rather to the permissible operating pressure po in the air motor. The CAST’s unexploited energy density is
The useful energy density recovered from air expansion in CAST is
The relative energy density recovered (EDR) by air expansion in CAST can be determined as follows:
The future of clean and renewable energy requires new radical concepts for energy-storage technologies [71]. The new organic SolidFlow battery (CMBlu Energy AG) is based on fully recyclable organic materials available worldwide. Organic SolidFlow batteries are characterized by free scalability between power and capacity. In particular, contributions from chemical engineering and thermodynamic processes are crucial for the further improvement and practical implementation of new energy storage technologies.
9. Discussion of HPAS
The subject of discussion is the functional model of an HPAS that contains a CAST connected to an air motor (pneumatic motor) coupled to a mechanical drive. HPAS is used primarily to drive a DC generator that produces electricity and a pneumatic system for compressed air vehicles. DC generators are used for various purposes, such as power and lighting, charging batteries, excitation of alternators, and arc welding. HPAS can also be used in PPSs for compressed air vehicles such as cars, motorcycles, bicycles, three-wheeled vehicles, four-wheeled vehicles, and other vehicles. Owing to their high torque relative to weight, air motors are an excellent choice for powering AC generators and pneumatic drive systems. Figure 11 shows the diagrams of the HPAS functional model used to drive the DC generators and PPS of the CAV.
The HPAS functional model contains high-pressure compressed air cylinders that store energy and serve as an energy source for air vehicles, pneumatic transport, pneumatic brakes, diving, surfacing submarines, paintball, airsoft, and pneumatic weapons.
The energy stored in the high-pressure CAST was transferred to the air motor, where it was then transformed into the mechanical energy of the rotating shaft of the air motor. The CAE stored in CASTs is constantly being depleted as a result of the use of the mechanical energy of the air motor. The decrease in energy storage in the CAST depends on the consumption of compressed air in the air motor.
9.1. Determining the Performance Parameters of the Air Motor
Calculation methods or manufacturer catalogue data were used when selecting the parameters of the air motor. Manufacturer data are more appropriate for specific projects and applications.
For a given operating pressure (pM), a dimensionless linear relationship was determined between the torque (TM) and its rotational speed (nM).
where TMs is the stall torque for nM = 0, and nMf is the free speed for TM = 0.
Figure 12 shows the dimensionless torque characteristic TM(nM) of the air motor obtained using (134).
The mechanical power with torque according to (134) is as follows:
The maximum mechanical power PMmax of an air motor is 50% of the torque TMs and the rotation speed nMf.
The dimensionless static characteristics of the PM mechanical power of an air motor in relation to the rotational speed nM can be determined for a given working pressure pM.
Figure 13 shows the dimensionless mechanical power torque characteristic PM(nM) of the air motor obtained using (137).
9.2. Determining the Operating Pressure of the Air Motor
The air expansion from the working pressure (pM) to the standard pressure (ANR) (pN) is what determines the input power of the air motor.
where qM is the air consumption and κ is the adiabatic index.
where VM is the displacement of the air motor.
The mechanical torque TM of the air motor is as follows:
The output mechanical power of the air motor is as follows:
where ηm is the power efficiency, including flow efficiency [72], the fill coefficient depends on the air consumption [73], the mechanical efficiency, and the filling efficiency depends on the pressure [74].
Air consumption according to (139) inserted into the air power input according to (138) can be calculated as follows:
where a is the introduced exponent, .
Taking into account (141), the following equation is obtained:
where KM is a constant coefficient for a given air motor.
Equation (123) is a nonlinear function with respect to the variable X = pM/pN.
where KX is the function coefficient.
The Matlab R2023b fsolve function was used to solve the specific nonlinear Equation (145). The value of root X was obtained.
The operating pressure of the air motor is equal to pM = X pN.
Determining the operating pressure pM of the air motor allowed us to calculate the air consumption qM and the torque TM. For an air motor with displacement VM = 15 cm3/rev (0.000015 m3/rev), rotational speed nM = 250 rpm, and mechanical power PM = 120 W, the result is an operating pressure pM = 0.40738 MPa (4.0738 bar), air consumption qM = 0.00025 m3/s (15 L/min) and torque TM = 0.97 Nm.
9.3. CAST and Air Motor
The CAST connected to an air motor was analyzed with the contents of the air tank parameters of volume Vs = 0.18 m3, storage pressure ps = 25 MPa, and air motor parameters of operating pressure pM = 0.4 MPa, displacement VM = 0.000015 m3/rev and rotational speed nM = 250 rpm.
The discharge of CASTs with an attached air motor is defined by the energy balance equation as follows:
where τM is the time constant.
Solution (147) yields the CAST discharging time ts.
and decreases the stored pressure p(t) at time 0 ≥ t ≥ ts.
Expansion of the stored energy in CASTs can be calculated as follows:
Expansion of the energy in air motors can be calculated as follows:
Figure 14a shows the characteristics of the decrease in stored pressure in the CAST connected to an air motor. Figure 14b shows the expansion curve of the stored energy in the CAST connected to an air motor.
The CAST air motor system operates at time ts when the expansion of the stored energy in the CAST according to (131) is greater than the expansion of the energy in the air motor according to (132), where ES > EM.
The performance parameters of the air motor are essential for HPAS operation. The manufacturer catalogue was used to determine the dimensionless static characteristics of the air motor using the proposed method. Air power and air consumption of the air motor were considered to determine the operating pressure using the fsolve function. Performance parameters and operating pressure were used in the HPAS model to determine the decrease in pressure and expansion energy in the CAST. The proposed method provides a theoretical basis for calculating and selecting low-pressure and high-pressure small-scale CAES. The CAST and air motor models were tested positively. Comparison of the results obtained by other authors is impossible, as no similar studies have been conducted for the CAST and air motor system. The CAST and air motor system have already been used for various applications, but the authors have omitted the characteristics of the air motor.
For the rehabilitation tricycle, the HPAS discharge processes were experimentally verified through two series-connected pneumatic valves [59]. A prototype of a hybrid tricycle bike (HTB) was experimentally verified, with an air motor of 50 Nm torque and a power of 250 W, and a CAST of capacity of 2 × 9 dm3 and a pressure of 25 MPa [20]. The HTB travel time is 30 min and the travel distance is 7.5 km at a maximum speed of 15 km/h. Compared to an electric tricycle that has 500 W power and 500 Wh battery capacity, it can reach speeds of up to 25 km/h, has a torque of 60 Nm, and has a travel range of 40 km. The travel distance of an electric tricycle depends on its battery capacity.
10. Conclusions
This study has a significant impact on the efficiency of sustainable compressed air energy storage in CAST when applied to various CAS, CAES, and other pneumatic systems. CAST charging and discharging studies are of great importance for the storage of compressed air in small-scale CASTs. Compressed air storage is required for CASTs in many areas. Small-scale compressed air storage in CAST has the potential to reduce the dependence of companies on the electricity grid and offer an eco-friendly energy solution. For small-scale energy consumption, CAST allows for more reliable and stable electrical production. The storage of the compressed air system in CASTs allows users to supplement their energy consumption during periods of peak demand and power outages, and maintain energy stability. Storage of compressed air in CASTs reduces the frequency of compressor use, which in turn reduces their operating costs. To power air compressors and store compressed air energy in CAST, green energy sources such as photovoltaics, wind turbines, rivers, tides, and wave water turbines are used. This work is a response to EGD, which aims to completely decarbonize and store energy in the EU economy.
The new numerical solutions for the CAST polytropic processes presented in this paper are based on mass flow through the inlet and outlet valves under choked and subsonic flow conditions. Differential equations were used to numerically determine the total time, changes in pressure, and temperature during CAST charging and discharging operations. The values of the polytropic exponent n and thermal constant time τ used in the numerical solution were determined from the temperature curves during the experimental CAST charging and discharging processes. The numerical solution agreed well with the experimental data for the CAST and valve configurations. Numerical solutions for the known polytropic exponent n are expected to be consistent with the experimental data for a wide range of CAST and valve parameters. The numerical model of the temperature change in the CAST was satisfactorily compared with the experimental data when the thermal time constant of the read-in experimental temperature curve was introduced. The results obtained are limited to small-scale CAST, which fall within the following parameter ranges: charging and discharge pressures, low pressure of 2 to 10 bar, high pressure of 50 to 500 bar, tank capacity, small horizontal tanks from 5 to 50 L, large vertical tanks from 100 to 5000 L, nominal diameters of the inlet and outlet valves, small from 3 to 6 mm, medium from 6 to 20 mm, or large from 20 to 100 mm.
This article focusses on two solutions: first, when the CAST is charged and discharged through the inlet and inlet valves, and second, when the discharged CAST is connected to the air motor to drive a DC generator that produces electricity and a pneumatic system for compressed air vehicles. The correct selection of the air motor for a small-scale CAST system was established based on the manufacturer’s catalogue data and numerical solutions. In the HPAS, the air motor operates at full power up to the expansion pressure limit of the CAST. Based on the data contained in the manufacturer’s catalogues, the dimensionless static characteristics of the torque and power of the air motor were determined. The characteristics obtained by this method can be used to select an air motor for a mechanical drive, such as a DC generator or a CAV.
For the CAST energy efficiency assessment, relationships were formulated for the stored internal energy (US), technical work (W), work quotient (WQ), energy storage (ES), energy factor (EF), energy ratio (ER), energy density (ED) and energy expansion (EE). Based on these CAST energy-efficiency indicators, the advisability of storing compressed air energy on a small scale can be justified. The defined dimensionless CAST energy-efficiency indicators are of practical significance when comparing various processes for compressing and expanding gases in a CAST. In the case of the pressure ratio ps/pa = 7, the ER is 2.0, 1.74 and 2.26 for the polytropic process with n = 1.15, the adiabatic process with n = 1.4, and the isothermal process with n = 1, respectively. The ED of the CAST increased by approximately 30% for the polytropic process compared to the adiabatic process at a pressure of 50 MPa. The CAST energy density varies greatly with pressure, ranging from 0.5 kWh/m3 for 5 MPa to 52 kWh/m3 for 50 MPa.
The performance parameters of the air motor are crucial for the operation of the CAES system, but are usually ignored. On the one hand, the air motor must be adequately matched to the needs of the mechanical drive and, on the other hand, adapted to the CAST performance. Based on the input air power and air consumption of the air motor, a new approach is proposed to determine the operating pressure using a numerical solution based on the fsolve function. The air motor parameters were used to determine the decrease in the pressure and expansion energy in the CAST. The CAST and air motor selection method presented is the basis for calculating and designing low-pressure and high-pressure pneumatic systems, which are useful both in CASE systems and in various systems. Determining the operating pressure pM of the air motor allowed us to calculate the air consumption qM and the torque TM. For an air motor with displacement VM = 15 cm3/rev (0.000015 m3/rev), rotational speed nM = 250 rpm, and mechanical power PM = 120 W, the result is an operating pressure pM = 0.40738 MPa (4.0738 bar), air consumption qM = 0.00025 m3/s (15 L/min) and torque TM = 0.97 Nm.
The proposed theoretical foundations, numerical solutions, and experimental results are of great practical importance to CAST users, as CASTs are used in various technical systems and can be adapted to practical situations. Future sustainable energy systems require the introduction of integrated compressed air storage technologies. As the renewable energy sector continues to grow and implement sustainable energy storage, there is a demand for efficient and reliable compressed air storage systems.
The author is applying for a grant from the European Funds for Smart Economy Programme (EFSE) for the time period 2021–2027 on the topic of “New solutions to optimize CAE consumption and storage”.
Funding
This research received no external funding.
Institutional Review Board Statement
Not applicable.
Informed Consent Statement
Not applicable.
Data Availability Statement
Data are contained within the article.
Conflicts of Interest
The author declares no conflicts of interest.
Nomenclature
| CAE | compressed air energy |
| CAES | compressed air energy storage |
| CAS | compressed air system |
| CAST | compressed air storage tank |
| CAV | compressed air vehicle |
| EARS | exhausted air recycling system |
| EC | European Commission |
| ED | energy density |
| EDR | relative energy density |
| EED | Energy Efficiency Directive |
| EE | energy expansion |
| EEA | European Economic Area |
| EF | energy factor |
| EGD | European Green Deal |
| EHU | energy harvesting unit |
| ER | energy ratio |
| EU | European Union |
| HPAS | high-pressure air system |
| PBS | pneumatic brake system |
| PED | Pressure Equipment Directive |
| PHV | pneumatic hybrid vehicle |
| PPS | pneumatic propulsion system |
| RES | renewable energy source |
| VSD | variable speed drive |
| WQ | work quotient |
References
- Proposition for a Directive of the European Parliament and of the Council on Energy Efficiency. Document 52021PC0558, Brussels, Belgium. 2021. Available online: https://eur-lex.europa.eu/legal-content/EN/TXT/?uri=CELEX:52021PC0558 (accessed on 14 July 2021).
- Sikora, A. European Green Deal–legal and financial challenges of climate change. ERA Forum 2021, 21, 681–697. [Google Scholar] [CrossRef]
- Bertoldi, P.; Elle, M. The European Motor Challenge Programme 2003–2009, European Commission, DG JRC; Institute for Energy: Brussels, Belgium, 2009. [Google Scholar]
- ISO 11011:2013; Compressed Air. Energy Efficiency. Assessment. ISO: Geneva, Switzerland, 2013. Available online: https://www.iso.org/standard/46580.html (accessed on 18 September 2013).
- ISO 50001:2018; Energy Management Systems. Requirements with Guidance for Use. ISO: Geneva, Switzerland, 2018. Available online: https://www.iso.org/standard/69426.html (accessed on 10 August 2018).
- Bhatia, A. Compressors and Compressed Air Systems; Continuing Education and Development Inc.: Woodcliff Lake, NY, USA, 2009. [Google Scholar]
- Radgen, P.; Blaustein, E. Compressed Air Systems in the European Union; Frauenhofer ISI: Karlsruhe, Germany, 2010. [Google Scholar]
- Camber, M.; Horne, S.; Mehlretter, N.; Rauer, W. Compressed Air System. Installation Guide; E-book; Kaeser Compressors Inc.: Fredericksburg, VA, USA, 2015. [Google Scholar]
- General Catalog for Compressed Air, Gas and Vacuum Solutions. Atlas Coopco; Atlas Copco Airpower NV: Wilrijk, Belgium, 2023.
- Shanghai, H.; McKane, A. Improving Energy Efficiency of Compressed Air System Based on System Audit; Lawrence Berkeley National Laboratory: Berkeley, CA, USA, 2008; Available online: https://escholarship.org/uc/item/13w7f2fc (accessed on 13 July 2008).
- Compressed Air Compendium; Boge: Bielefeld, Germany, 2004; Available online: https://www.boge.com/en/compendium/ (accessed on 18 March 2023).
- Dindorf, R. Estimating potential energy savings in compressed air systems. Procedia Eng. 2012, 39, 204–211. [Google Scholar] [CrossRef]
- Seslija, D.; Milenkovic, I.; Dudic, S.; Sulc, J. Improving energy efficiency in compressed air systems practical experiences. Therm. Sci. 2016, 20, 355–370. [Google Scholar] [CrossRef]
- Kaya, D.; Phelan, P.E.; Chau, D.; Sarac, H.I. Energy conservation in compressed-air systems. Int. J. Energy Res. 2002, 26, 837–849. [Google Scholar] [CrossRef]
- Singh, B.R.; Singh, O. Study of compressed air storage system as clean potential energy for 21st Century. Glob. J. Res. Eng. Mech. Mech. Eng. 2012, 12, 1–15. [Google Scholar]
- Alami, A.H.; Yasin, A.; Alrashid, R.; Alasad, S.; Aljaghoub, H.; Alabsi, G.; Alketbi, L.; Alkhzaimi, A.; Alteneji, A.; Shikhli, S. Experimental evaluation of compressed air energy storage as a potential replacement of electrochemical batteries. J. Energy Storage 2022, 54, 105263. [Google Scholar] [CrossRef]
- Kokaew, V.; Moshrefi-Torbati, M.; Sharkh, S.M. Maximum efficiency or power tracking of stand-alone small scale compressed air energy storage system. Eng. Proc. 2013, 42, 387–396. [Google Scholar] [CrossRef]
- Wang, J.; Lu, K.; Ma, L.; Wang, J.; Dooner, M.; Miao, S.; Li, J.; Wang, D. Overview of compressed air energy storage and technology development. Energies 2017, 10, 991. [Google Scholar] [CrossRef]
- Fu, Z.; Lu, K.; Zhu, Y. Thermal System Analysis and Optimization of Large-Scale Compressed Air Energy Storage (CAES). Energies 2015, 8, 8873–8886. [Google Scholar] [CrossRef]
- Dindorf, R.; Takosoglu, J.; Wos, P. Review of compressed air receiver tanks for improving energy efficiency of various pneumatic systems. Energies 2023, 16, 4153. [Google Scholar] [CrossRef]
- ISO 6358-2:2019; Pneumatic Fluid Power—Determination of Flow Rate Characteristics of Components Compressible Fluids–Part 2: Alternative Test Methods. ISO: Geneva, Switzerland, 2019. Available online: https://www.iso.org/standard/71270.html (accessed on 18 March 2023).
- Giorgi, R.; Kobbi, N.; Sesmat, S.; Bideaux, E. Thermal model of a tank for simulation and mass flow rate characterization purposes. In Proceedings of the 7th JFPS International Symposium on Fluid Power, Toyama, Japan, 15–18 September 2008; Volume 7, pp. 225–230. [Google Scholar]
- Kawashima, K.; Ishii, Y.; Funaki, T.; Kagawa, T. Determination of flow rate characteristics of pneumatic solenoid valves using an isothermal chamber. ASME J. Fluids Eng. 2004, 126, 273–279. [Google Scholar] [CrossRef]
- Oneyama, N.; Zhang, H.; Senoo, M.; Peng, G.; Yang, J. Determination of flow-rate characteristics of pneumatic regulators using isothermal tank by pressure response. In Proceedings of the 7th JFPS International Symposium on Fluid Power, TOYAMA’ 2008, Toyama, Japan, 15–18 September 2008; Volume 7, pp. 731–736. [Google Scholar]
- Wang, T.; Peng, G.; Kagawa, T. Determination of flow-rate characteristics for pneumatic components using a quasi-isothermal tank with temperature compensation. Meas. Sci. Technol. 2010, 21, 065402. [Google Scholar] [CrossRef]
- Dindorf, R.; Woś, P. Automatic measurement system for determination of leakage flow rate in a compressed air pipeline system. Met. Meas. Syst. 2018, 25, 159–170. [Google Scholar] [CrossRef]
- Dindorf, R.; Woś, P. Test of a measurement device for the estimation of leakage flow rate in pneumatic pipeline systems. Meas. Cont. 2018, 51, 514–727. [Google Scholar] [CrossRef]
- Dindorf, R.; Wos, P. Universal programmable portable measurement device for diagnostics and monitoring of industrial fluid power systems. Sensors 2021, 21, 3440. [Google Scholar] [CrossRef]
- Gauchel, W. Energy-saving pneumatic systems. Olhydraul. Pneum. 2006, 50, 1–22. [Google Scholar]
- Li, T.C.; Wu, H.W.; Kuo, M.J. A study of gas economizing pneumatic cylinder. J. Phys. Conf. Ser. 2006, 48, 1227–1232. [Google Scholar] [CrossRef]
- Kaminski, Z. Modelling of the energy supply equipment of the air braking system of a farm tractor. Arch. Aut. Eng. 2011, 53, 36–41. [Google Scholar] [CrossRef]
- Kamiński, Z.; Czaban, J. Diagnosing of the agricultural tractor braking system within approval tests. Maint. Reliab. 2012, 14, 319–326. [Google Scholar]
- Seslija, M.; Reljic, V.; Seslija, D.; Dudic, S.; Dakic, N.; Jovanović, Z. Reuse of exhausted air from multi-actuator pneumatic control systems. Actuators 2021, 10, 125. [Google Scholar] [CrossRef]
- Wang, J. Improvement of Energy Efficiency of Pneumatic Systems by Recycling Exhaust Compressed Air. Project, Joule Center 2007–2008. Available online: https://ukerc.rl.ac.uk/pdf/Wang_summary.pdf (accessed on 18 March 2023).
- Leszczynski, J.S.; Grybos, D. Compensation for the complexity and over-scaling in industrial pneumatic systems by the accumulation and reuse of exhaust air. Appl. Energy 2019, 239, 1130–1141. [Google Scholar] [CrossRef]
- Yu, Q.; Zhai, J.; Wang, Q.; Zhang, X.; Tan, X. Experimental study of a new pneumatic actuating system using exhaust recycling. Sustainability 2021, 13, 1645. [Google Scholar] [CrossRef]
- Luol, X.; Wang, J.; Sun, H. Study of a pneumatic-electrical system for exhaust air energy recovery. Int. J. Energy Eng. 2013, 3, 228–238. [Google Scholar]
- Du, H.; Liu, W.; Bian, X.; Xiong, W. Energy-saving for industrial pneumatic actuation systems by exhausted air reuse based on a constant pressure elastic accumulator. Sustainability 2022, 14, 3535. [Google Scholar] [CrossRef]
- Nabil, Y. Investigation and implementation of compressed air powered motorbike engines. Eng. Rep. 2019, 1, 1–13. [Google Scholar] [CrossRef]
- Kassim, S.M.; Arunkumar, K.; Kumar, K. Pneumatic operating vehicle by inversion of slider crank mechanism. Int. J. Crea. Res. Thou. 2018, 6, 205–211. [Google Scholar]
- Kiran, M.G.; Parasram, K.S.; Vitthal, S.G.; Jaysingh, T.P. Design and fabrication of a pneumatic tricycle. Int. J. Crea. Res. Thou. 2018, 6, 708–714. [Google Scholar]
- Mehta, H.; Patel, G. Air powered bike. Int. J. Eng. Res. Technol. 2016, 4, 1–3. [Google Scholar]
- Wang, Y.-W.; You, J.-J.; Sung, C.-K.; Huang, C.-Y. The applications of piston-type compressed air engines on motor vehicles. Proc. Eng. 2014, 79, 61–65. [Google Scholar] [CrossRef]
- Fang, Y.; Lu, Y.; Roskilly, A.P.; Yu, X. A review of compressed air energy systems in vehicle transport. Energy Strategy Rev. 2021, 33, 100583. [Google Scholar] [CrossRef]
- More, A.D. Air powered vehicle. Int. Res. J. Eng. Technol. 2021, 8, 1776–1782. [Google Scholar]
- Huang, C.Y.; Hu, C.K.; Yu, C.J.; Sung, C.K. Experimental investigation on the performance of a compressed-air driven piston engine. Energies 2013, 6, 1731–1745. [Google Scholar] [CrossRef]
- Fazeli, A. Development of a Novel air Hybrid Engine. Ph.D. Thesis, University of Waterloo, Waterloo, ON, Canada, 2011. [Google Scholar]
- Chen, P.-T.; Nghia, D.D.; Yang, C.-J.; Huang, K.D. Study of system integral energy efficiency of a hybrid pneumatic power system. Appl. Sci. 2019, 9, 2333. [Google Scholar] [CrossRef]
- Marshall, R. Compressed Air Controls, Compressed Air Challenge—Air Best Practices; Air Power USA Inc.: Baltimore, OH, USA, 2011. [Google Scholar]
- Compressed Air Manual, Atlas Coopco; Atlas Copco Airpower NV: Wilrijk, Belgium, 2015.
- Ruppelt, E.; Bahr, M. Taschenbuch Drucklufttechnik; Vulkan-Varlag: Essen, Germany, 2000. [Google Scholar]
- Sandeep, R. Receiver Sizing Calculation; Indian Institute of Technology: Kanpur, India, 2019; Available online: http://docs.codecalculation.com/process/storage/receiver-sizing/help.html (accessed on 1 August 2019).
- SMC Calculation Software, Charge and Discharge to/from Tank; SMC Corporation: Tokyo, Japan, 2023; Available online: https://mssc.smcworld.com/cdtcs/#/permit?language=en (accessed on 18 March 2023).
- Kaeser Toolbox Calculators; Kaeser Company: Coburg, Germany, 2023; Available online: https://us.kaeser.com/compressed-air-resources/toolbox-calculators (accessed on 18 March 2023).
- Dutton, J.G.; Coverdill, R.E. Experiments to study the gaseous discharge and filling of vessels. Int. J. Eng. Ed. 1997, 13, 123–134. [Google Scholar]
- Rais, I.; Mahmoudi, H. Study and dimensioning of the tanks dedicated to a compressed air energy storage system (CAES). Int. J. Electron. Com. Eng. 2018, 8, 2029–2037. [Google Scholar]
- ISO 6358-3:2014; Pneumatic Fluid Power—Determination of Flow Rate Characteristics of Components Compressible Fluids–Part 3: Method for Calculating Steady Flow Rate. Characteristics of Systems. ISO: Geneva, Switzerland, 2014. Available online: https://www.iso.org/standard/56616.html (accessed on 18 March 2023).
- ISO 8778:2003; Pneumatic Fluid Power—Standard Reference Atmosphere. ISO: Geneva, Switzerland, 2003. Available online: https://www.iso.org/standard/26559.html (accessed on 18 March 2023).
- Standard JIS B 8390: 2016; Pneumatic Fluid Power-Determination of Flow-Rate Characteristics of Components Using Compressible Fluids–Part 1: General Rules and Test Methods for Steady-State Flow. Japanese Industrial Standards Committee: Tokyo, Japan, 2016.
- Dindorf, R. Measurement of pneumatic valve flow parameters on the test bench with interchangeable venturi tubes and their practical use. Sensors 2023, 23, 6042. [Google Scholar] [CrossRef]
- Standard VDI/VDE 2173: 2022; Fluidic Characteristic Quantities of Control Valves and Their Determination. The Association of German Engineers: Düsseldorf, Germany, 2022. Available online: https://www.vdi.de/en/home/vdi-standards/details/vdivde-2173-fluidic-characteristic-quantities-of-control-valves-and-their-determination (accessed on 1 August 2022).
- Standard ANSI/ISA-75.01.01: 2012; Industrial Process Control Valves—Part 2-1: Flow Capacity-Sizing Equations for Fluid Flow under Installed Conditions. American National Standards Institute: Washington, DC, USA, 2012.
- Kiczkowiak, T. Selection of pneumatic control valves from catalogues. J. Mech. Sci. Technol. 2009, 23, 2345–2349. [Google Scholar] [CrossRef]
- SMC Pneu Book; SMC Corporation: Tokyo, Japan, 2023; Available online: https://www.bpx.co.uk/file/SMC-PNEU-Book.pdf (accessed on 1 January 2020).
- Qian, Y.; Xiang, M.G. Computation of instantaneous polytropic exponent of discharge process of a tank with pressurized gas. Int. J. Fluid Power 2008, 9, 27–33. [Google Scholar] [CrossRef]
- Zhao, W.; Ye, Q.; Meng, G.X. Measurement of flow rate characteristics of pneumatic components based on the dynamic regularity of polytropic exponents. Fluid Meas. Inst. 2011, 22, 331–337. [Google Scholar] [CrossRef]
- SMC Web Catalog. Directional Control Valves; SMC Corporation: Tokyo, Japan, 2023. [Google Scholar]
- Hydac Portable Data Recorder HMG 3000. Datasheet; Hydac Electronic GmbH: Saarbrücken, Germany, 2012.
- Directive 2014/68/EU of the European Parliament and of the Council. Brussels, Belgium. 2014. Available online: https://eur-lex.europa.eu/legal-content/EN/TXT/PDF/?uri=CELEX:02014L0090-20210811 (accessed on 15 May 2014).
- Rabi, A.M.; Radulovic, J.; Buick, J.M. Comprehensive review of compressed air energy storage (CAES) technologies. Thermo 2023, 3, 104–126. [Google Scholar] [CrossRef]
- Ventosa, E. Semi-solid flow battery and redox-mediated flow battery: Two strategies to implement the use of solid electroactive materials in high-energy redox-flow batteries. Curr. Opin. Chem. Eng. 2022, 37, 100834. [Google Scholar] [CrossRef]
- Dvorak, L.; Fojtasek, K.; Rehacek, V. Calculations of parameters and mathematical model of rotary air motor. In Proceedings of the EFM16—Experimental Fluid Mechanics, EPJ Web of Conferences, Marienbad, Czech Republic, 15–18 November 2016; Volume 143, pp. 1–4. [Google Scholar]
- Lieh, L. Determination of cycling speed using a closed-form solution from nonlinear dynamic equations. Hum. Power J. 2006, 10, 1–9. [Google Scholar]
- Ivlev, V.I.; Misyurin, S.Y. To refining the thermos-mechanical model of vane type air motor. Proc. Comput. Sci. 2021, 190, 377–387. [Google Scholar] [CrossRef]
Figure 1.
Diagram of the CAST model: 1—storage tank, 2—pressure gauge, 3—safety valve, 4—water drain lap, 5—inlet ball valve; 6—outlet ball valve.
Figure 1.
Diagram of the CAST model: 1—storage tank, 2—pressure gauge, 3—safety valve, 4—water drain lap, 5—inlet ball valve; 6—outlet ball valve.

Figure 2.
CAST charging and discharging configurations: (a) tank charging, (b) tank discharging, (c) tank charging and discharging, and (d) discharging and charging tank-to-tank.
Figure 2.
CAST charging and discharging configurations: (a) tank charging, (b) tank discharging, (c) tank charging and discharging, and (d) discharging and charging tank-to-tank.

Figure 3.
Schematic diagram of the calculation model for the CAST charging and discharging process: 1—storage tank, 2—air inlet valve, 3—air outlet valve.
Figure 3.
Schematic diagram of the calculation model for the CAST charging and discharging process: 1—storage tank, 2—air inlet valve, 3—air outlet valve.

Figure 4.
CAST test stand: (a) view of the test bench; (b) diagram when CAST charging; (c) diagram when CAST discharging. 1—CAST tested, 2—HDA pressure transmitter, 3—ETS temperature transmitter, 4—pneumatic solenoid valve, 5—HMG 3000 device, and 6—PC with HMGWIN 3000 software.
Figure 4.
CAST test stand: (a) view of the test bench; (b) diagram when CAST charging; (c) diagram when CAST discharging. 1—CAST tested, 2—HDA pressure transmitter, 3—ETS temperature transmitter, 4—pneumatic solenoid valve, 5—HMG 3000 device, and 6—PC with HMGWIN 3000 software.


Figure 5.
Comparison of the numerical solution and the measurement of the CAST charging processes: (a) pressure change for nc = 1.022 and tc = 46.95 s; (b) temperature change for τc = 60 s. 1—numerical solution curve; 2—measurement curve.
Figure 5.
Comparison of the numerical solution and the measurement of the CAST charging processes: (a) pressure change for nc = 1.022 and tc = 46.95 s; (b) temperature change for τc = 60 s. 1—numerical solution curve; 2—measurement curve.

Figure 6.
Comparison of the numerical solution and the measurement of the CAST discharge processes: (a) pressure change for nd = 1.01 and td = 108.86 s; (b) temperature change for τd = 90. 1—numerical solution curve; 2—measurement curve.
Figure 6.
Comparison of the numerical solution and the measurement of the CAST discharge processes: (a) pressure change for nd = 1.01 and td = 108.86 s; (b) temperature change for τd = 90. 1—numerical solution curve; 2—measurement curve.

Figure 7.
WQ curves as a function of the pressure ratio pa/ps.

Figure 8.
Curves of the CAST energy factor as a function of the pressure ratio of the expanding gas.
Figure 8.
Curves of the CAST energy factor as a function of the pressure ratio of the expanding gas.

Figure 9.
Curves of the CAST energy ratio as a function of the pressure ratio of the expanding gas.

Figure 10.
CAST energy density curves depending on the stored pressure.

Figure 11.
Diagrams of the HPAS functional model used to drive (a) DC generators: 1—high-pressure compressed tank, 2—high-pressure reducing valve, 3—low-pressure reducing valve, 4—3/2 directional control valve, 5—air vane motor, 6—DC generator, and (b) pneumatic propulsion system: 1—high-pressure compressed cylinders, 2—high-pressure reducing valve, 3—controlled low-pressure regulator, 4—5/2 directional control valve, 5—unidirectional flow control valves, 6—air piston motor; 7—wheel of a propulsion system of the CAV.

Figure 12.
Dimensionless static torque characteristics of air motor.

Figure 13.
Dimensionless static mechanical power characteristics of an air motor.

Figure 14.
Characteristics of the CAST connected to an air motor: (a) decrease in stored pressure, and (b) expansion of stored energy.
Figure 14.
Characteristics of the CAST connected to an air motor: (a) decrease in stored pressure, and (b) expansion of stored energy.

Disclaimer/Publisher’s Note: The statements, opinions and data contained in all publications are solely those of the individual author(s) and contributor(s) and not of MDPI and/or the editor(s). MDPI and/or the editor(s) disclaim responsibility for any injury to people or property resulting from any ideas, methods, instructions or products referred to in the content. |
© 2024 by the author. Licensee MDPI, Basel, Switzerland. This article is an open access article distributed under the terms and conditions of the Creative Commons Attribution (CC BY) license (https://creativecommons.org/licenses/by/4.0/).
Share and Cite
MDPI and ACS Style
Dindorf, R. Study of the Energy Efficiency of Compressed Air Storage Tanks. Sustainability 2024, 16, 1664. https://doi.org/10.3390/su16041664
AMA Style
Dindorf R. Study of the Energy Efficiency of Compressed Air Storage Tanks. Sustainability. 2024; 16(4):1664. https://doi.org/10.3390/su16041664
Chicago/Turabian StyleDindorf, Ryszard. 2024. "Study of the Energy Efficiency of Compressed Air Storage Tanks" Sustainability 16, no. 4: 1664. https://doi.org/10.3390/su16041664
Note that from the first issue of 2016, this journal uses article numbers instead of page numbers. See further details here.