Article

Profiling Space Heating Behavior in Chilean Social Housing: Towards Personalization of Energy Efficiency Measures

EDBI Research Group, Faculty of Architecture, Building and Planning, The University of Melbourne, Parkville VIC 3010, Australia
*
Author to whom correspondence should be addressed.
Sustainability 2015, 7(6), 7973-7996; https://doi.org/10.3390/su7067973
Submission received: 28 February 2015 / Revised: 10 June 2015 / Accepted: 15 June 2015 / Published: 19 June 2015
(This article belongs to the Special Issue ZEMCH Research Initiatives: Mass Customisation and Sustainability)

Abstract

:
Global increases in the demand for energy are imposing strong pressures over the environment while compromising the capacity of emerging economies to achieve sustainable development. In this context, implementation of effective strategies to reduce consumption in residential buildings has become a priority concern for policy makers as minor changes at the household scale can result in major energy savings. This study aims to contribute to ongoing research on energy consumer profiling by exploring the forecasting capabilities of discrete socio-economic factors that are accessible through social housing allocation systems. Accordingly, survey data gathered by the Chilean Ministry of Social Development was used identify key characteristics that may predict firewood usage for space heating purposes among potential beneficiaries of the Chilean social housing program. The analyzed data evidences strong correlations between general household characteristics and space heating behavior in certain climatic zones, suggesting that personalized delivery of energy efficiency measures can potentially increase the effectiveness of initiatives aimed towards the reduction of current patterns of consumption.

1. Introduction

Energy efficiency has become a priority concern for both developing and developed nations. Current patterns of energy consumption can have strongly negative social, economic and environmental impacts; hence the need for policies to further promote a transformation of the way in which natural resources are been harvested, distributed and consumed [1]. In this context, a significant amount of energy is being used in the operation of residential buildings. The International Energy Agency explains that almost 23% of the total energy consumed in 2011 was used in the residential sector, meaning that since 1990 the domestic demand has grown by 35% [2]. Significantly, most of this energy is being used for space and water heating [1], suggesting that household activities and perceptions may have a strong impact on overall patterns of consumption.
Policy-makers have explored different approaches to tackle this issue including building retrofit programs [3], rating systems [4], and information campaigns to promote behavioral changes [5,6]. Among them, those strategies focused on feeding personalized information back to the consumers have been shown to be remarkable efficient and cost-effective [7,8]. However, implementation of these principles is often not an option for developing nations, as gathering information on the recurrent patterns of operational energy of different users use requires centralized information systems that may not be available or may not even account for some of the fuels used for space heating.
This study explores an alternative approach to energy consumption profiling aimed to inform personalized energy efficiency measures under such technologically lagging conditions. Accordingly, the Chilean social housing program is used as research context to assess the potential firewood consumption forecasting capabilities of discrete socio-economic factors that can be considered before occupancy through subsidy allocation systems.

2. Background

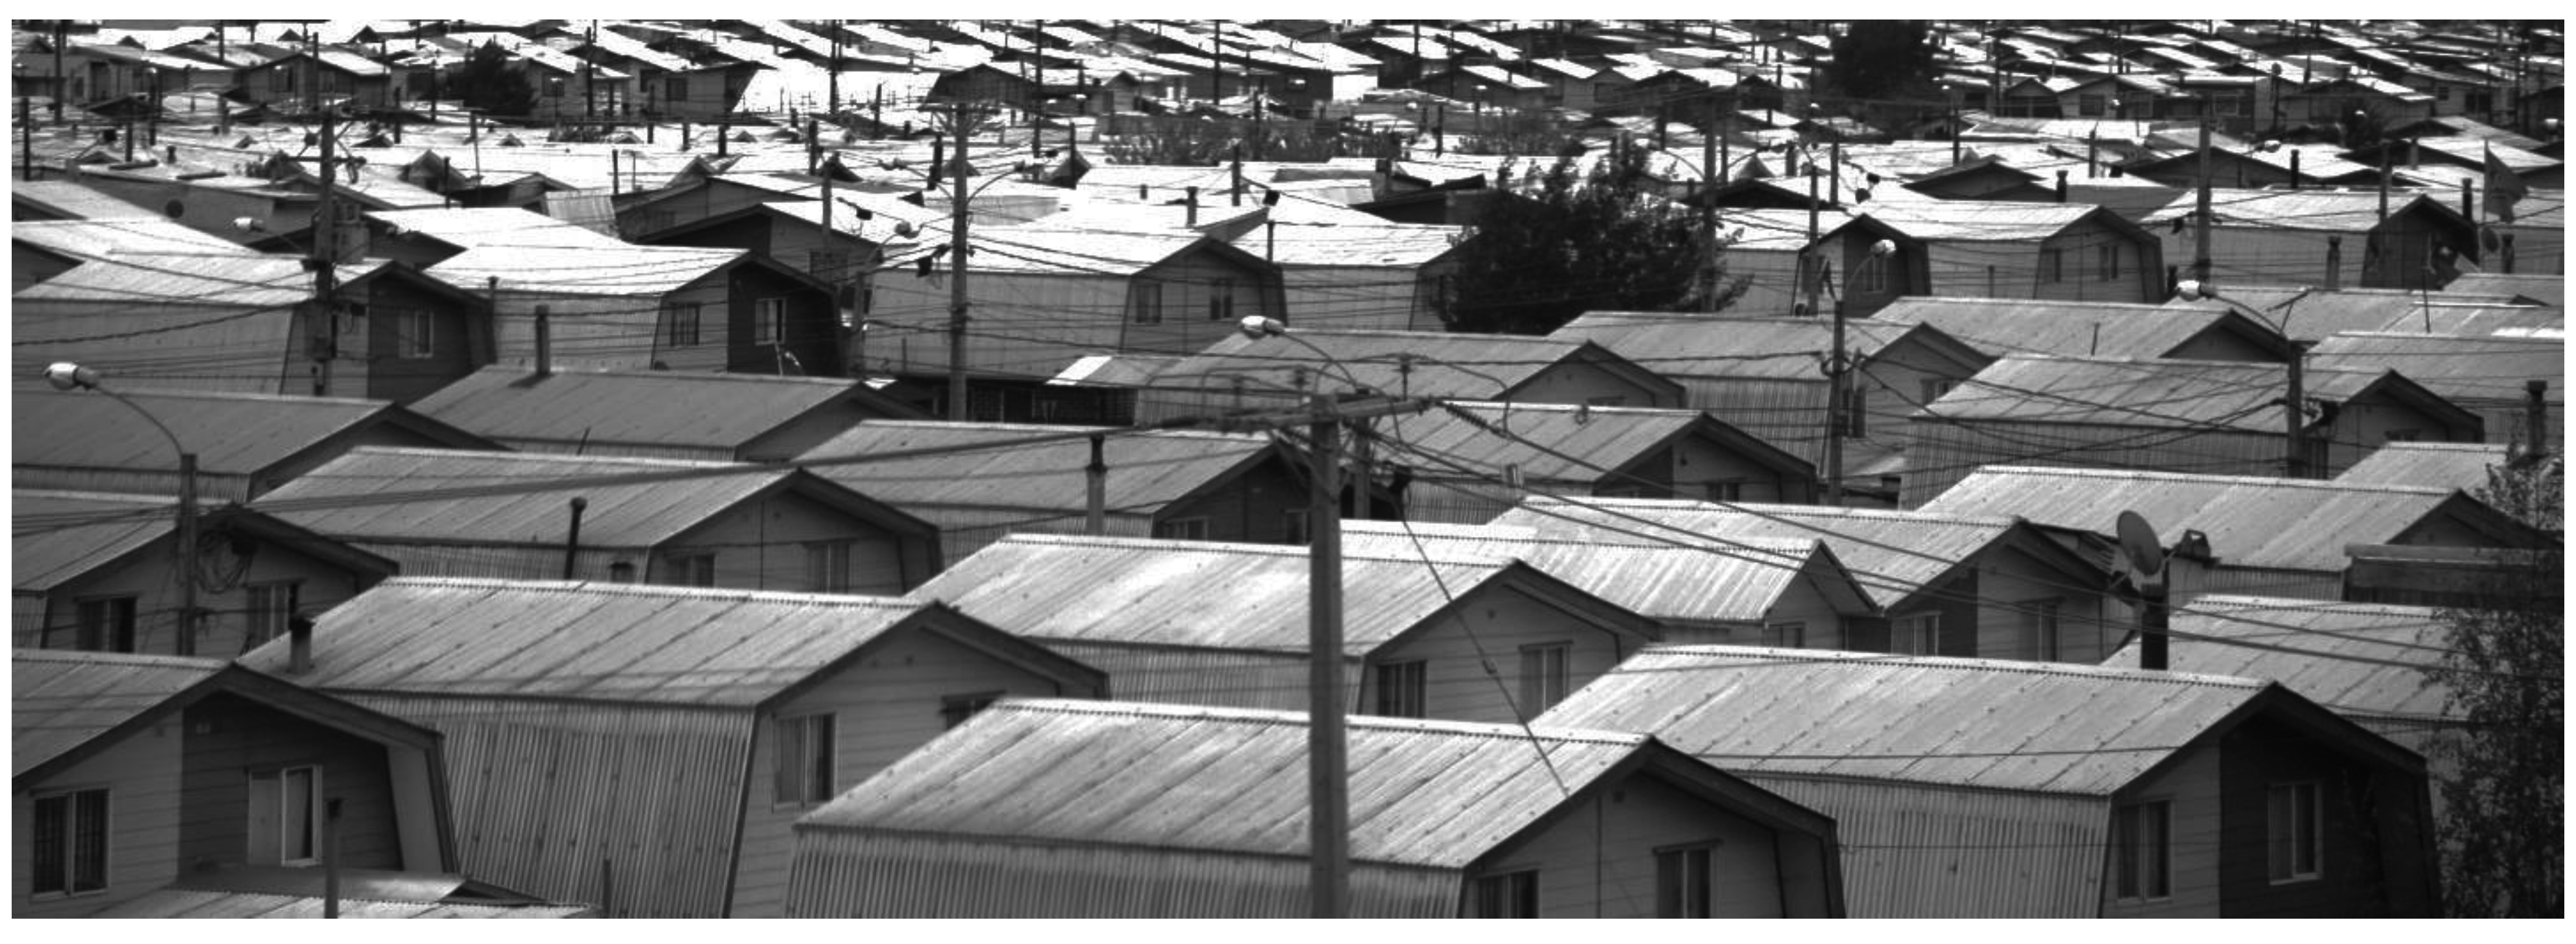
2.1. Chilean Social Housing

Chile is at the threshold of becoming a developed nation. Over the past decades, the Chilean economy has been one of the fastest growing in Latin America, becoming the first country of the region to join the Organization for Economic Co-operation and Development (OECD) by 2010 and starting to be officially recognized as a high-income economy by the World Bank in 2013. One of the consequences of this rapid economic growth has been an unprecedented increase in the internal demand for energy. Over the past 20 years the total consumption of primary energy has more than doubled, while the internal demand for electricity almost quadrupled [9]. However, lack of a clear strategic plan for sustainable development of the energy sector has resulted in a high dependence on imported fossil fuels that maintains the country in a position of high vulnerability [10]. In this context, the Chilean Government has progressively introduced programs and institutions to deal with the current consumption rates whilst promoting efficient use of the available resources.
One of the main areas of the Chilean Agency of Energy Efficiency is operational energy consumption of buildings. By 2012 more than 13% of the country’s total demand for energy came from the residential sector, 66% of which has been estimated to be used solely for space heating purposes [11,12]. This has motivated a number of energy efficiency initiatives specifically focused on housing, including massive educational campaigns and subsidies for the installation of solar water heaters, compact fluorescent bulbs, and upgrading to slow combustion heaters [11].
In this context, the use of biomass for space heating in social housing has significant economic, environmental and public health implications. During 2012, biomass constituted 28% of the total primary energy consumed in Chile, 12% of which was used for space heating in the residential sector [11,12]. Gomez-Lobo [13] explains that the ubiquitous use of firewood for space heating in southern Chile and the lack of adequate regulation are the main reasons behind the high levels of pollution and increasing degradation of native forests of this region. Significantly, an important amount of this firewood consumption can be assumed to be used in social housing as estimations of the Ministry of Social Development suggest that a significant percentage of the current housing stock was acquired though public subsidy programs [14] and most of the firewood consumed in southern Chile is known to be used by households of the lowest socio-economic segments [15] (Figure 1).
Figure 1. Social housing development in Los Angeles, southern Chile.
Sustainability 07 07973 g001
Different studies have shown that social dwellings lack minimum standards to ensure adequate thermal comfort levels during the cold seasons [16,17]. In this context, new regulation and subsidies have been introduced aiming to improve the standards of both new (i.e., the Thermal Regulation, Article 4.1.10 in [18], see also [19]) and existing housing stock (i.e., the Thermal Reconditioning Program, Article 6 in [20], see also [21]). Nonetheless, such initiatives may have strong limitations as they are intended to address no more than the minimum conditions for the average household, or to act as palliative solutions for highly inadequate dwellings. Although design has been shown to be a defining factor for the performance of the dwellings [22,23], there is still limited information regarding the impact of different households on their overall performance that could inform future initiatives towards the reduction of operational energy consumption [24].

2.2. Energy Consumer Profiling

Operational energy consumption for space heating is a problem that goes beyond the architectural characteristics of a dwelling. Different end users may have contrasting perceptions of comfort, as well as different priorities and strategies when dealing with uncomfortable situations. In this context, there is a growing body of research focused on energy consumption profiling that may be used to assess general patterns of residential energy usage without the need of on-site measurement or centralized information systems [25,26,27].
Fredericks et al. [25] make a comprehensive review of the available literature to explain that most of the research focuses on the problem of finding end user profiles that are either above or below average (i.e., “energy-wasting” and “energy saving” users). They propose two main categories of end user profiling methods as those focused on socio-demographic factors (e.g., income, age, household size and educational level), and those focused on psychological factors (e.g., beliefs, intentions, attitudes, and social norms), both of which work in combination with situational factors (e.g., existing laws, socio-cultural factors, and the built environment). Fredericks et al. [25] argue that the stronger socio-economic predictors are those related with household size and composition, income, occupation and employment type (shifts), dwelling type and size, and geographic location, whilst other variables such as age, gender, dwelling age and ownership status may show lower consistency levels. Similarly, Abrahamse and Steg [26] identify household size, income, and age as the strongest indicators of domestic energy use. Guerra Satin [27], nonetheless, acknowledges the difficulties of establishing strong relationships between predefined household profiles (i.e., “family”, “seniors”, “high-income couples”, and “singles and low-income couples”), their behavioral patterns and domestic energy consumption. Accordingly, this study uses clustering techniques to define household profiles based on socio-economic factors that have been shown to be strong predictors of overall patterns of energy consumption and may be accessible through the Chilean social housing subsidy allocation system.

2.3. Subsidy Allocation Process

The Solidary Fund of Housing Choice (SFHC) [28] is a social housing program that enables people from the first quintile (autonomous household income per capita) in situations of social vulnerability to acquire housing solutions without mortgages. It defines—in combination with other regulatory bodies—the methods to calculate each subsidy, the application process and selection criteria, as well as minimum technical standards for the dwellings [18,29,30]. A key selection criteria is the Social Vulnerability Score of each application, which combines the score of the Social Protection File (SPF) [31] of the household with the Housing Scarcity Score [32] of their current dwelling.
The SPF is the main instrument to allocate any social expenditure under the current legislation. Candia et al. [33] explain that the SPF targets vulnerability indicators by assessing relationships between main socio-economic capabilities and needs of the household, as well as the eventual presence of risk factors that may either increase these needs or reduce the effectiveness of their own defense mechanisms, as:
S P F = S . E .   C a p a b i l i t i e s + I n c o m e   /   S . E .   N e e d s × R i s k   F a c t o r s
The socio-economic capabilities factor is calculated by looking at the potential capacity of each household member at working age to generate income, including variables such as labor skills, experience, educational level, and current occupation, while the income factor includes both formal and informal remunerations as well as any other permanent income such as pensions. The socio-economic needs factor corrects the socio-economic capabilities to the number of household members, but also assesses variables such as age, gender, and kinship. The risk factors are calculated using variables such as number of household members that may have physical or mental disabilities, precarious work or location, and health conditions in general [34].
The Housing Scarcity Score adjusts the total SPF with seven variables that assess residential scarcity in the household throughout the application, including eventual presence of secondary households, overcrowding, housing precariousness, water scarcity, lack of sewage or disposal system, housing inhabitability, and participation in the Chile Solidario social protection program. A predefined factor is assigned to each one of these variables to be later subtracted from the total household SPF. The chances of obtaining a subsidy are inversely proportional to this weighted total.
Despite being regarded as an effective method for allocating social expenditure, the FPS has been subject to controversy. Candia et al. [33] and Herrera et al. [34] argue that, as the information is gathered through personal interviews and the responses are not later verified, there is a tendency to distort issues such as household size and disabilities because they may increase the household’s chances of receiving social benefits. Nevertheless, the information contained by the SPF may be used to assess general socio-economic conditions of future dwellers.

3. Methods

3.1. Research Data

The study was conducted using the official CASEN 2013 dataset [35], a cross-sectional nationwide household survey developed by the Chilean Ministry of Social Development. The main objective of this survey is to provide periodical information about the socio-economic state of different Chilean households in order to identify problems and evaluate the impact of social policies. The survey is conducted on site and includes seven modules: registry, education, work, income, health, residents, and dwelling. The CASEN 2013 Survey was conducted nationwide between November 2013 and February 2014, covering 64,842 dwellings and 218,491 people of both urban and rural areas. The survey is voluntary, anonymized, and the datasets are open to the public.

3.2. Target Population and Variables

The first stage of the analysis consisted in the identification of households whose characteristics resemble those targeted by the Chilean social housing regulation [28]. Accordingly, only subsidy dwellings that had a total surface area between 41 and 60 m2 and were acquired without mortgages by people belonging to the first quintile of per capita autonomous income were included, resulting in 2614 cases that were used as the target population (i.e., the SFHC group). The study focused only in urban dwellings. The rest of the cases were used to enable comparative analyses among quintiles as shown in Section 4.1, but were not included in the household consumption profiling analyses discussed in Section 4.3.
In accordance to the SPF formula, 28 of the 600 available variables of the CASEN dataset [35] were included in the analyses, i.e.: region, district, zone, gender, age, marital status, head of household, number of household members and nuclei (Registry module); educational level (Education module); occupation or profession, employment category, monetary subsidies, work shifts, and employment type (Occupation module); total autonomous income, total monetary income, and poverty category (Income module); type of permanent or long lasting health conditions, mobility difficulties, and self-assessed health mark (Health module); and overcrowding index, presence of secondary households, dwelling type, wall material, roof material, use of firewood, and annual firewood consumption (Housing module). A detailed description of these variables can be found in [36].
A further four variables were defined over the CASEN dataset. The age segment variable divided individuals in age groups as child (0 to 5), young (6 to 17), young adult (18 to 35), adult (36 to 59), and elder (60+). The occupation category variable divided the occupation or profession variable into qualified occupations (i.e., military, public servants, professional, science and intellectuals, technicians, office employees, sales and service workers, agriculture and fisheries workers, mechanics, and facilities and machinery operators) and non-qualified occupations (other). The climatic zone variable categorized the district variable into 7 thermal zones as defined by MINVU [37]. The disability type variable divided the type of permanent or long lasting health condition variable into two groups as physical and mobility (including deafness, blindness, and muteness), and mental and psychiatric disabilities (including intellectual).

3.3. Statistical Analysis

At a first stage of analysis the whole dataset was sorted by quintile and contrasted to the SFHC group using the variables described in Section 3.2. Then, these variables were divided into 3 categories according to the SPF formula, i.e., household socio-economic capabilities, household socio-economic needs, and household socio-economic risks, whilst others were divided into 2 further categories: dwelling characteristics and firewood consumption. Pearson Bi-variable Correlation was used to identify statistically significant linear relationships across categories, where results r = 0.00 to 0.19 were interpreted as negligible; r = 0.20 to 0.29 as a weakly correlated; r = 0.30 to 0.39 as moderately correlated; r = 0.40 to 0.69 as correlated; and r = 0.7 to 1.00 as strongly correlated. Positive results imply that the correlation occurs in the same direction (i.e., if one variable increases the other one increases, and if one variable decreases the other one also decreases), and negative results imply that the correlation occurs in the opposite direction (i.e., if one variable increases then the other one decreases and vice versa).
At a second stage only statistically correlated variables were clustered using the Two-step Cluster Analysis algorithm. As explained by Bacher et al. [38], the main objective of cluster analysis is to identify groups of objects that are as similar between them and as different to other groups as possible. They argue that traditional clustering methods can be categorized into two main groups: relocation (e.g., k-means and expectation-maximization clustering) and hierarchical methods (e.g., agglomerative and divisive clustering), none of which is able to identify the optimum number of clusters automatically. The main advantage of two-step clustering method is the incorporation of this capability by pre-processing the data and generating a cluster feature tree, which is later used to explore different clustering options and determine the optima using, in this case, Schwarz’s Bayesian Criterion. All the analyses were performed using IBM SPSS Statistics v22.

4. Results and Discussion

4.1. General Demographic Characteristics

The general demographic characteristics of the target households were evaluated under four main categories and contrasted to the total CASEN 2013 dataset. In order to explore similarities and differences between groups, this population was divided into quintiles. These comparative analyses enabled identification of key features of the SFHC group that were later used to guide the definition of household consumption profiles aimed to inform personalised delivery of energy efficiency measures.

4.1.1. Household Size and Structure

The mean household size of the SFHC group was larger than average with 4.77 people per dwelling in contrast to 4.08 of the CASEN total, and more than one person larger than the national average of 3.6 according to 2002 Census data [39] (Figure 2). This is due to a larger concentration of households in the 3–6 people range with more than 80% of the cases, in contrast to more dispersed distributions in Quintiles 1 to 4 (Table 1).
Figure 2. Mean, maximum and minimum number of people per dwelling by quintile contrasted to the Solidary Fund of Housing Choice (SFHC) target population [35].
Sustainability 07 07973 g002
Table 1. Distribution of occupants per dwelling by quintile and in the SFHC target population [35].
SFHCQUINTILE 1QUINTILE 2QUINTILE 3QUINTILE 4QUINTILE 5
11.22%2.68%2.15%3.14%4.59%8.44%
25.55%10.36%10.65%12.24%15.71%22.89%
316.88%18.07%19.23%21.85%26.08%24.40%
426.90%25.64%25.86%25.72%26.56%24.74%
519.58%19.20%19.00%19.04%15.25%12.84%
615.87%11.52%11.92%8.77%7.20%4.49%
75.50%6.20%4.29%4.28%2.58%1.20%
83.92%2.82%4.13%2.33%0.92%0.56%
92.93%1.51%1.52%0.88%0.76%0.41%
101.04%1.20%0.87%1.32%0.25%0.03%
110.61%0.31%0.14%0.34%0.03%0.00%
12+0.00%0.48%0.26%0.08%0.06%0.00%
This tendency towards larger households may have significant consequences for the SFHC group, considering that this variable has been suggested to be among the strongest indicators of domestic energy consumption [25,26]. Significantly, the percentage of overcrowded dwellings (indexes between 2.5 and 3.49) in the SFHC group almost doubled the total average with 18.72% to 8.89% across quintiles. Nonetheless, the ratio of dwellings with medium to critical overcrowding indexes was lower in the SFHC group than in the first quintile (5.78% to 8.66%), but significantly higher than the total average (3.67%) (Figure 3). This can be related to changes to the household structure that happen during the application process, but may also be a result of the overcrowding calculation method (i.e., number of bedrooms/dwellings) as, for example, a single bedroom dwelling with large surface area can have a higher overcrowding index than a smaller one with a larger number of bedrooms.
Figure 3. Overcrowding index per quintile and in the SFHC target population [35].
Sustainability 07 07973 g003
Other possible explanation for this large proportion of overcrowded dwellings might be the number of secondary households found within this group (i.e., two or more households per dwelling). In more than one third of its cases (34.42%) the SFHC group showed secondary households living within the dwelling (i.e., internal, Figure 4), while the number of secondary households living in the same lot but outside the dwelling (i.e., external) was remarkable small (3.53%) when compared to Quintiles 1 to 4 (8.19% to 5.90%). This phenomenon might be linked to the characteristics of the social housing typologies, which are often apartments or units in small lots. These results are also consistent to the structure of the households, as the SFHC group concentrated the larger percentage of binuclear households with 15.96% against 13.21% in the first quintile and 11.63% in the total average, a tendency that also persists in households with three or more nuclei (Figure 4).
In terms of age and gender distribution, the SFHC group showed a strong tendency towards younger population with 19.56% below the adulthood threshold (18 years) in contrast to 12.78% in the total (Figure 5). The proportion of elders (60+ years) was also smaller than average, with 5.75% against 8.35% in the total. A remarkable characteristic of the SFHC group was evident after gender segmentation. While the SFHC female population showed a close to normal distribution (in contrast to the positive skewedness of both male and female population in the total), the SFHC male population showed a significant reduction of individuals at the young adult and adult age segments.
Figure 4. Presence of secondary households (left) and number of nuclei (right) per dwelling by quintile and in the SFHC target population [35].
Sustainability 07 07973 g004
Figure 5. Age segments and gender distribution in SFHC target population (left) and total population (right); positive numbers show males and negative numbers show females [35].
Sustainability 07 07973 g005
This tendency towards a larger proportion of female adults and young adults may be related to the amount of female heads of household, which with 53.78% is the higher across quintiles (average of 38.25%) and the only segment where it surpassed the amount of male heads of household with an average of 61.74% (Figure 6). Although the gender of the users has been suggested to be a poor indicator of operational energy consumption [26], the composition of the household may define its evolution over time and therefore its long term patterns of consumption. Accordingly, these patterns may also be related to the marital status of the residents, which in the SFHC group showed a tendency towards larger proportion of singles and the smaller of married and de facto couples (Figure 6).
Figure 6. Head of household gender ratio (left) and marital status (right) by quintile and in the SFHC target population [35].
Sustainability 07 07973 g006

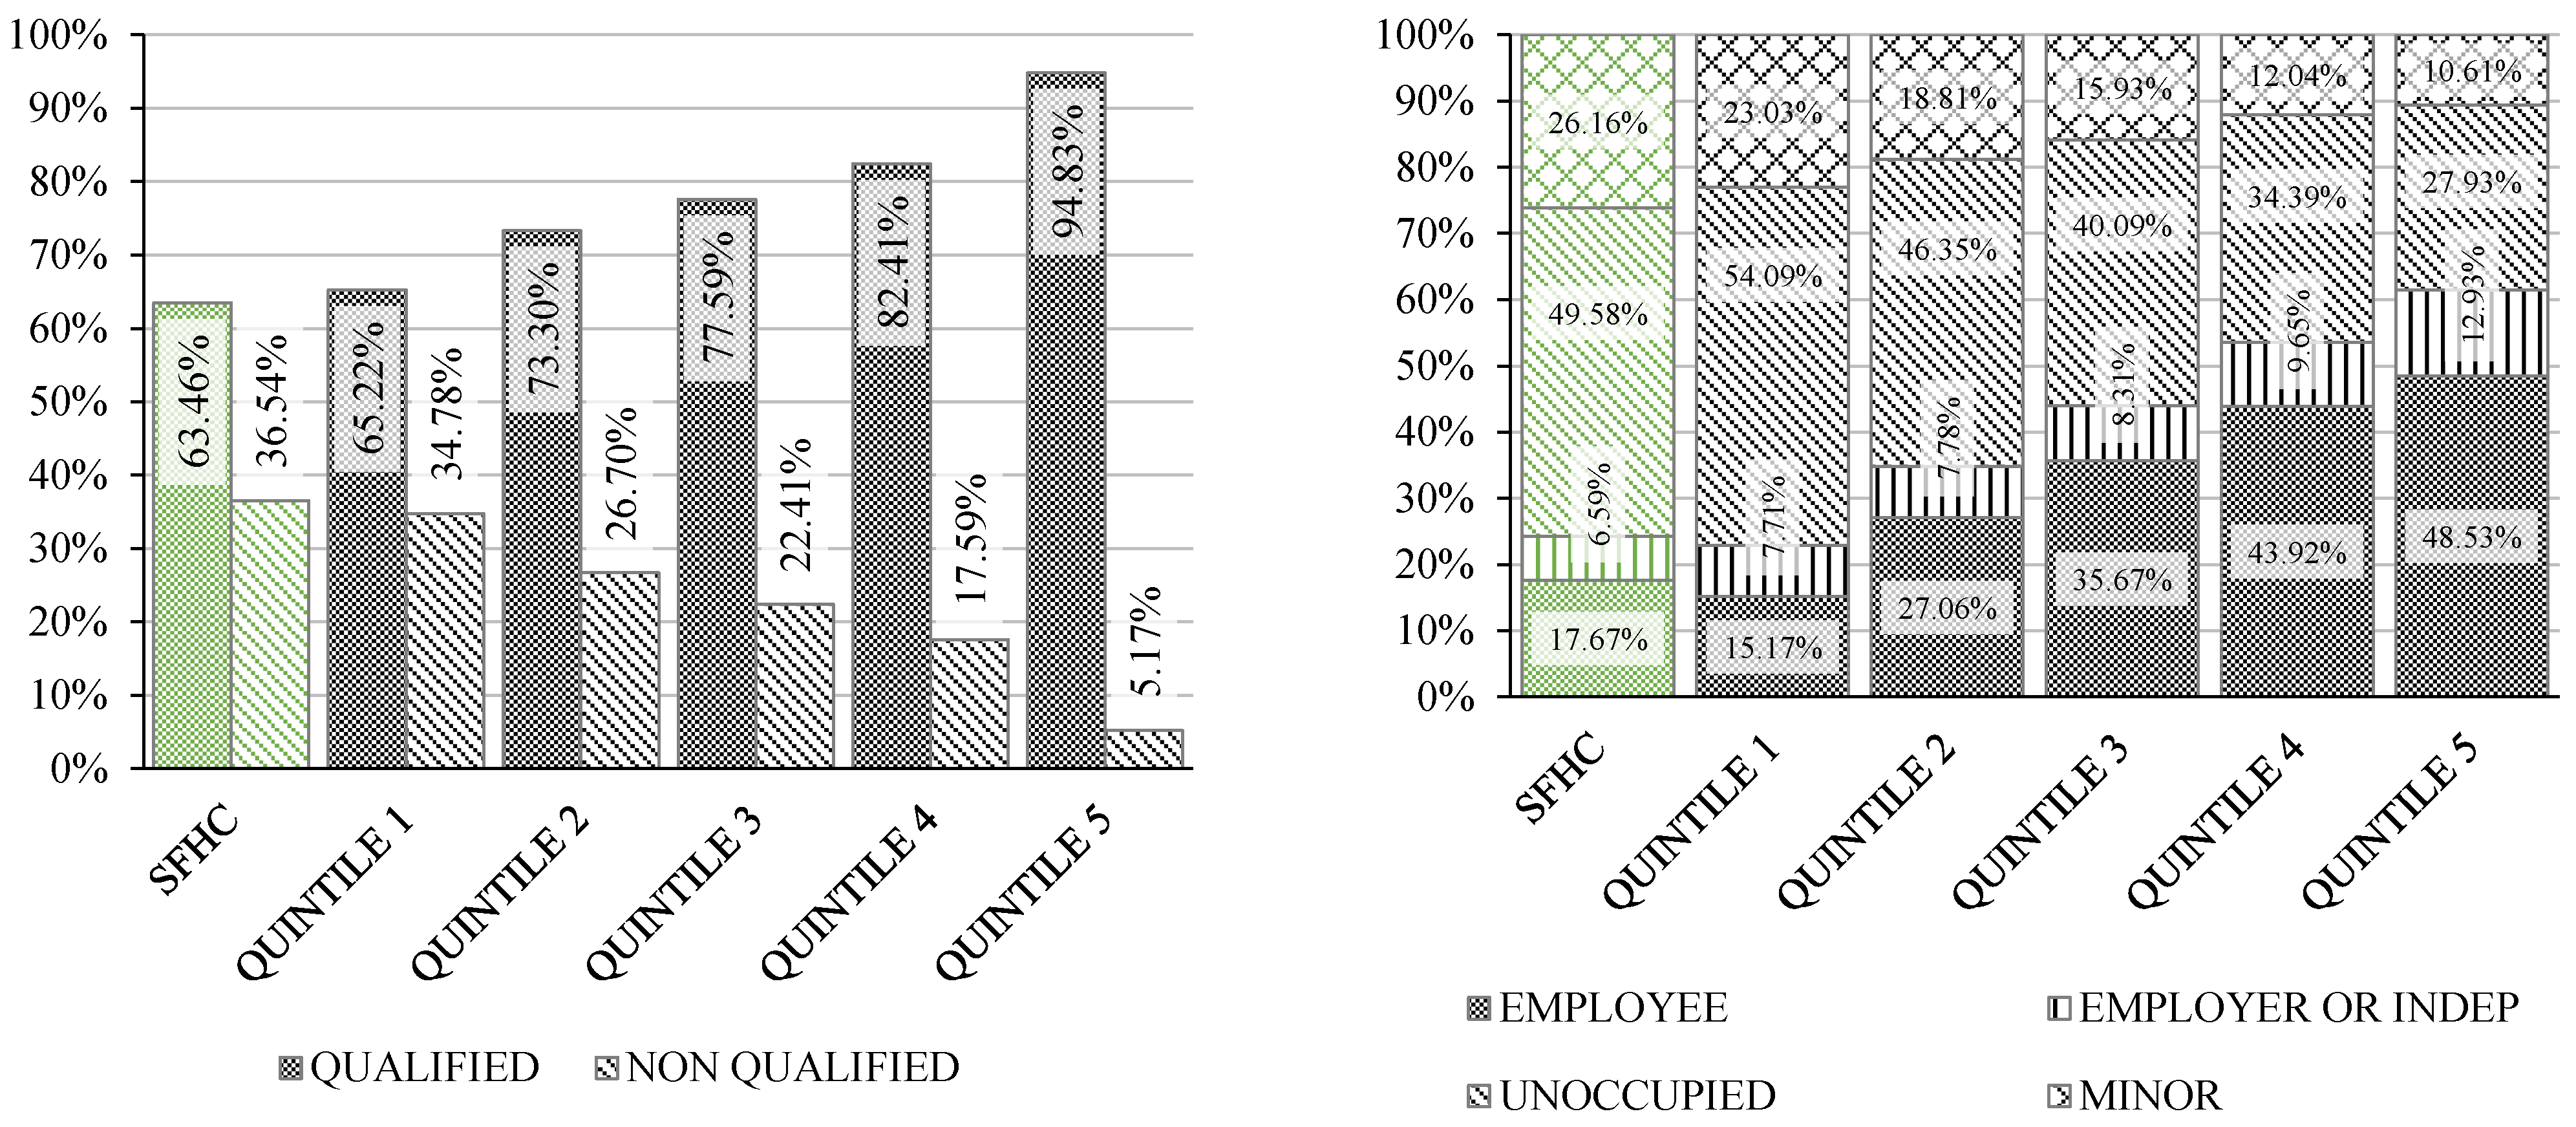
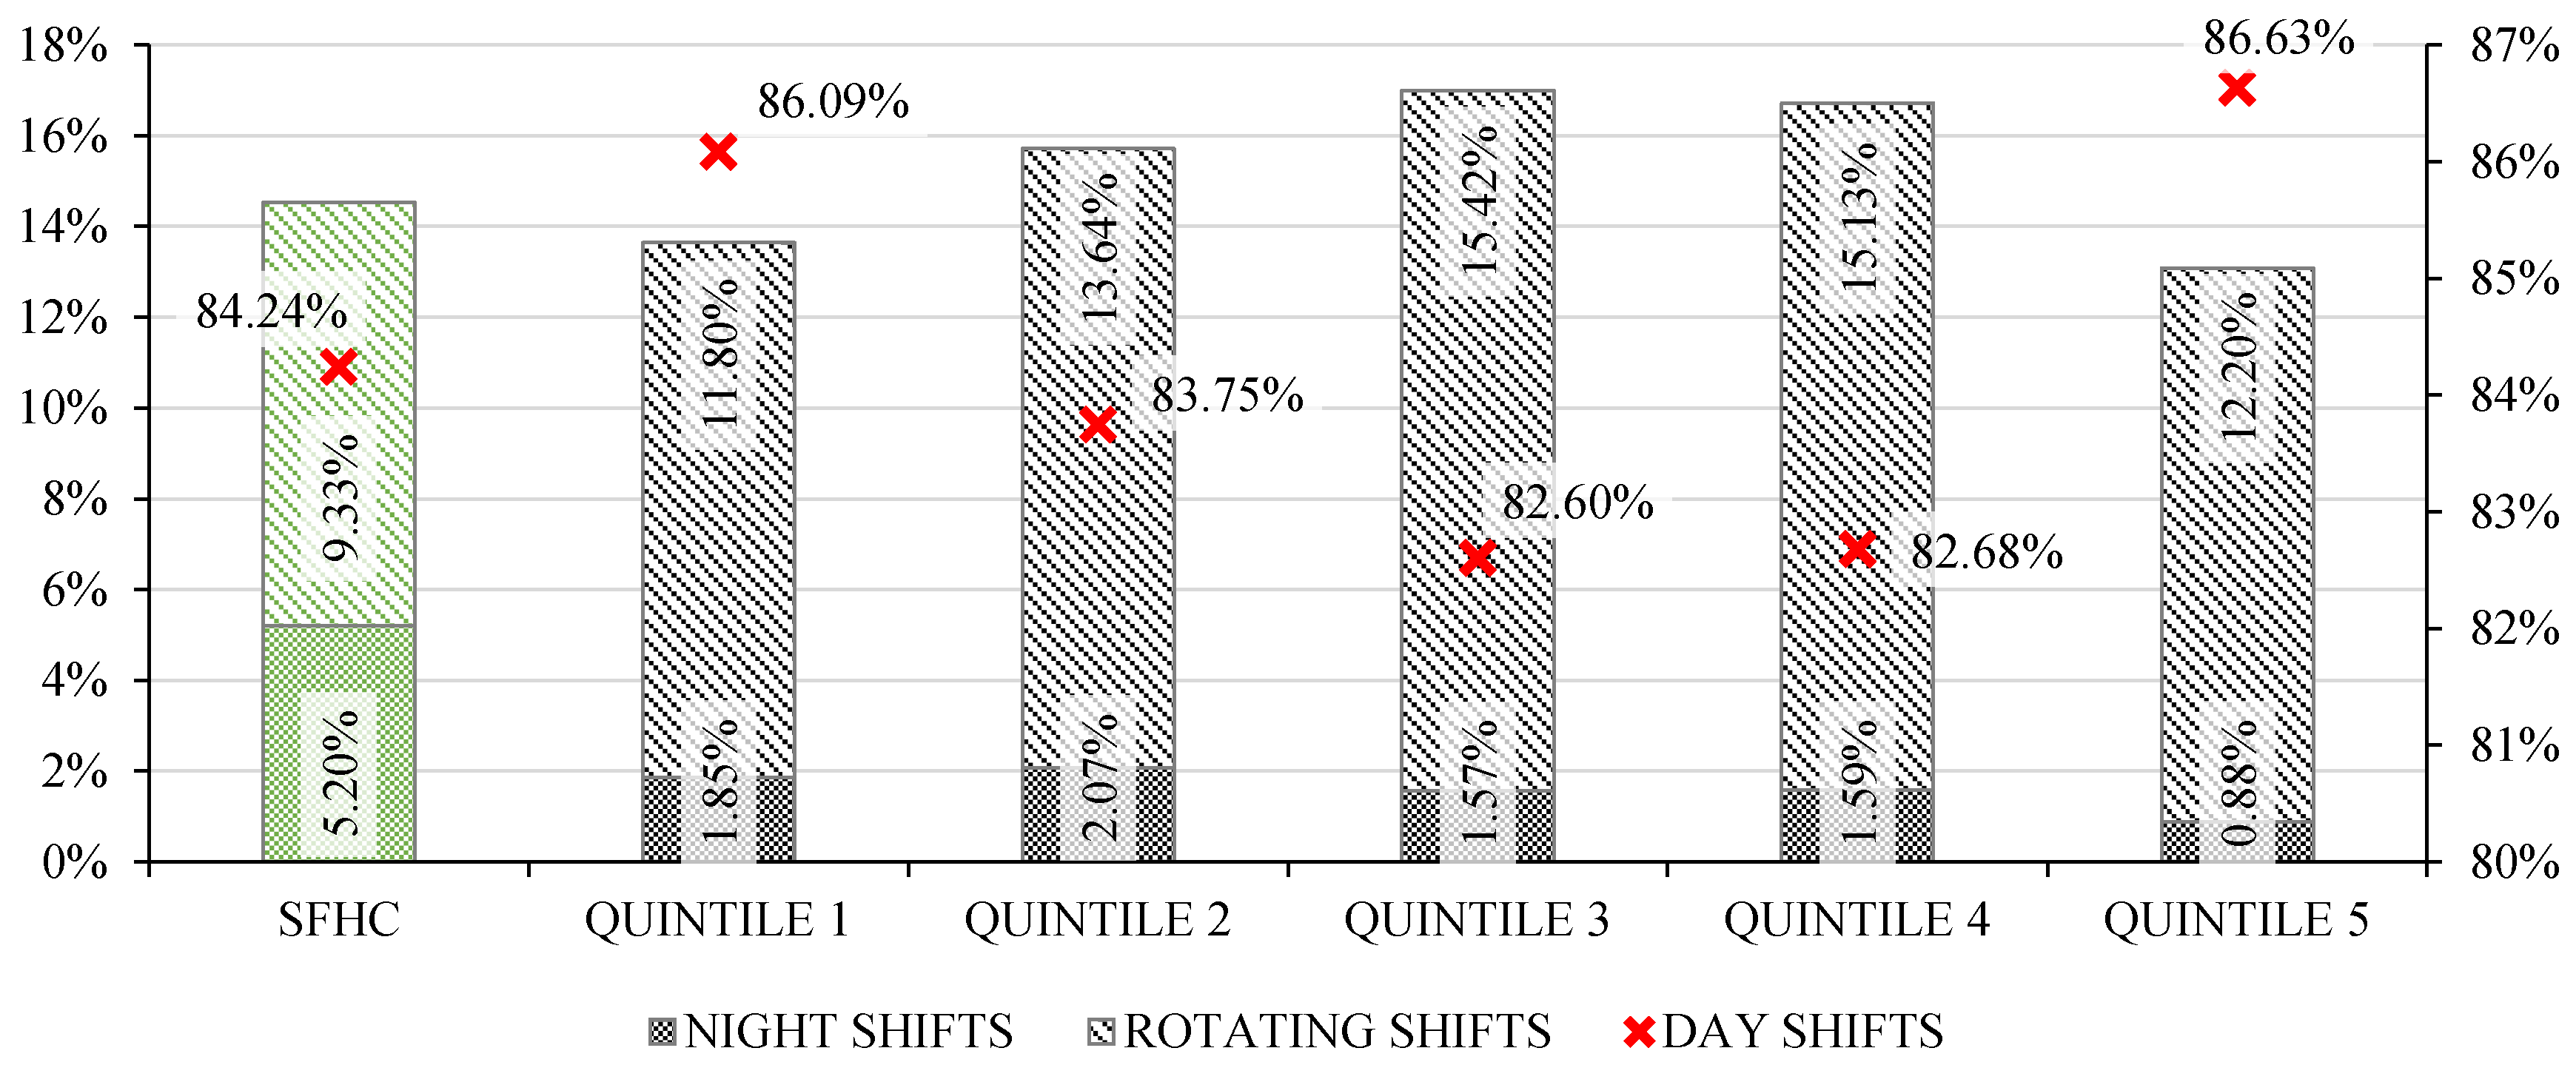
4.1.2. Education and Occupation

While education has been linked to domestic energy conservation attitudes and perceptions, occupation and work shifts may directly impact the schedules, use of electric artifacts, and investment in energy efficient technologies of a household [25]. The SFHC group showed the largest concentration of individuals with no formal and incomplete primary education (48.97%), and the smaller concentration of individuals that attended tertiary education (0.05%). Both the SFHC group and the first quintile concentrated a large amount of individuals with none or incomplete primary education (48.97% and 46.12% respectively), an issue may be directly linked to the occupation of the individual and therefore to the total income of the household.
In terms of the occupation category, the SFHC group showed the larger proportion of non-qualified workers (63.46%), which are nevertheless negligibly higher than in Quintile 1 (65.22%) (Figure 7). These differences remain negligible in terms of the employment category, as both the SFHC group and Quintile 1 showed the larger proportion of ‘minor’ workers (i.e., informal) (26.16% and 23.03%) and the smaller percentage of employers or independent workers (6.59% and 7.71% respectively) (Figure 7). Although also negligible, there was a reduction in the number of unoccupied individuals (−4.51%) and an increase in the number of employees (+2.5%).
Figure 7. Distribution of the main occupation by qualification level (left) and category (right) by quintile and in the SFHC target population [35].
Sustainability 07 07973 g007
In terms of work shifts, the SFHC group showed a significantly higher concentration of night shifts (5.2% to 1.57%) and a smaller concentration of rotating shifts (9.93% to 13.63%) than the total average (Figure 8). Similarly, in terms of employment type the SFHC group showed the lower rates of full-time employment (76.23% to 84.25%) and the higher ones of part-time workers (17.59% to 9.52%) (Figure 9). These tendencies may have a strong impact on the energy consumption patterns of different households as they are directly linked to their schedules.
Figure 8. Distribution of work shifts by quintile and in the SFHC target population [35].
Sustainability 07 07973 g008
Figure 9. Distribution of employment type by quintile and in the SFHC population [35].
Sustainability 07 07973 g009

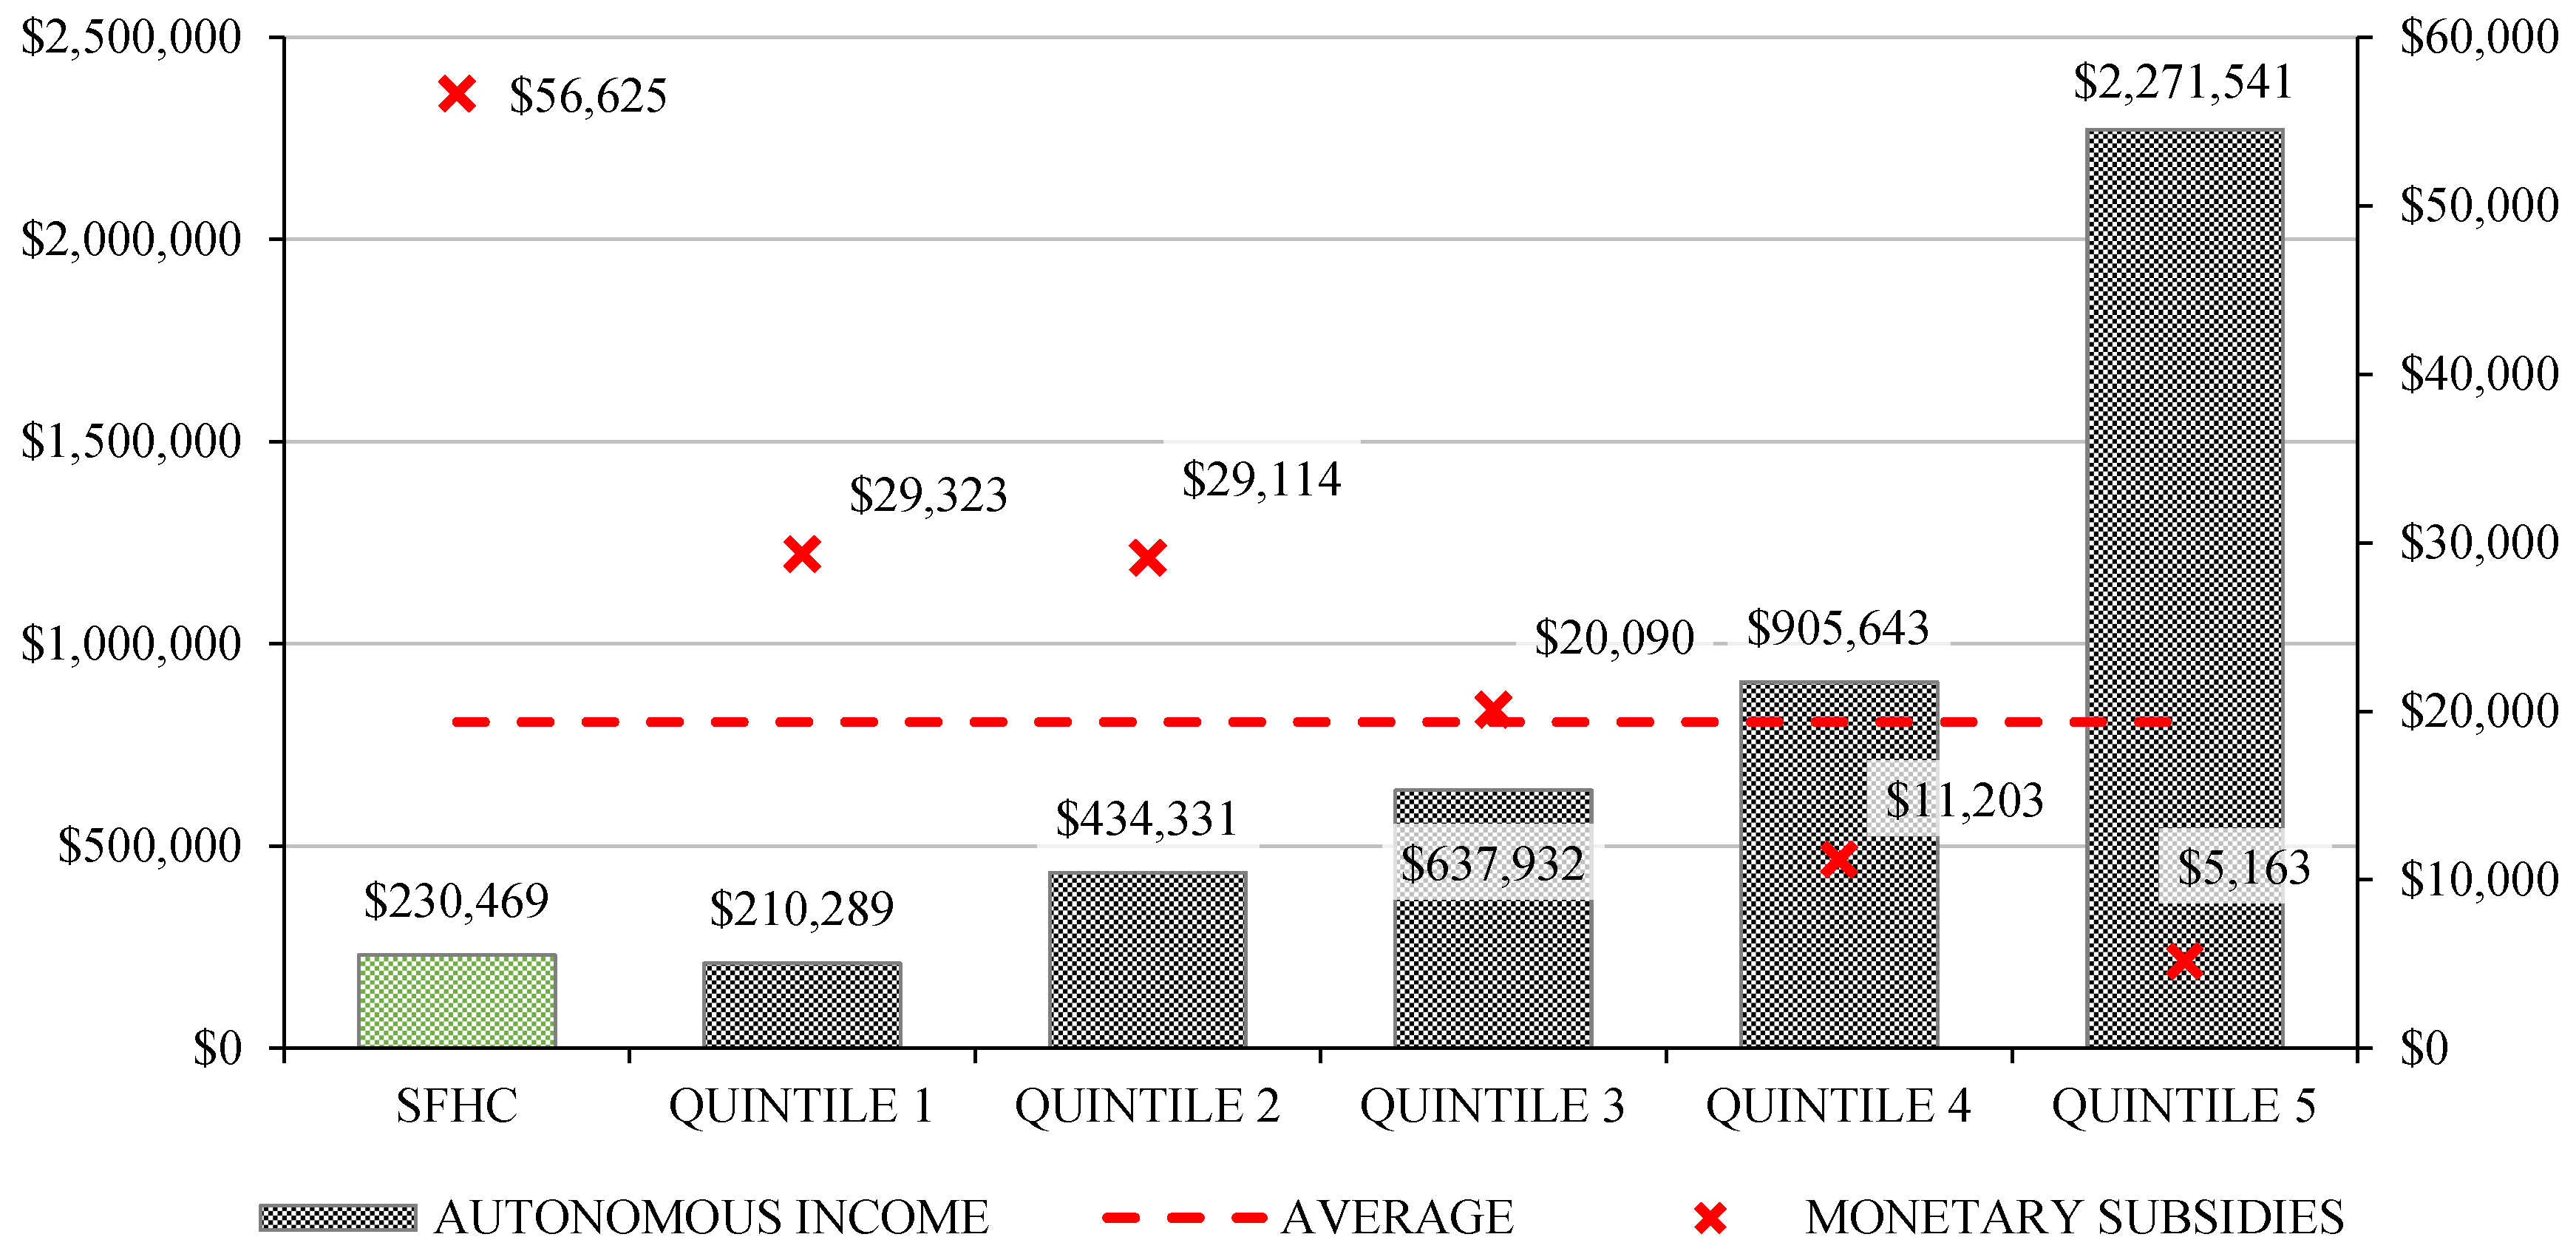
4.1.3. Income and Poverty

Household income is often positively correlated to energy consumption, but may also increase the probabilities of a household to investment in energy efficient technologies [25]. These capabilities may be far from SFHC group, which mean autonomous income was significantly below the national average, both its total household monetary income and per capita monetary income showed minor differences when compared to Quintile 1, and its levels poverty remained significantly higher than average (60.11%) (Figure 10). Significantly, a combination of high consumption rates and low income often result in fuel poverty. However, in the SFHC group these tendencies may be mitigated by monetary subsidies perceived by the households, which almost doubled the ones of the first quintile and were significantly higher than the total average (Figure 10).
Figure 10. Autonomous income and monetary subsidies in Chilean pesos by quintile and in the SFHC target population [35].
Sustainability 07 07973 g010

4.1.4. Disabilities and Health Issues

Households with one or more disabled members are more likely to perceive a lowest income, and consequently to fall into fuel poverty [40]. The number of dwellers with disabilities in the SFHC group was smaller than in Quintile 1 (9.75% to 10.74%), but still higher than the total average (6.04%) (Figure 11). This concentration of disabled individuals in the SFHC group may be related to the opportunistic behavior described by Candia et al., [33] and Herrera et al., [34]; however, the analyzed data showed no evidence of these variables having a direct impact on the SPF focalization process. In terms of the self-assessed health score, the data showed higher results in the SFHC group when compared to Quintile 1 (5.64 and 5.56 respectively), reaching the same score than Quintiles 2 and 3 (Figure 11). Although this variable depends upon highly subjective criteria, such an increment might reflect levels of satisfaction among dwellers.
Figure 11. Percentage of people with disabilities by type (left) and mean declared health mark by quintile and SFHC target population (right) [35].
Sustainability 07 07973 g011

4.2. Dwelling Characteristics and Firewood Consumption

Among other variables, the space heating behavior highly depends upon material and morphological characteristics that define the basic thermal performance capabilities of a dwelling. The CASEN 2013 survey collects only a limited amount of these variables including surface area, architectural type and envelope materials. These characteristics were analyzed by climatic zone to explore existing relationships among dwellings, environment, users, and energy consumption rates.

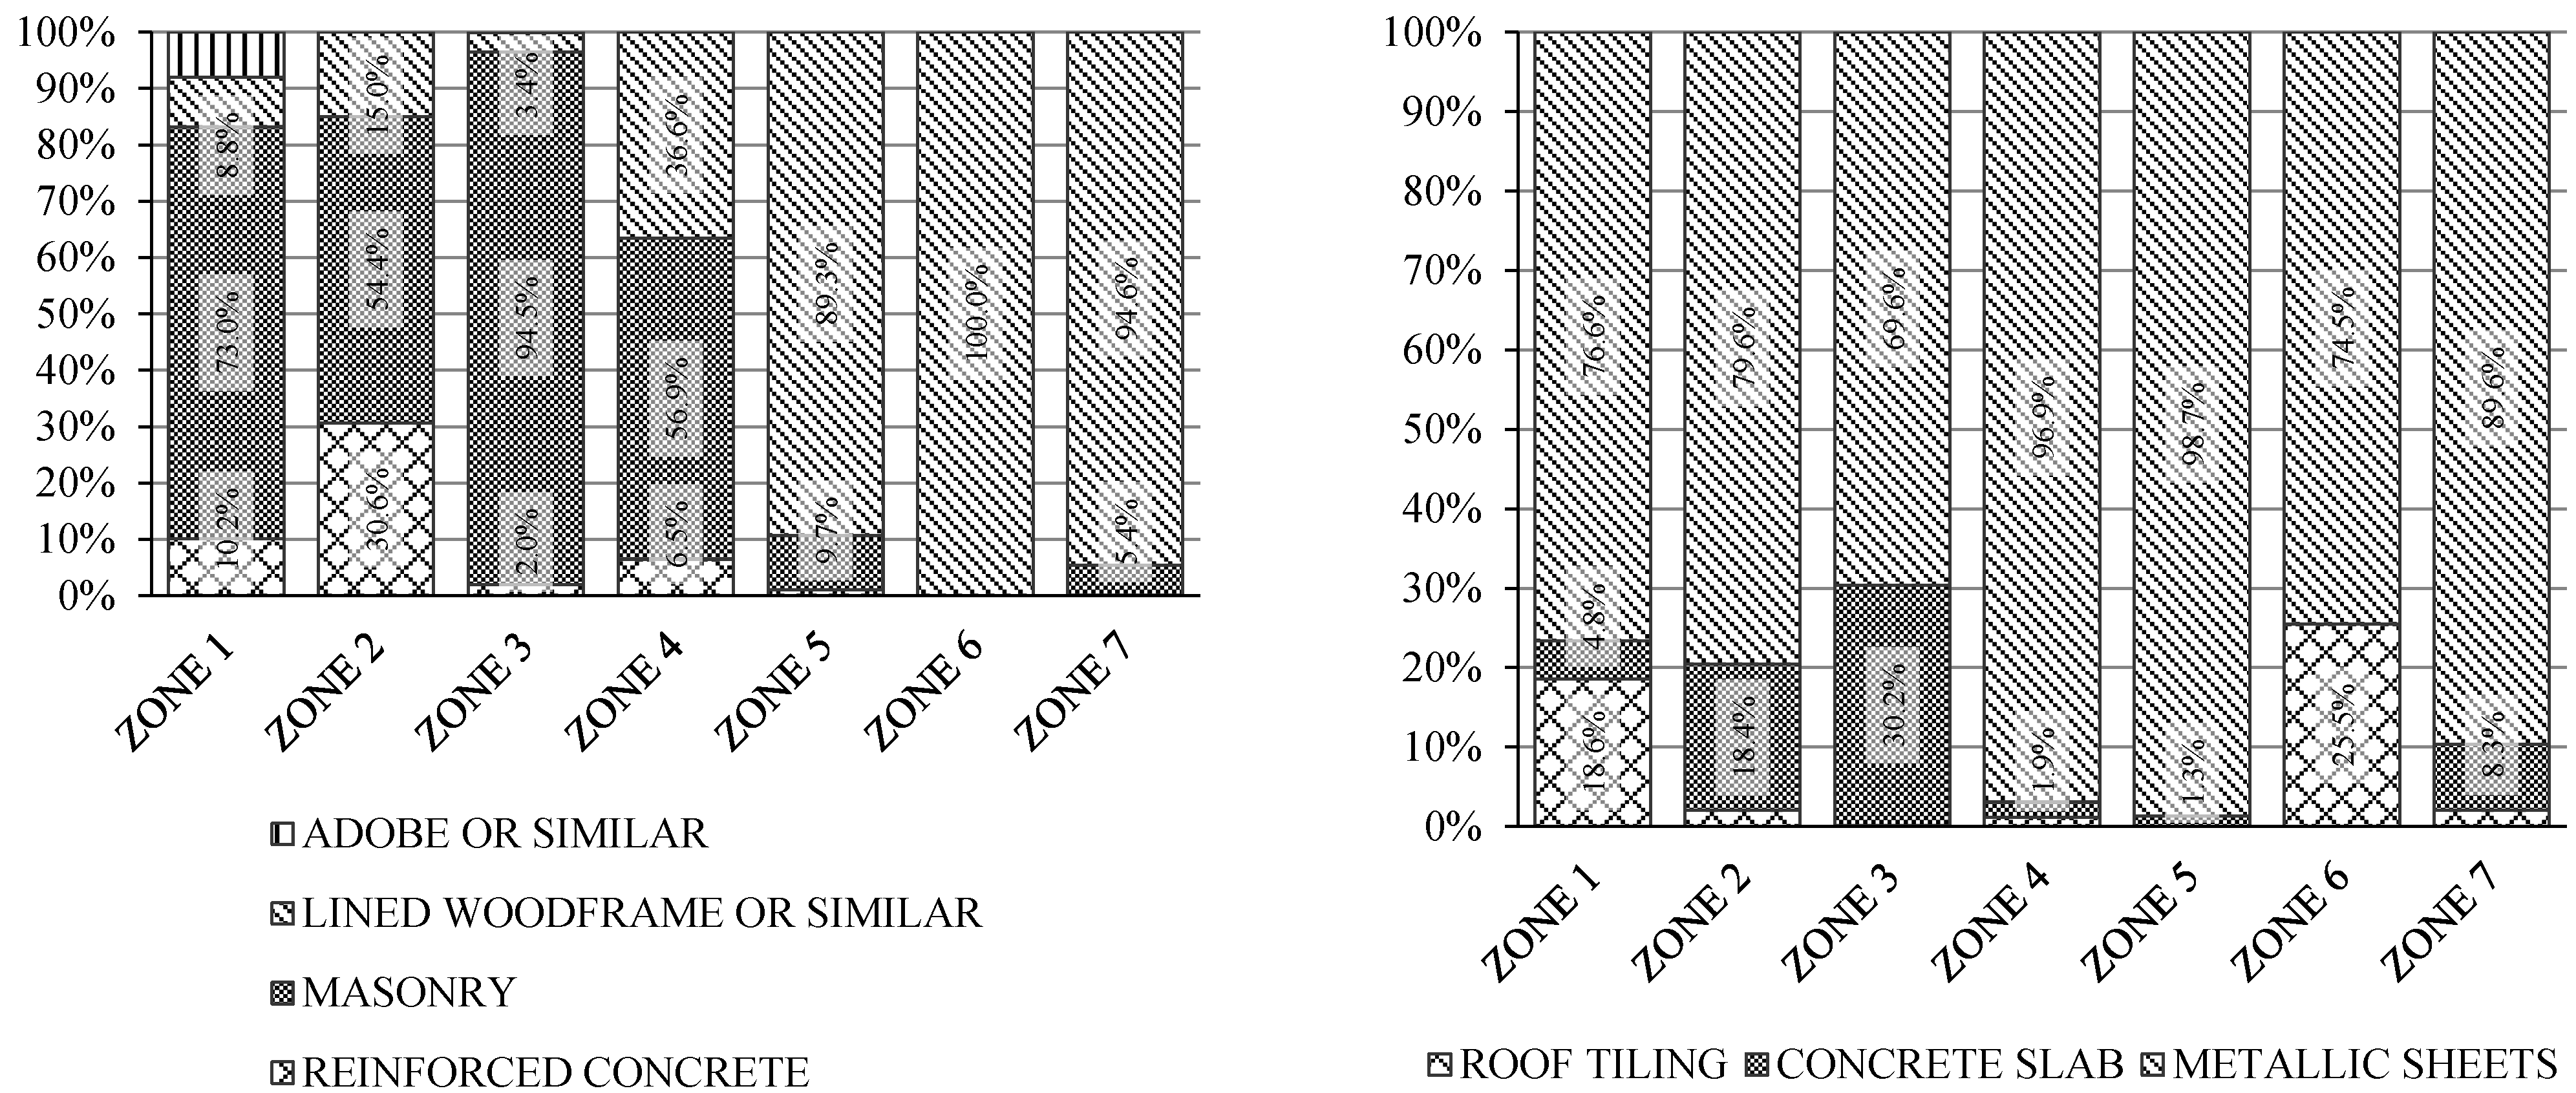
4.2.1. Architectural Types

A total of 33.2% of the SFHC cases were living in detached houses at the moment of the survey, while 38.78% were living in semi-detached houses, 10.41% in terraced houses, and 17.32% in apartments with no lifts. No shanties, “mediaguas”, or other precarious settlements were found, suggesting that at the moment of the survey most of the selected cases were living in formal dwellings. Also, whilst most of the population of Quintiles 1, 2, 3 and 5 were living in detached housing types, the SFHC group showed a stronger tendency towards social housing types such as semidetached houses and apartments with no lifts (i.e., “blocks”).
Regarding the materials of the SFHC dwellings, the analyzed data suggested a gradual transition from masonry at the warmest climatic zones to lined wood frame in colder areas (Figure 12). Zone 3, the most populated of the country, showed a strong prevalence of masonry with 94.5% of the cases; while 100% of the cases in the colder Zone 6 were built with lined wood frames. Other construction techniques such as adobe and reinforced concrete, which are generally associated to vernacular constructions and mid- to high-rise buildings respectively, have a reduced share of the cases in warmer areas. In terms of the roof materials, there was a strong prevalence of metallic sheets across climatic zones (Figure 12). This may be related to the generalized use of zinc-aluminum sheets in social housing for being one of the most inexpensive, durable, and easy to install materials allowed by normative [28]. No information regarding the thickness or insulation properties of these materials was included in the survey.
Figure 12. Main building materials of walls (left) and roofs (right) by climatic zone [35].
Sustainability 07 07973 g012

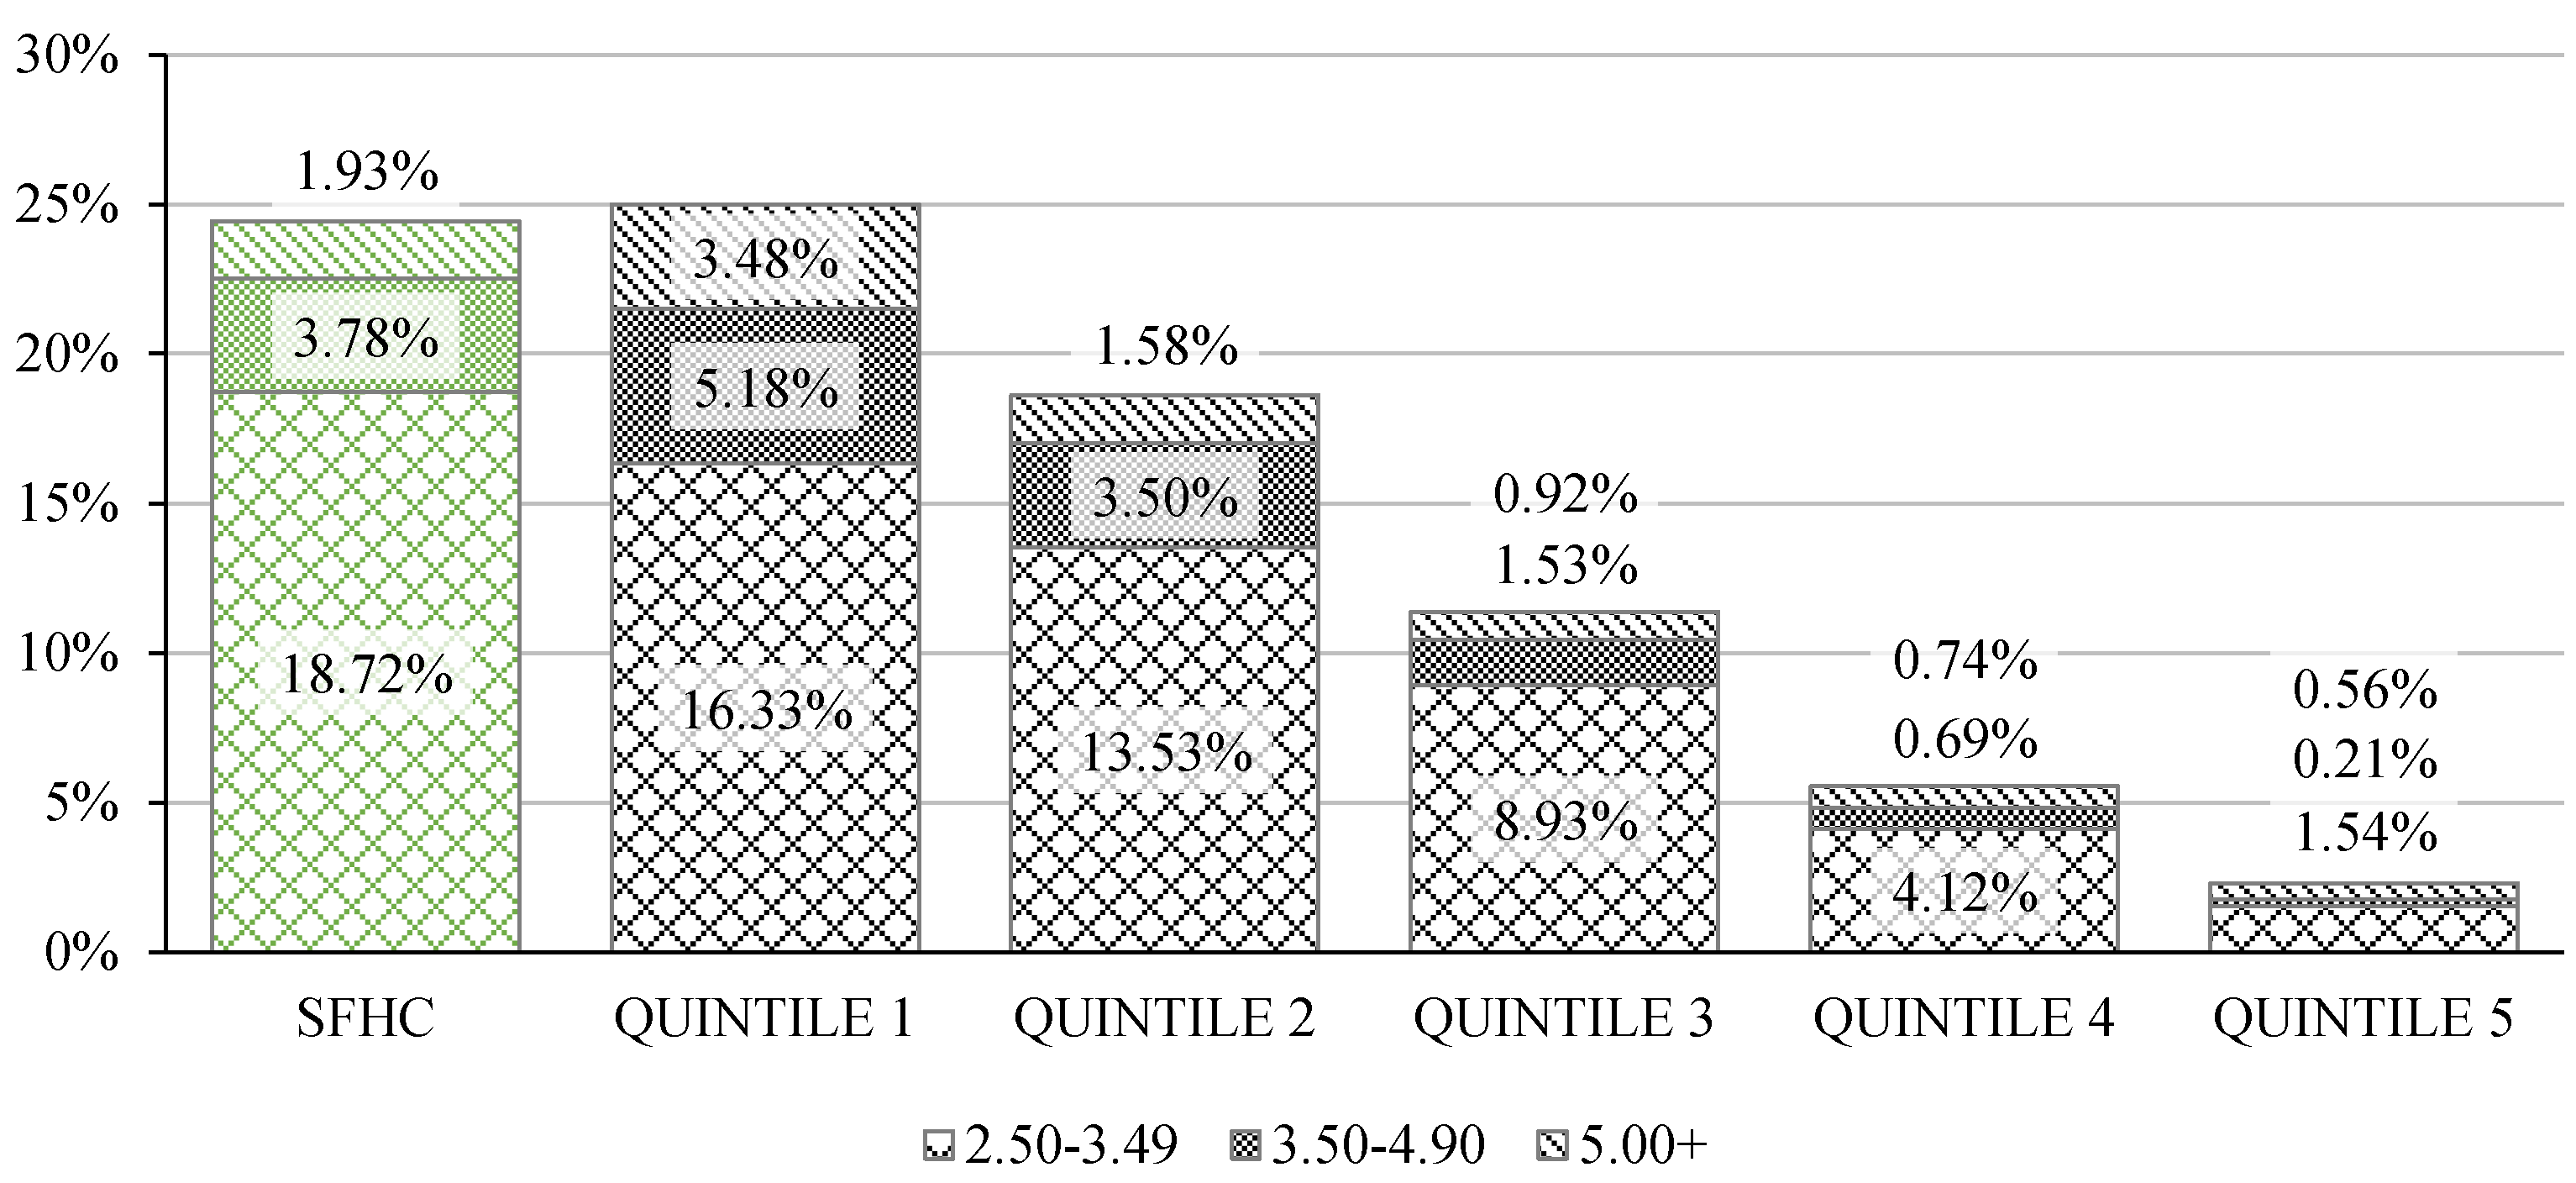
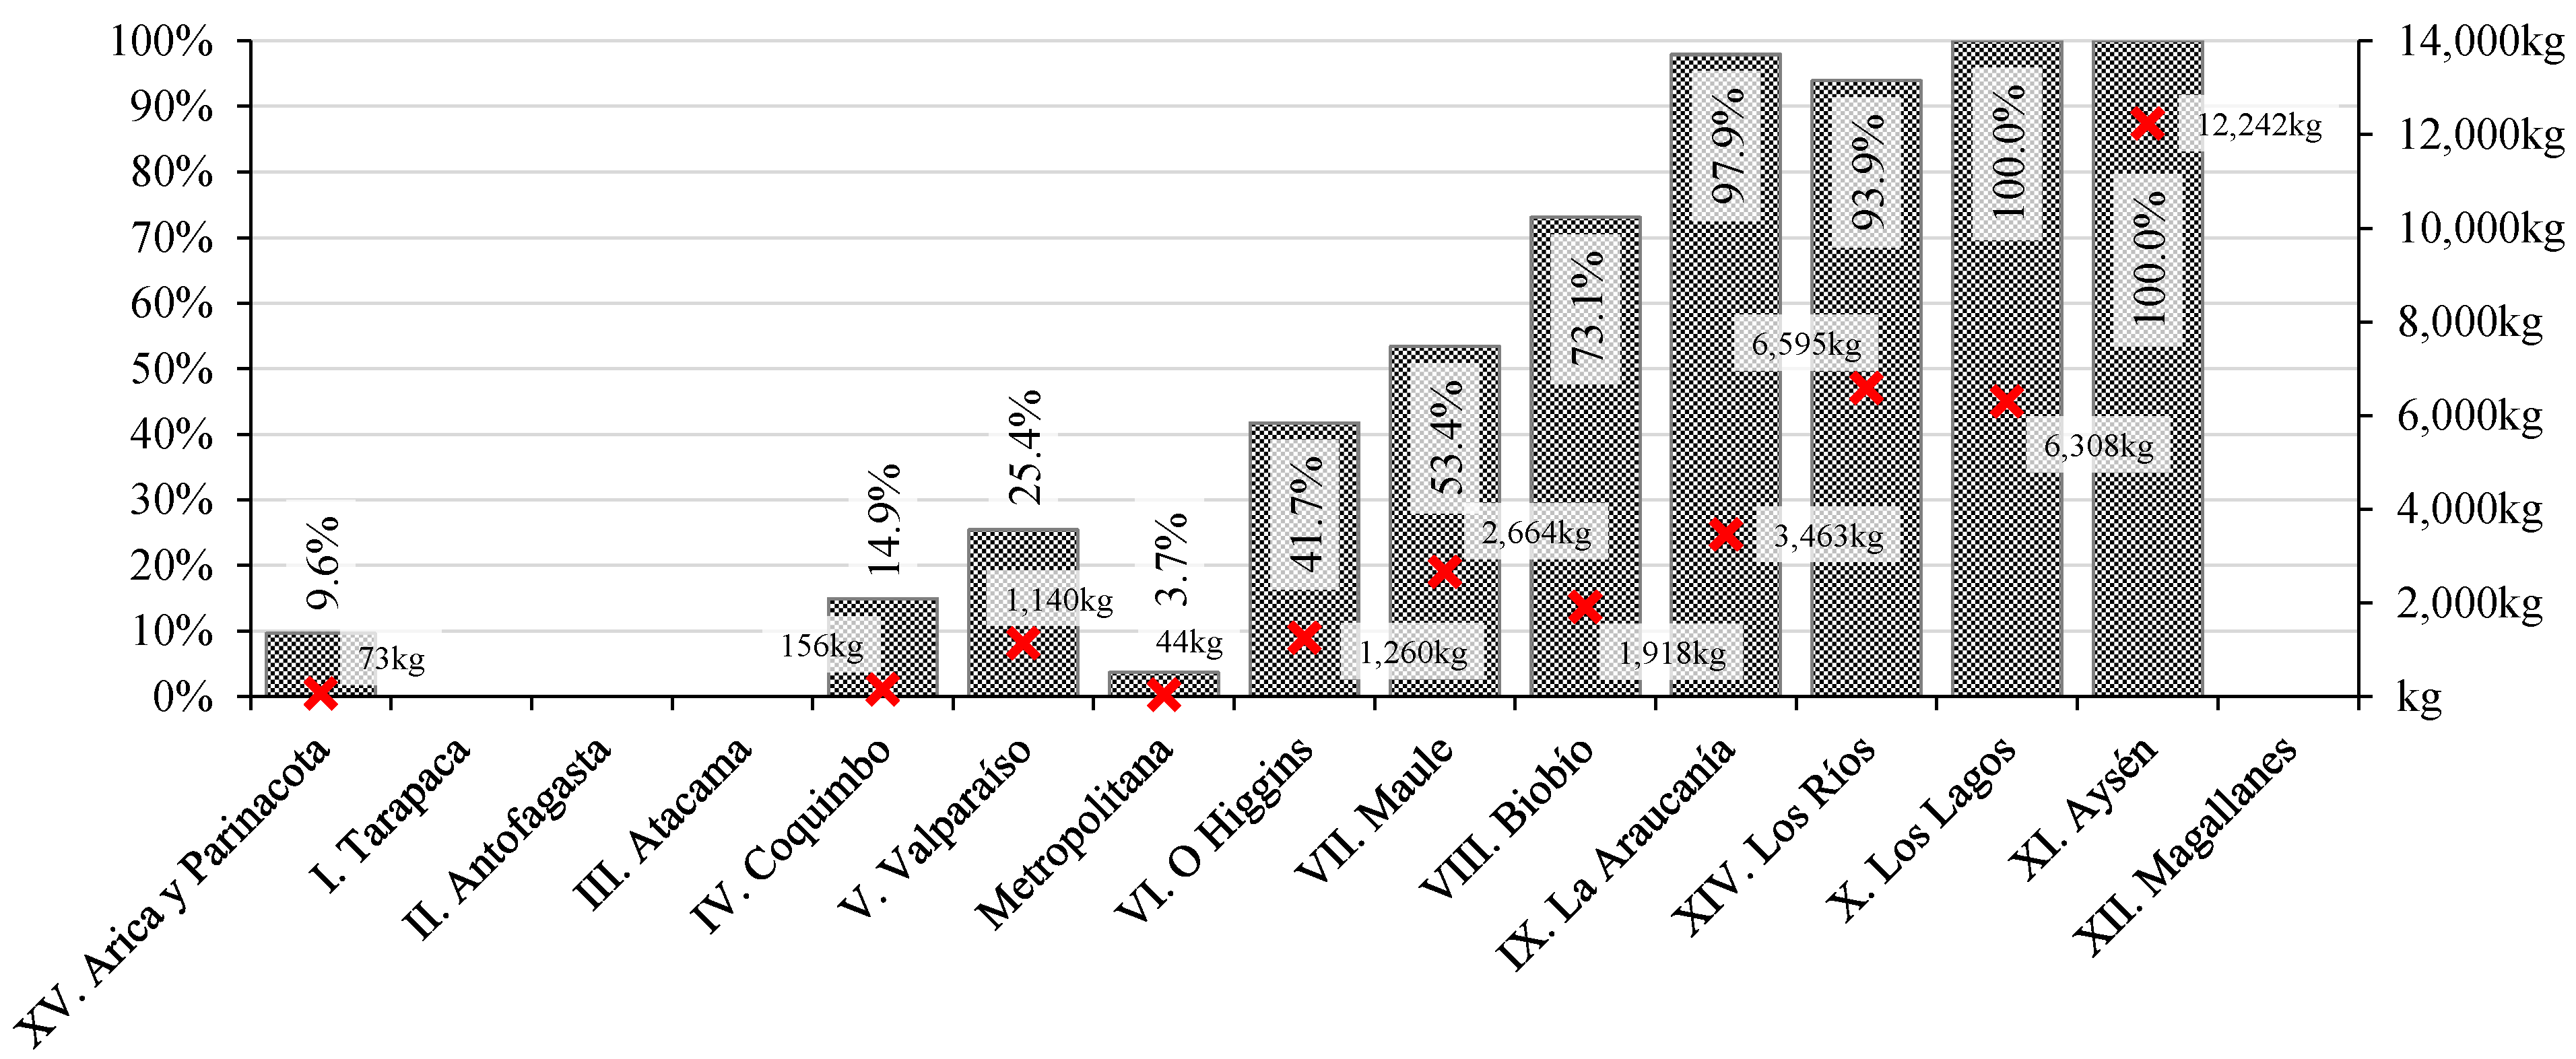
4.2.2. Firewood Consumption

The SFHC group confirmed the strong use of firewood for space heating purposes described by the literature [15]. Although the percentage of people that declares its use was larger in the first quintile, when annual kilograms of firewood consumption was compared among quintiles both groups were well above average (Figure 13).
Figure 13. Use of firewood for space heating (left) and total annual consumption in kilograms (right) by quintile and in the SFHC target population [35].
Sustainability 07 07973 g013
In parallel, when both variables were analyzed by geographic region the data evidenced a strong increase of firewood consumption in central-southern and southern areas of Chile as described by the literature [14,16] (Figure 14). While the null firewood consumption shown in regions I, II and III may be related to both cultural and climatic conditions, in region XII this may be a result of the ubiquitous use of gas for space heating purposes. Similarly, when analyzed by climatic zone the consumption gradually increased in colder areas, while the reduction in percentage of declared consumption found in Zones 3 and 7 may be an effect of the use of alternative fuels and firewood restrictions in highly populated urban areas (Figure 15).
Figure 14. Percentage of dwellings that declare use of firewood for space heating and average annual consumption in kilograms by geographic region [35].
Sustainability 07 07973 g014
Figure 15. Percentage of dwellings that declare use of firewood for space heating and average annual consumption in kilograms by climatic zone [35].
Sustainability 07 07973 g015

4.3. Household Consumption Profiles

Pearson Correlation was used to identify existing relationships between the socio-economic capabilities, needs, and space heating behavior of SFHC households. The most significant correlations were then used to identify statistically significant consumption profiles using two-step cluster analysis methods.

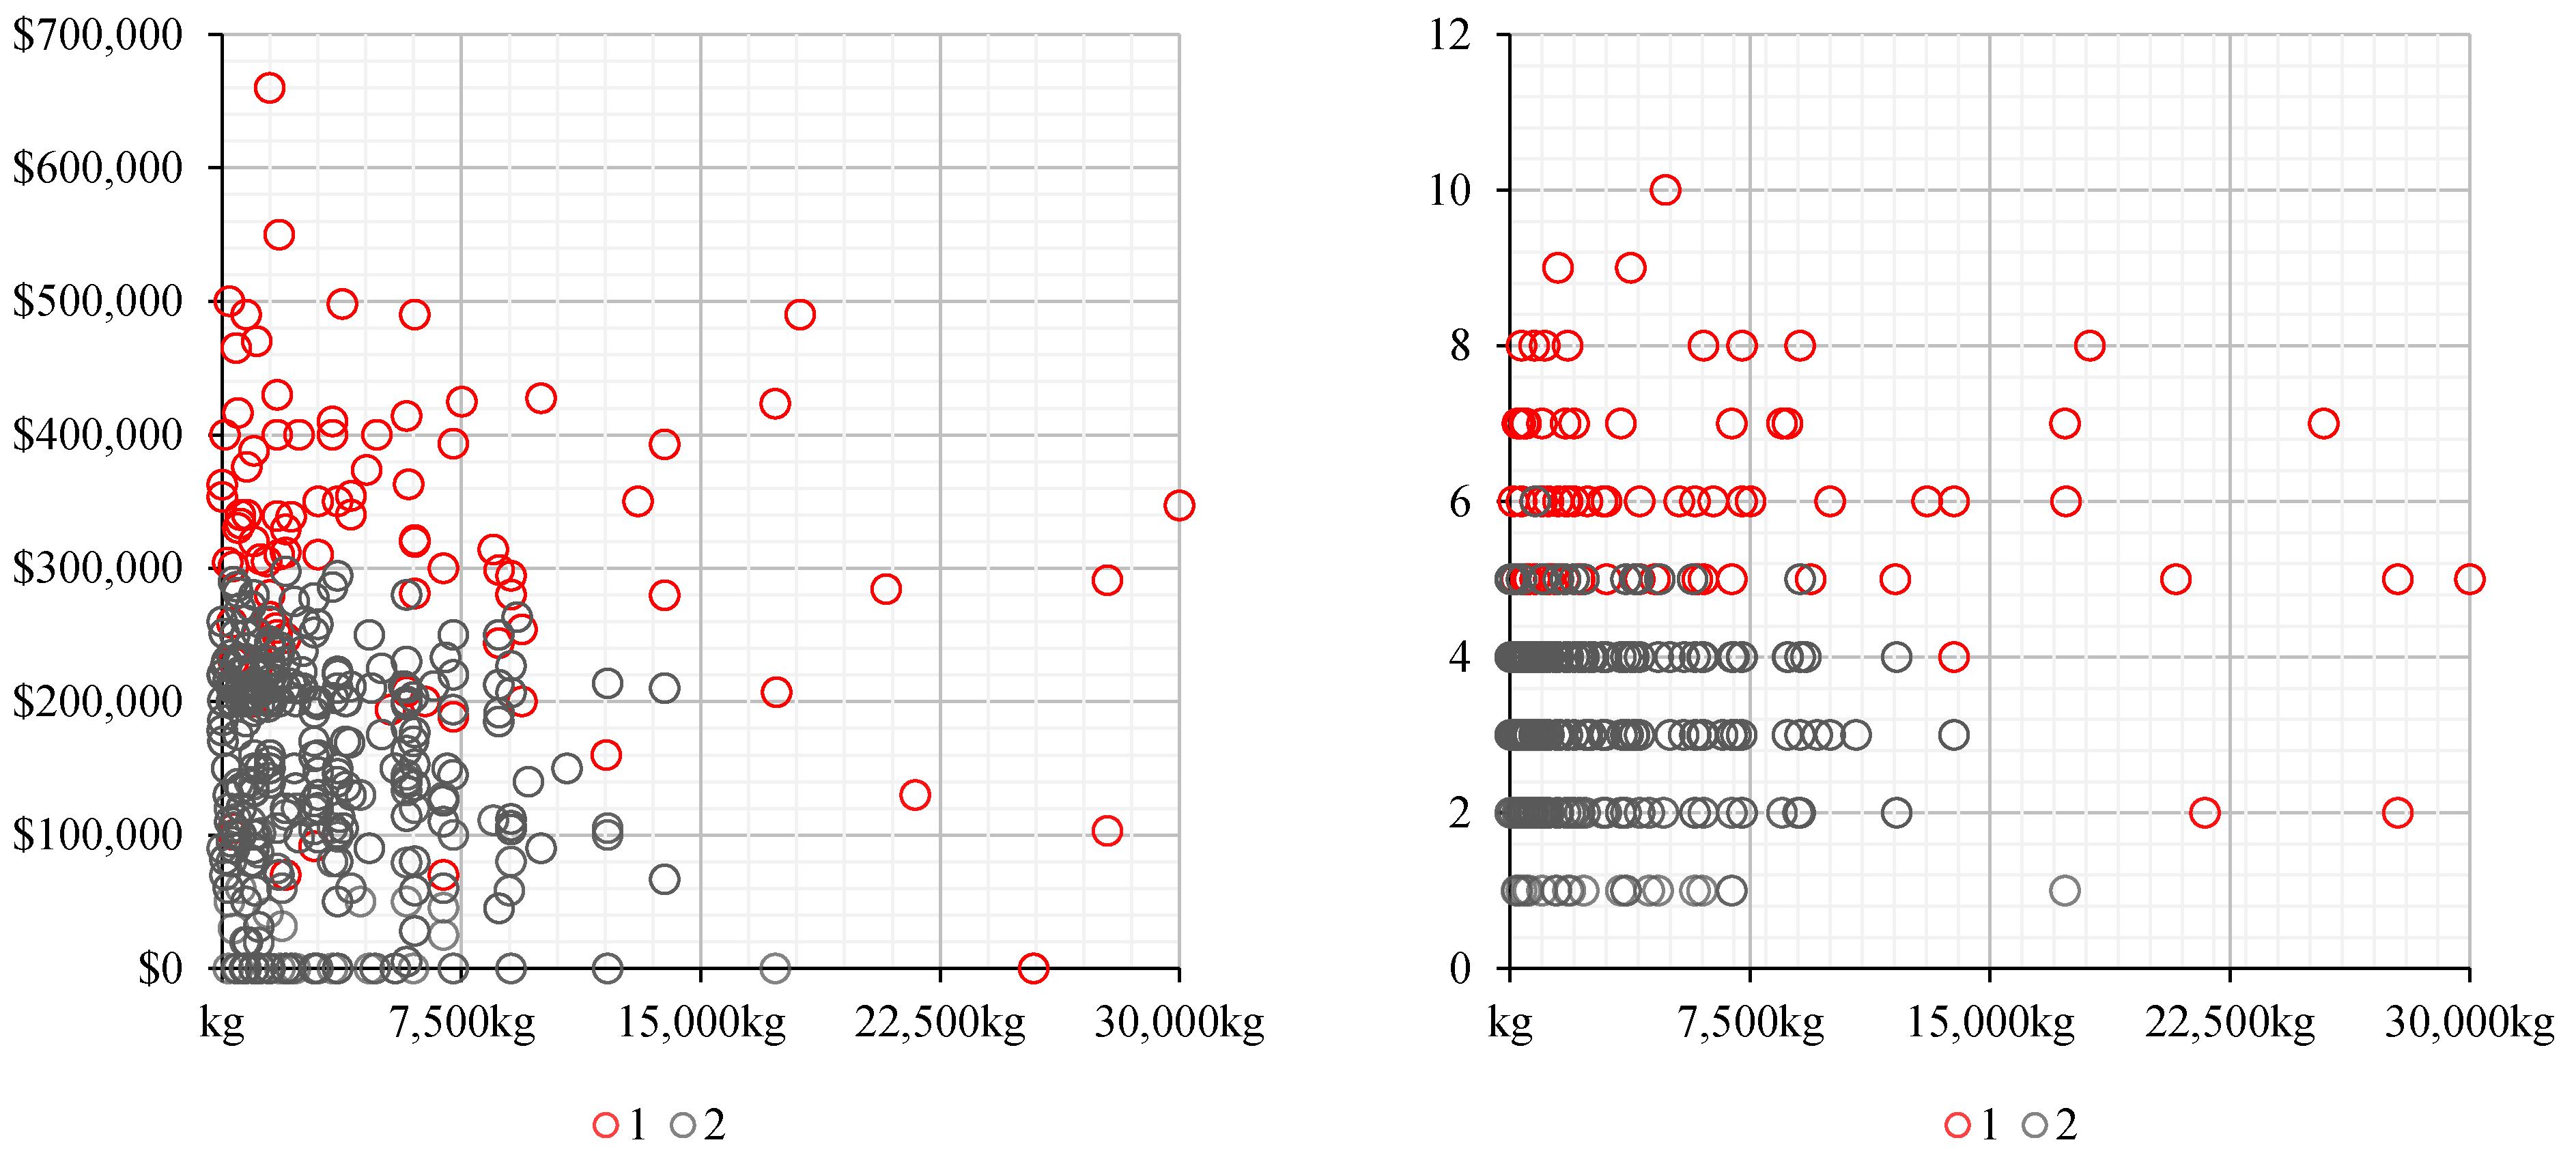
4.3.1. Correlation Analysis

The results of the correlation analysis are shown below (Table 2). The largest quantity of correlations occurred among consumption, climatic zone and characteristics of the dwellings, where strong correlations (r = 0.4 to 0.69) were found between dwelling type and materiality of roofs and walls, and between climatic zone, firewood consumption and wall materiality. These correlations are significant as they confirm that any relationship between climatic conditions and space heating behaviour may also be affected by differences in the material characteristics of the dwellings. Then, weak correlations (r = 0.2 to 0.29) were found between climatic zones and dwelling types but also between roof and wall materials in accordance to the different construction techniques used across the country. Interestingly, a very strong (r = 0.741) positive correlation was found between household size and total autonomous income, suggesting that although the SPF system assumes a larger number of dwellers to be a burden, in the SFHC group this may have positive consequences in terms of household income.
When the relationship between household size and income was adjusted by educational level and occupation using Partial Correlation techniques, the r values were reduced to 0.715 and 0.534 respectively, suggesting that the occupation of the dweller may play a stronger role in this correlation. Both variables maintained the strongest r values when correlated to declared firewood consumption per climatic zone (Table 3). Autonomous income displayed very strong (r = 0.7+) correlations with annual firewood consumption in Zones 1 and 2, and strong (r = 0.4 to 0.69) correlations in Zone 6, while household size showed strong correlations in Zones 1, 2 and 6 and weak correlations in Zone 7. Dwelling type also showed strong and very strong correlations in the same climatic zones, while wall and roof materials displayed only week to moderate correlations.
Table 2. Correlation analysis of selected dwelling characteristics, socio-economic capabilities and household needs [35].
FirewoodMat. RoofMat. WallsDwe. TypeEduc.Occupat.Incomeh. SizeDisabilityh. Mark
0.5230.1430.450−0.2990.0110.026−0.049−0.092−0.028−0.033zone
−0.1220.163−0.0740.0200.0050.0520.0930.0070.038firewood
0.204−0.496−0.005−0.0860.1040.0780.0230.018material roof
−0.452−0.026−0.024−0.006−0.081−0.019−0.012material walls
−0.0090.073−0.076−0.0270.0460.032dwelling type
−0.077−0.026−0.062−0.0480.035education
−0.100−0.014−0.028−0.111occupation
0.7410.1190.147a. income
0.1190.147household size
0.274disability
Interestingly, no significant correlations were found in climatic Zones 4 and 5 although they concentrate a significant percentage of the total firewood consumption nationwide. This may be a result of the ubiquitous use of this resource for space heating purposes in these areas regardless of the socio-economic status of the household and the properties of their dwelling. These results remained consistent when firewood consumption was correlated to household size and autonomous income per geographic region, while stronger correlations in northern and central areas also showed the lowest rates of firewood consumption nationwide (Table 4).
Table 3. Correlations between firewood consumption and selected dwelling and household characteristics by climatic zone [35].
ZONE 1ZONE 2ZONE 3ZONE 4ZONE 5ZONE 6ZONE 7
material roof--0.355-0.092−0.293-
material walls-−0.5470.2140.021−0.247-−0.243
dwelling type-0.702−0.426−0.0380.0000.510−0.116
education−0.0060.081−0.0850.0520.0450.021−0.139
occupation-−0.4970.197−0.048−0.1900.2150.213
autonomous income−0.9620.806−0.1490.0820.0970.4460.061
household size−0.5150.616−0.0760.0150.1840.4910.296
disability-0.336−0.0430.0330.027−0.1420.164
health mark−0.0610.5310.0190.046−0.0050.057−0.015
Table 4. Correlations between of annual firewood consumption, household size and autonomous income per geographic region [35].
XVIIIIIIIVVRMVIVIIVIIIIXXIVXXIXII
household size−0.515---−0.8290.443−0.8320.240−0.020−0.0570.211−0.2880.3050.296-
autonomous income−0.962---−0.7840.720−0.654−0.185−0.019−0.0580.145−0.202−0.0140.061-

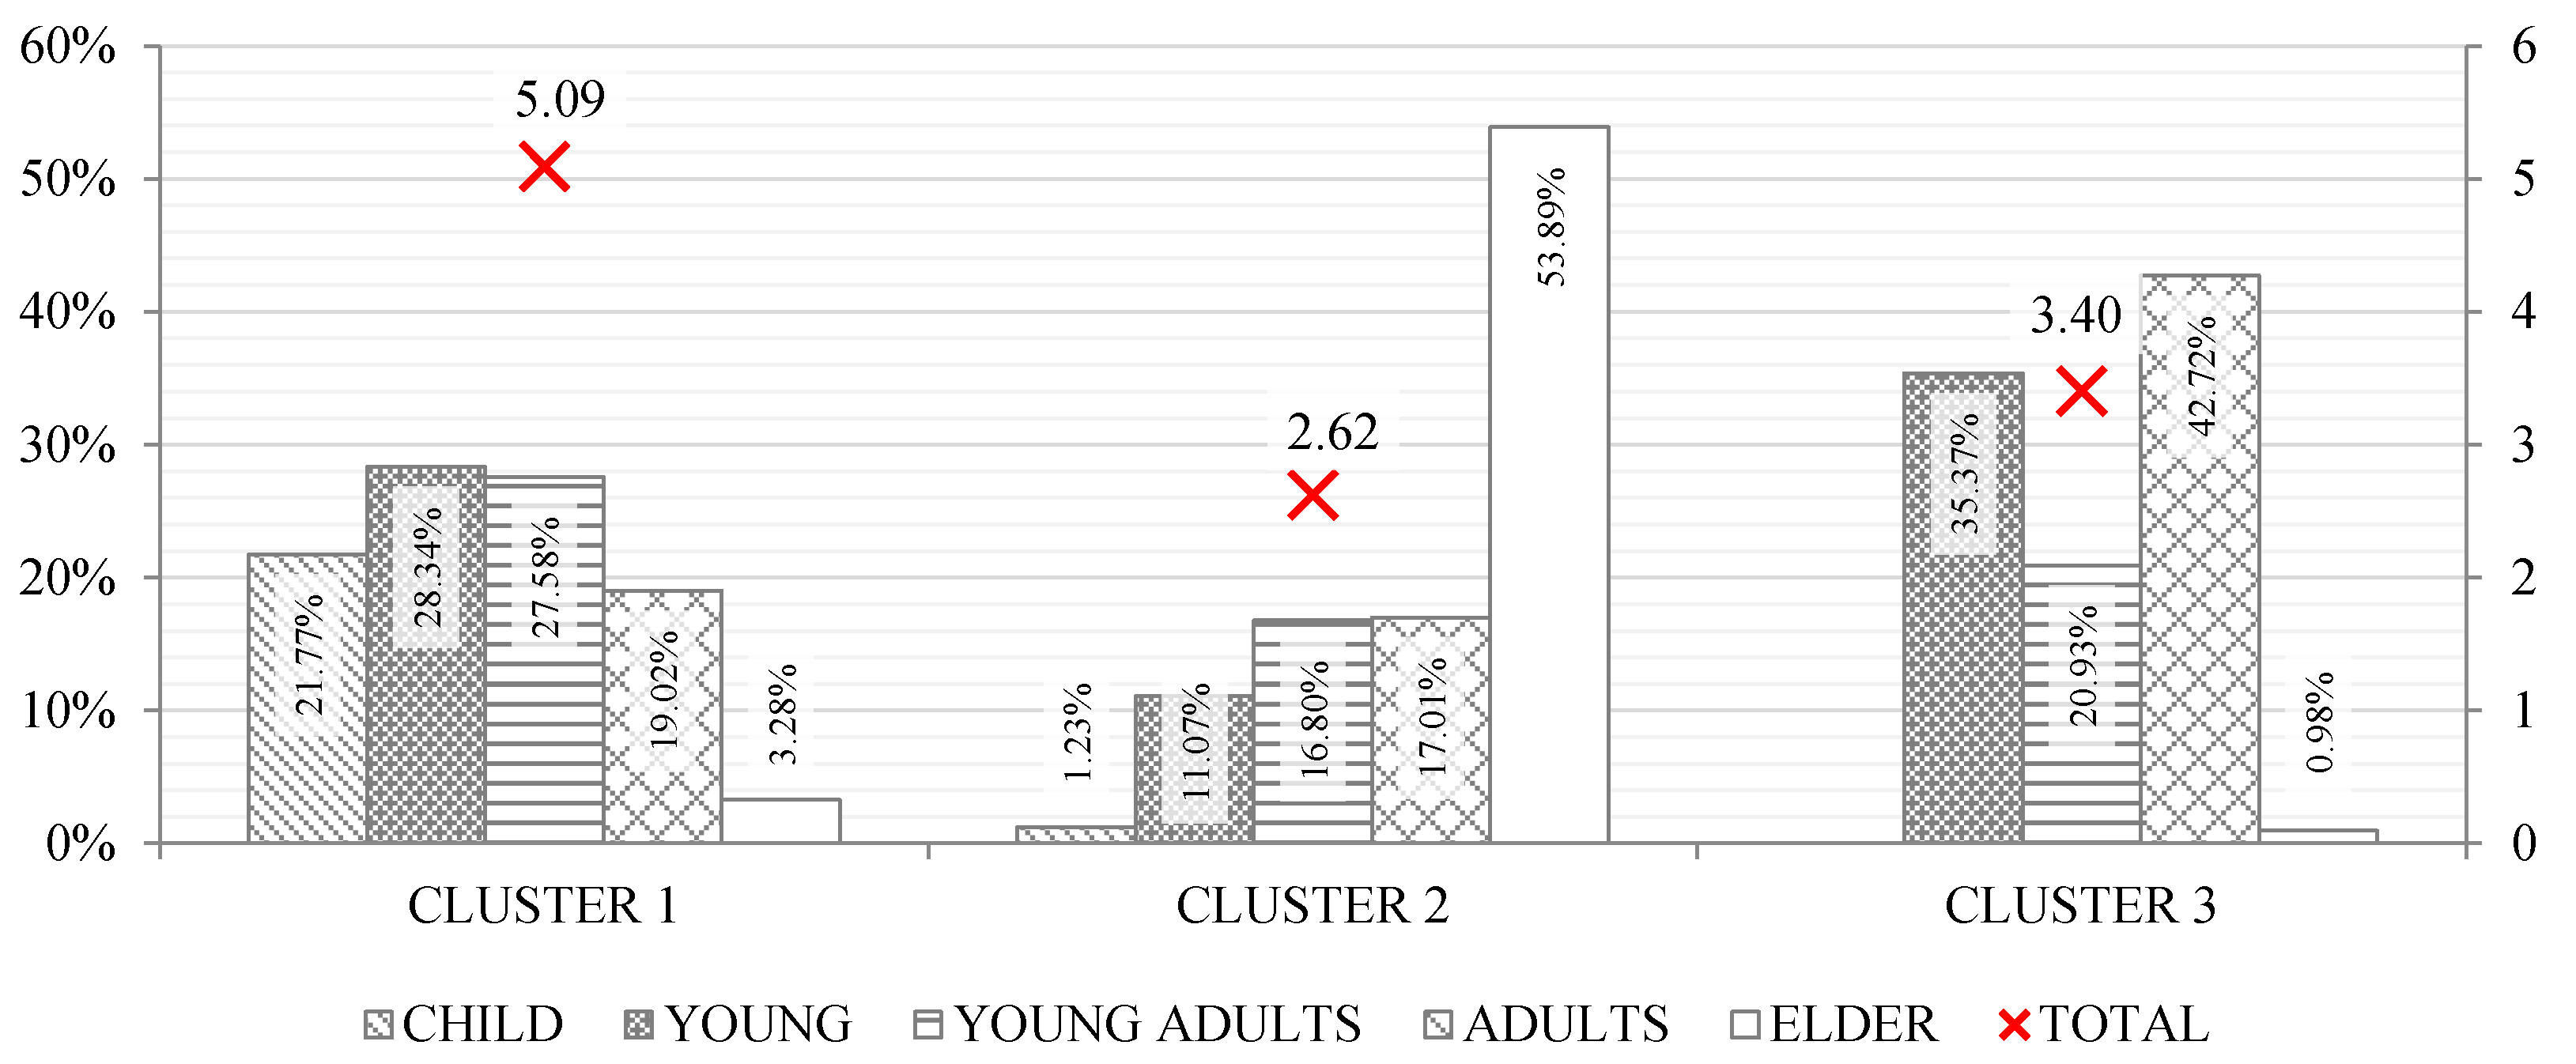
4.3.2. Cluster Analysis

Two-step cluster analysis was used to identify the most defining socio-economic characteristics of the SFHC households in relation to their annual firewood consumption. In terms of number of people per household, two main groups were identified with 3.75 and 7.19 people in average in contrast to three household types identified in the total population (Figure 16).
Figure 16. Two-step cluster analysis of the number of users per dwelling of the SFHC group (left) and of the total population (right) [35].
Sustainability 07 07973 g016
According to clustering of individuals by age segment, these households can fall into three main categories (Figure 17). The first cluster was the largest and closest to existing definitions of extended families with an average of 5.09 members and a relatively even distribution among child, young, young adults, and adults. This strongly contrasts with the second cluster, which had an average of 2.62 members with a tendency towards elder population and almost null presence of child. This may be related to current ageing tendencies in the Chilean population [39] as well as the effects of regulation prioritizing senior citizens as beneficiaries [33]. The third cluster found might be the closest to traditional definitions of nuclear families having an average of 3.40 members (close to the national average), a marked presence of both adults and young, but an almost null presence of child and elders.
Figure 17. Two-step cluster analysis of the main age segments found in the SFHC target population [35].
Sustainability 07 07973 g017
In terms of existing relationships between household size, autonomous income, and firewood consumption, two-step clustering identified two main groups, namely the high consumption and the low consumption household profiles. While low consumption households concentrated both the lowest autonomous income and household sizes, the high consumption households sprawled across the whole range with a higher concentration at the larger household size and income spectrum (Figure 18). The average household size, monthly income, and annual firewood consumption per climatic zone of each household profile are shown below (Table 5). While the average annual use of firewood for space heating in households belonging to the high consumption profile was of 5473 kg with 6.37 users and CL$300,962 of autonomous income, the average annual use in households belonging to the low consumption profile was of 3182 kg with 3.41 users and CL$157,435 of autonomous income.
Figure 18. Results of two-step cluster analysis of autonomous income (left) and number of users (right) by annual firewood consumption (x axis) [35].
Sustainability 07 07973 g018
Table 5. Average firewood consumption per climatic zone of the main household profiles as found in the SFHC group [35].
ZONE 1ZONE 2ZONE 3ZONE 4ZONE 5ZONE 6ZONE 7
HIGH CONSUMPTION HOUSEHOLDincome-$325,000$236,879$346,910$341,120$263,209$292,656
users-8.005.876.416.345.885.69
consumption-1080 kg1502 kg2373 kg4577 kg7384 kg15,926 kg
LOW CONSUMPTION HOUSEHOLDincome$191,333$184,128$183,241$168,343$157,714$120,641$130,541
users3.403.563.563.583.523.093.12
consumption71 kg316 kg1248 kg2277 kg3854 kg3949 kg7448 kg

5. Conclusions

This study used the CASEN 2013 survey dataset to describe the main demographic characteristics of the target users of the SFHC housing program and to identify existing correlations between socio-economic characteristics of different households, their dwellings and space heating behavior. The demographic characteristics were described under four main categories: household size and structure, education and occupation, income and poverty, and disabilities and health issues. Although the SFHC group showed strong similarities to Quintile 1, there were marked differences in terms of household size, overcrowding indexes, presence of internal secondary households and number of nuclei, number of female heads of household, and gender distribution per age segments. Although no significant differences were found in terms of educational level, there were marked contrasts in terms of occupation that may have a direct impact on the energy use of their dwellings. No significant differences were found between the SFHC group and the first quintile in terms of disabilities, poverty, or income, but their access to monetary subsidies and overall health mark were consistently higher suggesting reduced risks to fall into fuel poverty.
This information was analyzed using Pearson correlation and two-step cluster analysis techniques to identify variables that may be used to profile differences in space heating behavior among households. Beyond location-specific variables such as climatic zone, the strongest correlations found suggested that household size and autonomous income may be the best predictors of mean annual firewood consumption. These variables were clustered and two statistically different groups were identified: a high consumption household profile in which a larger number of users and higher autonomous income may result in higher annual firewood consumption, and a low consumption household profile in which a lower income and average number of users may result in lower annual firewood consumption.
The results of this study suggest that it is possible to predict general patterns of operational energy consumption for space heating purposes using discrete socio-economic variables that can be accessible through social housing allocation systems. Although the forecasting capabilities of the identified clusters are not yet conclusive, they provide enough information to foresee general tends among different households before they occupy their dwellings, hence may help to personalize the offering of energy efficiency measures such as, e.g., fact sheets or operation manuals, recommendations for artifacts, furnishings and extensions. Moreover, as these energy consumption profiles can also be assessed before the construction of a dwelling, they may be used in combination to the described demographic characteristics to customize housing solutions and/or to inform decision-making throughout the design process. Although the results of this study focus specifically on firewood consumption under the Chilean social housing policy, similar methods can be applied to explore further environmental variables under similar mass housing policies.

Acknowledgments

The results shown in this paper are part of a Ph.D. currently under development at the Faculty of Architecture, Building and Planning of the University of Melbourne with the financial support of CONICYT, Chile R.E. No. 2033/2012.

Author Contributions

Victor Bunster designed and conducted the research under the supervision of Masa Noguchi. Both authors read and approved the final manuscript.

Conflicts of Interest

The authors declare no conflict of interest.

References

  1. United Nations Environment Programme (UNEP). Global Environment Outlook: Environment for Development; UNEP: Nairobi, Kenya, 2007. [Google Scholar]
  2. International Energy Agency (IEA). Energy Efficiency Indicators: Essentials for Policy Making; IEA: Paris, France, 2014. [Google Scholar]
  3. Zhenjun, M.; Cooper, P.; Daly, D.; Ledo, L. Existing building retrofits: Methodology and state-of-the-art. Energy Build. 2012, 55, 889–902. [Google Scholar]
  4. Pérez-Lombard, L.; Ortiz, J.; González, R.; Maestre, I.R. A review of benchmarking, rating and labelling concepts within the framework of building energy certification schemes. Energy Build. 2009, 41, 272–278. [Google Scholar] [CrossRef]
  5. Abrahamse, W.; Steg, L.; Vlek, C.; Rothengatter, T. The effect of tailored information, goal setting, and tailored feedback on household energy use, energy-related behaviors, and behavioral antecedents. J. Environ. Psychol. 2007, 27, 265–276. [Google Scholar] [CrossRef]
  6. Abrahamse, W.; Steg, L.; Vlek, C.; Rothengatter, T. A review of intervention studies aimed at household energy conservation. J. Environ. Psychol. 2005, 25, 273–291. [Google Scholar] [CrossRef]
  7. Allcott, H. Social norms and energy conservation. J. Public Econ. 2011, 95, 1082–1095. [Google Scholar] [CrossRef]
  8. Ayres, I.; Raseman, S.; Shih, A. Evidence from Two Large Field Experiments that Peer Comparison Feedback can Reduce Residential Energy Usage; NBER Working Paper No. 15386; National Bureau of Economic Research (NBER): Cambridge, MA, USA, 2009. [Google Scholar]
  9. Ministerio de Energía. Balance nacional de energía, 1993–2012. Available online: http://www.cne.cl (accessed on 25 February 2015). (In Spanish)
  10. Castillo, G.; Maldonado, P. Situación de la energía en Chile: Desafíos para la sustentabilidad; Programa Chile Sustentable; LOM Ediciones: Santiago, Chile, 2004. [Google Scholar]
  11. Ministerio de Energía. Agenda de energía: Un desafío país, progreso para todos; Ministerio de Energía: Santiago, Chile, 2014. (In Spanish) [Google Scholar]
  12. Corporación de Desarrollo Tecnológico de la Cámara Chilena de la Construcción (CDT-CCHC). Estudio de usos finales y curva de oferta de la conservación de la energía en el sector residencial: Informe final; CDT: Santiago, Chile, 2010. (In Spanish) [Google Scholar]
  13. Gómez-Lobo, A. El consumo de leña en el sur de Chile: ¿Por qué nos debe preocupar y qué se puede hacer? Rev. Ambient. Desarro. 2005, 21, 43–47. (In Spanish) [Google Scholar]
  14. Ministerio de Vivienda y Urbanismo (MINVU). Encuesta Panel de Vivienda 2010: Resultados parciales. Available online: http://www.minvu.cl/ (accessed on 25 February 2015). (In Spanish)
  15. Gómez-Lobo, A.; Lima, J.A.; Hill, C.; Meneses, M. Diagnóstico del mercado de la leña en Chile: Informe final; Centro de Micro Datos, Departamento de Economía, Universidad de Chile: Santiago, Chile, 2006. (In Spanish) [Google Scholar]
  16. Bustamante, W.; Cepeda, R.; Martínez, P.; Santa María, H. Eficiencia energética en vivienda social: Un desafío posible; CIP-PUC: Santiago, Chile, 2009. (In Spanish) [Google Scholar]
  17. Celis, F.; Garcia, R.; Trebilcock, M.; Escorcia, O.; Miotto, U.; Díaz, M. Energy analysis of housing in the central-south of Chile. Arquitecturarevista 2012, 8, 62–75. [Google Scholar]
  18. Ministerio de Vivienda y Urbanismo (MINVU). Ordenanza general de urbanismo y construcciones; Diario Oficial de la República de Chile: Santiago, Chile, 2014. (In Spanish) [Google Scholar]
  19. Bustamante, W.; Rozas, Y.; Cepeda, R.; Encinas, F.; Martínez, P.; Ubilla, M.; Sierra, A. Guía de diseño para la eficiencia energética en la vivienda social; Pontifica Universidad Católica de Chile: Santiago, Chile, 2009. (In Spanish) [Google Scholar]
  20. Ministerio de Vivienda y Urbanismo (MINVU). D.S. No. 255—Reglamenta programa de protección del patrimonio familiar; Diario Oficial de la República de Chile: Santiago, Chile, 2006. (In Spanish) [Google Scholar]
  21. Escorcia, O.; García, R.; Trebilcock, M.; Celis, F.; Bruscato, U. Envelope improvements for energy efficiency of homes in the south-central Chile. Inf. Constr. 2012, 64, 563–574. (In Spanish) [Google Scholar] [CrossRef]
  22. García, R.; González, A. Form conditions and energy performance of single-family housing in central south Chile. Rev. INVI 2014, 80, 111–141. [Google Scholar]
  23. Celis, F.; Diaz, M.; Echeverria, E.; García, R.; Escorcia, O.; Trebilcock, K. Incidence of architectural configuration on energy efficiency of dwellings in the centre-south of Chile. In Proceedings of the PLEA 2012—28th Conference, Lima, Perú, 7–9 November 2012.
  24. Encinas, F.; de Herde, A. Definition of occupant behaviour patterns with respect to ventilation for apartments from the real estate market in Santiago de Chile. Sustain. Cities Soc. 2011, 1, 38–44. [Google Scholar] [CrossRef]
  25. Frederiks, E.R.; Stenner, K.; Hobman, E.V. The socio-demographic and psychological predictors of residential energy consumption: A comprehensive review. Energies 2015, 8, 573–609. [Google Scholar] [CrossRef]
  26. Abrahamse, W.; Steg, L. Factors related to household energy use and intention to reduce it: The role of psychological and socio-demographic variables. Hum. Ecol. Rev. 2011, 18, 30–40. [Google Scholar]
  27. Guerra Santin, O. Behavioural patterns and user profiles related to energy consumption for heating. Energy Build. 2011, 43, 2662–2672. [Google Scholar] [CrossRef]
  28. Ministerio de Vivienda y Urbanismo (MINVU). D.S. No. 49—Aprueba reglamento del programa Fondo Solidario de Elección de Vivienda; Diario Oficial de la República de Chile: Santiago, Chile, 2011. (In Spanish) [Google Scholar]
  29. Ministerio de Vivienda y Urbanismo (MINVU). R.E. No. 9020—Deroga Resolución Exenta No. 3577 y aprueba itemizado técnico de construcción para proyectos del programa Fondo Solidario de Elección de Vivienda; Diario Oficial de la República de Chile: Santiago, Chile, 2012. (In Spanish) [Google Scholar]
  30. Ministerio de Vivienda y Urbanismo (MINVU). R.E. No. 9013—Modifica Resolución Exenta No. 3563 que aprueba cuadro normativo y tabla de espacios y usos mínimos para el mobiliario, para proyectos del programa Fondo Solidario de Elección de Vivienda; Diario Oficial de la República de Chile: Santiago, Chile, 2012. (In Spanish) [Google Scholar]
  31. Ministerio de Desarrollo Social. D. No. 291—Reglamenta el diseño, uso y aplicación de la Ficha de Protección Social; Diario Oficial de la República de Chile: Santiago, Chile, 2007. (In Spanish) [Google Scholar]
  32. Ministerio de Desarrollo Social. R.E. No. 3509—Determina metodología para definir puntaje de corte de carencia habitacional para calificar al Programa Fondo Solidario de Elección de Vivienda, regulado por el D.S No. 49; Diario Oficial de la República de Chile: Santiago, Chile, 2012. (In Spanish) [Google Scholar]
  33. Candia, A.; Castro, R; Codina, G.; Delgado, R; Herrera, R.; Guzmán, J.; Irarrázaval, I.; Larrañaga, O.; Ormazábal, C.; Saracostti, M.; et al. Informe final: Comité de expertos Ficha de Protección Social; Comité Protección Social. 2010. Available online: http://www.ministeriodesarrollosocial.gob.cl (accessed on 25 February 2015). (In Spanish)
  34. Herrera, R.; Larrañaga, O.; Telias, A.; La Ficha de Protección Social. La Ficha de Protección Social. Documento de Trabajo. Santiago, Chile, 2010. Available online: http://www.cl.undp.org/ (accessed on 25 February 2015). (In Spanish).
  35. Ministerio de Desarrollo Social. CASEN 2013 Survey dataset. 2013. Available online: http://www.ministeriodesarrollosocial.gob.cl/ (accessed on 25 February 2015).
  36. Ministerio de Desarrollo Social. Libro de códigos base de datos Encuesta de Caracterización Socioeconómica Nacional CASEN 2013. Available online: http://www.ministeriodesarrollosocial.gob.cl/ (accessed on 25 February 2015). (In Spanish)
  37. Ministerio de Vivienda y Urbanismo (MINVU). Planos de zonificación térmica. Manual de aplicación Reglamentación Térmica; MINVU-IC: Santiago, Chile, 2006. (In Spanish) [Google Scholar]
  38. Bacher, J.; Wenzig, K.; Vogler, M. SPSS TwoStep cluster: A first evaluation. Lehrstuhl Soziol. 2004, 2, 578–588. [Google Scholar]
  39. Instituto Nacional de Estadísticas (INE). Censo 2002: Síntesis de resultados. Comisión nacional del VII censo de población y vivienda. 2002. Available online: http//:www.ine.cl/ (accessed on 25 February 2015). (In Spanish)
  40. George, M.; Graham, C.; Lennard, L. The energy penalty: Disabled people and fuel poverty. Available online: http://www.le.ac.uk/ (accessed on 9 June 2015).

