Article

Performance Based Evaluation of Concrete Strength under Various Curing Conditions to Investigate Climate Change Effects

1
School of Civil and Environmental Engineering, Yonsei University, Concrete Structural Engineering Laboratory, Seodaemun-gu, Seoul 120-794, Korea
2
Department of Architectural Engineering, Catholic Kwandong University, Gangneung 210-701, Korea
*
Author to whom correspondence should be addressed.
Sustainability 2015, 7(8), 10052-10077; https://doi.org/10.3390/su70810052
Submission received: 29 April 2015 / Revised: 14 July 2015 / Accepted: 21 July 2015 / Published: 24 July 2015

Abstract

:
Recently, the manifestation of global warming-induced climate change has been observed through super typhoons, heavy snowfalls, torrential rains, and extended heat waves. These climate changes have been occurring all over the world and natural disasters have caused severe damage and deterioration of concrete structures and infrastructure. In an effort to deal with these problems due to extreme and abnormal climate changes, studies have been conducted to develop construction technologies and design guidelines. Nevertheless, study results applicable to construction sites continue to be ineffective and insufficient. Therefore, this study proposes ways to cope with climate change by considering the effect of concrete curing condition variations on concrete material performance. More specifically, the 3-, 7- and 28-day compressive and split tensile strength properties of concrete mix cured under various climatic factors including temperature, relative humidity, wind speed, and sunlight exposure time were evaluated to determine whether the concrete meets the current design requirements. Thereafter, a performance based evaluation (PBE) was performed using satisfaction probabilities based on the test values to understand the problems associated with the current mix proportion design practice and to identify countermeasures to deal with climate change-induced curing conditions.

1. Introduction

Global warming has recently emerged as the biggest challenge for people around the world. The release of greenhouse gases containing carbon dioxide (CO2), nitrous oxide (N2O), PFCs, and methane (CH4) from excessive fossil fuel usage and natural resource depletion (i.e., jungle forest destruction) have accelerated global warming. Despite the seriousness of global warming problems, they remain unresolved and continue to heighten. Climate change drastically alters ecosystems, water resources, food resources, and industries. Recently, instances of torrential rains and super typhoons in coastal areas and lowlands have dramatically increased, eventually causing landslides and erosion that greatly impact structures in urban areas [1]. Also, the effect of climate change can be witnessed through torrential rains, cold waves, heavy snows, and super typhoons. These types of extreme changes of the climate bring forth extended delays in construction schedules and serious financial losses. In particular, concrete curing at construction sites is most affected by climate conditions including temperature, relative humidity, rainfall, wind direction and velocity, and sunlight exposure time, resulting in degradation of the concrete quality.
This study aims to evaluate the effects of temperature, relative humidity, wind velocity, and sunlight exposure time on the concrete material strength to identify countermeasures to deal with curing condition variations due to climate change. In order to obtain necessary data for the analysis, 3-, 7-, and 28-day compressive and split tensile strength tests were performed on the concrete mix proportion most commonly used by ready-mix concrete companies in Korea. The 100 mm × 200 mm concrete cylinder specimens were cured under various curing conditions including temperature, relative humidity, wind speed, and sunlight exposure time until the testing was performed. Using the test results, a performance based evaluation (PBE) procedure using a satisfaction curve is proposed. PBE is a statistical method of analyzing the satisfaction of a required performance in unpredictable conditions such as climate change and earthquakes, making it possible to evaluate the level of satisfaction of the required performance according to experimental and empirical outcomes. PBE has been utilized by many researchers from various viewpoints [2,3,4,5,6]. Given the unproven construction criteria used for the current unfamiliar climate change conditions in construction sites, PBE allows us to identify required countermeasures to cope with unfamiliar conditions. A performance based approach for determining design criteria or specifications was recently emphasized in a European Committee International du Beton (CIB) report, in which the performance focused approach holds the outcome to be more important than the process or the method used in the design [7].
In general, the design methods considered in the design criteria or concrete specifications such as the Working Stress Design, Ultimate Strength Design, and Limit States Design tend to concentrate on only a single evaluation method to satisfy several requirements. Such design criteria and specifications are not helpful for designers to find a solution for a design satisfying particular performance or conditions. Thus, a more flexible and practical design approach that will be able to yield more innovative solutions is necessary. PBE was introduced to deal with such problems [3]. PBE is a performance based evaluation method that generates the satisfaction percentage of a required material performance as a value between 0% and 100%. PBE not only suggests a variety of solutions, but also maximizes the cost efficiency and functionality due to the concept of satisfying performance criteria selected by the user. Moreover, as it puts the client’s needs first throughout the evaluation process, both the client and user needs can be fully incorporated into the evaluation and design process. In addition, since PBE is intended to reflect the requirement satisfactions of the material and structure over the course of their lifespan, structural design, construction, and maintenance aspects can be considered, focusing on the importance and performance requirements during the service life of the target material or structure.

2. Performance Based Evaluation (PBE) Theory

The PBE utilized in this study is a method using a satisfaction curve, which is similar to the Fragility curve method used for seismic performance evaluation [8,9,10,11]. The Bayesian probability theory implemented in the Fragility curve method helps to identify the probable connection between events. As the Bayesian theory is used to predict the future result based on past data, sufficient data collection of evaluation variables would result in greater accuracy. The Bayesian theory was applied to structural performance analysis by Shinozuka where Singhal and Shinozuka applied the Bayesian statistical method to evaluate the fragility of the structure based on the Fragility curve concept. Thus, the Fragility method is a seismic performance evaluation method which was developed based on the Bayesian theory [12,13,14,15,16,17,18]. The Fragility theory developed by Shinozuka and Singhal is used to evaluate the fragility of a bridge or structure using the Fragility curve and it generates the conditional probability in a normal distribution function curve to indicate the excess characteristics of marginal goals such as structure collapse against a particular earthquake magnitude. The mean value and log standard deviation are estimated by the maximum likelihood equation shown in Equation (1).
L = i = 1 N [ F ( a i ) ] x i [ 1 F ( a i ) ] 1 x i
here, F(.) refers to the Fragility curve at a certain damage step, ai refers to the peak ground acceleration (PGA) of the bridge i, xi is determined to be 0 or 1 depending on whether or not the bridge damage is caused by the peak ground acceleration (PGA) value of ai, and N is determined by the total number of bridges investigated after the earthquake. Under the assumption of a valid log normal distribution, F(a) is determined by Equation (2)
F ( a ) = Φ [ ln ( a c ) ζ ]
where a refers to PGA and Φ[.] refers to a standardized normal distribution function. c and ζ in Equation (2) are the values calculated to maximize InL expressed in Equation (3).
d ln L d c = d ln L d ζ = 0
This study aims to identify the changes of concrete material properties as a result of climate change using the PBE method. Therefore, satisfaction curves have to be developed incorporating the climate change effects including temperature, relative humidity, wind speed, and sunlight exposure time as the curing conditions. Figure 1 shows the concrete performance at various levels that must be considered to evaluate the material performance satisfaction of the required performance. However, in this study, a level of the material performance depending on the curing conditions was considered. In PBE, a sufficient amount of data is needed to obtain reliable results. However, generally, the available number of data is insufficient, so that random data generation is performed using the limited number of available data. After the data collection, each data value is checked to determine whether it satisfies a required criterion and is given either a result value of 0 (not satisfying) or 1 (satisfying). Then, using the data value, result value, and criteria value, a satisfaction curve is constructed using the Bayesian probability equation. Since the satisfaction curve can vary according to the required criterion selected by its user, PBE is considered as a PBE method [17,18].
Figure 1. Parameter levels of concrete mixture properties.
Sustainability 07 10052 g001

3. Test Conditions and Method

3.1. Performance Evaluation Method Condition

The data used in the material performance evaluation must be compatible for the design target. Figure 1 shows the level-to-level concrete variables. The first level represents the material components comprised of water-to-cement ratio (w/c), water volume (w), air content, cement volume (c), and various mixing conditions which may affect the concrete performance. The second level includes climatic factors which may exert significant influence on the concrete curing including temperature, relative humidity, wind speed, and sunlight exposure time. The third level is the material performance level comprised of compressive strength, tensile strength, slump, dry shrinkage, and creep. The fourth level includes the comprehensive performance of safety, usability, and environmental effect. Finally, the fifth and last level comprises the service life and cost.

3.2. Temperature—Relative Humidity Condition

The temperature and relative humidity were selected among the various climatic curing factors which may significantly influence the concrete performance [19,20]. Cylindrical concrete specimens were cured at various combinations of temperature and relative humidity until the testing was conducted. According to current concrete specifications, concrete subjected to a high temperature curing condition results in slump loss, entrained air reduction, cold joint creation, and surface crack formation due to the fast evaporation of surface moisture, decrease of the long-term strength, and reduction of the surface density. Conversely, if the temperature is too low, early frost damage could occur. If concrete undergoes freezing or a repeated freeze-thaw cycle during the hydration process, early frost damage can also occur. Once early frost damage occurs in concrete, concrete cannot recover its strength, durability, and water tightness even under appropriate curing conditions. Once the target design strength cannot be achieved within a required curing time due to delays in the setting and hardening reaction, the concrete is unsuitable for construction. Thus, structures built using unqualified concrete are vulnerable to cracks or residual deformations under service loads. Similar to the temperature varying curing condition, relative humidity also has a direct effect on the concrete curing and hydration process. Therefore, in this study, temperature and relative humidity variations in Seoul, Korea were used as curing conditions for normal strength concrete (NSC) mixed using ordinary Portland cement to study the relationship between the temperature-relative humidity curing conditions to the concrete strength. Table 1 and Table 2 show the monthly mean temperature and relative humidity of the Seoul metropolitan area over the past 10 years, respectively, provided by the Korea Meteorological Administration. The most appropriate time of the year for concrete curing appears to be between April and October. The concrete hydration process begins upon pouring and continues until a sufficient strength is achieved. During this time, temperature and relative humidity are the most critical environmental concrete curing conditions where deviations may lead to changes of the hydration pattern that may eventually have an influence on the concrete strength and material properties. Using the temperature and relative humidity data, the temperature and relative humidity curing variations selected for the study were 8, 12, 35, 40, and 45 °C and 40%, 65%, and 95%, respectively. Various combinations of these values were applied as the specimen curing conditions, as shown in Table 3.
Table 1. Monthly mean temperature at Seoul, Korea (Korea Meteorological Administration).
2011201020092008200720062005200420032002Avg.
Jan.−7.2−4.5−2−1.70.4−0.2−2.5−1.5−2.50.3−2.14
Feb.1.21.42.9−1.240.1−1.92.32.72.91.44
Mar.3.64.367.36.15.24.16.36.57.65.7
Apr.10.79.812.714.111.411.613.213.113.213.612.34
May.17.917.219.117.718.118.417.717.619.618.218.15
Jun.2223.422.421.523.221.822.723.221.522.222.39
Jul.24.625.824.325.124.223.125.324.823.825.224.62
Aug.25.826.525.725.326.52725.126.124.124.225.63
Sep.21.821.821.82221.521.121.821.720.921.621.6
Oct.14.214.51616.115.117.914.715.213.912.815.04
Nov.10.76.56.87.66.70.48.69.19.546.99
Dec.−0.9−1.3−11.11.81.4-3.91.90.71.70.15
Table 2. Monthly mean relative humidity at Seoul, Korea (Korea Meteorological Administration).
2011201020092008200720062005200420032002Avg.
Jan.5465505056575259606356.6
Feb.5559574653534956625554.5
Mar.5159525660515449585554.5
Apr.5454545053555351605353.7
May.5662595862575568576259.6
Jun.6762666561686964696165.2
Jul.7973767875827682757477
Aug.7478696975697570777973.5
Sep.5872646474587169726766.9
Oct.5561626263626554616060.5
Nov.6055645855585566665559.2
Dec.5056605660595156595956.6
Table 3. Temperature and relative humidity curing condition combinations.
CASETemperature (°C)Relative Humidity (%)
1840
2865
3895
41240
51265
61295
73540
83565
93595
104040
114065
124095
134540
144565
154595

3.3. Wind Speed–Sunlight Exposure Time

In addition to the temperature and relative humidity, the wind speed and sunlight exposure time were chosen as climate change effect variables for the concrete curing conditions. Table 4 and Table 5 show the monthly mean wind speed and sunlight exposure time in the Seoul metropolitan area over the past 10 years, respectively, provided by the Korea Meteorological Administration. The mean monthly wind speed was approximately 2–3 m/s and the mean monthly sunlight exposure time did not significantly change, except in July and August due to monsoon typhoon or rain effects. Using the wind speed and sunlight exposure time data, the wind speed and sunlight exposure time curing variations selected for the study were 0, 2, 4, and 6 m/s and 2, 4, 6, and 7 h, respectively. Various combinations of these values were used for the specimen curing conditions, as shown in Table 6.
Table 4. Monthly mean wind speed at Seoul, Korea (0.1 m/s) (Korea Meteorological Administration).
YearJan.Feb.Mar.Apr.May.Jun.Jul.Aug.Sep.Oct.Nov.Dec.Avg.
201225293534272827302323272727.92
201128263432282924252421272627.00
201023242929262125242322283025.33
200925253126252523221821252524.25
200823272627272724251920222524.33
200720232728262324262521222424.08
200621262930252223212120242123.58
200524282930242422262317222524.50
200421292727262123242220202223.50
200325222325182018141120202420.00
200223202123232021201620242221.08
Avg.23.4525.3628.2728.2725.0023.6423.0923.3620.4520.4523.7324.6424.14
Table 5. Monthly mean sunlight exposure time at Seoul, Korea (Korea Meteorological Administration).
YearJan.Feb.Mar.Apr.May.Jun.Jul.Aug.Sep.Oct.Nov.Dec.Avg.
20126.157.766.197.088.117.734.655.126.367.596.046.256.58
20117.055.957.756.745.825.692.593.036.016.954.326.315.68
20105.425.044.295.545.766.772.903.114.886.286.015.095.09
20096.794.496.546.827.756.033.744.876.727.624.344.715.87
20085.377.736.046.946.905.792.546.346.155.975.665.065.87
20075.876.134.756.396.365.842.953.412.845.516.284.545.07
20065.206.166.514.536.425.191.115.716.525.975.125.145.30
20056.186.357.166.657.594.612.563.333.796.455.756.585.58
20045.696.427.157.015.385.052.754.775.618.155.226.235.79
20032.983.393.364.195.513.392.792.683.356.313.805.813.96
20023.243.714.155.755.655.432.711.693.984.733.152.613.90
Avg.5.455.745.816.156.485.592.844.015.116.505.065.305.34
Table 6. Wind speed and sunlight exposure time curing condition combinations.
CaseWind Speed (m/s)Sunlight Exposure Time (h)CaseWind Speed (m/s)Sunlight Exposure Time (h)
102942
2041044
3061146
4081248
5221362
6241464
7261566
8281668

3.4. Mixing Conditions and Test Method

The concrete mix proportion design used in this study is shown in Table 7, which is the most commonly used NSC mix proportion by the ready mix concrete industry in Korea. The maximum aggregate size was 25 mm and the water-to-cement ratio (w/c) was 55%, 120 ± 2 mm slumps and 28-day design strength of 27 MPa were selected as the target criteria. Then, 100 mm × 200 mm cylinders were cast and cured under the various curing conditions shown in Table 3 and Table 6. Upon casting of the concrete, the specimens were cured under a given curing condition. Then, compressive and splitting tensile strength tests were conducted on three specimens cured under each curing condition at time intervals of three, seven, and 28 days from casting. Korean Standard for Testing protocols, KS F 2405 [21] and KS F 2423 [22], were used for the compressive and splitting tensile strength tests, respectively, using a universal testing machine (UTM) with a maximum load capacity of 100 tons. The test results of all specimen types are average values of three tested specimens. Upon casting of the concrete, the specimen was cured in a thermostatic bath at a given temperature and relative humidity. With respect to the wind speed and sunlight exposure time curing conditions, the concrete specimens were cured using an industrial electric fan and a lamp, respectively. In order to apply a consistent wind speed curing condition, the fans were installed in all four directions within an enclosed room setting. A wind gauge was used to measure the wind speed. The sunlight exposure time curing condition was implemented in a closed darkroom using three-wavelength lamps. Three-wavelength light lamps increased the surrounding temperature by approximately 1–2 °C. A timer was set at 2, 4, 6, and 8 h to provide an exact exposure time. For comparison, control specimens were cured under dry and wet conditions as well as a standard 20 °C curing temperature with a 95% relative humidity for 28 days and tested.
Table 7. NSC mix proportion design.
Coarse Aggregate size (mm)Slump (mm)w/c (%)S/a (%)Unit (kg/m3)fck
wcsgMPa
2512055.042.0183333677101427
w: water, c: cement; s: fine aggregate; g: coarse aggregate.

4. Test Results

The results of the compressive and splitting tensile strength tests for the specimens cured under various temperature-relative humidity and wind speed-sunlight exposure time curing conditions are shown in Table 8 and Table 9, respectively. For the specimens cured under standard curing conditions, the three- and seven-day design target compressive strengths were 50% and 80% of a 28-day design compressive strength of 27 MPa, respectively. From the test, a 28-day compressive strength of 31.1MPa was obtained. The three-day strengths for the specimens cured at 35, 40, and 45 °C showed slightly higher strengths than those cured at 8 and 12 °C. It is important to note that the three- and seven-day compressive strengths of the specimens cured at 8 °C were less than 40% and 70% of the compressive strength of 31.1 MPa. For the relative humidity effect evaluation, the specimens cured at relative humidity of 40% and 65% showed similar strengths for all curing ages. However, the strengths of the specimens cured at 8, 12, and 35 °C with a 95% relative humidity showed higher strengths than those cured at 40 and 45 °C with relative humidity of 40 and 45%. The three- and seven-day strengths of the specimens cured under 40 °C and 45 °C showed higher relative strength ratios with respect to the 28-day strength than the specimens obtained under the other curing temperatures, showing that a higher curing temperature increases the hydration rate in early age concrete. Overall, the 28-day strengths of the higher temperature specimens (40, 45 °C) were less than those of the lower temperature specimens (8, 12, 35 °C). A similar strength trend was observed in the steam-cured specimens. Generally, steam-cured specimens demonstrate higher early age strengths and the strengths tend to decline as the curing age increases due to the formation of hydration heat-induced micro-cracks during hydration process.
Generally, the splitting tensile strength of concrete is approximately 1/9~1/13 of the compressive strength. In this study, this general rule of compressive-to-tensile strength ratio was satisfied. Similar to the compressive strength test results, the early age tensile strengths of specimens cured at higher temperatures were larger, while the 28-day tensile strengths of the concrete cured at 35 and 40 °C were slightly larger than those cured at 8, 12, and 45 °C. However, the strengths of concrete cured at 35 and 40 °C were similar to that of the concrete cured under a standard temperature of 20 °C (control specimens). With respect to the wind speed and sunlight exposure time, the three- and seven-day strengths for wind speeds of 2, 4, and 6 m/s reached up to 50% and 70%~80% of the design strength of 27 MPa, respectively. However, in the case of the 28-day strength, this percentage declined, which can be attributed to evaporation of moisture in the concrete caused by the wind during the hydration process. The result of the application of wind was reduction of hydration reactions, resulting in the strength reduction. If these conditions are present on the construction site, cracks due to strong wind may lead to poor concrete quality. Conversely, the strength of the concrete cured under a 0 m/s wind speed did not decrease under a longer sunlight exposure time, resulting in a greater 28-day strength.
All specimens cured under wet, dry, and autoclave curing conditions satisfied the design strength of 27 MPa at 28 days, validating the appropriateness of the mix design. In the case of the wet curing condition, the three-, seven-, and 28-day strengths were larger than those obtained from the dry and autoclaved curing conditions. Generally, the strengths of the specimens cured under conditions that allow a good hydration process appear to be larger.
Table 8. Strength test results of temperature-relative humidity.
CaseTemperature (°C)Relative Humidity (%)w/c (%)Compressive Strength (MPa)Splitting Tensile Strength (MPa)
3 Days7 Days28 Days3 Days7 Days28 Days
1840558.3213.5718.511.091.371.78
28655513.2115.4222.831.091.372.25
38955516.7422.7031.371.752.192.1
41240558.7214.3019.41.041.551.85
512655515.4318.0622.881.431.682.02
612955518.3223.7030.731.572.202.79
735405515.1217.7424.081.741.872.27
835655519.923.1827.652.332.572.84
935955520.1924.4733.632.102.402.6
1040405517.1118.1623.331.991.972.22
1140655517.9720.3423.762.822.212.78
1240955519.122.8327.161.902.572.52
1345405518.8121.7319.622.022.031.95
1445655518.9423.2124.882.062.082.13
1545955519.0823.327.292.062.132.21
Control Specimens
Standard curing20955517.062331.111.582.182.25
Wet curing201005518.2426.638.321.722.292.7
Air dry curing20605516.1323.3628.611.361.842.2
Table 9. Strength test results of wind speed-sunlight exposure time.
CaseWind Speed (m/s)Sunlight Exposure Time (h)Compressive Strength (MPa)Splitting Tensile Strength (MPa)
3 days7 days28 days3 days7 days28 days
10215.5724.2425.941.451.922.12
20414.2823.7828.181.41.92.22
30615.4923.5529.361.391.92.4
40815.9922.8728.461.521.952.05
52214.6619.3417.551.32.22.07
62412.5118.1716.441.61.941.65
72614.3422.2518.361.482.052.02
82816.4522.87171.592.171.93
94214.6618.9715.211.61.982.17
104413.721.0116.081.681.992.02
114614.2721.816.571.72.141.83
124813.3319.9119.481.462.211.71
136215.1122.117.621.742.161.95
146413.0321.6520.41.62.181.78
156614.4622.6619.291.612.052
166813.1819.65211.332.231.7
Control Specimens
Standard curing0017.062331.111.582.182.25
Wet curing0018.2426.638.321.722.292.7
Air dry curing0016.1323.3628.611.361.842.2

5. Verification of Test Results

As stated earlier, concrete strength development is directly related to the curing conditions including temperature, relative humidity, wind speed, and sunlight exposure time. There are ample amounts of data available from previously published reports on temperature and relative humidity curing conditions. However, there is almost no data available for wind speed and sunlight exposure time curing conditions, because these curing parameters have become significant issues due to recent climate change conditions. Therefore, analysis of the test results from the curing condition variations must be performed based on the most reliable data of concrete strength development history for various temperatures from the literature [23].
Figure 2 shows the comparison of the concrete strength development histories for various temperatures from previously published results (temperatures of 4, 13, 21, 29, 38, and 46 °C) and the current work (temperatures of 8, 12, 35, 40, and 45 °C). In Figure 2a–c, constant relative humidity of 40%, 65%, and 95%, respectively, was used as the curing conditions. From the previously published data, other than the 78% strength development history of concrete cured under a temperature of 4 °C, all other concrete strength development histories showed full satisfaction of the target 28-day strength. Also, as the curing temperature increased, the early age strength development rate was much quicker due to acceleration of the hydration process. The curing temperatures with constant relative humidity of 40%, 65%, and 95% applied in the current work gave extremely similar strength development histories to the previously published results. Therefore, it is safe to conclude that the concrete strength development histories from the curing temperature and relative humidity variations applied in the current work are valid and they can be used as basic data for comparison with the other curing conditions considered in the study.
Figure 2. Strength development history for various temperatures with a constant relative humidity of (a) 40%; (b) 65%; and (c) 95%.
Sustainability 07 10052 g002aSustainability 07 10052 g002b
In Figure 3a–d, the strength development history of concrete cured under various wind speed with constant sunlight exposure times of 2, 4, 6, and 8 h, respectively, are compared to the strength histories of concrete under various curing temperatures from previously published data. The trends of all of strength development history curves of the concrete cured under various sunlight exposure times were similar. The early age strengths at three days and seven days were similar to concrete cured under various temperatures, but the strengths significantly dropped at 28 days compared to the concrete cured at the various temperatures. More specifically, the three-day strengths of concrete cured at various wind speeds were similar to the strengths obtained from concrete cured at 29 and 38 °C. The seven-day strength of the wind-cured concrete was similar to concrete cured at 21, 29, 38, and 46 °C. The reason for the early age strength development of the wind-cured concrete being similar to the early age strengths of concrete cured at relatively high temperatures is due to the movement of internal water in concrete specimens cured under wind. During the early age period, the internal water of concrete cured under wind condition moved in the direction of wind, accelerating the hydration process at a rate similar to concrete cured at high temperature. However, the 28-day strength reduction of the wind-cured concrete was approximately 20%~50% of the target 28-day strength, due to the fact that the internal voids created by the movement of internal water acted as weak localized points during the test, which were susceptible to premature failure. For concrete cured under sunlight exposure times of 2, 4, and 6 h, the 28-day strength reduction was more significant as the wind speed increased, which can be attributed to additional internal void formation due to the evaporation of internal water from extended exposure to sunlight and more internal water movement from a higher wind speed.
Figure 3. Strength development history for various wind speed with a constant sunlight exposure time of (a) 2 h; (b) 4 h; (c) 6 h; and (d) 8 h.
Sustainability 07 10052 g003aSustainability 07 10052 g003b
In Figure 4a–d, the strength development history of concrete cured under various sunlight exposure times with constant wind speeds of 0, 2, 4, and 6 m/s, respectively, are compared with the strength histories of concrete under various curing temperatures from previously published data. The trends of all of the strength development history curves of concrete cured under various wind speeds are similar and showed significant reduction of the 28-day strength. It is important to note that the concrete cured under a wind speed of 0 m/s is exactly the same as concrete cured in ordinary air environment and this concrete did not show any 28-day strength reduction, indicating that the test results from the current work are valid. The three- and seven-day strengths of concrete cured under wind were similar to that of concrete cured at temperatures of 21 and 29 °C, and 13, 21, 29, and 38 °C, respectively. For concrete cured under wind speeds of 2 and 4 m/s, the 28-day strength reduction margin increased as the sunlight exposure time increased, which can be attributed to the increased temperature of curing environment, resulting in a greater amount of internal water evaporation and the formation of internal micro-voids. The analysis and comparison of the current work results to previously published results showed that wind speed and sunlight exposure time variations due to climate change can have significant effects on the concrete strength at construction sites. Therefore, further research is required to understand current climate change effects on concrete performance. Among many possible solutions to enhance concrete performance, one solution of improving performance of concrete mixture in terms of durability, toughness, and mechanical strength is using fiber-reinforced concrete (FRC) [24,25,26,27,28,29,30,31].
Figure 4. Strength development history for various sunlight exposure time with a constant wind speed of (a) 0 m/s; (b) 2 m/s; (c) 4 m/s; and (d) 6 m/s.
Sustainability 07 10052 g004

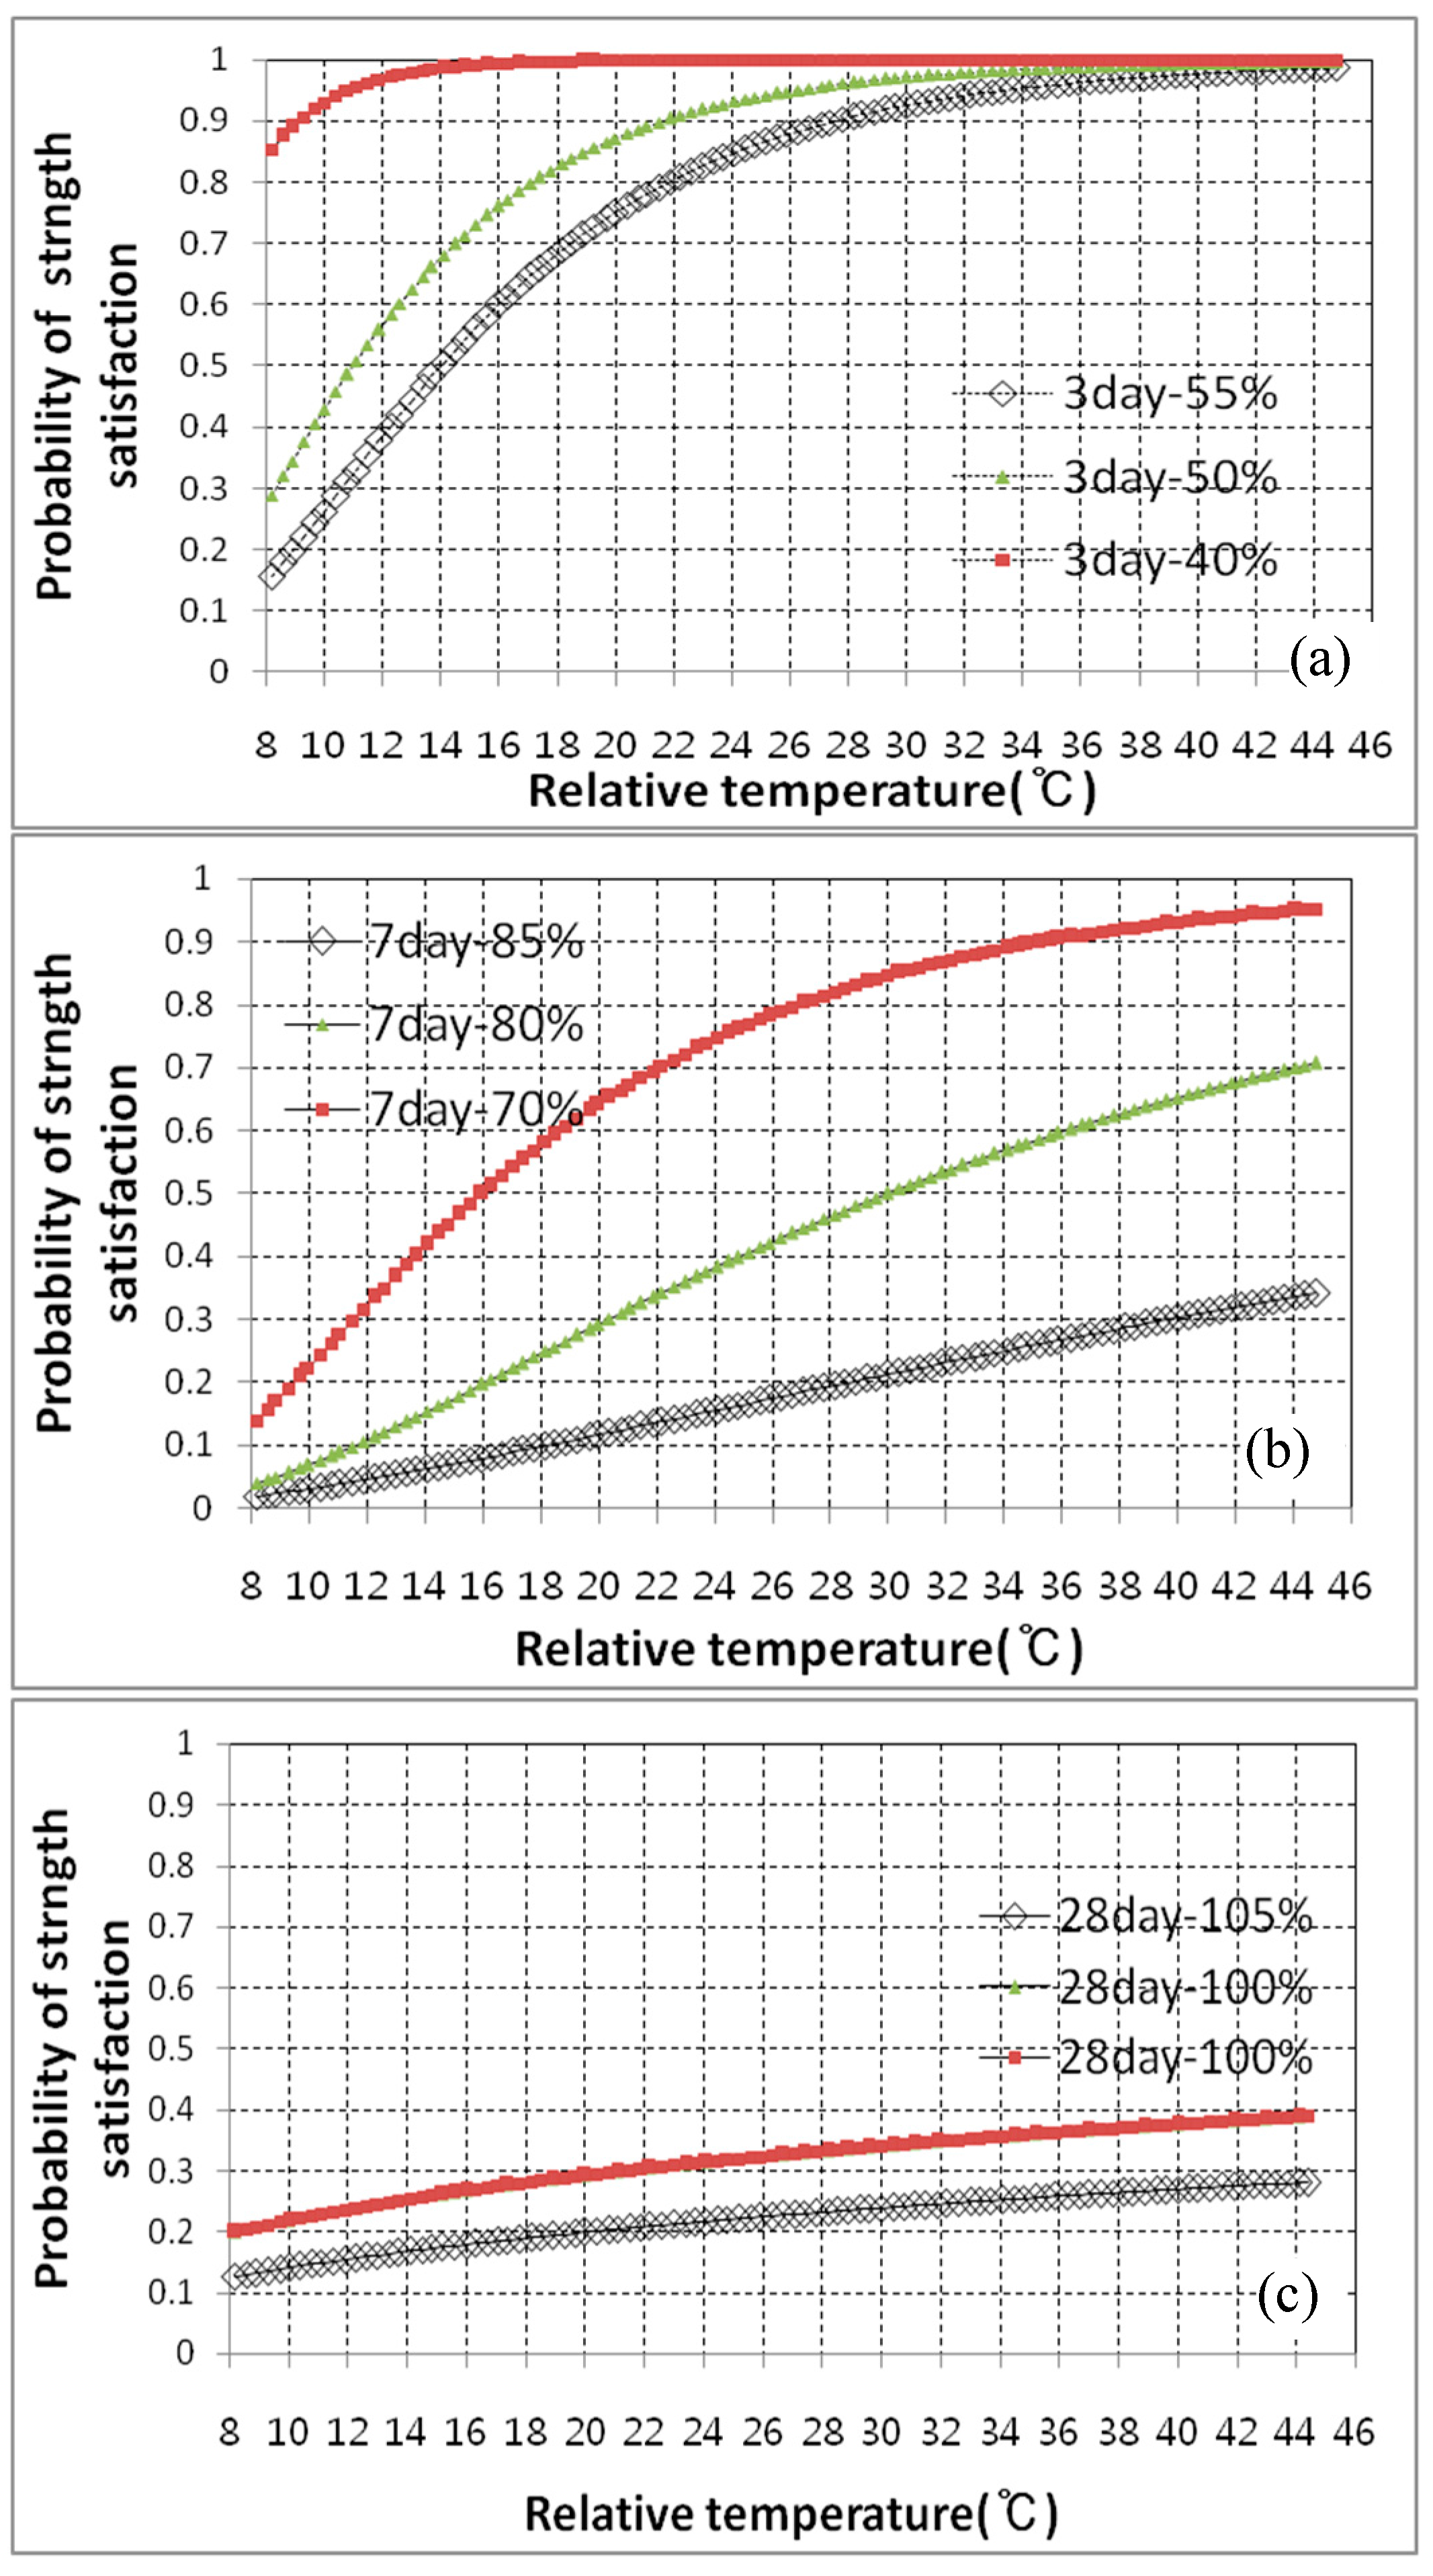
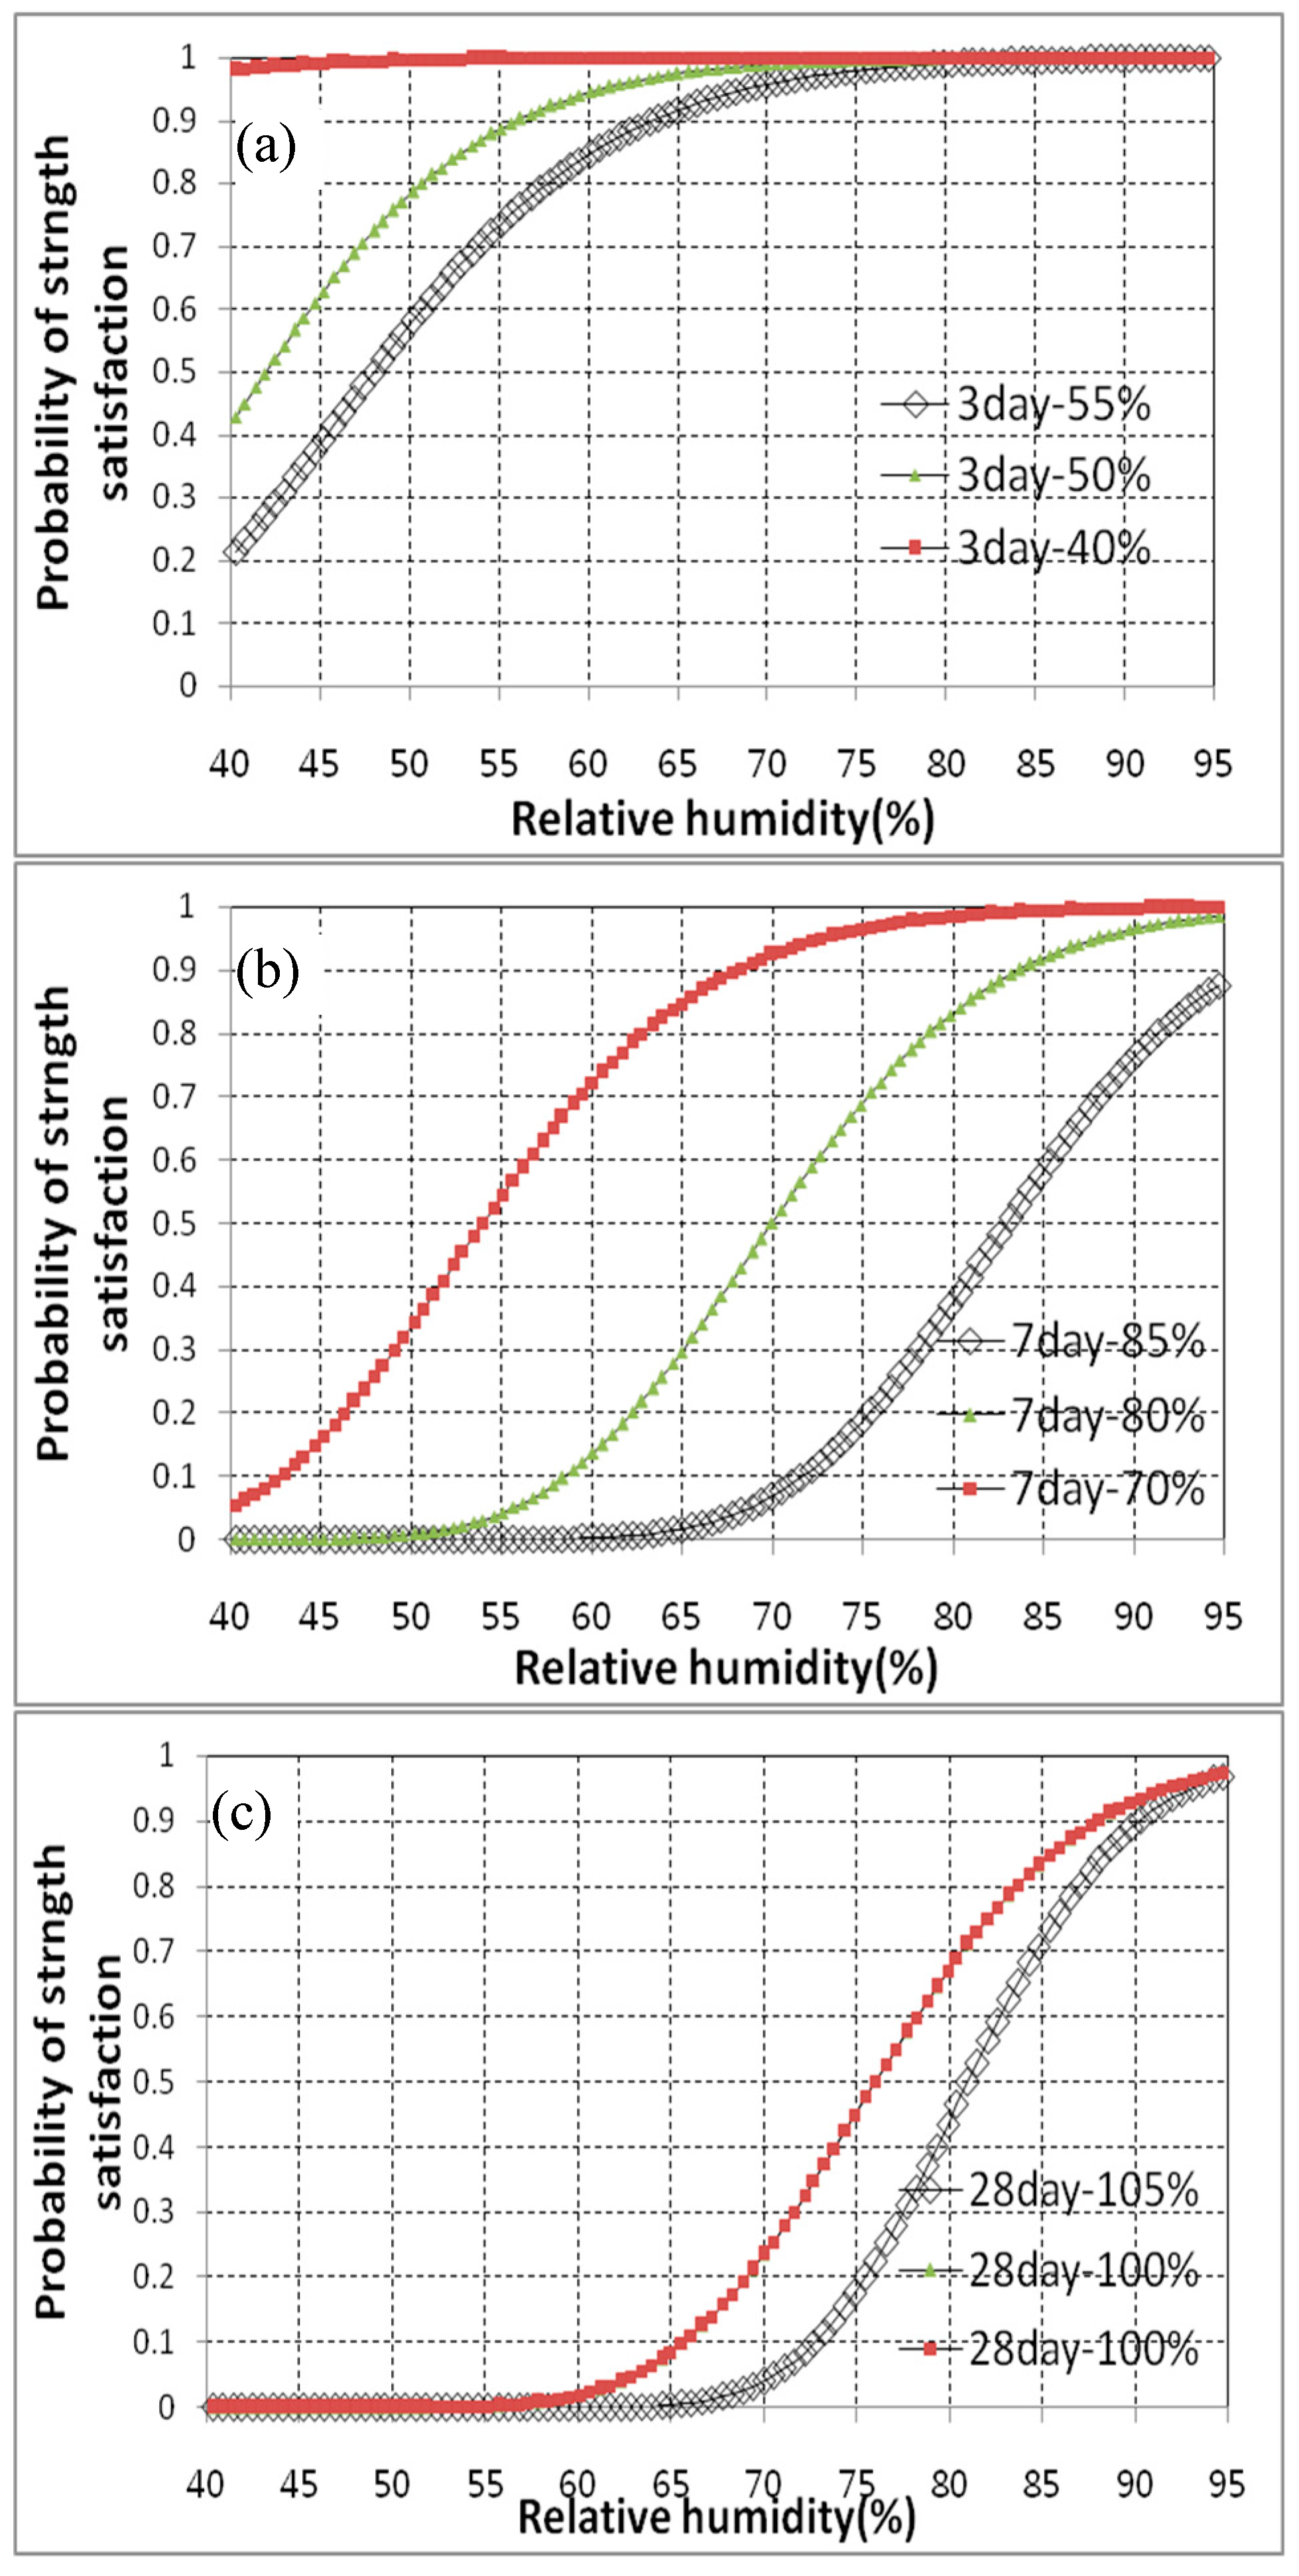
6. Satisfaction Curve

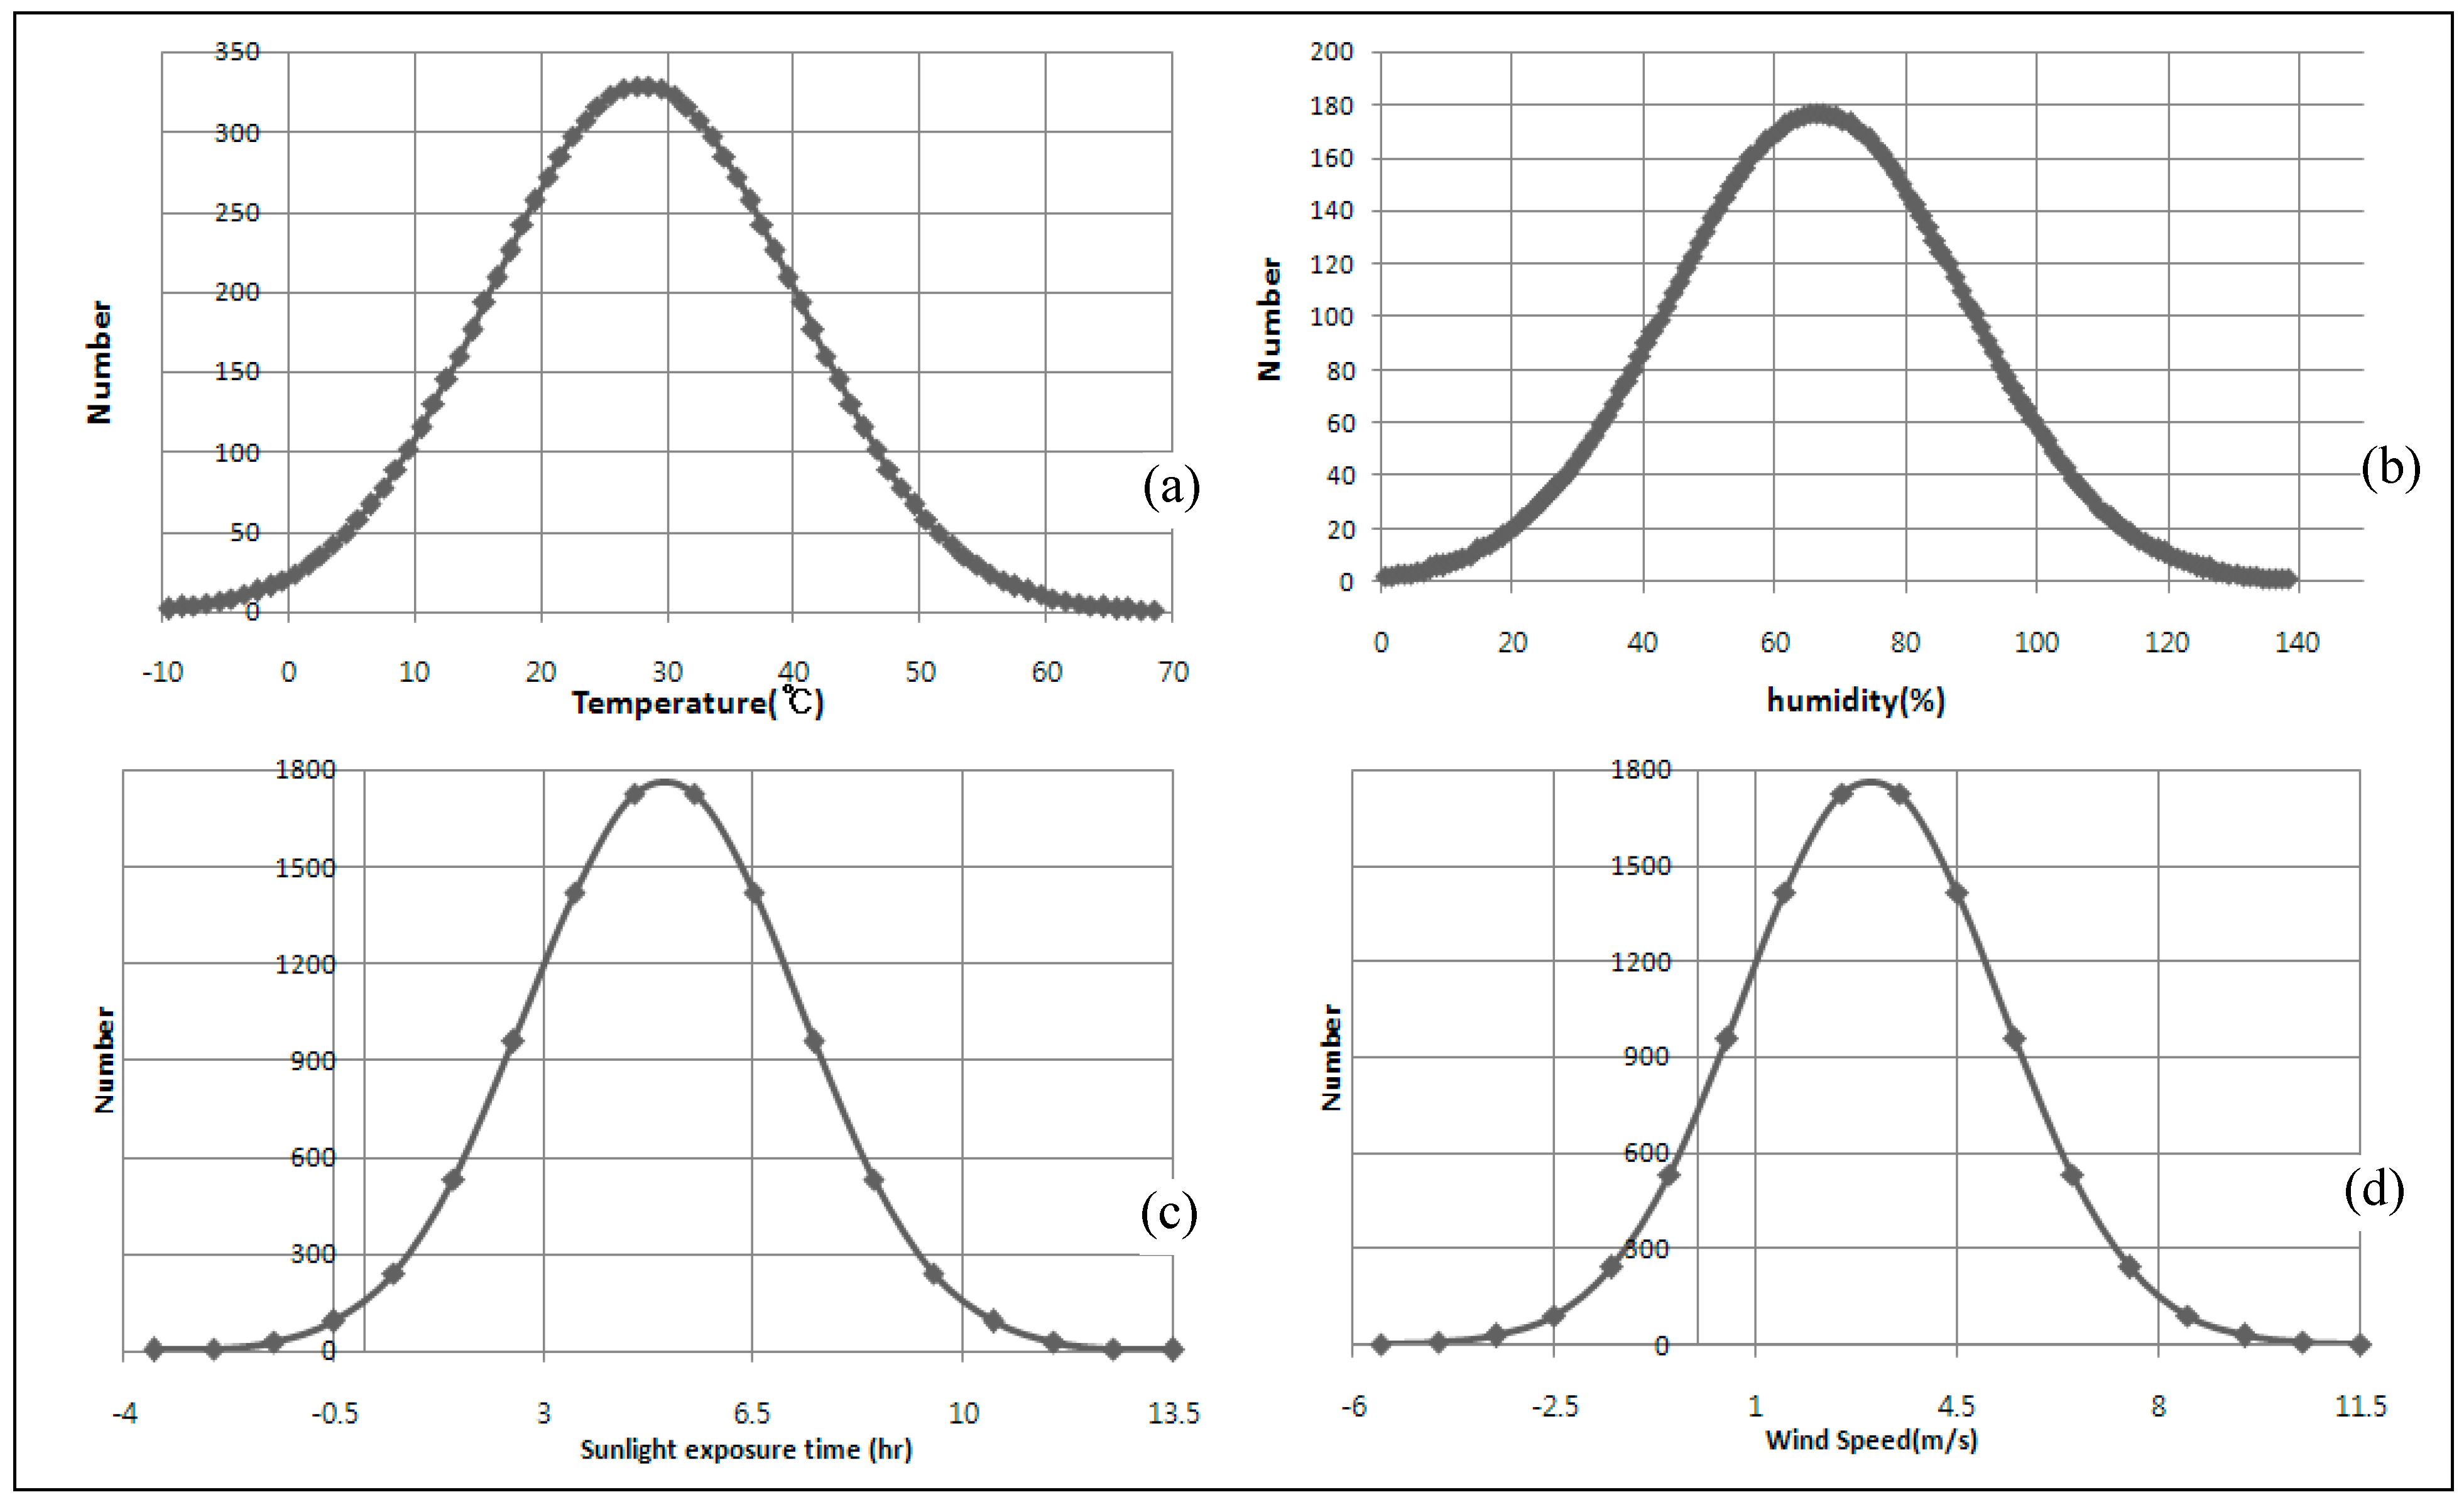
6.1. Virtual Data Generation

The satisfaction curve is a statistical method used to determine the success or failure of a target criteria with a satisfaction ratio between 0.0–1.0. Sufficient data is necessary to build an effective database. If the available data to prepare the satisfaction curve is insufficient, it is necessary to draw a normal distribution curve using the actual data to develop virtual data from this curve. The method for developing the virtual data proceeds as follows.
The relative humidity used in this study’s test was 40%, 65%, and 95%, where the corresponding mean value and standard deviation were 66.67% and 22.48%, respectively. Using these two values, the relative humidity curve as a normal distribution curve was constructed, as shown in Figure 5b, from which virtual data can be obtained. Assuming that the number of data points of the normal distribution curve is 10,000 and the length of the x-axis for the relative humidity is 1.0, the curve height becomes the area. For instance, in order to obtain the number of virtual data for a relative humidity of 66.5%, the area between x-axis values of 66 and 67 is 177, equaling a height of 177, which becomes the number of virtual data points. Figure 5a shows the virtual temperature curve developed for a mean value of 28.0 °C and a standard deviation of 15.08 °C. Virtual data for the wind speed and sunlight exposure time can be developed in the same manner. Table 10 and Table 11 show the number of data points according to the virtual data points obtained from the normal distribution of temperature, relative humidity, wind speed, and sunlight exposure time shown in Figure 5a–d, respectively.
Figure 5. Standard normal distribution of (a) temperature; (b) relative humidity; (c) sunlight exposure time; and (d) wind speed.
Sustainability 07 10052 g005
Table 10. Virtual data points for temperature and relative humidity.
Relative Humidity (%)Data No.Temperature (°C)Data No.
0.52−9.512
1.52−8.514
2.53−7.516
············
66.517727.5264
66.617728.5329
············
132.5276.51
133.5277.51
Table 11. Virtual data points for sunlight exposure time and wind speed.
Sunshine ExposureTime (hrs)Data No.Wind speed (m/s)Data No.
−3.51−5.51
−2.56−4.56
−1.527−3.527
············
4.517262.51726
············
············
12.5610.56
13.5111.51

6.2. Evaluation of Compressive Strength Satisfaction Curve

The satisfaction curves presented in Figure 6 and Figure 7 were developed using virtual data of the temperature and relative humidity curing conditions, respectively. To calculate the satisfaction probability, the material variables, mean value, and log normal distribution requiring a standard deviation must be used. As satisfaction requirements for (the three-day, seven-day, and 28-day design compressive strengths) to construct satisfaction curves shown in Figure 6 and Figure 7, target strengths of (40%, 70%, 100%), (50%, 80%, 100%), and (55%, 85%, 105%) to 28-day target strength were used, respectively. After determining the success and failure of the virtual data obtained from the test result as 0 or 1 by comparing it with the strength satisfaction requirement, the mean value and standard deviation can be calculated by inputting them into the Bayesian probability program, which could then be used to draw a satisfaction curve. The developed satisfaction curve is used for the PBE. For example, considering the relationship between the seven-day strength and the relative humidity curing condition in Figure 7b, the curing relative humidity must be more than 54% to accomplish 50% of the seven-day strength requirement (18.9 MPa). Moreover, the strength satisfaction curve depending on temperature and relative humidity in Figure 6 and Figure 7 indicate that the ranges of the seven-day and 28-day strength were wider than that of the three-day strength, which means that the effect of the temperature and relative humidity on the concrete strength would increase when the curing period was extended beyond three days. The satisfaction curve for the wind speed and sunlight exposure time could be developed using the probability program based on virtual data similar to that used for the temperature and relative humidity, as shown in Figure 8 and Figure 9. Figure 8 and Figure 9 show (the satisfaction curves for the three-, seven-, and 28-day compressive strength satisfaction requirements) of (40%, 70%, 100%), (50%, 80%, 100%), and (55%, 85%, 105%) to a design strength target value of 27 MPa, respectively. In Figure 8c, to accomplish 50% of the design strength, the wind speed needs to be 1.0m/s or greater where as in Figure 9, to accomplish 50% of the seven-day strength requirement of 80%, the sunlight exposure time needs to be at least 5 hours. From the results shown in Figure 8 and Figure 9, the wind speed and sunlight exposure time appear to be the most influential curing condition factors on the 28-day and seven-day strengths, respectively.
Figure 6. Compressive strength satisfaction curve of temperature. (a) three-day; (b) seven-day; and (c) 28-day.
Sustainability 07 10052 g006
Figure 7. Compressive strength satisfaction curve of relative humidity. (a) three-day; (b) seven-day; and (c) 28-day.
Sustainability 07 10052 g007
Figure 8. Compressive strength satisfaction curve of wind speed. (a) three-day; (b) seven-day; and (c) 28-day.
Sustainability 07 10052 g008aSustainability 07 10052 g008b
Figure 9. Compressive strength satisfaction curve of sunlight exposure time. (a) three-day; (b) seven-day; and (c) 28-day.
Sustainability 07 10052 g009aSustainability 07 10052 g009b

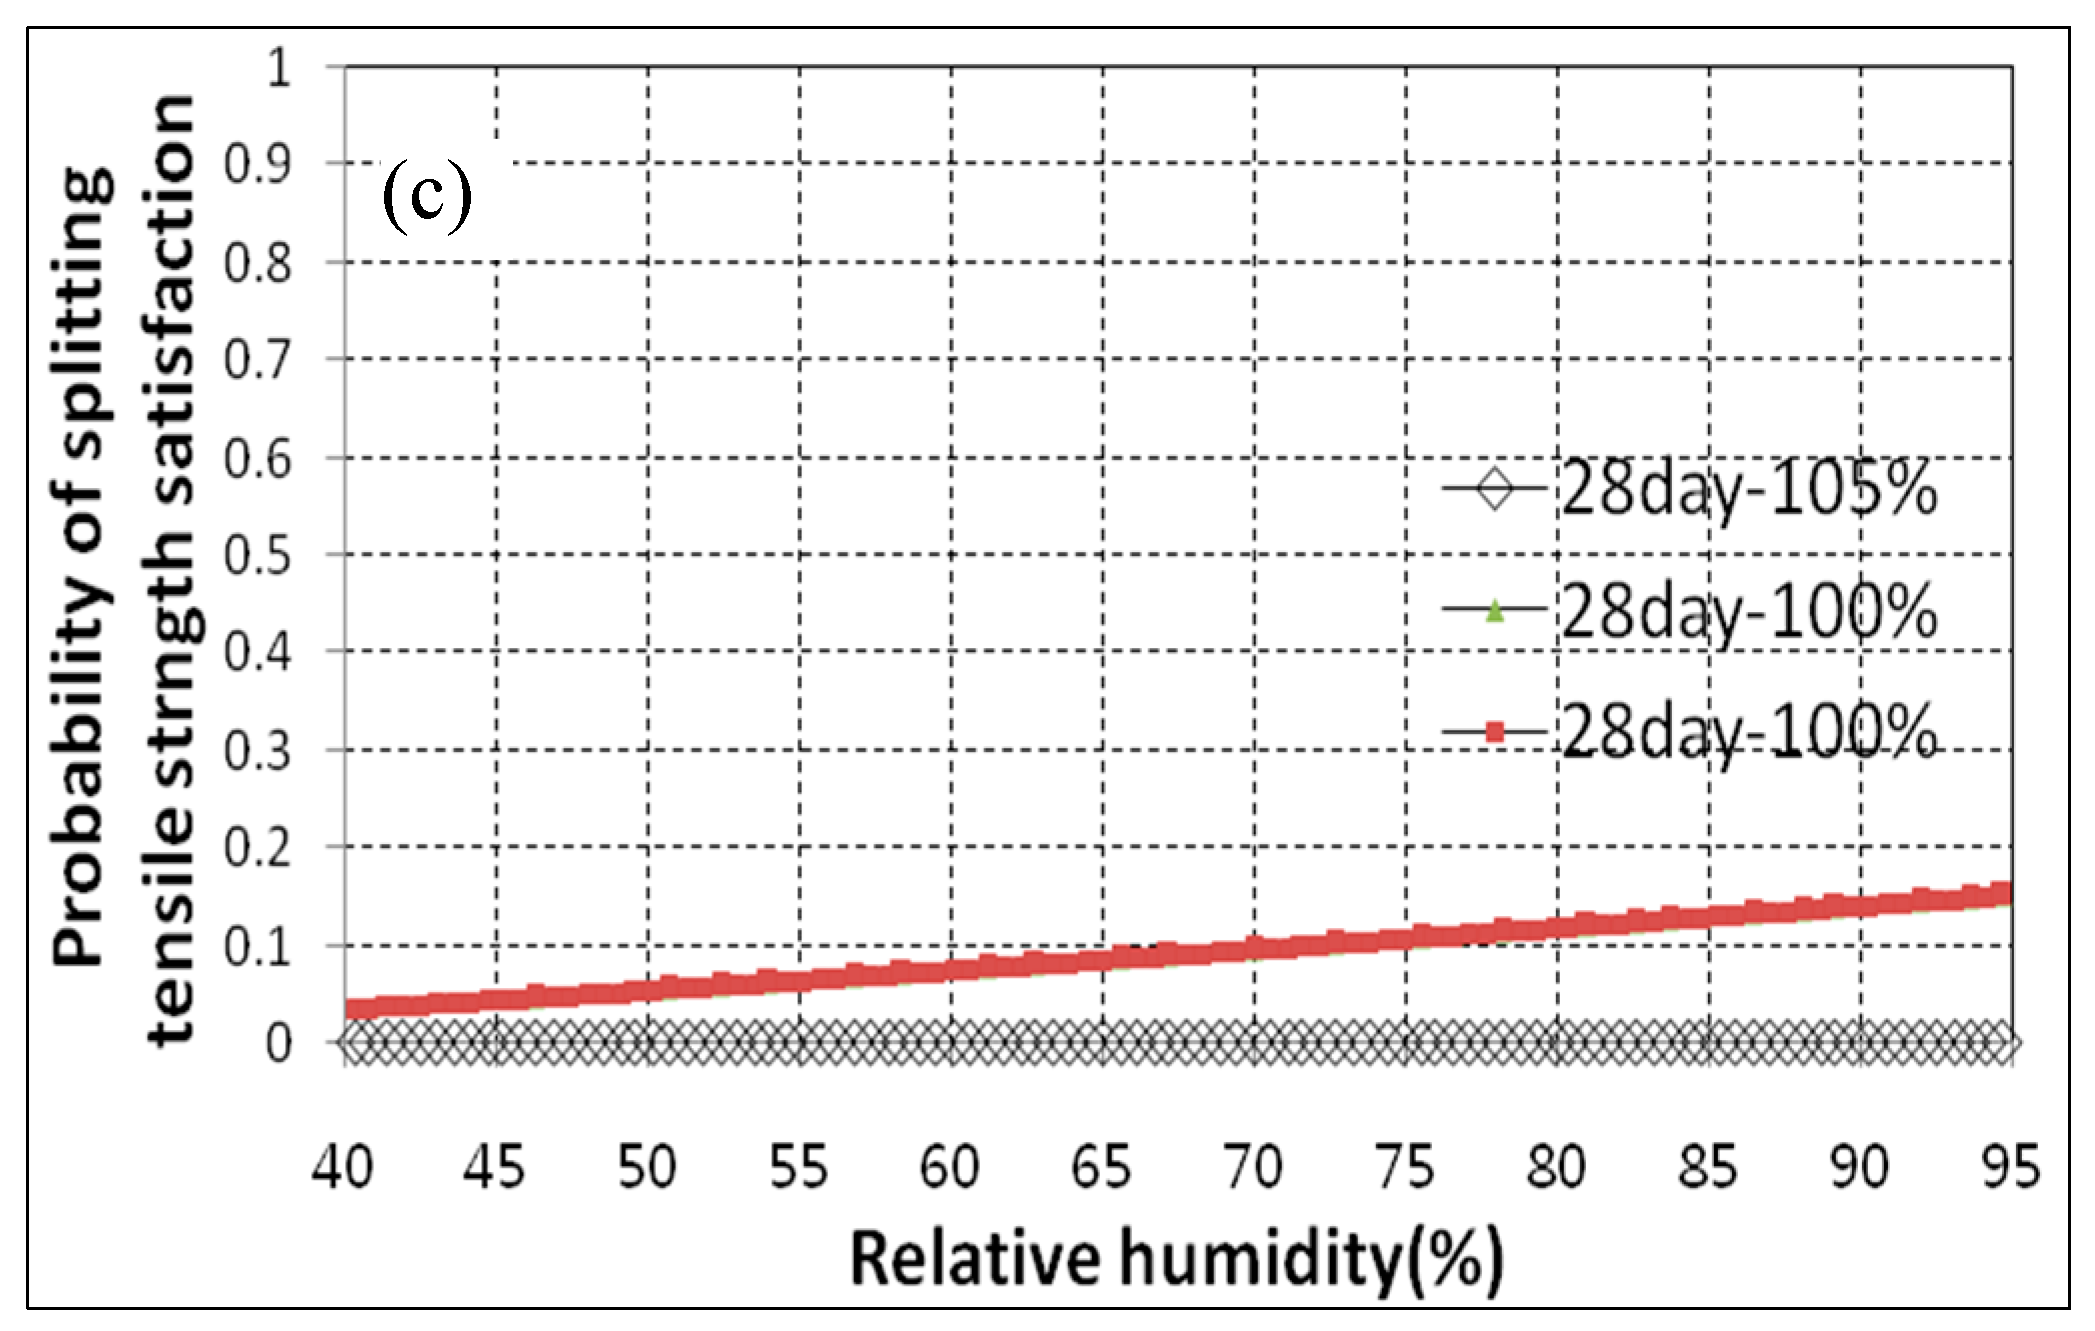
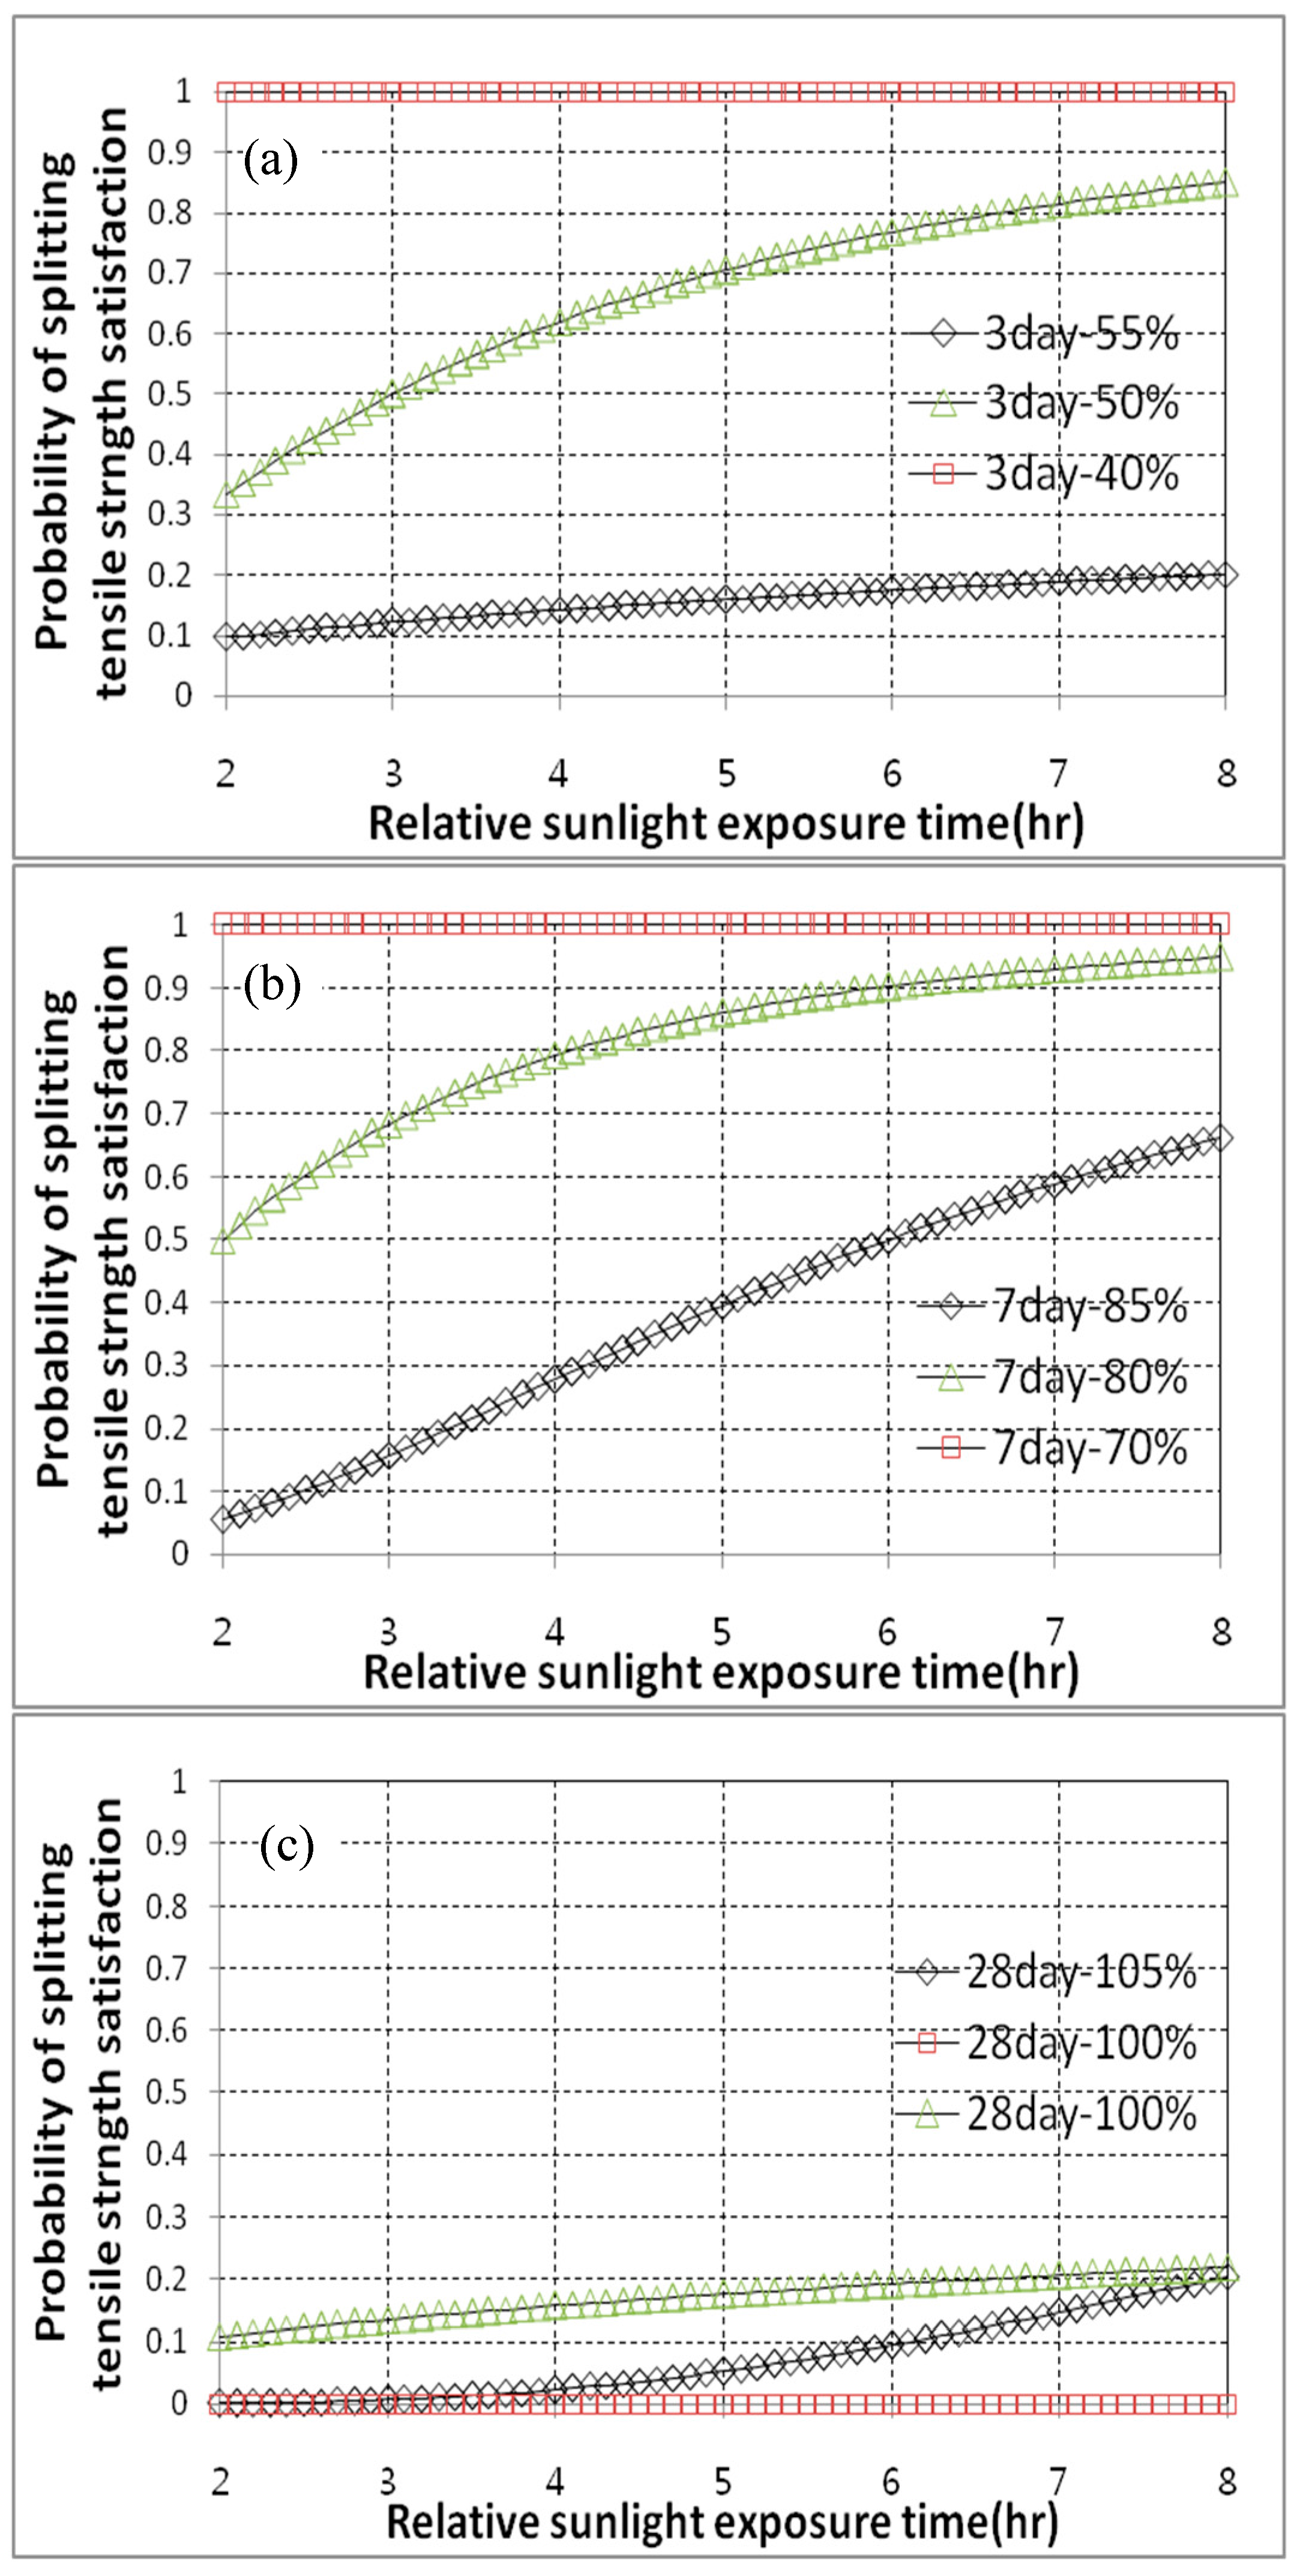
6.3. Evaluation of Tensile Strength Satisfaction Curve

The satisfaction curves for the tensile strength constructed using the same normal distribution method used for the tensile strength are shown in Figure 10 and Figure 11. The satisfaction requirements for the three-, seven-, and 28-day tensile strengths were (40%, 70%, 100%), (50%, 80%, 100%), and (55%, 85%, 105%) to the target design tensile strength, respectively. With respect to the tensile strength, the seven-day strength was most influenced by the temperature and relative humidity. The satisfaction curves for the split tensile strength for wind speed and sunlight exposure time are shown in Figure 12 and Figure 13, respectively. The satisfaction requirements of three-, seven-, and 28-day split tensile strengths were (40%, 70%, 100%), (50%, 80%, 100%), and (55%, 85%, 105%) of the 28-day design split tensile strength, respectively. Consequently, the satisfaction curve for the (40%, 70%, 100%) requirement appears to be linear since all test data satisfied the target criteria. Conversely, when the designer adjusted the target strengths to redraw the satisfaction curves using three-day, seven-day, and 28-day strengths of (50%, 80%, 100%) and (55%, 85%, 105%) to the 28-day design tensile strength, the satisfaction curve width began to vary. The changes of the satisfaction curves reflect the performance based characteristics, allowing for the target value to be selected based on the climate change from different regions and countries in order to evaluate the concrete performance. Hence, the designer may set a variety of targets and implement PBE that will be applicable to each specific construction site.
Figure 10. Splitting tensile strength satisfaction curve of temperature. (a) three-day; (b) seven-day; and (c) 28-day.
Sustainability 07 10052 g010aSustainability 07 10052 g010b
Figure 11. Splitting tensile strength satisfaction curve of relative humidity. (a) three-day; (b) seven-day; and (c) 28-day.
Sustainability 07 10052 g011aSustainability 07 10052 g011b
Figure 12. Splitting tensile strength satisfaction curve of wind speed. (a) three-day; (b) seven-day; and (c) 28-day.
Sustainability 07 10052 g012
Figure 13. Splitting tensile strength satisfaction curve of sunlight exposure time. (a) three-day; (b) seven-day; and (c) 28-day.
Sustainability 07 10052 g013

7. Conclusions

In this study, experimental evaluations were carried out to determine the effects of temperature, relative humidity, wind speed, and sunlight exposure time curing conditions from climate change factors on concrete strength. Then, satisfaction curves were drawn for the performance based evaluation using the Bayesian statistical method. The results obtained in the present study can be summarized as follows.
(1)
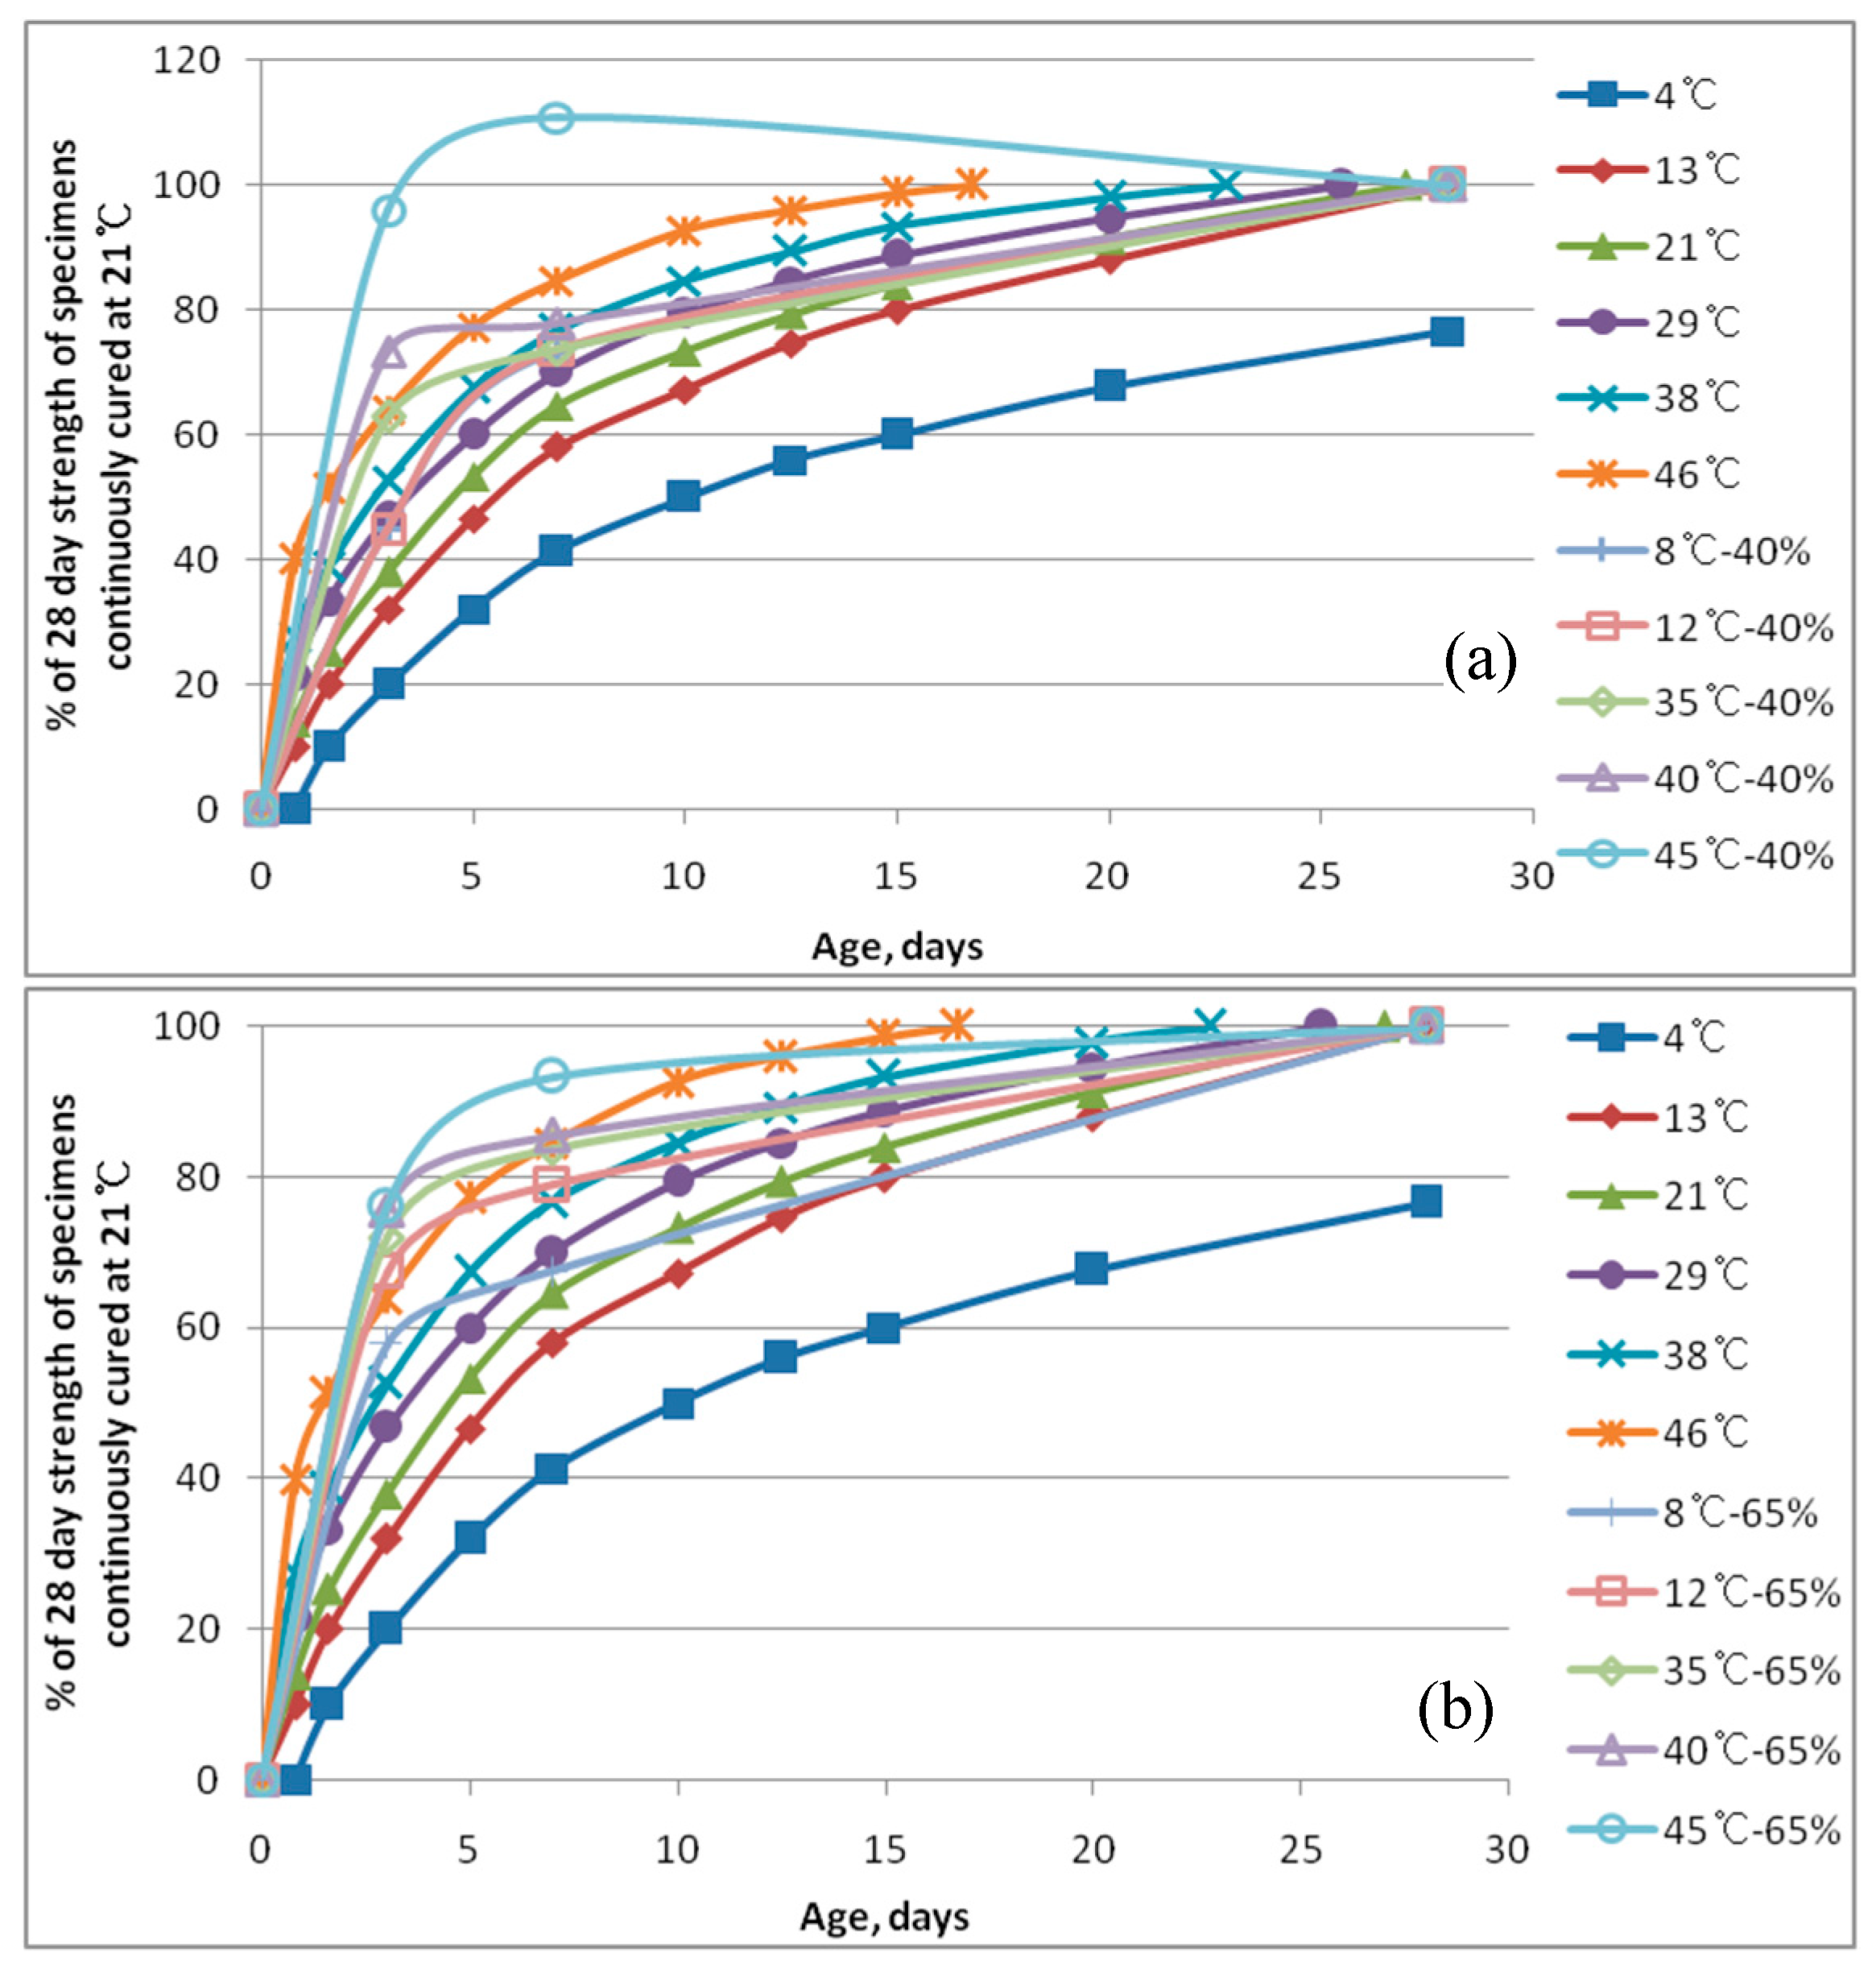
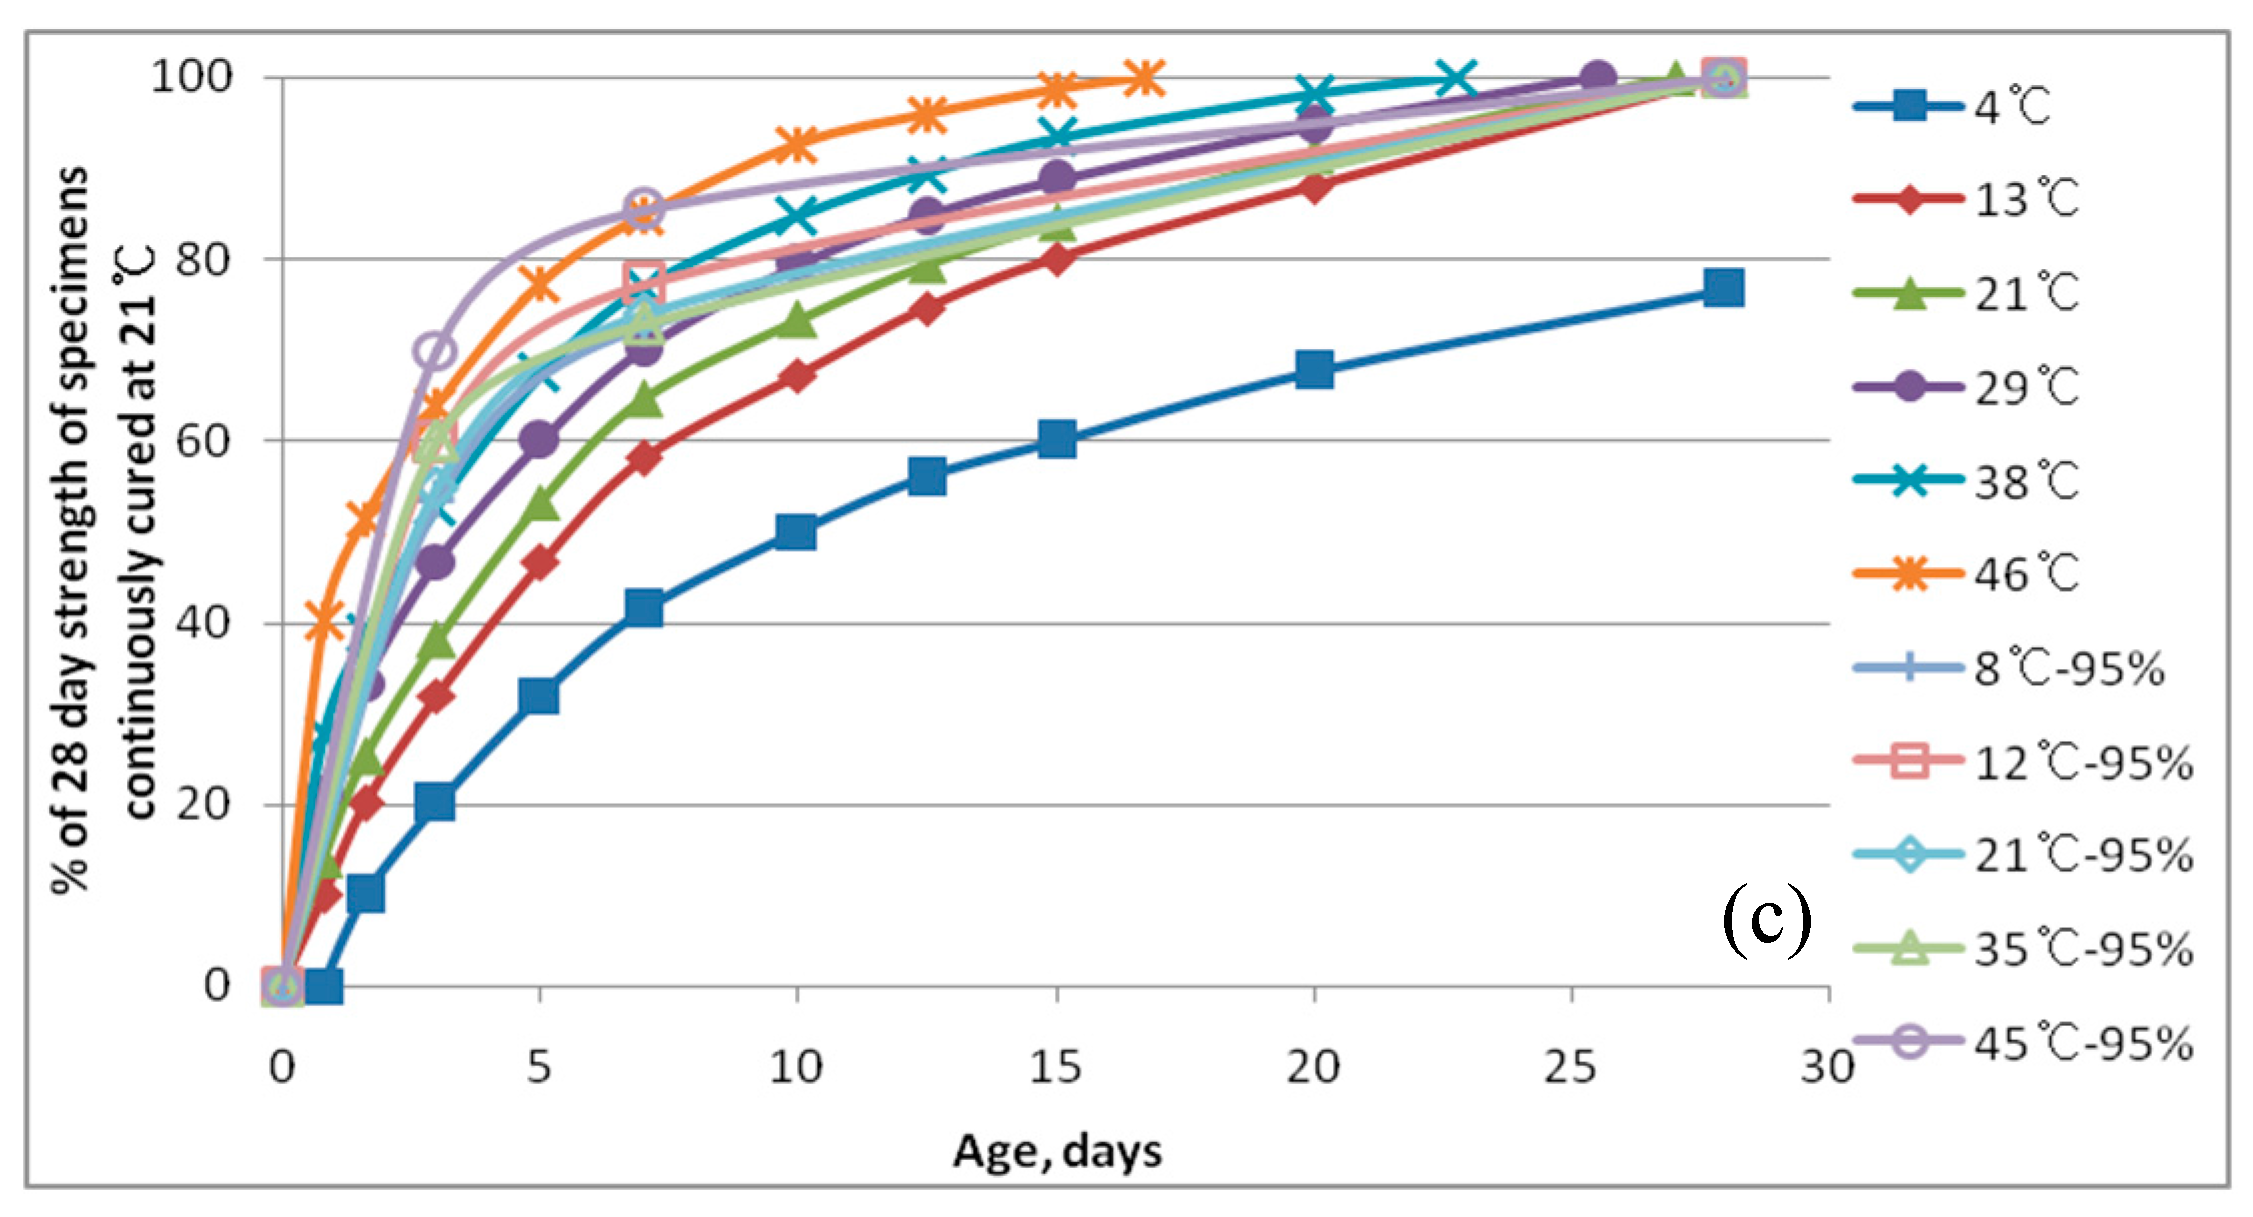
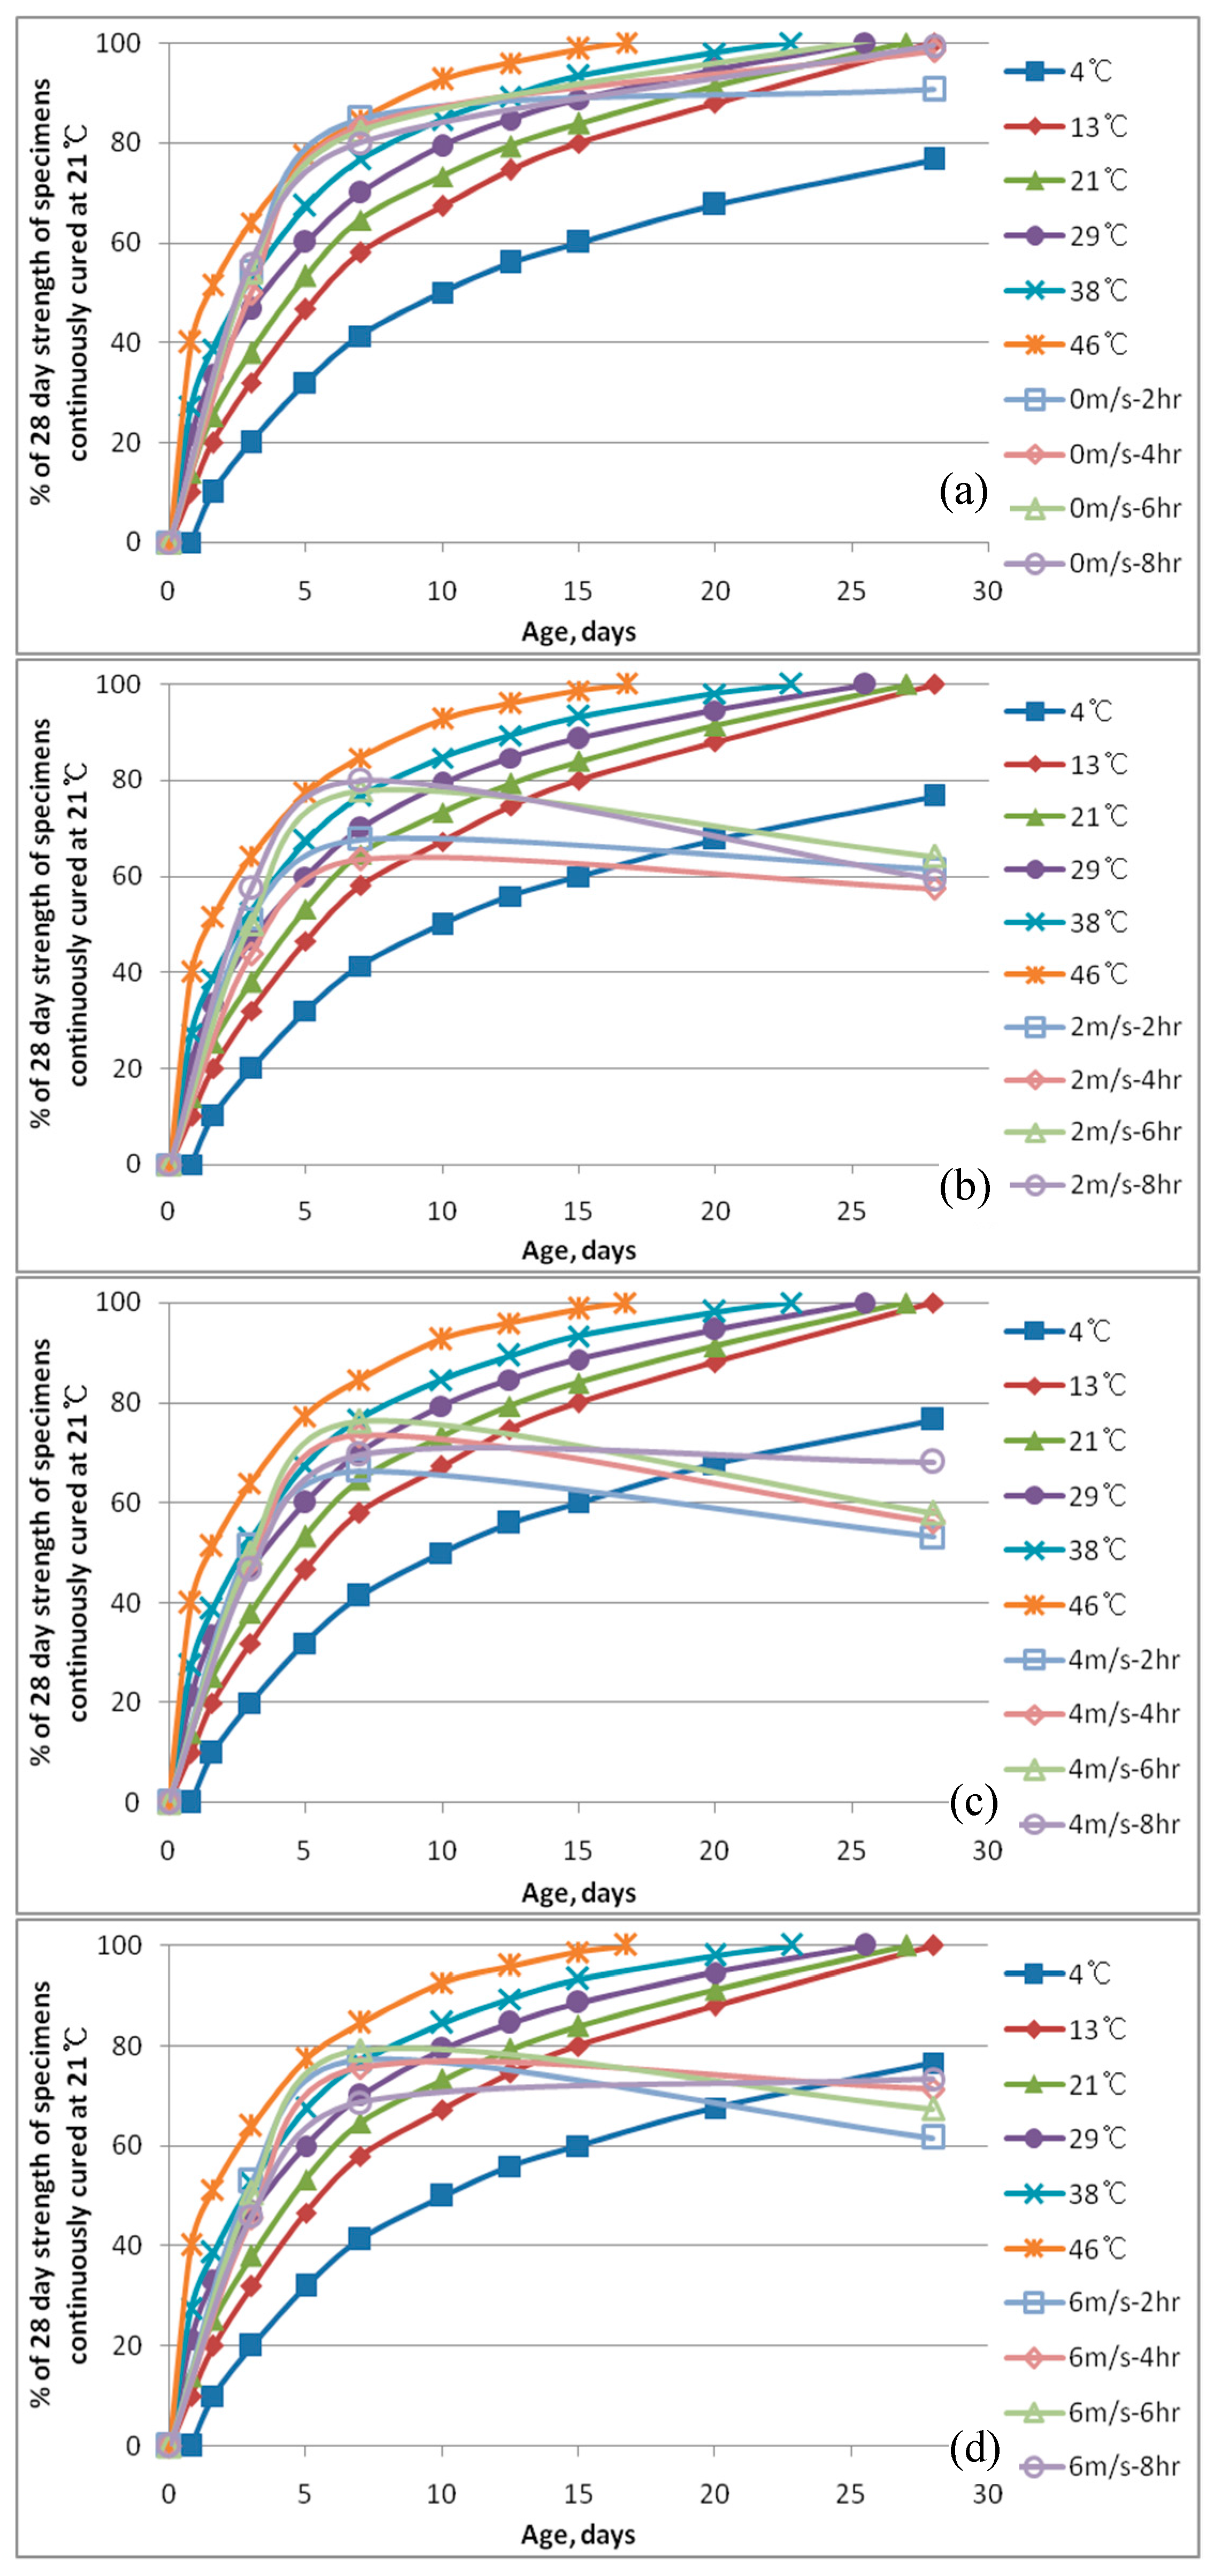
The compressive strength obtained under various temperature and relative humidity curing conditions showed that a higher temperature increased the three- and seven-day early age strengths, which was similar to steam-cured concrete. However, the largest 28-day strength was obtained at curing temperatures of 8, 12, and 35 °C and a relative humidity of 95%. The optimal curing temperature and relative humidity condition for the largest 28-day strength was nearly equivalent to the standard temperature and highest relative humidity.
(2)
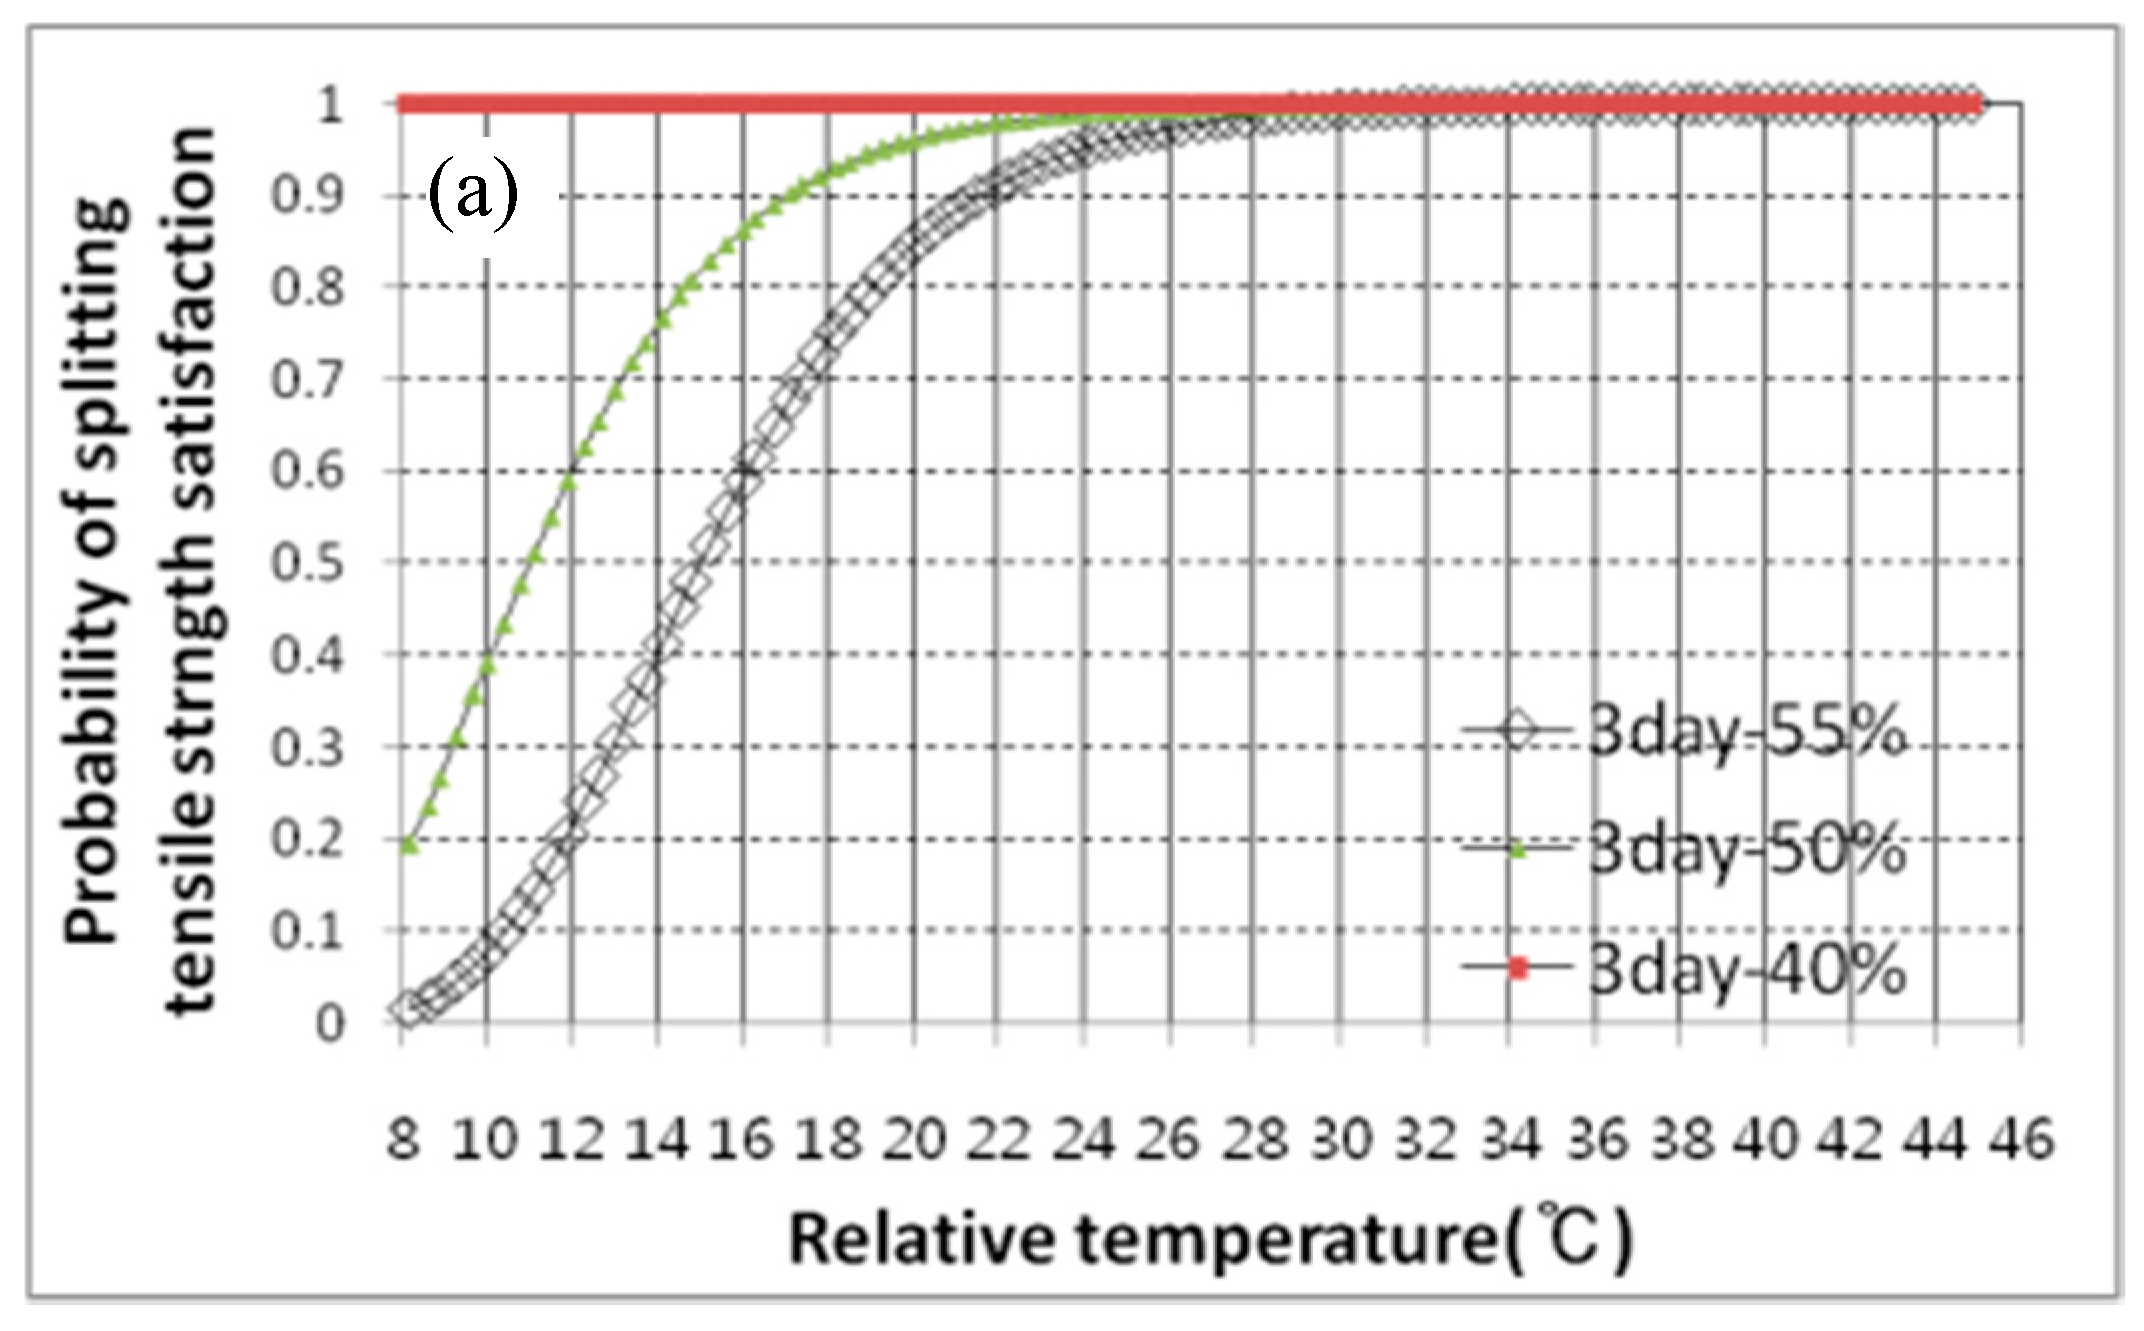
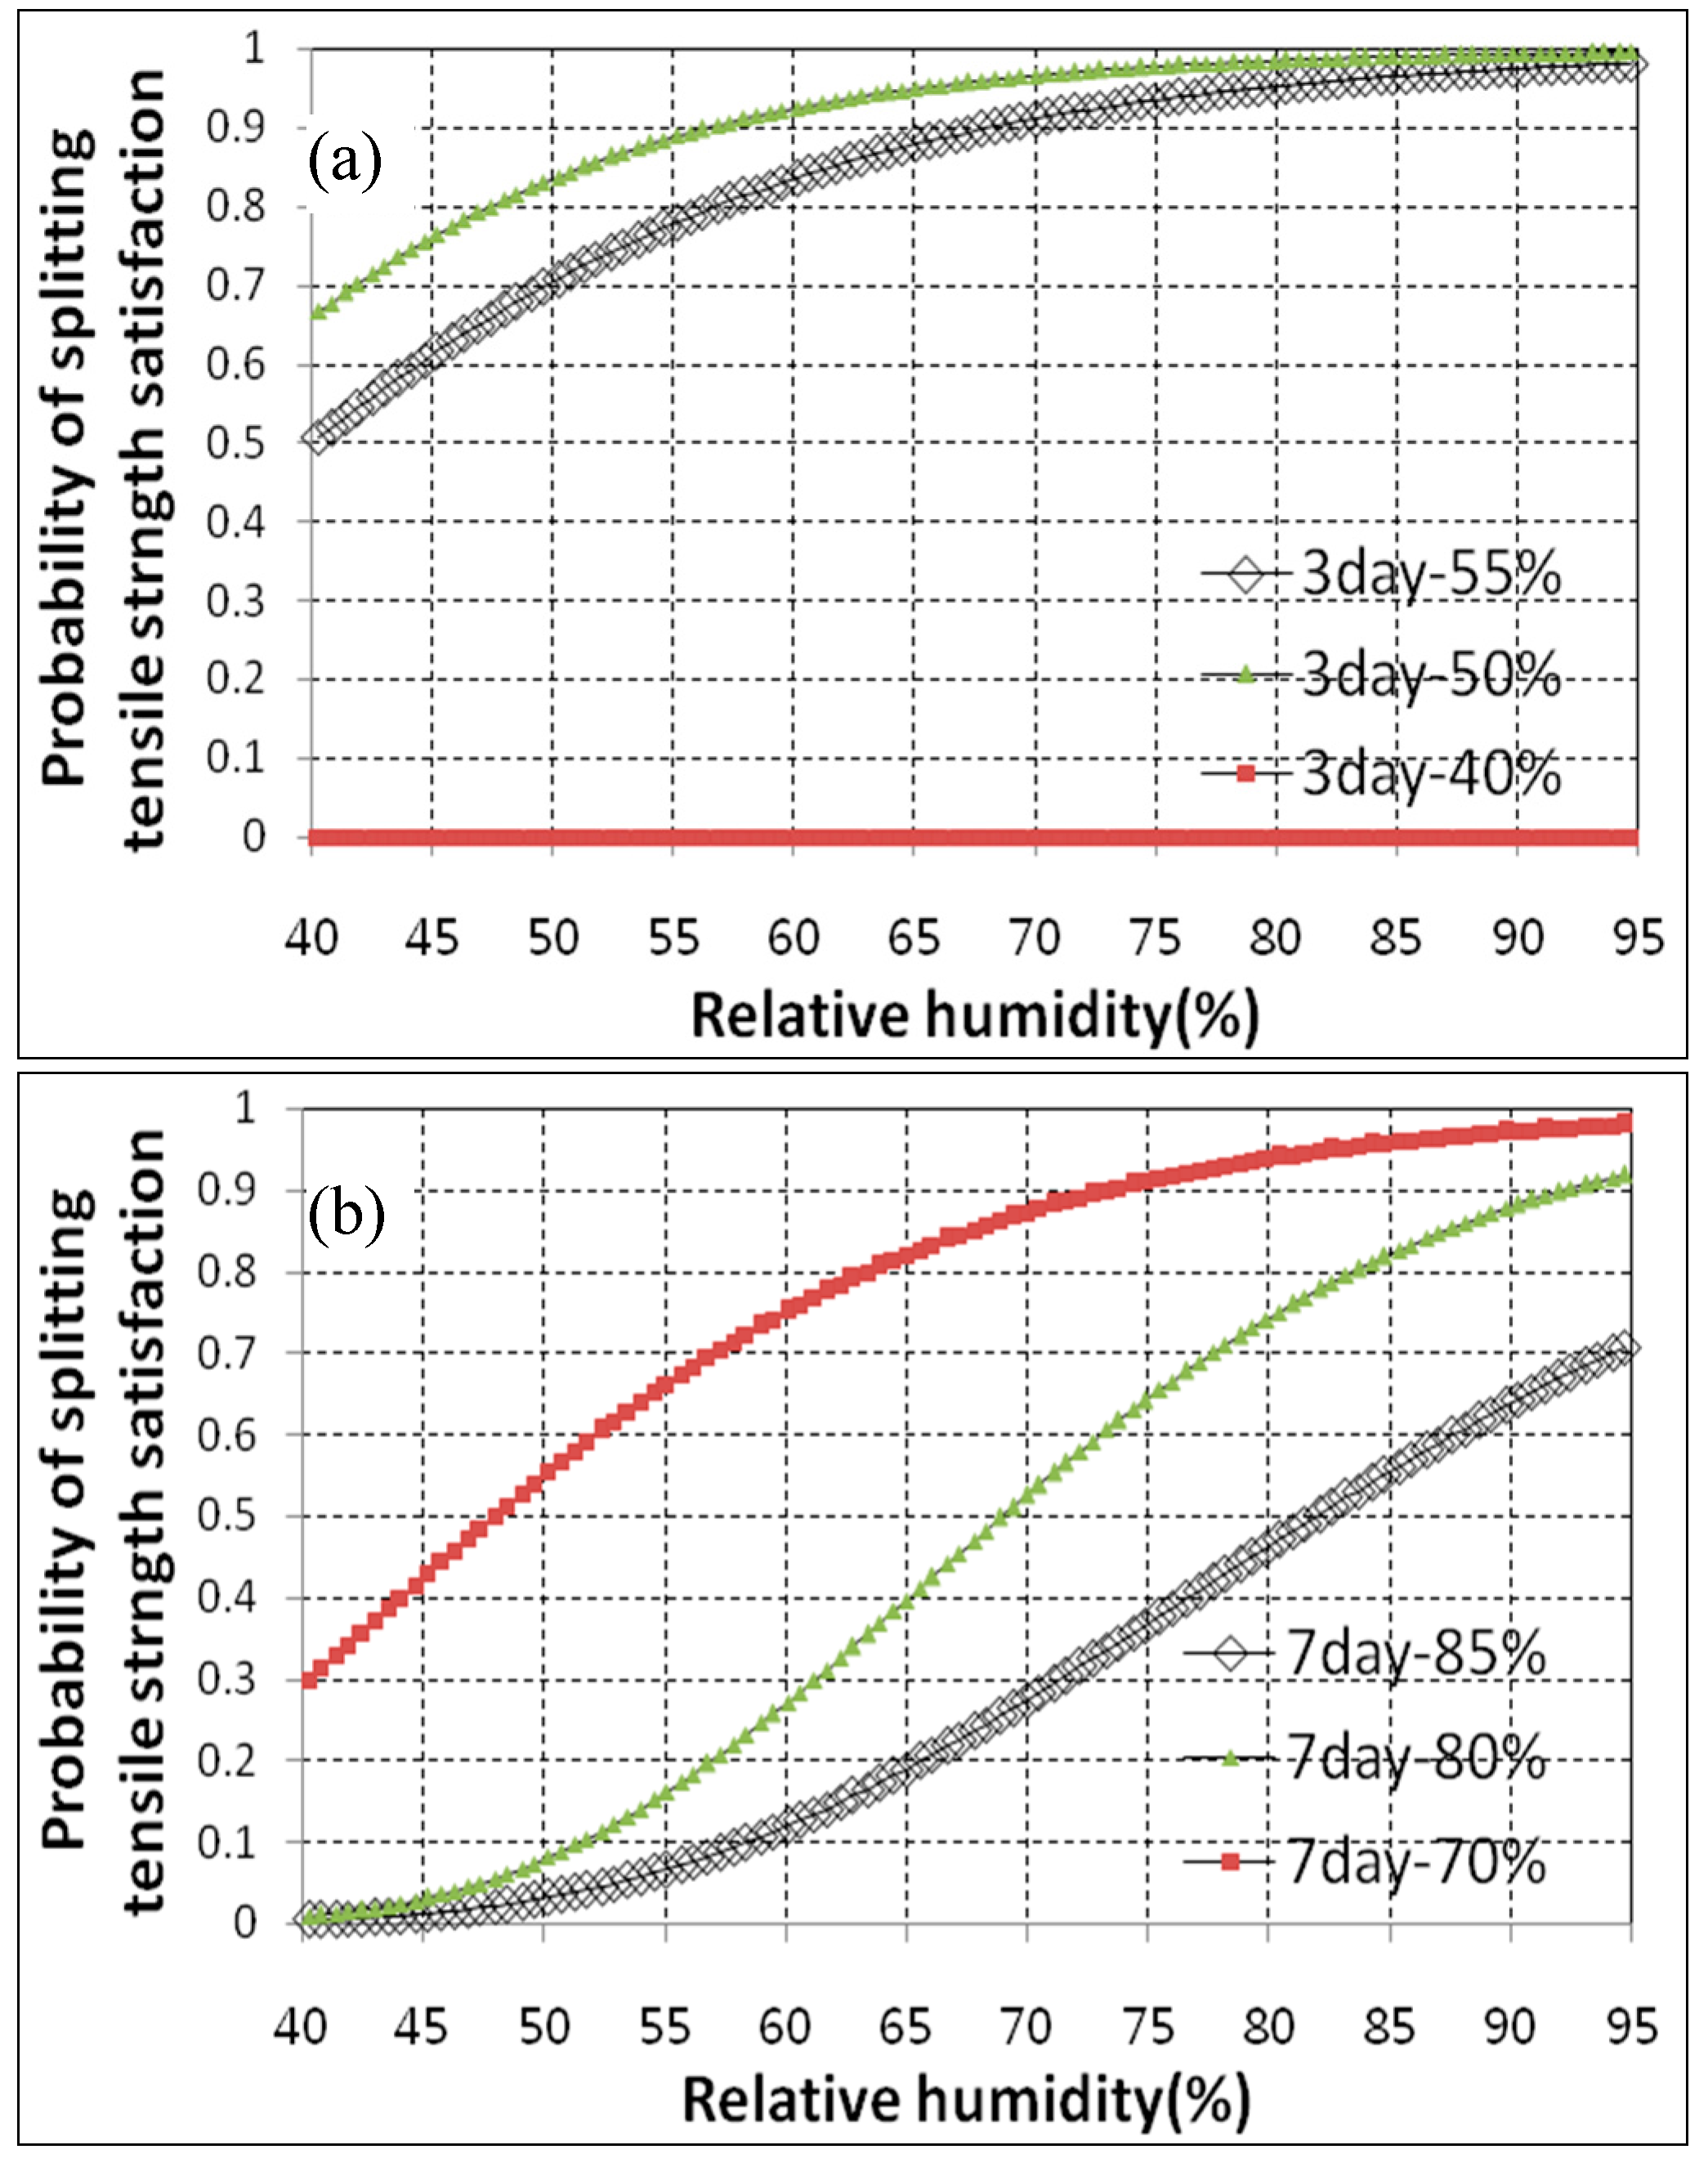
The tensile strengths obtained under various temperature and relative humidity curing conditions showed that 1/9–1/13 of the compressive strength was achieved with a similar behavioral trend as the 28-day compressive strength. The largest 28-day tensile strength was achieved at curing temperatures of 12 and 35 °C, while the largest early age tensile strength was achieved at curing temperatures of 35 °C and 40 °C.
(3)
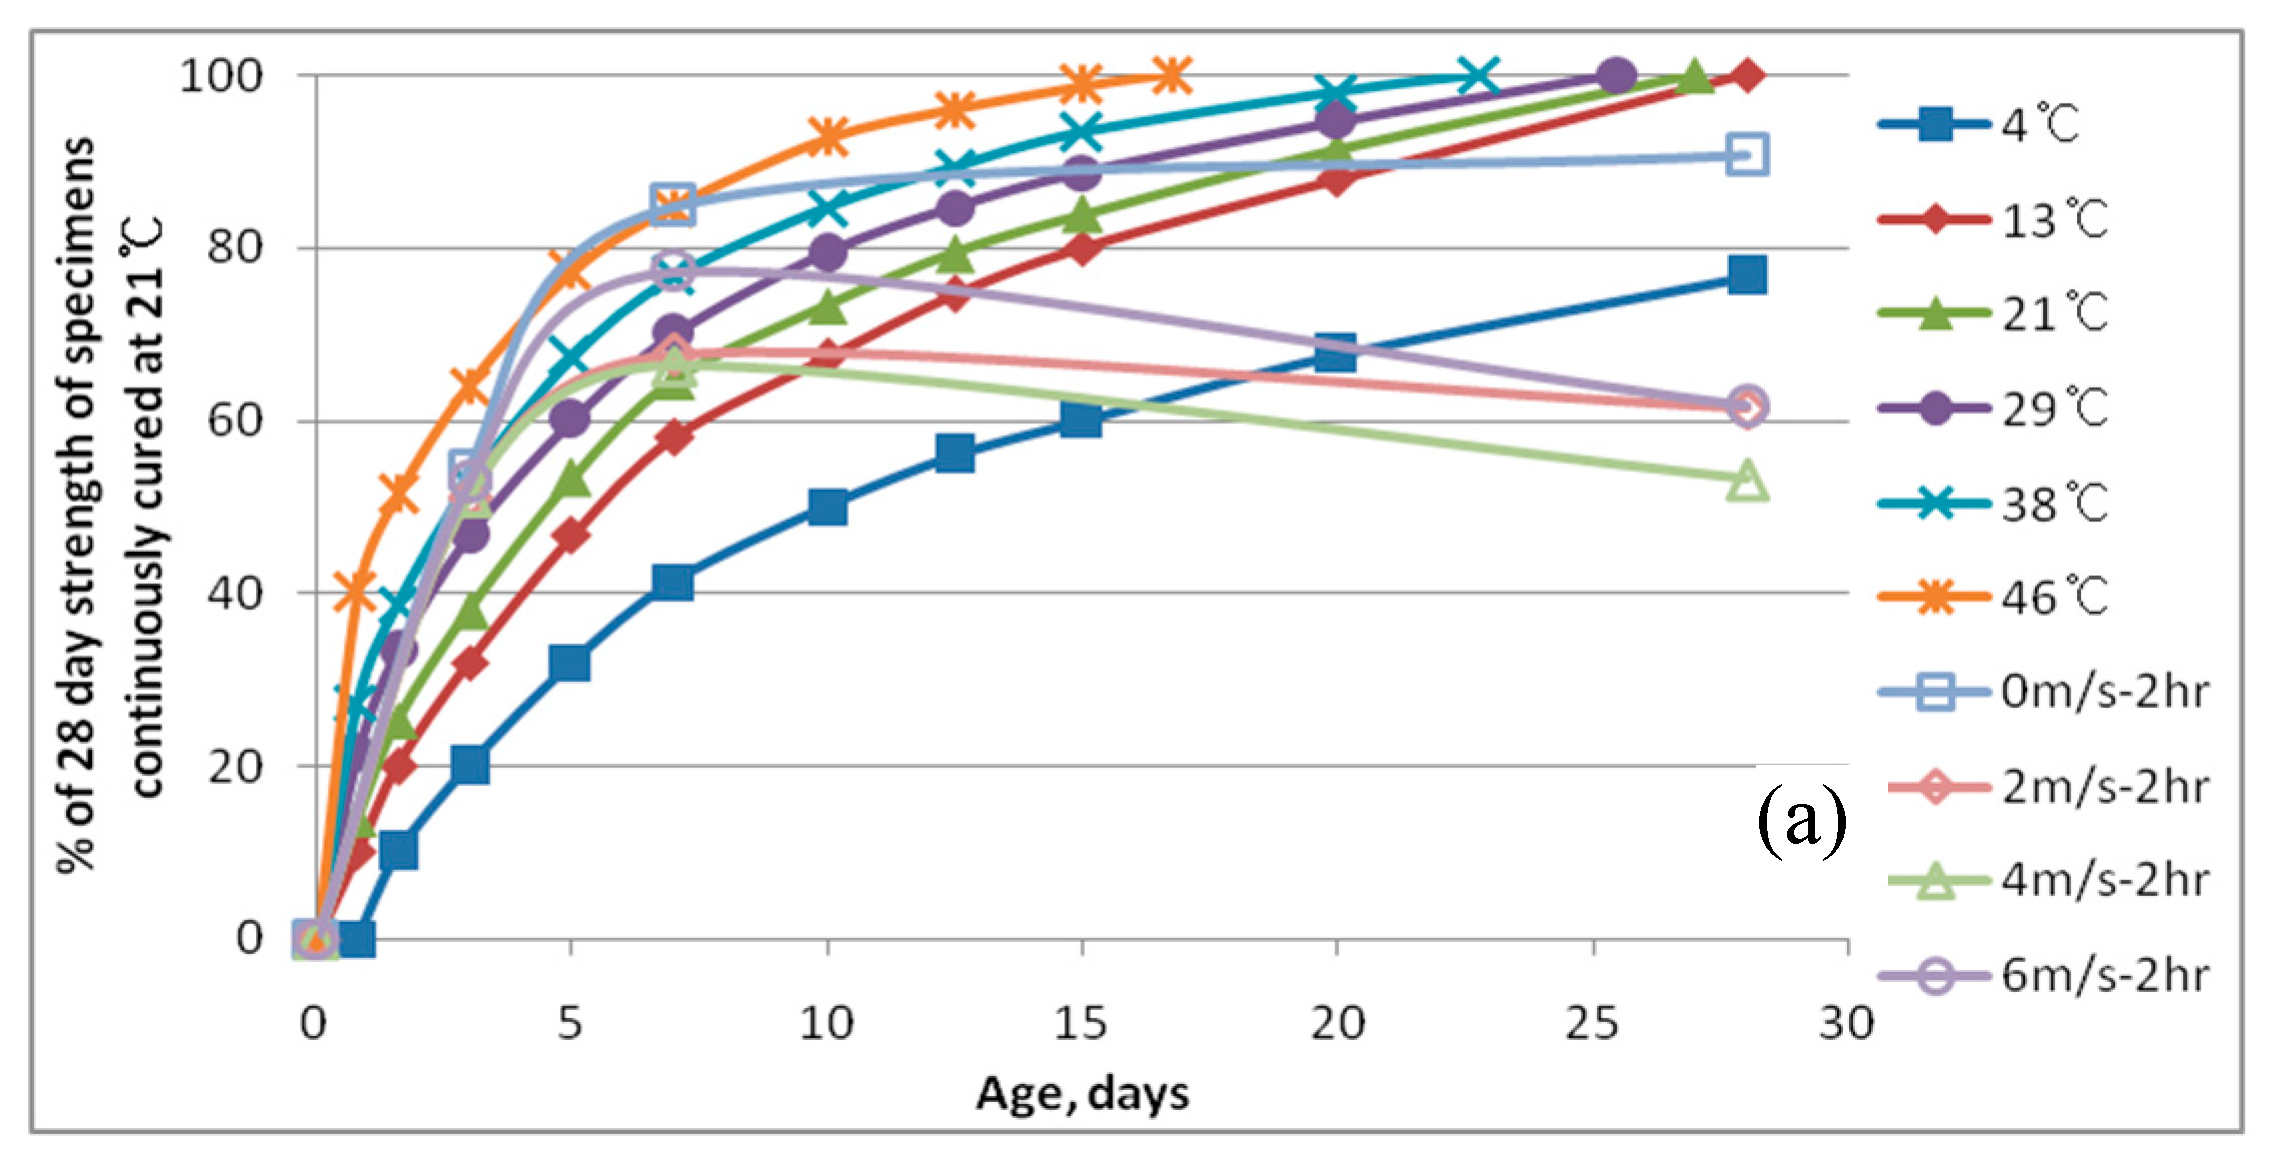
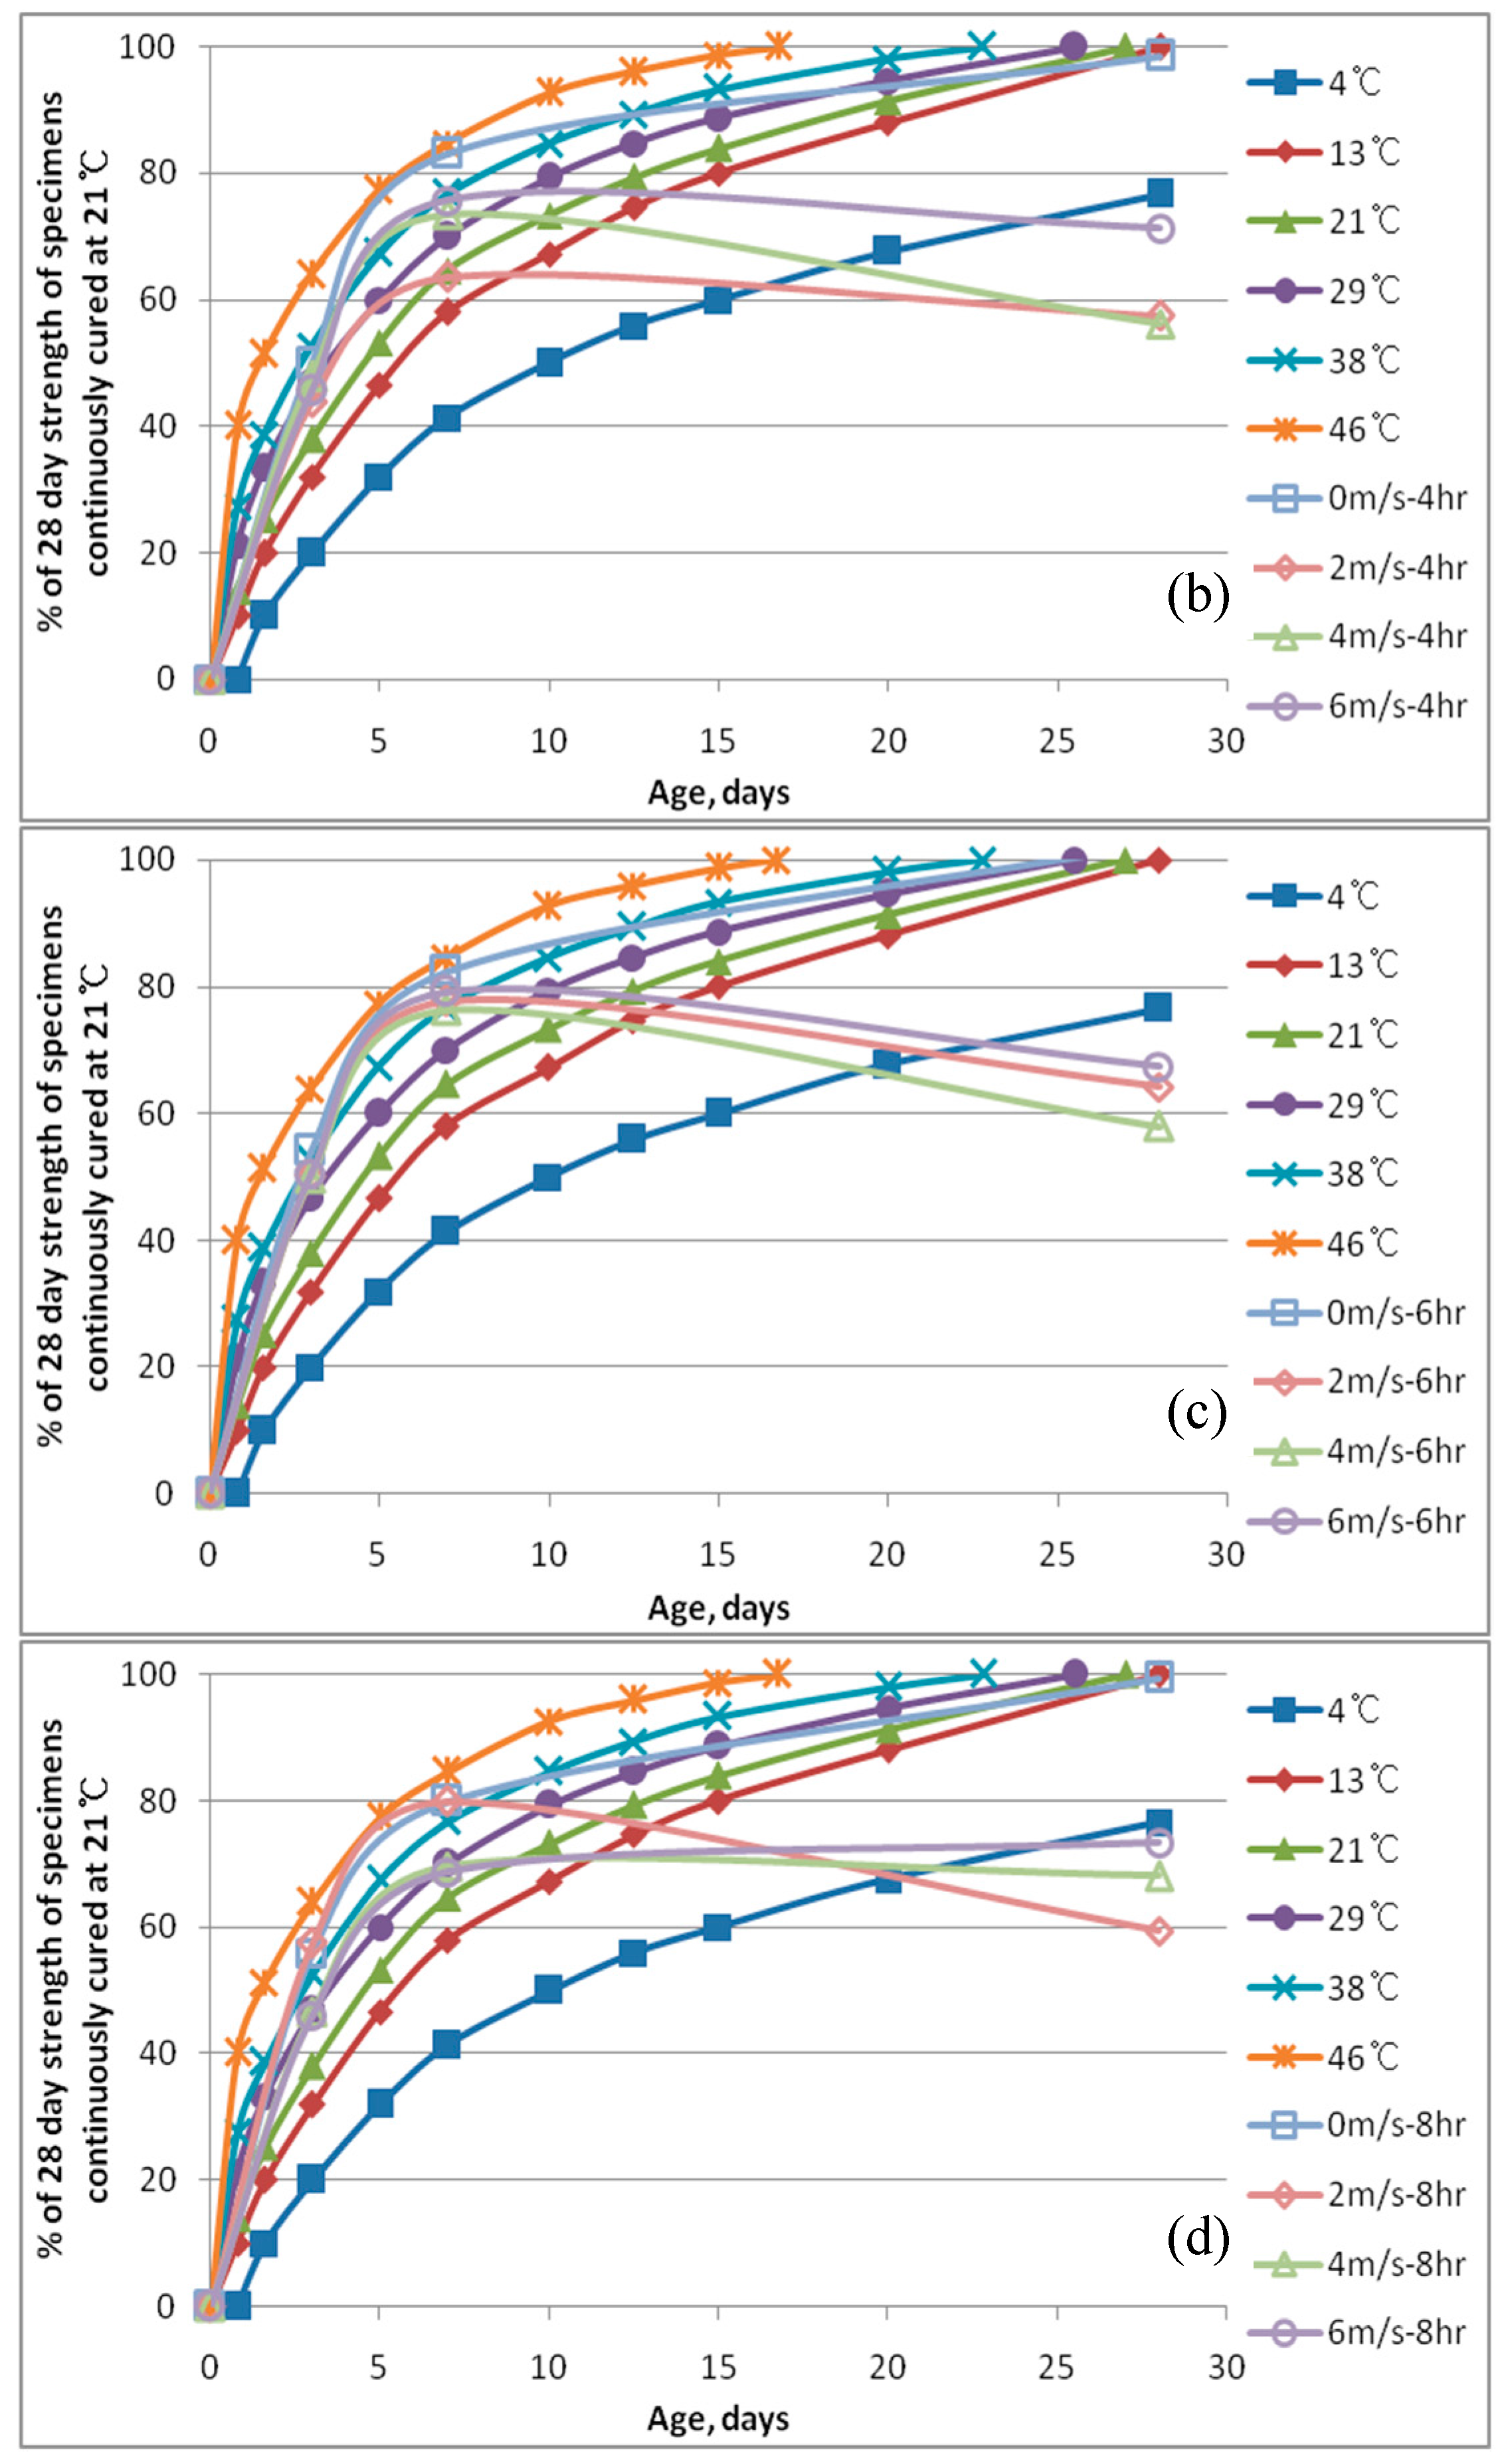
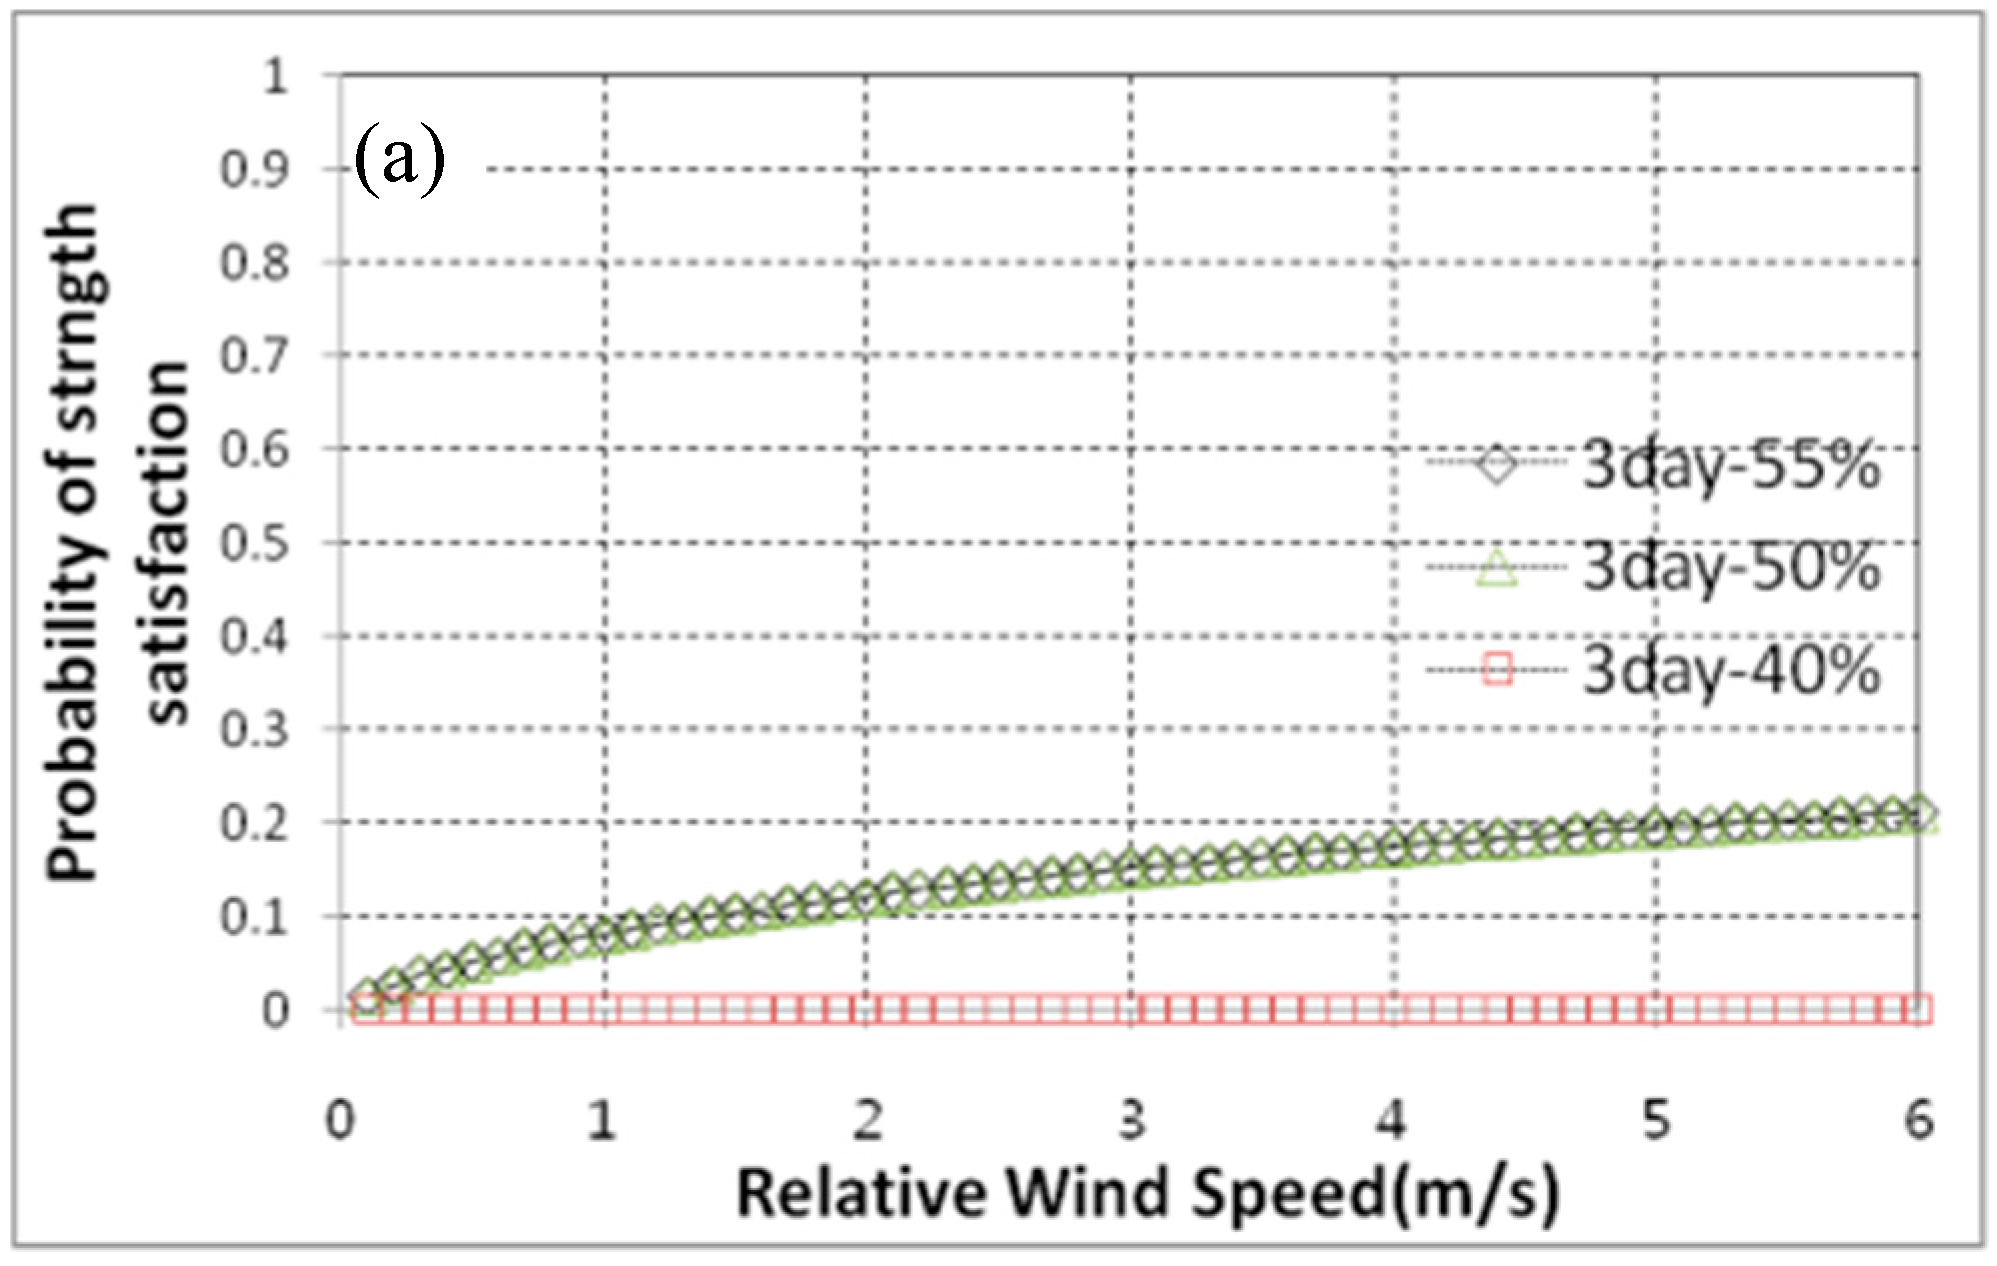
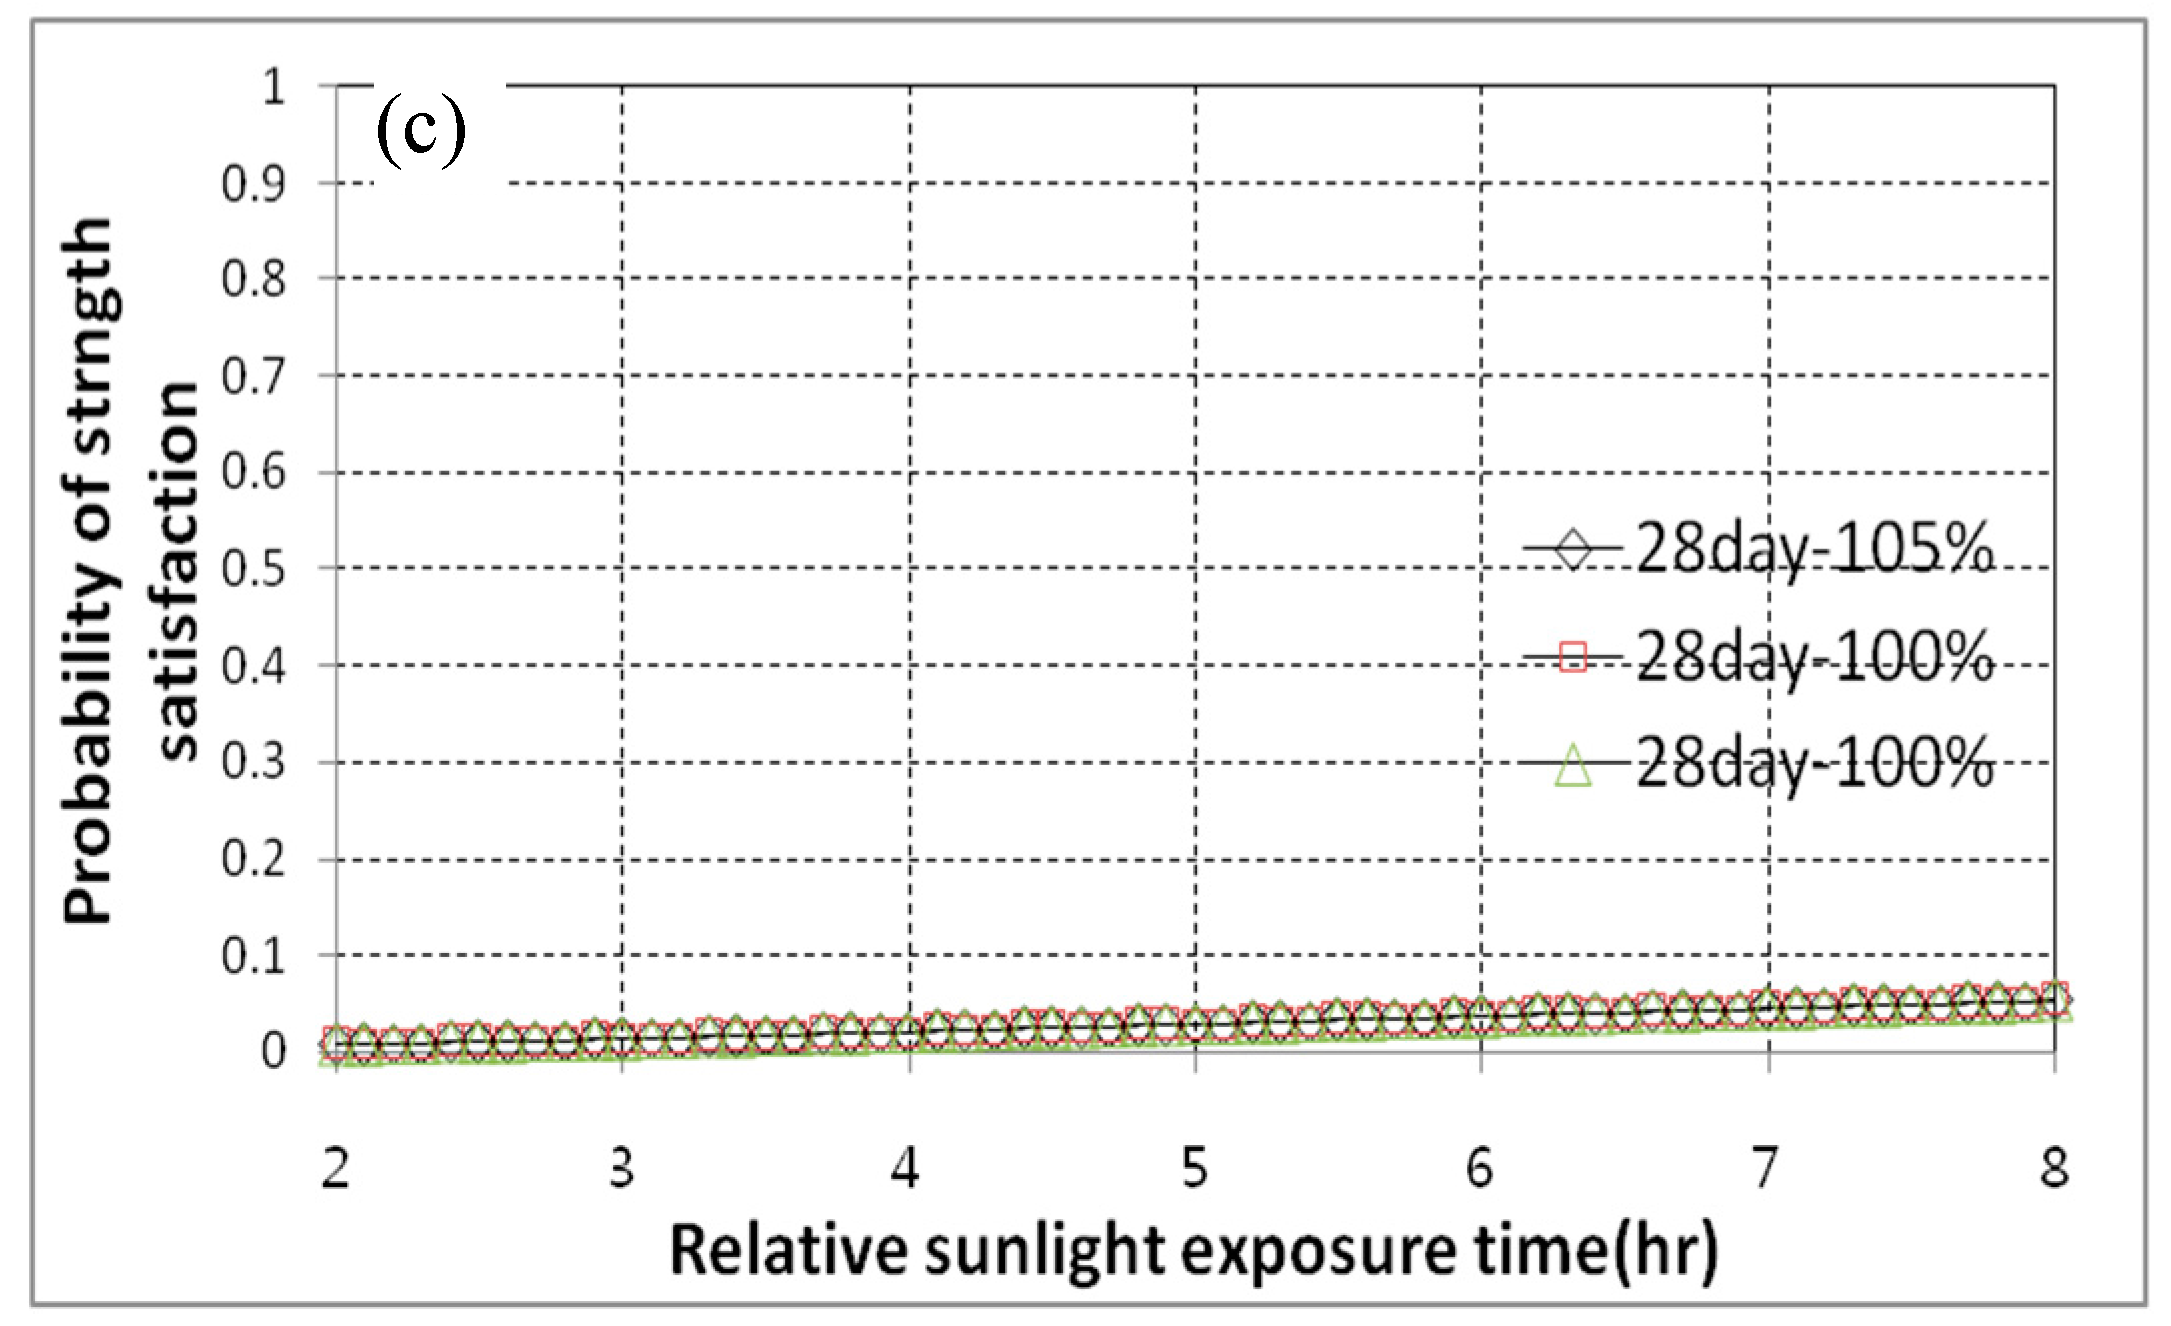
The compressive strength results obtained under various wind speed and sunlight exposure time curing conditions showed that ordinary seven-day strengths were obtained at wind speeds of 2, 4, and 6 m/s, while the 28-day strength declined. However, the 28-day strength obtained at a wind speed of 0.0 m/s was ordinary, indicating that the strength reduction can be attributed to moisture evaporation in the strong wind curing condition.
(4)
The comparisons of concrete strength development histories based on the curing temperature and relative humidity variations between the current and past works showed that the results from the current work are valid. Also, the results showed that curing condition variations of wind speed and sunlight exposure time can have significant effects on the concrete strength at the construction site.
(5)
Satisfaction curves are drawn from the strength test data of various temperature, relative humidity, wind velocity, and sunlight exposure time curing conditions. Also, the satisfaction curves drawn from the study results showed that performance based evaluation (PBE) is applicable to various construction site conditions based on the designer’s required criteria and climatic conditions.

Acknowledgments

This study was supported by the National Research Foundation of Korea (NRF) grant funded by the Korea government (MSIP) (No.2011-0030040), This work was supported (in part) by the Yonsei University Future-leading Research Initiative of 2014 (2014-22-0117).

Author Contributions

Tae Kyun Kim: A person who performed most of test and analysis works; a main writer of the paper.
Seung Jai Choi: A person who assisted the research and writing the paper.
Jang-Ho Jay Kim: A PI of the research project, who planned and developed the main idea of the study.
Byung Yun Kim: A consultant to the research work and writing of the paper.

Conflicts of Interest

The authors declare no conflict of interest.

References

  1. Korea Environment Institute (KEI). Concrete Specimen Subjected to Climate Change; KEI: Sejong, Korea, 2009. (In Korean) [Google Scholar]
  2. Kim, J.H.J.; Yi, N.H.; Phan, D.H.; Kim, S.B.; Lee, K.W. Development of Performance Based Resistance Capacity Evaluation Method for RC Compression Member under Vehicle Impact Load. J. Korea Concr. Inst. 2010, 22, 535–546. (In Korean) [Google Scholar] [CrossRef]
  3. Kim, J.H.J.; Phan, D.H.; Lee, K.S.; Yi, N.H.; Kim, S.B. Development of PBD Method for Concrete Mix Proportion Design Using Bayesian Probabilistic Method. J. Korea Concr. Inst. 2010, 22, 171–177. (In Korean) [Google Scholar] [CrossRef]
  4. Kim, T.K.; Choi, S.J.; Shim, H.B.; Ahn, T.S.; Kim, J.H.J. Satisfaction Curve Performance Based Design Method Evaluation of Concrete Specimen Subjected to Climate Change. Proc. J. Korea Concr. Inst. 2013, 25, 131–132. (In Korean) [Google Scholar]
  5. Korean Concrete Institute (KCI). Performance Based Design; KCI Report; KCI: Seoul, Korea, 2005. (In Korean) [Google Scholar]
  6. Jun, H.Y.; Kim, T.K.; Lee, S.W.; Kim, J.H.J. Application of Performance Based Mixture Design (PBMD) for Self Compacting Concrete. Proc. J. Korea Concr. Inst. 2011, 23, 571–572. (In Korean) [Google Scholar]
  7. Gibson, E.J. Working with the Performance Approach in Building; CIB State of the Art Report; CIB: Rotterdam, The Netherlands, 1992; Volume 64. [Google Scholar]
  8. Kim, J.H.J.; Phan, D.H.; Oh, I.S.; Lee, K.S. Development of Performance Based Mix Design Method Using Single Parameter Bayesian Method. J. Korea Concr. Inst. 2010, 22, 499–510. (In Korean) [Google Scholar] [CrossRef]
  9. Kim, J.H.J.; Phan, D.H.; Yi, N.H.; Kim, S.B.; Jeong, H.S. Application of the one-parameter Bayesian method as the PBMD for concrete mix proportion design. Mag. Concr. Res. 2011, 63, 31–47. [Google Scholar] [CrossRef]
  10. Kim, J.H.J.; Phan, D.H.; Kim, B.Y.; Choi, J.W.; Han, D.S. Development of Satisfaction Curves to Evaluate Concrete Mix Design Performance using a Bayesian Probabilistic Method. Constr. Build. Mater. 2012, 27, 578–584. [Google Scholar] [CrossRef]
  11. Phan, D.H.; Kim, J.H.J.; Yi, N.H.; You, Y.J.; Kim, J.W. Strength Targeted PBMD of HSC based on One-Parameter Bayesian Probabilistic Method. Adv. Concr. Technol. 2012, 10, 137–150. [Google Scholar] [CrossRef]
  12. Shinozuka, M.; Feng, M.Q.; Kim, H.; Uzawa, T.; Ueda, T. Statistical Analysis of Fragility Curves; Technical Report MCEER; Multidisciplinary Center for Earthquake Engineering Research (MCEER): Buffalo, NY, USA, 2001. [Google Scholar]
  13. Singhal, A.; Kiremidjian, A.S. Method for Earthquake Motion Damage Relationships with Application to Reinforced Concrete Frame; NCEER-97-0008 Technical Report; National Center for Earthquake Engineering Research (NCEER): Richmond, CA, USA, 1996. [Google Scholar]
  14. Singhal, A.; Kiremidjian, A.S. Method for probabilistic evaluation of seismic structural damage. J. Struct. Eng. 1996, 122, 1459–1467. [Google Scholar] [CrossRef]
  15. Singhal, A.; Kiremidjian, A.S. Bayesian updating of fragilities with application to RC frames. J. Struct. Eng. 1998, 124, 922–929. [Google Scholar] [CrossRef]
  16. Shinozuka, M.; Feng, M.Q.; Lee, J.H.; Naganuma, T. Statistical Analysis of Fragility Curves. J. Eng. Mech. ASCE 2000, 126, 1224–1231. [Google Scholar] [CrossRef]
  17. Ang, A.H.S.-S.; Tang, W.H. Probability Concepts in Engineering; Wiley: Hoboken, NJ, USA, 2006. [Google Scholar]
  18. Box, G.E.P.; Tiao, G.C. Bayesian Inference in Statistical Analysis; Addison Wesley: Boston, MA, USA, 1992. [Google Scholar]
  19. Ham, S.; Oh, T. Effect of Mixing and Placing in Hot Weather on Hardened Concrete Properties. Int. J. Concr. Struct. Mater. 2013, 7, 165–174. [Google Scholar] [CrossRef]
  20. Yazdani, N.; ASCE, M.; Manzur, T. Effect of Steam Curing on Concrete Piles with Silica Fume. Int. J. Concr. Struct. Mater. 2010, 4, 9–15. [Google Scholar] [CrossRef]
  21. Korean Standards Association (KSA). KSF 2405, Standard Test Method for Compressive Strength of Concrete; KSA: Seoul, Korea, 2010. [Google Scholar]
  22. Korean Standards Association (KSA). KSF 2423, Method of Test for Splitting Tensile Strength of Concrete; KSA: Seoul, Korea, 2006. [Google Scholar]
  23. Mehta, P.K.; Paulo, J.M.M. CONCRETE (Microstructure, Properties, and Materials), 3rd ed.; McGraw Hill: Columbus, OH, USA, 2006. [Google Scholar]
  24. Ranade, R.; Zhang, J.; Lynch, J.P.; Li, V.C. Influence of micro-cracking on the composite resistivity of engineered cementitious composites. Cem. Concr. Res. 2014, 58, 1–12. [Google Scholar] [CrossRef]
  25. Nobili, A.; Lanzoni, L.; Tarantino, A.M. Experimental investigation and monitoring of a polypropylene-based fiber reinforced concrete road pavement. Constr. Build. Mater. 2013, 47, 888–895. [Google Scholar] [CrossRef]
  26. Olaru, A.M.; Blümich, B.; Adams, A. Water transport in cement-in-polymer dispersions at variable temperature studied by magnetic resonance imaging. Cem. Concr. Res. 2013, 44, 55–68. [Google Scholar] [CrossRef]
  27. Lanzoni, L.; Nobili, A.; Tarantino, A.M. Performance evaluation of a polypropylene-based draw-wired fibre for concrete structures. Constr. Build. Mater. 2012, 798, 798–806. [Google Scholar] [CrossRef]
  28. Silva, E.R.; Coelho, J.F.J.; Bordado, J.C. Strength improvement of mortar composites reinforced with newly hybrid-blended fibres Influence of fibres geometry and morphology. Constr. Build. Mater. 2013, 40, 473–480. [Google Scholar] [CrossRef]
  29. Millogo, Y.; Morel, J.C.; Aubert, J.E.; Ghavami, K. Experimental analysis of pressed adobe blocks reinforced with Hibiscus cannabinus fibers. Constr. Build. Mater. 2014, 52, 71–78. [Google Scholar] [CrossRef]
  30. Ali, M.; Chouw, N. Experimental investigations on coconut-fibre rope tensile strength and pullout from coconut fibre reinforced concrete. Constr. Build. Mater. 2013, 41, 681–690. [Google Scholar] [CrossRef]
  31. Ramli, M.; Kwan, W.H.; Abas, N.F. Strength and durability of coconut-fiber-reinforced concrete in aggressive environments. Constr. Build. Mater. 2013, 38, 554–566. [Google Scholar] [CrossRef]

