1. Introduction
The PV generation system has been used widely since the 1990s and it has become one of the most popular renewable generation systems. Due to the technological advancement in the PV generation and the enlargement of the PV market, the PV market in 2009 alone showed an increase of nearly 30 to 40 percent [
1,
2].
The module, a key component in the PV system, transfers solar energy into electric power. Since the lifespan of a module is estimated at 20 to 30 years [
3], many end-of-life systems will inevitably emerge in the near future. In consequence of the problem of increasing end-of-life systems, many studies in the past have been dedicated to safely discarding these modules. Most importantly, some studies emphasized the importance of eco-friendly PV systems as a renewable power source [
4]. This included the process of measuring their environmental impacts during all life cycle steps and minimizing them. From these studies, recycling PV systems has gained popular support as a way of disposing the end-of-life systems.
Recycling PV systems has both environmental and economic benefits. In recycling PV systems, hazardous and noxious substances such as cadmium, tellurium, lead, and selenium can be prevented from leaking by careful handling. In addition, rare metals and valuable materials including indium, gallium, and silicon can be extracted for manufacturing processes or as products [
5]. While the economic preoccupation is the major barrier in most of studies on green procurement [
6], expensive materials included in the PV system may be worth recycling. However, the recycling costs and the economic benefits are different among the types of PV systems, since only some of them contain expensive raw materials [
3]. Also, firms looking to operate their own recycling facility may face some risks. Since the average lifespan of a PV system is quite long and differs among various types, the economic benefits of recycling (may not be significant enough for the firms) would fall short of the firm’s expectation if the number of end-of-life systems increases slowly.
In addition to social expectations, PV system manufacturers also hold legal responsibilities in handling end-of-life modules properly. In 2012, EU declared end-of-life PV modules to be waste electrical and electronic equipment (WEEE) [
7,
8]. Consequently, European PV system manufacturers organized the PV Cycle, a PV system recycling association, in which end-of-life modules of all the organization members are recycled together. As well, the largest CdTe PV system manufacturer, First Solar, built its own recycling facilities in all their manufacturing factories. In the each facility, both scraps and end-of-life modules can be recycled.
However beneficial recycling PV systems can be, the recycling method, whether it is internal or external recycling, must be decided on carefully. Profits and costs of recycling, as well as the differences between the types of PV systems, including their lifespan, and other factors in the manufacturer’s supply chain, must be taken into account. This study analyzes three cases of PV system recycling with diagrams of their closed-loop supply chains. The mathematical models are designed to minimize the manufacturer’s total cost and to find the optimal solution on the amount of raw material supplied, the amount of products and materials recycled, the recycling facility scale, and the potential benefits or downfalls of joining a recycling association.
The research procedure is presented as follows. In section 2, previous research on PV system recycling and their life cycle analysis are reviewed. The differences between our study and the previous research are also noted. In section 3, three cases of PV system recycling, Deutsche Solar, Fist Solar, and PV Cycle, are analyzed from the view of the supply chain and are compared. Mathematical models on supply chain planning are developed in section 4 based on the analysis. In section 5, an experimental example is conducted to verify the supply chain planning models and meaningful conclusions are drawn from them.
2. Literature Reviews
2.1. PV Module Recycling
Researches on PV module recycling are divided into research focusing on recycling methods and research which analyze economic or environmental values of recycling.
Fthenakis [
9] studied various recycling methods related to PV systems. In his study, PV systems are considered as electronic products. At first, the author analyzed detailed recycling processes of electronic communication devices and NiCd. After, the author analyzed the possibilities and limitations of applying two methods to recycle PV systems. As a result, the author suggested different short-term and medium-and-long-term approaches. The short-term strategy was suggested for small numbers of end-of-life PV systems that could be handled in centralized recycling centers where electronics are mainly recycled. In contrast, the medium-and-long-term strategy suggested a decentralized approach where only PV systems are recycled. For both strategies, the author suggested detailed collecting and recycling steps.
In McDonald and Pearce’s research [
3], current PV system recycling protocols are examined and the profitability of three types of PV systems are compared (x-Si, CdTe, and CIGS) based on five core materials (silicon, indium, gallium, cadmium, and tellurium). The results showed that only CIGS makes a huge profit if it is recycled since semiconductor materials can be extracted and sold to the second market. Recycling CdTe and x-Si PV systems, however, results in higher cost than profit. Therefore, the study concluded that it would be better to recycle PV systems supported by suitable government policies considering different types of PV systems than to enforce recycling by law.
Choi and Fthenakis’s researches [
10,
11] developed mathematical models focusing on recycling CdTe and c-Si PV systems, respectively. These models determined the optimal number of recycled systems to minimize total cost. Exceptionally, they subdivided recycling processes and applied them to the mathematical models. In doing so, it was possible to obtain the amount of recycled and disposed materials in each recycling step. However, they did not consider reusing extracted materials in manufacturing, which may influence the firm’s plan on raw material buying.
2.2. PV Module Life Cycle Analysis(LCA)
Researches on PV system life cycle analysis (LCA) focus on how PV systems influence the environment during their entire life cycle. These researches divide PV system life cycles into detailed steps and investigate their impacts on environmental contamination.
In Fthenakis’s research [
12], the life cycle of CdTe PV system was classified into several steps: mining raw material (cadmium and tellurium), manufacturing CdTe PV system, operating for generation, and disposal and recycling. The environmental impact was analyzed at each step. This study especially focused on cadmium, a heavy metal particularly famous for the Itai-itai disease, and quantified the amount of cadmium leaking. Conclusively, the discovered amount of cadmium leaking into the air was 0.02 g/GWh, which is no cause for concern.
Kim et al. [
13] analyzed CdTe PV systems according to four environmental factors, including global warming potential, fossil fuel consumption, energy payback time, and CO
2 payback time, and then converted them into CO
2 emission measure. The research also analyzed other types of PV systems such as x-Si and CIS and compared their environmental impacts with CdTe. The result showed that CO
2 emission quantity during the lifecycle of CdTe is the smallest among all types of PV systems.
Sinha [
14] analyzed the amounts of materials and energy consumption in manufacturing, collecting, and recycling process of CdTe. After, the author carried out an experimental case that presented a strategy to minimize the amount of water used in each life cycle step.
3. Closed-loop Supply Chains of PV Systems
In this study, three cases of recycling PV systems are used to reflect the characteristics of the closed-loop supply chains of PV system. Deutsche Solar, First Solar, and PV CYCLE are carefully chosen based on what this study intends to analyze. Both Deutsche Solar and First Solar operated internal recycling centers. However, only First Solar still uses this method. Therefore, a good comparison can be made between their closed-loop supply chains to figure out why one company could operate the recycling centers successfully and the other could not. The third case is about PV Cycle, a recycling association that consists of European PV system manufacturers. The members of PV cycle use an external recycling method, whereas the previous two cases adopt an internal recycling method.
3.1. Closed-loop Supply Chain of Deutshe Solar (in 2003)
Deutsche Solar AG, a German PV system manufacturer, produces c-Si modules and sells them in Europe, mainly in Germany. They collected end-of-life solar systems from customers and were recycling them since 2003. However, as the recycling policy was found to be economically inefficient, they discontinued the recycling process. After merging with SolarWorld AG, they have been collecting and recycling end-of-life solar systems with a Business Unit of Deutsche Solar AG.
c-Si PV systems, known as the first generation of PV modules, are produced through three steps. At first, silicon ingots are cut into wafers, where some silicon slurries and scraps are made. Next, PV modules are manufactured by attaching glass and the conductor to the wafers to transfer solar energy into electronic power. At last, the balance of system (BOS) is attached to the modules, which is composed of aluminum for the edge and copper for the wires, and PV systems are produced. Scraps generated in the manufacturing processes are sent either to the recycling facility or to disposal.
Recycling steps for c-Si PV system are categorized into disassembly, thermal treatment, separation, and chemical treatment [
11,
15] as shown in
Figure 1. If a new end-of-life module comes, the junction box is separated from the system and sent to an electronic scrap waste treatment company. After this manual disassembly process, the other parts pass through thermal treatment with high temperature to eliminate the laminate and to burn off the plastic. In the automatic separation process, aluminum, silicon, and other metals are separated and sent to different ways. In the case of aluminum, it can be recycled and put into the manufacturing process for reuse. Glass, copper, and silicon can be sold to external recycling companies for additional treatment. Other materials, however, cannot be extracted from the recycling process with current technology and are disposed.
3.2. Closed-loop Supply Chain of First Solar
First Solar is a U.S. firm that manufactures CdTe PV systems and has the highest market share in CdTe PV market. It produces CdTe PV systems and sells them globally. Most of its production bases are in North America and some of them are in Germany and Malaysia. In First Solar, every production base has its recycling facility so that scraps from the manufacturing process and end-of-life solar systems can be recycled.
CdTe manufacturing process can be divided into three major steps: manufacturing CdTe modules, manufacturing power conditioning system (POS), and combining them with balance of systems (BOS) to form PV systems [
13]. Scraps made during the processes are sent to the recycling facility, while end-of-life solar systems are collected from customers and recycled at the nearest production base.
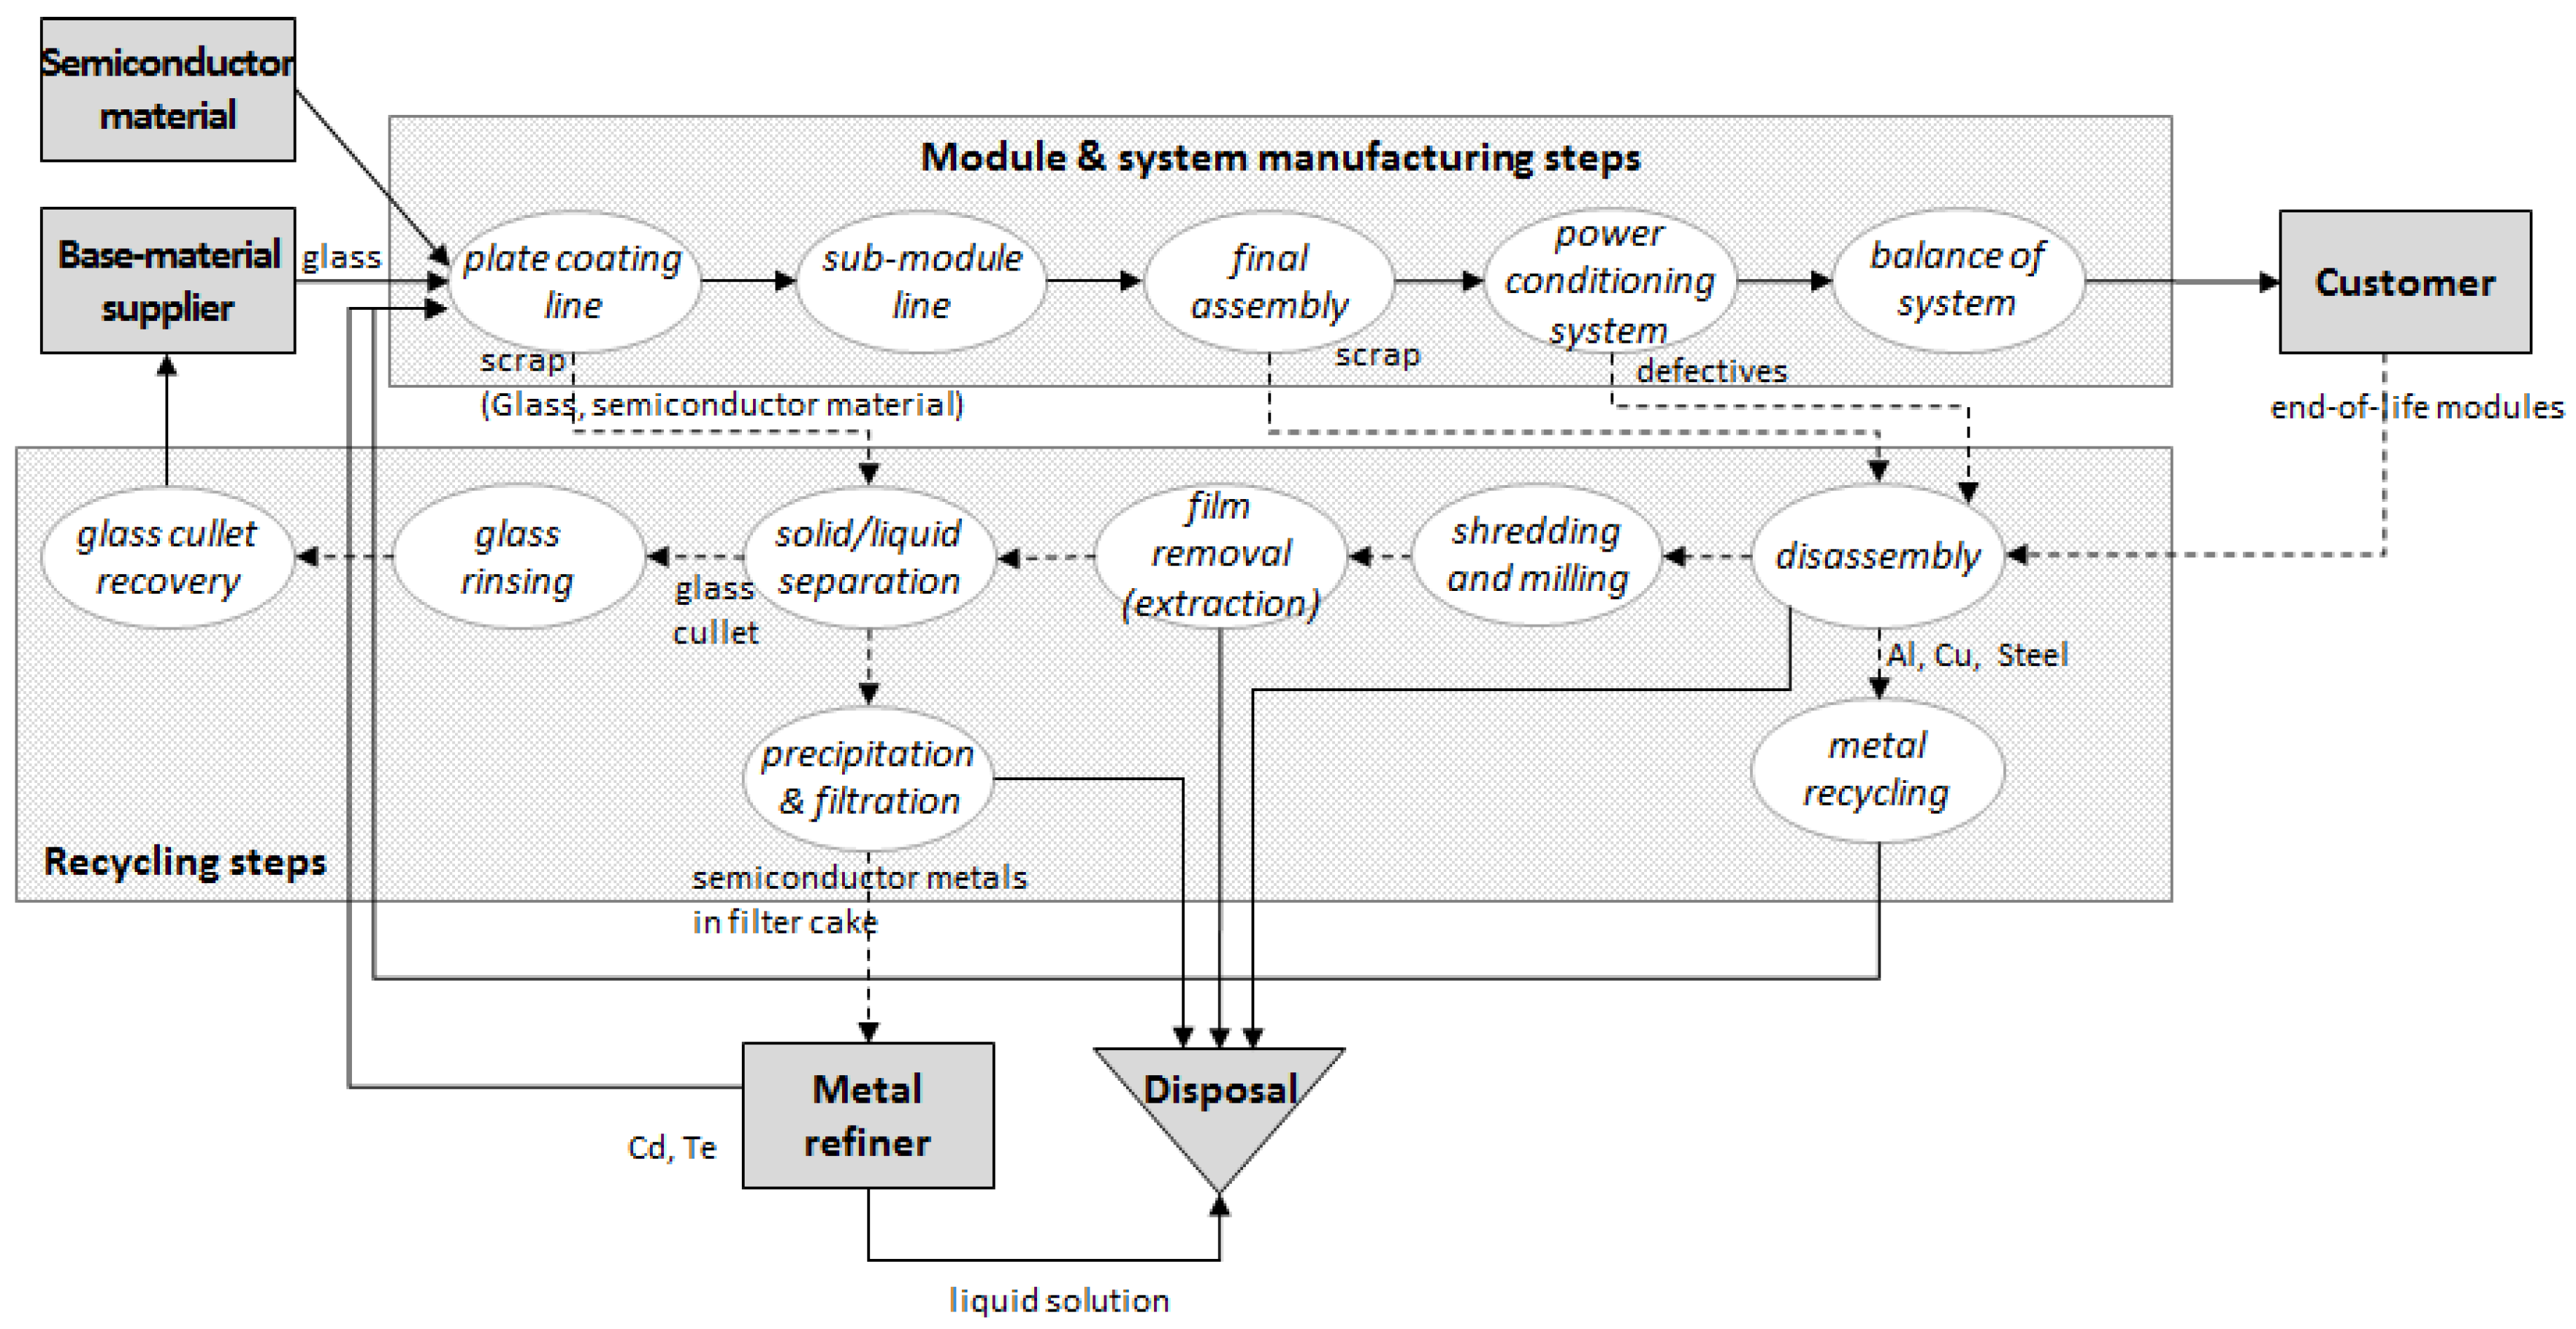
Recycling steps include shredding and milling, extraction (film removal), solid/liquid separation, glass rinsing, and precipitation and filtration [
16]. Firstly, scrap and end-of-life systems are carried into the recycling facility and disassembled roughly to separate BOS and POS. Afterwards, module parts are first broken down during the shredding and milling process, then the films are removed physically and chemically in the extraction process. Solid matter such as glass is separated from liquid and sent to the glass recycling process. In contrast, separated liquid that contains various semiconductor materials is transformed into filter cakes through the precipitation process. The filter cakes are sent to external metal refiners and go through additional recycling processes [
16,
17]. Detailed manufacturing and recycling steps as well as the materials from each step are represented in
Figure 2.
In First Solar, the cost associated with the recycling process is added to the price of the PV system. Thus, customers not only pay for the PV system, but also pre-pay its recycling fee. This price policy helps First Solar with its economic efficiency to operate their recycling facility. However, recycling facilities are operated mainly for scrap since the number of end-of-life solar systems is still low.
3.3. Closed-Loop Supply Chain of a PV CYCLE Member
As PV systems spread in Europe, European PV manufacturers organized a recycling association, PV Cycle, in 2010. PV Cycle collects end-of-life solar systems at 91 bases in 27 countries in EU and recycles them in Germany.
Figure 3 represents the closed-loop supply chain of a PV Cycle member. As shown in the figure, a member of PV Cycle only takes care of the forward flow in the supply chain, which includes buying raw materials, manufacturing, and selling. The backward flow, such as collecting and recycling, is handled by PV Cycle. Therefore, contrary to Deutsche Solar and First Solar, a member of PV Cycle can neither resell valuable materials from recycling nor reuse them for manufacture. In addition, PV Cycle only deals with end-of-life solar systems, so members have to find their own way to dispose of the manufacturing scrap.
Table 1 summarizes closed-loop supply chains of Deutsche Solar, First Solar, and PV Cycle. Deutsche Solar and First Solar, who have their own recycling systems, cannot ignore the operational and processing cost and spend money only on recycling. However, in extracting and reusing raw materials by recycling, they do not need to buy the materials from suppliers, lowering the overall cost. Recycling also helps the company cope with fluctuations in raw material price and the variation in supply lead time. Therefore, the reusing process can be considered as a stable supply source.
PV Cycle members must also pay a membership fee every year although there is no cost associated with operating the recycling facility. Additionally, PV Cycle does not cover the cost of recycling manufacturing scrap, which leave the members responsible for planning on how to properly dispose of the scrap. Also, it is impossible for the members to obtain information about extracted materials, so they cannot enjoy the benefits of reusing raw materials.
4. Mathematical Modeling
This study develops closed-loop supply chain planning with a mixed integer-linear programming model to minimize the total cost for PV system manufacturers. Decision variables in the model include the amount of raw material purchased, the number of scraps and end-of-life solar systems recycled, the amount of raw material sent for additional treatment, the capacity level of the recycling center, and whether the manufacturer joined external recycling unions. Indices, parameters, and variables used in the model are presented in the Appendix.
In this study, it is assumed that demands of PV systems during the entire planning period were known, and that the number of PV systems produced and sold to the customers in that period matches the number of demands for the product. Therefore, in this model, the inventory and the backorder of the products are not considered. In addition to the demands, it is assumed that the number of end-of-life modules during a certain period is also known. In each type, only one size is considered. Scrap is produced at a fixed rate of manufacturing volume. End-of-life systems can be stored as an inventory or can be recycled (or disposed) immediately, whereas manufacturing scrap cannot be stored and must be treated right away. The raw material extraction ratio is dependent on the type of PV system that is recycled. Extracted materials can be put through the manufacturing process during the next period, sent outside for additional treatment, or sold to the second markets. Lastly, lead time is not considered in all processes.
4.1. Supply Chain Planning with Internal Recycling
A supply chain planning model with an internal recycling policy requires all variables introduced in the Appendix except joining external recycling associations.
Figure 4 shows the decision variables used in the internal recycling model in case of a c-Si module.
The objective of the supply chain planning model is to minimize the total cost for the manufacturer. Since manufacturers operate the internal recycling facilities, the total cost they have to pay includes the cost of raw materials from suppliers, collecting and storing end-of-life solar systems, recycling, sending them to external sources for additional treatments, and operating the recycling facilities. The objective function can be represented as follows:
It is followed by constraints to satisfy conditions for each life cycle step.
Equation (2) shows that raw materials supplied at period t should be more than the demand at the period subtracted by the amount of raw materials extracted from the recycling process during the previous period. Equation (3) limits the total amount of materials recycled and disposed at period t is the sum of that from manufacturing scrap and that from product recycling processes. Equation (4) shows the balance equation for inventory in recycling facilities and the sum of scrap and end-of-life systems. As it is assumed that scrap at period t must be recycled or disposed in the period, Equation (5) supports that the amount of recycled materials cannot be lower than the amount of material scrap. Equations (6) and (7) represent the amount of materials sent for additional treatment and the materials reused in the manufacturing process, respectively. Equation (8) and (9) limit the recycling capacity and the inventory capacity of the recycling facility, respectively. Equation (10) describes that the recycling facility cannot be downsized but must be maintained or expanded. Equation (11) calculates the total amount of pollutant and Equation (12) limits it. Finally, Equation (13) states that all variables must be non-negative.
In terms of the mathematical models, the supply chain planning model of CdTe is the same as the c-Si module. However, as far as parameters and indices are concerned, there are a few differences between the two models. Firstly, the manufacturing processes of d-Si are summarized into three major steps of which the outputs are cells, modules, and PV panels, respectively. On the other hand, for CdTe, the manufacturing process is different because the outputs of each step are modules and PV panels. As a result, the index referring cell, , is excluded in the CdTe model. Secondly, for c-Si, extracted materials are directly sent for manufacturing to be reused. However, semiconductor materials such as cadmium and tellurium can only be reused after external metal refiners refine them. Therefore, in the CdTe model, materials sent to external sources can be turned back into the model.
4.2. Supply Chain Planning with External Recycling
If the manufacturer joins an external recycling association, the supply chain planning model should be modified in terms of the objective function, decision variables, and constraints.
Figure 5 shows the decision variables revised for external recycling policy.
The external recycling policy eliminates EOL inventory and costs associated with recycling processes, additional treatment, and recycling facility operation. Still, the company must consider the aspects of buying raw materials and disposing of scrap. The company does not need to pay for collecting and disposing end-of-life solar systems while it is a member of the recycling association.
After the manufacturer becomes a member of the recycling association, the manufacturer must pay a membership fee every year. Within the membership period, the association collects and recycles end-of-life solar systems for its members. Therefore, the manufacturer is not responsible for the costs associated with the entire recycling process.
The objective function of the supply chain planning model for manufacturers with external recycling is represented in Equation (14):
Constraints should be revised in this manner.
First of all, with external recycling, it is impossible for the manufacturer to reuse extracted materials so the amount of raw materials bought from suppliers is only dependent on the demand and process yield ratio. Therefore, Equation (2) is modified to be Equation (15).
With external recycling, all scrap is sent to disposal. Thus, Equation (3) is modified as in Equation (16).
End-of-life solar systems are also sent to disposal until the manufacturer joins the recycling association. Therefore, Equation (17) replaces Equation (4).
This study focuses on when a manufacturer joins the recycling association in the external recycling model so withdrawal from the association is not considered. Therefore, Equation (18) is added to the mathematical model.
For the external recycling model, other constraints, except for the constraints above and the non-negativity constraints, are excluded from the internal recycling model.
5. Experimental Analysis
5.1. Input Data
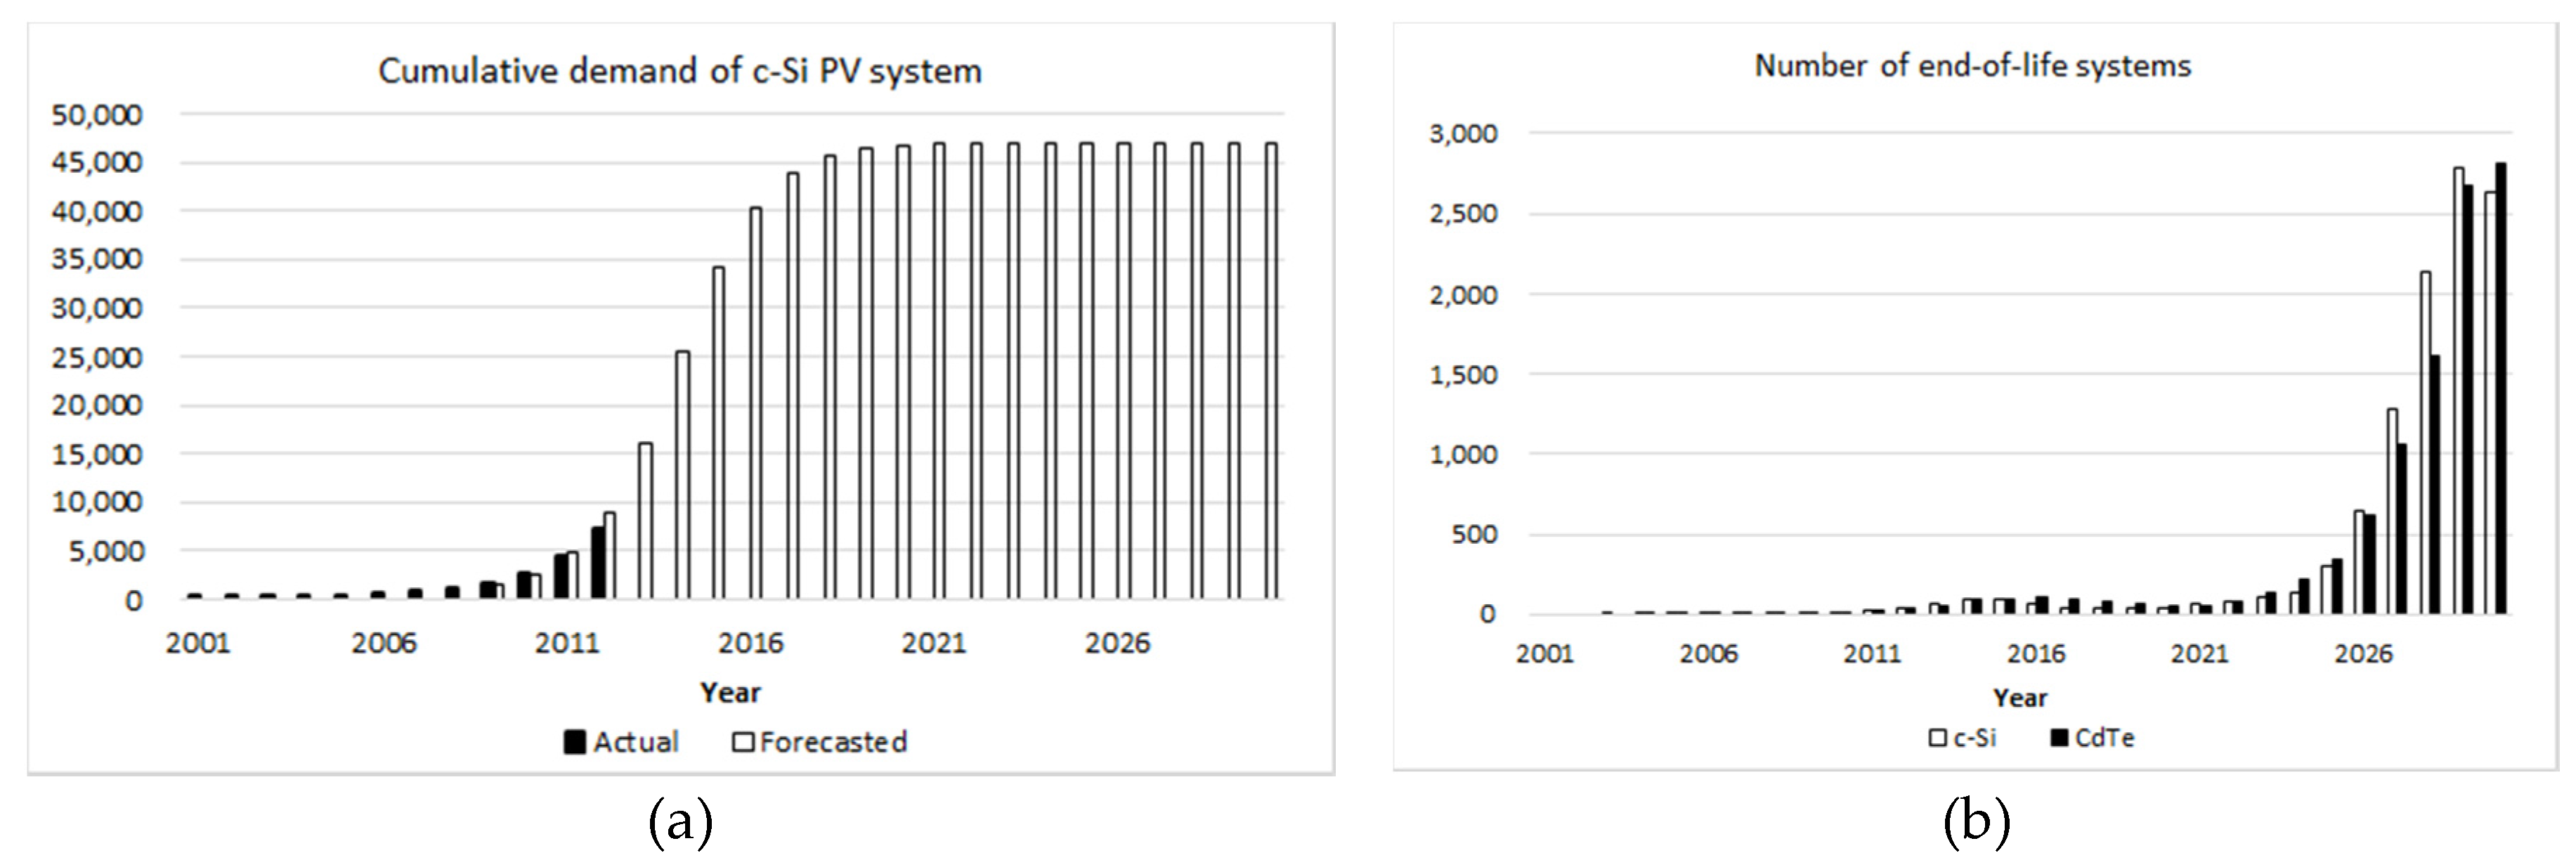
In this model, it is assumed that the demands and the number of EOL in the entire planning period, 30 years since 2001, are already known. In regards to demand, however, only the historical demand data before 2013 could be acquired so data after 2013 was forecasted using previous data. The study was carried out under the assumption that the PV system follows the diffusion process that Bass [
18] and Mahajan et al. [
19] proposed, and the process was used to forecast the future demand of the PV system. The results are shown in
Figure 6a.
Since the PV system has a long lifespan, research on end-of-life solar panel, including the number of end-of-life solar panels that arise in a year, cannot be clearly investigated yet. Therefore, the number of EOL was also carefully estimated. Lifespan expectancy of a PV system is usually calculated at 25–30 years [
3]. However, as the planning period in the model is set to 30 years, it is assumed that some of the PV systems installed were replaced due to defects. More specifically, it is assumed that 1% of total PV systems are replaced in their first year and that 30% of total PV systems are replaced after 15 years from the installation. Estimation on the number of end-of-life PV system is shown in
Figure 6b.
The amount of scrap from the manufacturing processes is directly proportional to the number of products manufactured in the process. Therefore, it is assumed that the process yield is fixed during the entire period.
With the number of demands and the number of EOL, the price of raw materials in the planning horizon is also deterministic. The price of raw materials after 2013 was acquired from the linear approximation method using data from 2001 to 2012. Whereas the price of raw material in the main experiment is assumed to increase linearly, the price of some high-priced raw material in the sensitivity analysis is assumed to increase more rapidly.
The amount of raw materials required to produce a unit of product were acquired from the study of Fthenakis et al. [
20], which is summarized in
Table 2. Not all materials in the table can be extracted in the recycling process. Whether a material must go through additional treatment, can be reused in the manufacturing process, or sold to the second market depends on the type of raw materials. The extraction ratios and the information on whether the materials are sold or reused were obtained from the study of Zhang et al. [
21] and are shown in
Table 3.
5.2. Results
5.2.1. Supply Chain Planning with Internal Recycling
First of all, results from the supply chain planning with internal recycling of c-Si were compared to those of CdTe.
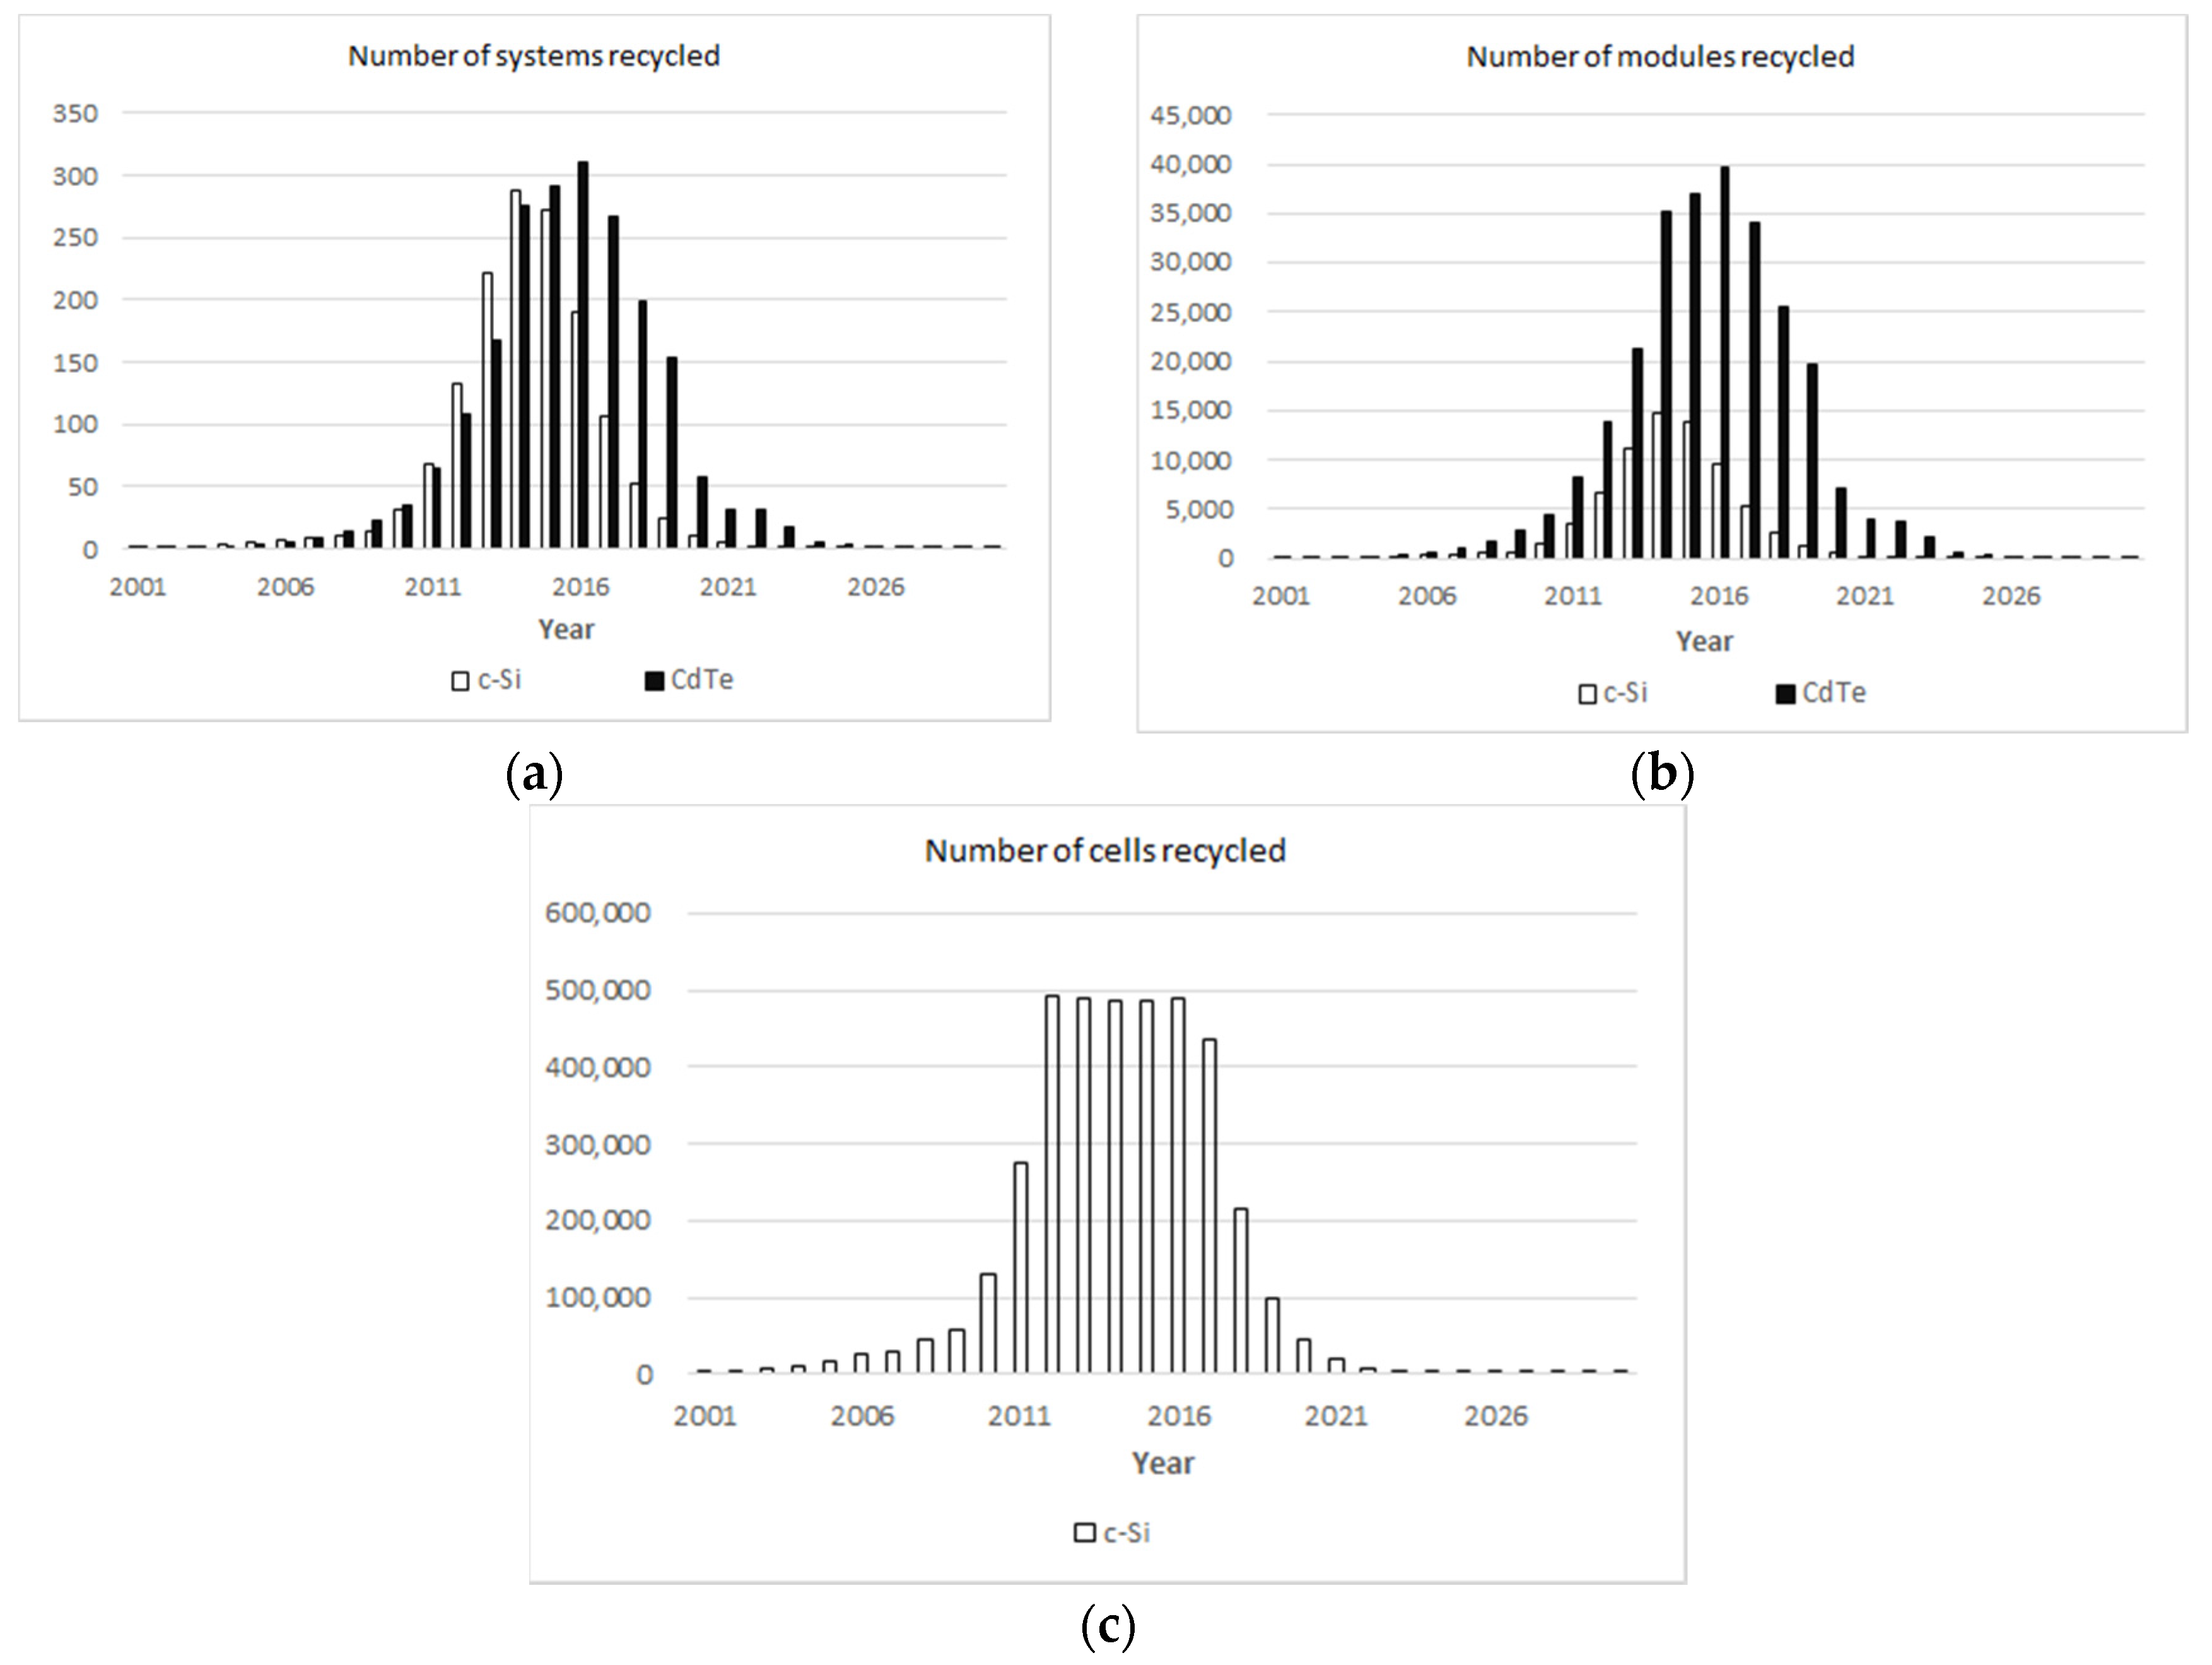
Figure 7 shows the number of systems, modules, and cells recycled in the entire planning horizon. The number of recycled PV systems is dependent on the number of scraps in both cases. With CdTe, most modules that are dismantled from the PV system recycling process are also recycled. On the other hand, some c-Si modules and cells are disposed of, instead of being recycled. This is due to the high-valued raw materials that are in both modules and the balance of systems of CdTe. Since manufacturers can acquire expensive raw materials from them, it is beneficial to recycle. Also, since the customers pay for the recycling cost of CdTe when they purchase the systems, it reduces the manufacturer’s burden from recycling.
Figure 8 shows the number of aluminum and cadmium that are reused after they are extracted from the recycling process. The amount of aluminum reused to manufacture c-Si PV system is higher than the amount used to manufacture CdTe PV systems since c-Si systems contain more aluminum than the CdTe systems. For the same reason, the amount of cadmium reused in CdTe is higher than the amount reused in c-Si. In addition, steel, copper, and tellurium are also reused from CdTe recycling.
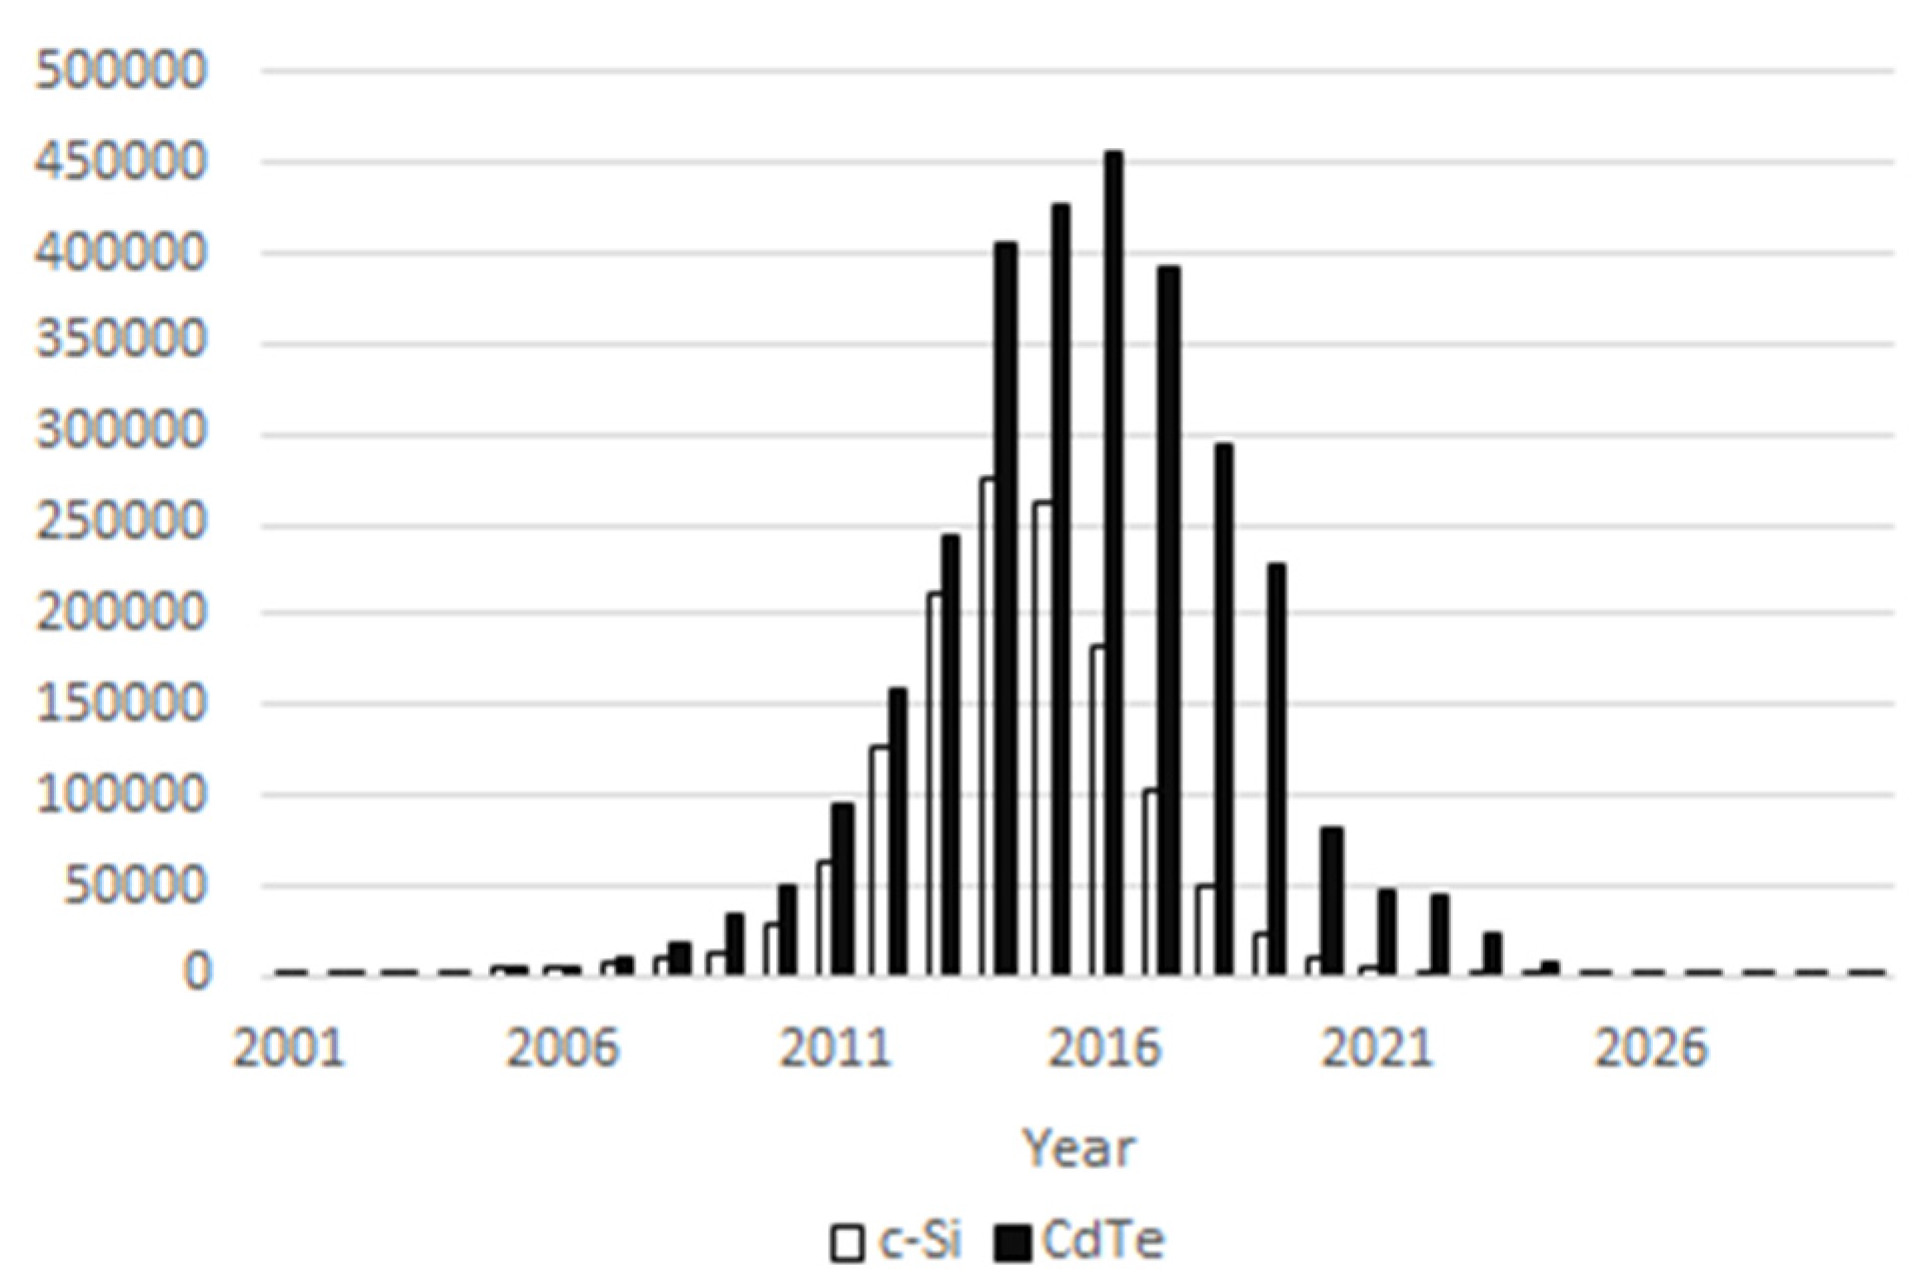
In both cases, among the raw materials, only glass is resold to the second market.
Figure 9 shows the amount of glass in c-Si and CdTe that is sold to the second market. A unit of c-Si module contains 16.1 kg of glass, which is more than 7.098 kg in a CdTe module. However, as more CdTe modules are recycled, more glasses are sold in the supply chain planning model of CdTe, which is shown in
Figure 9.
In the experiment, neither the supply chains of c-Si nor those of CdTe expands their recycling capacity. In both cases, the demand decreases after half of the planning period, and in consequence, end-of-life PV systems during the latter half period are usually not recycled, but are rather stored as inventory or disposed of.
5.2.2. Supply Chain Planning with External Recycling
The second experiment focuses on how external recycling policies affect the manufacturer’s supply chain planning. The second model works under the assumption that there are no internal recycling facilities and the firm has to dispose both scraps and end-of-life systems before it gains a membership in the recycling association.
Table 4 represents the optimal total cost of the internal recycling model and the external recycling model for both c-Si and CdTe. Compared with c-Si, the optimal total cost of CdTe PV systems is higher since CdTe requires high-priced raw materials such as gallium, indium, and tellurium. However, under the same conditions, an option for external recycling incurs less cost than operating the recycling facility internally.
However, if all scraps and end-of-life systems are recycled by the external recycling association instead of by the manufacturer, the total cost for c-Si is reduced by more than half, 55.28%. A CdTe manufacturer could save 2.28% of the total cost if the manufacturer chooses outsourcing recycling process. This result supports the view that the utility of operating a c-Si recycling facility is much lower than that of operating CdTe. Few valuable materials can be acquired from c-Si recycling while the operating cost is high. Therefore, it is more beneficial to outsource end-of-life systems to the recycling association and to dispose of manufacturing scrap in all cases.
5.2.3. Sensitivity Analysis
In consequence of the long lifespan of PV systems, the number of end-of-life PV systems increases rapidly after two thirds of the entire planning horizon in previous experiments, as shown in
Figure 6b. This assumption might impact the firm’s supply chain planning in which scraps play an important role in deciding on a recycling plan. In this section, the failure rate was increased from 1% to 9% to show how end-of-life systems influence supply chain planning, especially the firm’s recycling plan. Failure rates used in the sensitivity analysis are 1%, 3%, 5%, 7%, and 9%.
Figure 10 shows the number of end-of-life c-Si systems calculated from the failure rates. The total costs with five different failure rate are represented in
Figure 11. In both cases of c-Si and CdTe, the total cost increases as the failure rate increases, which supports that how many scraps occur in the manufacturing process is one of the most influential factors in the supply chain planning with the internal recycling policy.
One of the economic benefits in recycling PV systems is stabilizing the raw material procurement process by extracting from recycling and reusing the materials.
Figure 9 shows that on average, 8.7% of aluminum is reused in c-Si manufacturing and 5.3% of aluminum is reused in CdTe. The reusing ratio of cadmium and tellurium is 11.2% which is higher than that of aluminum. In the previous experiment, it was assumed that raw material prices increase linearly. Therefore, we changed the assumption as the prices of aluminum, cadmium, and tellurium increase exponentially, which represents that price of raw material increases more rapidly, and how this change influences on the results.
As shown in
Table 5, whether the prices of aluminum and tellurium follow an exponential or a linear increase barely affects the reusing ratio. In contrast, as tellurium price follows an exponentially increasing trend and its average price becomes much higher, the reusing ratio of tellurium increases from 11.2% to 16.3% This is because tellurium price is higher than other materials so its price change affects the firm’s supply chain planning, including the recycling plan.
6. Conclusions
Numerous end-of-life PV systems will surface in the near future, so it is necessary to analyze and compare different recycling policies considering the different types of PV systems, raw material price change, and the various costs that are associated with recycling and disposal. This study analyzed three examples of recycling policies: c-Si recycling by Deutsche Solar (in 2003), CdTe recycling by First Solar, and PV Cycle, a recycling association. Their structures were presented as closed-loop supply chains. After comparing the supply chains, three supply chain planning models were formulated to minimize the total cost for manufacturers. Mathematical models were also designed in this study to decide (find the optimal balance based on) the amount of raw materials supplied, the number of scraps and end-of-life systems that are recycled or sent outside, the size of the internal recycling facility, and the external recycling association membership of the manufacturer. Additionally, experimental examples were presented in reference to previous research on PV system recycling and its life cycle analysis.
The results showed that if the manufacturer operates an internal recycling facility, for both c-Si and CdTe, the recycling process will be focused on scrap from the manufacturing process. Especially in the case of c-Si, recycling higher-level products such as the PV system and modules does not continue to lower level products, i.e. cells. Conversely, most cells are sent to disposal. This is because aluminum, the most valuable material in c-Si, is only in the balance of system.
If manufacturers do not recycle scrap and end-of-life systems in their own facility, opting to use the external recycling association instead, the manufacturer would save on some costs. Joining a recycling association decreases the total cost of CdTe by 2.28% and c-Si by 55.28%. This shows that economic benefits from recycling are different for various types of PV systems. Metals such as cadmium, steel, and copper are usually much more expensive than non-metal materials and they are extracted from the recycling process and reused in manufacturing. Also, the price policy used in First Solar, which was considered in the mathematical model, requires pre-paid recycling money from the customer. This lowers the manufacturer’s burden in paying for the operating recycling facilities.
Nonetheless, the approach and the models investigated in our analysis have certain limitations. Firstly, there must be various forms of the closed-loop supply chains of PV system manufacturers apart from the three real cases shown in
Section 3. As mentioned earlier, forming a closed-loop supply chain depends on the module type, the manufacturing steps, the returning and recycling policy, and many other aspects. Therefore, the results cannot be generalized to other types of PV systems or to other returning and recycling policies. Secondly, a few assumptions addressed in this study make the mathematical models somewhat impractical. Especially due to the limitations of collected data, some parameter values in the numerical example were set arbitrarily.
These limitations produce some opportunities for future research. This study only considered c-Si and CdTe PV modules so it can be extended to considering other types of PV module, including a-Si and CIGS. Raw materials and the manufacturing and recycling steps are different among module types, which results in different types of supply chains. Also, the parameter values have to be examined using more reasonable methods. As the parameter values become more accurate, the experiment results will become more reliable. Last but not least, scenario-based analyses need to continue in the future. The constraints regarding the government’s recycling policy or global regulations can be reflected on the proposed mathematical models.


