
Evolutionary Patterns of Renewable Energy Technology Development in East Asia (1990–2010)


Abstract
:1. Introduction
2. Literature Review
2.1. Catching up and Leapfrogging
2.2. Indicator of Innovation Activities
3. Methodology
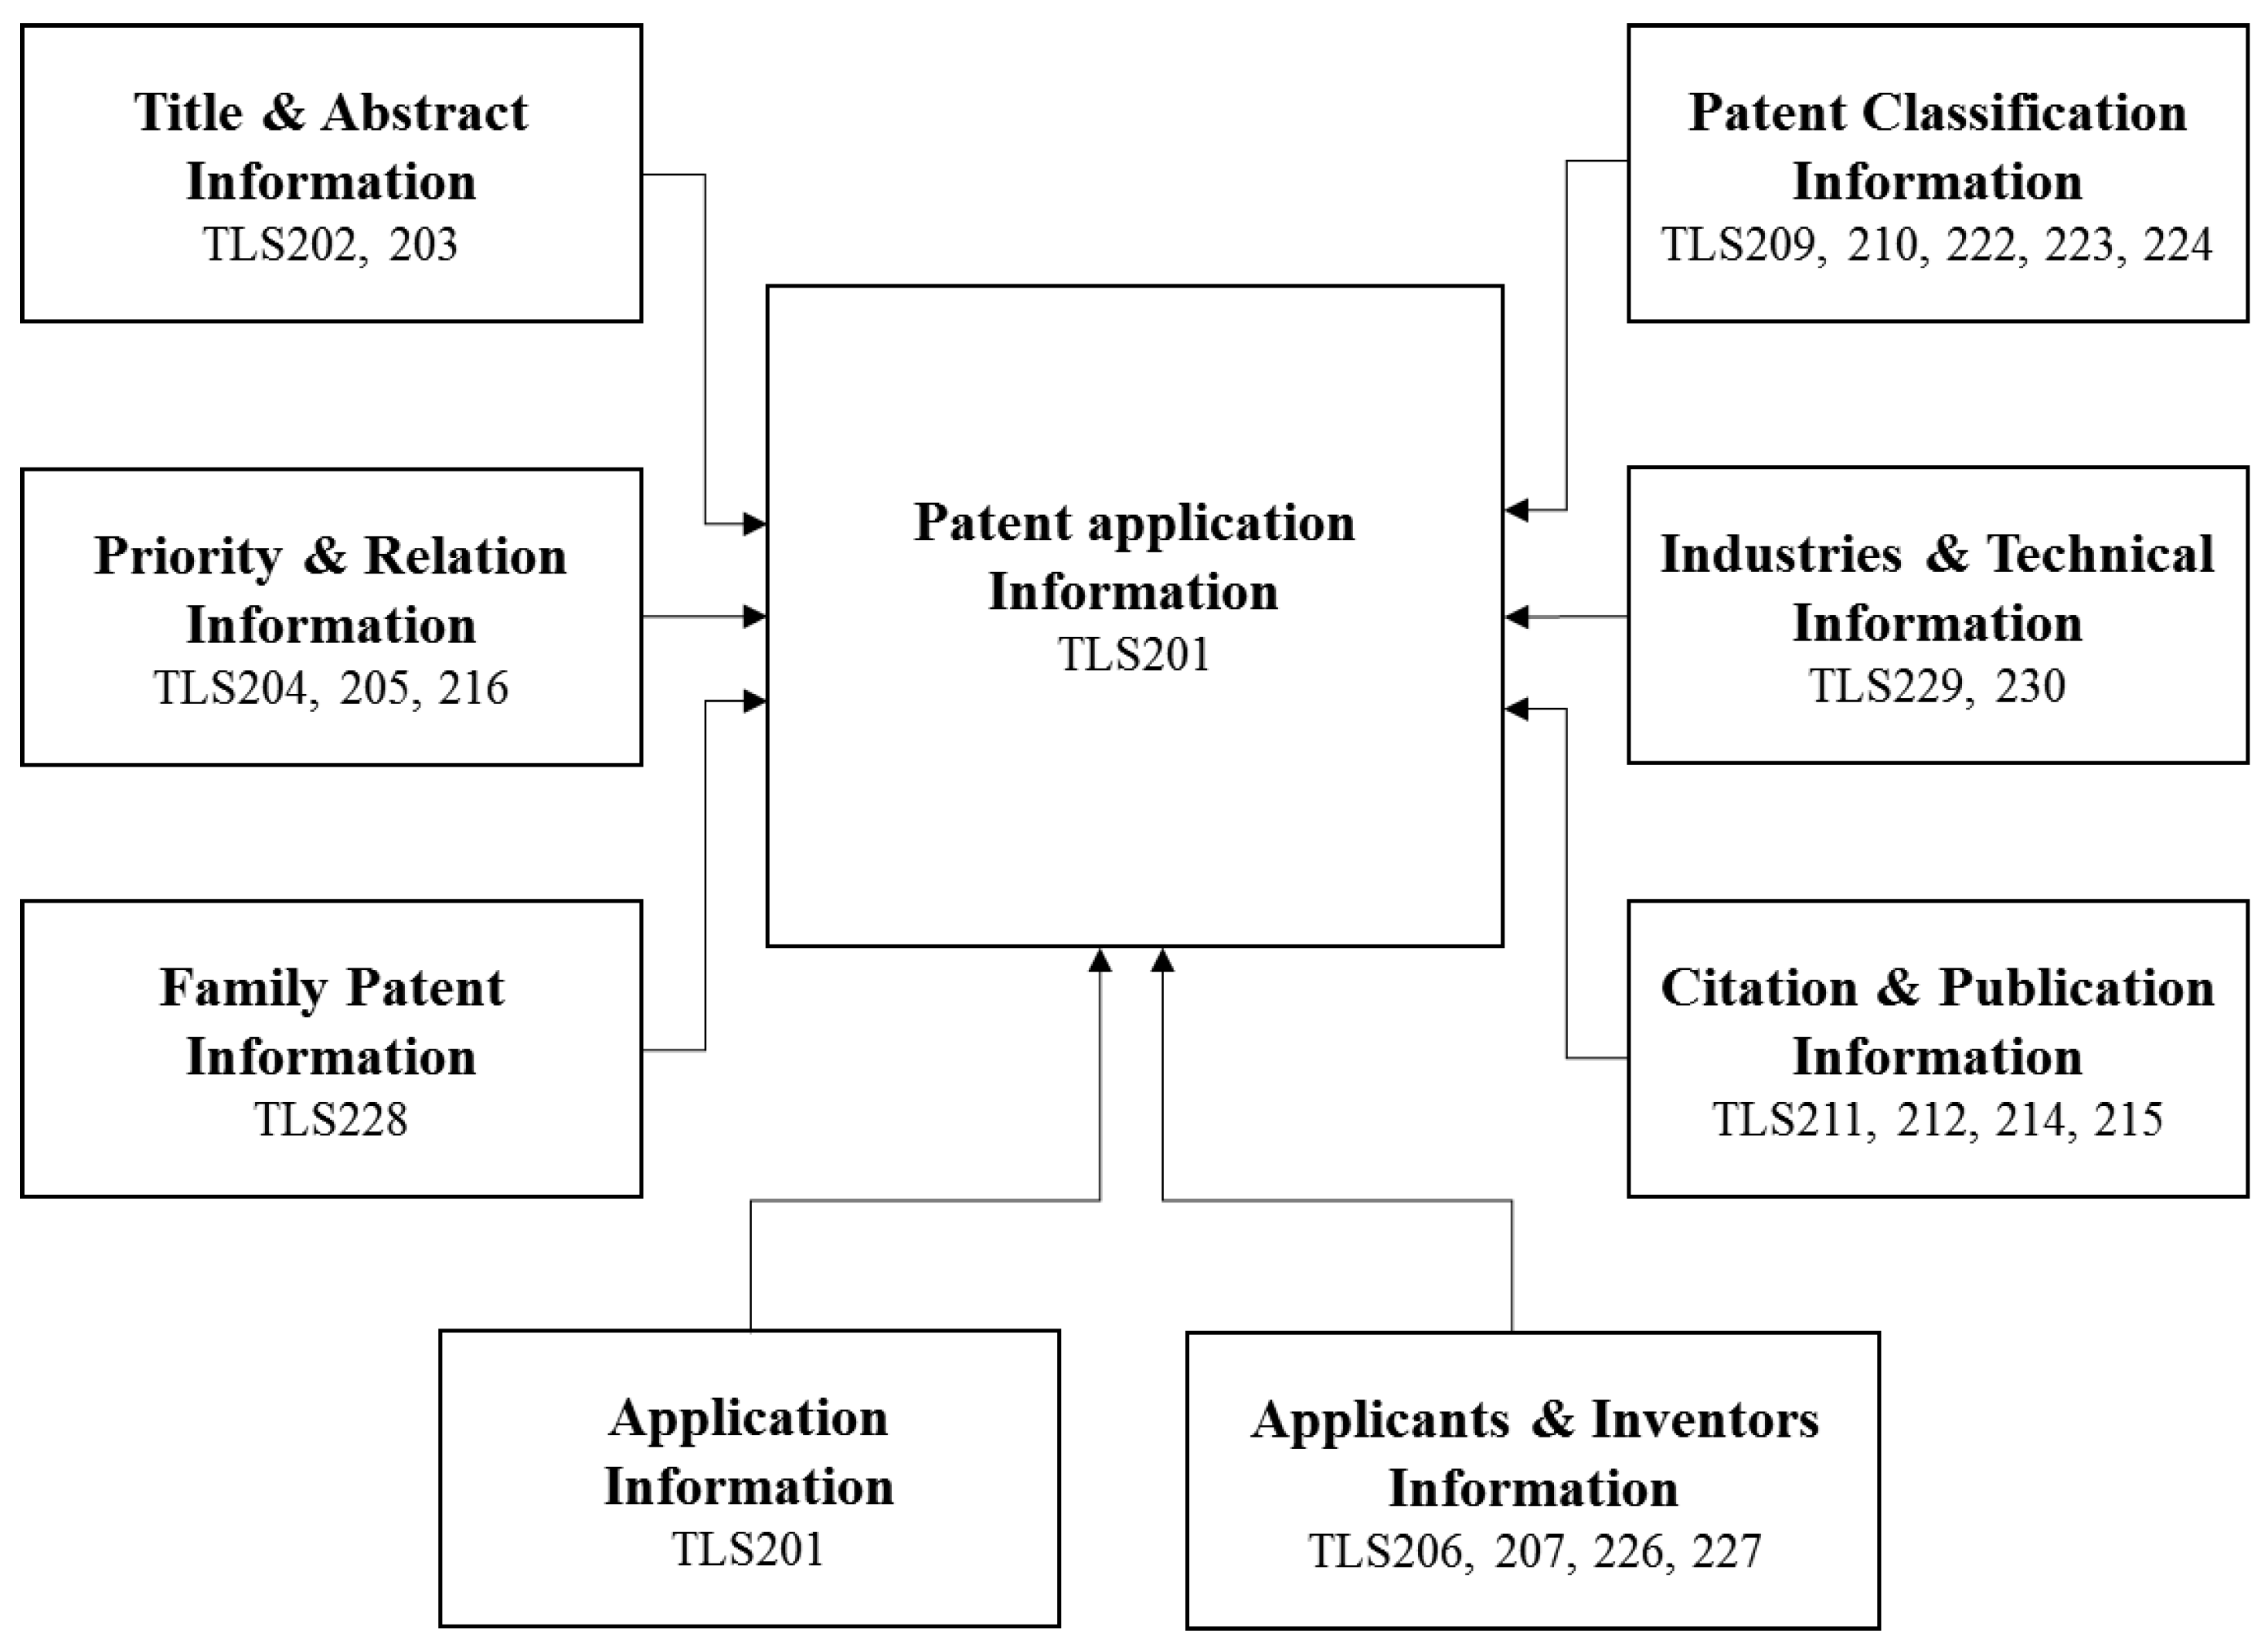
3.1. Data
3.2. Network Analysis
3.2.1. Network Structure Analysis
3.2.2. Network Centrality Analysis
4. Results and Analysis
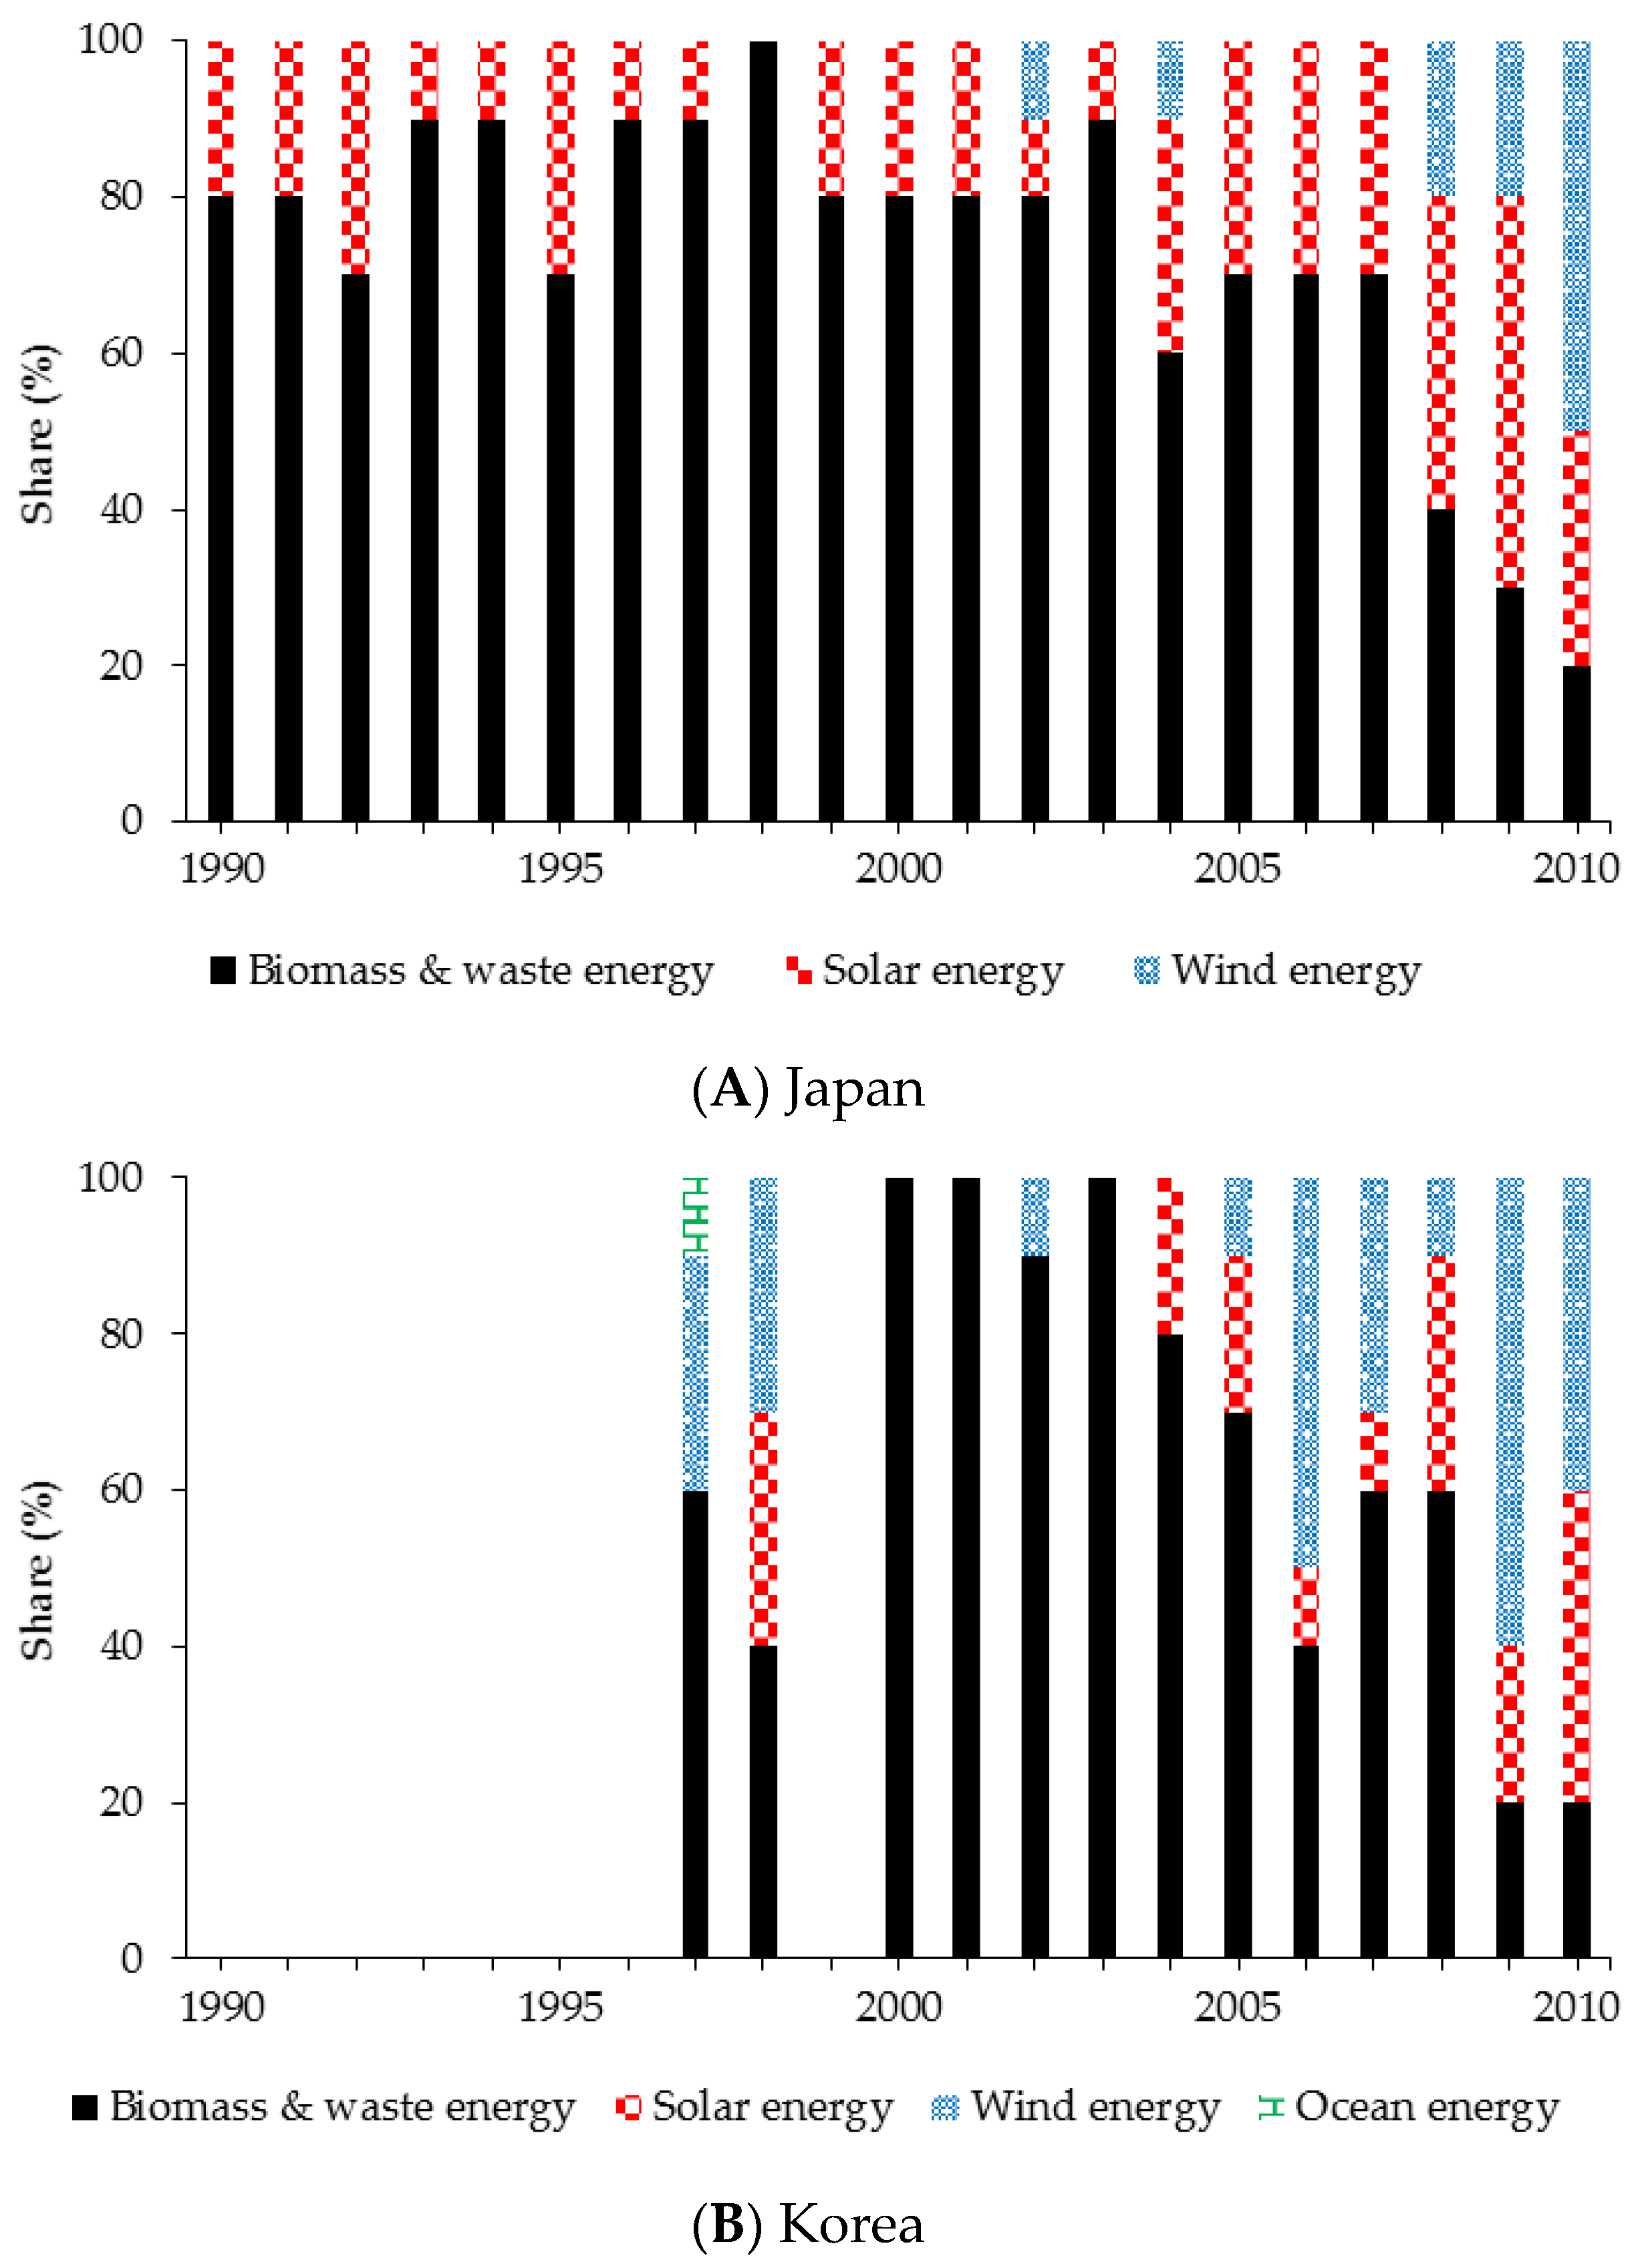
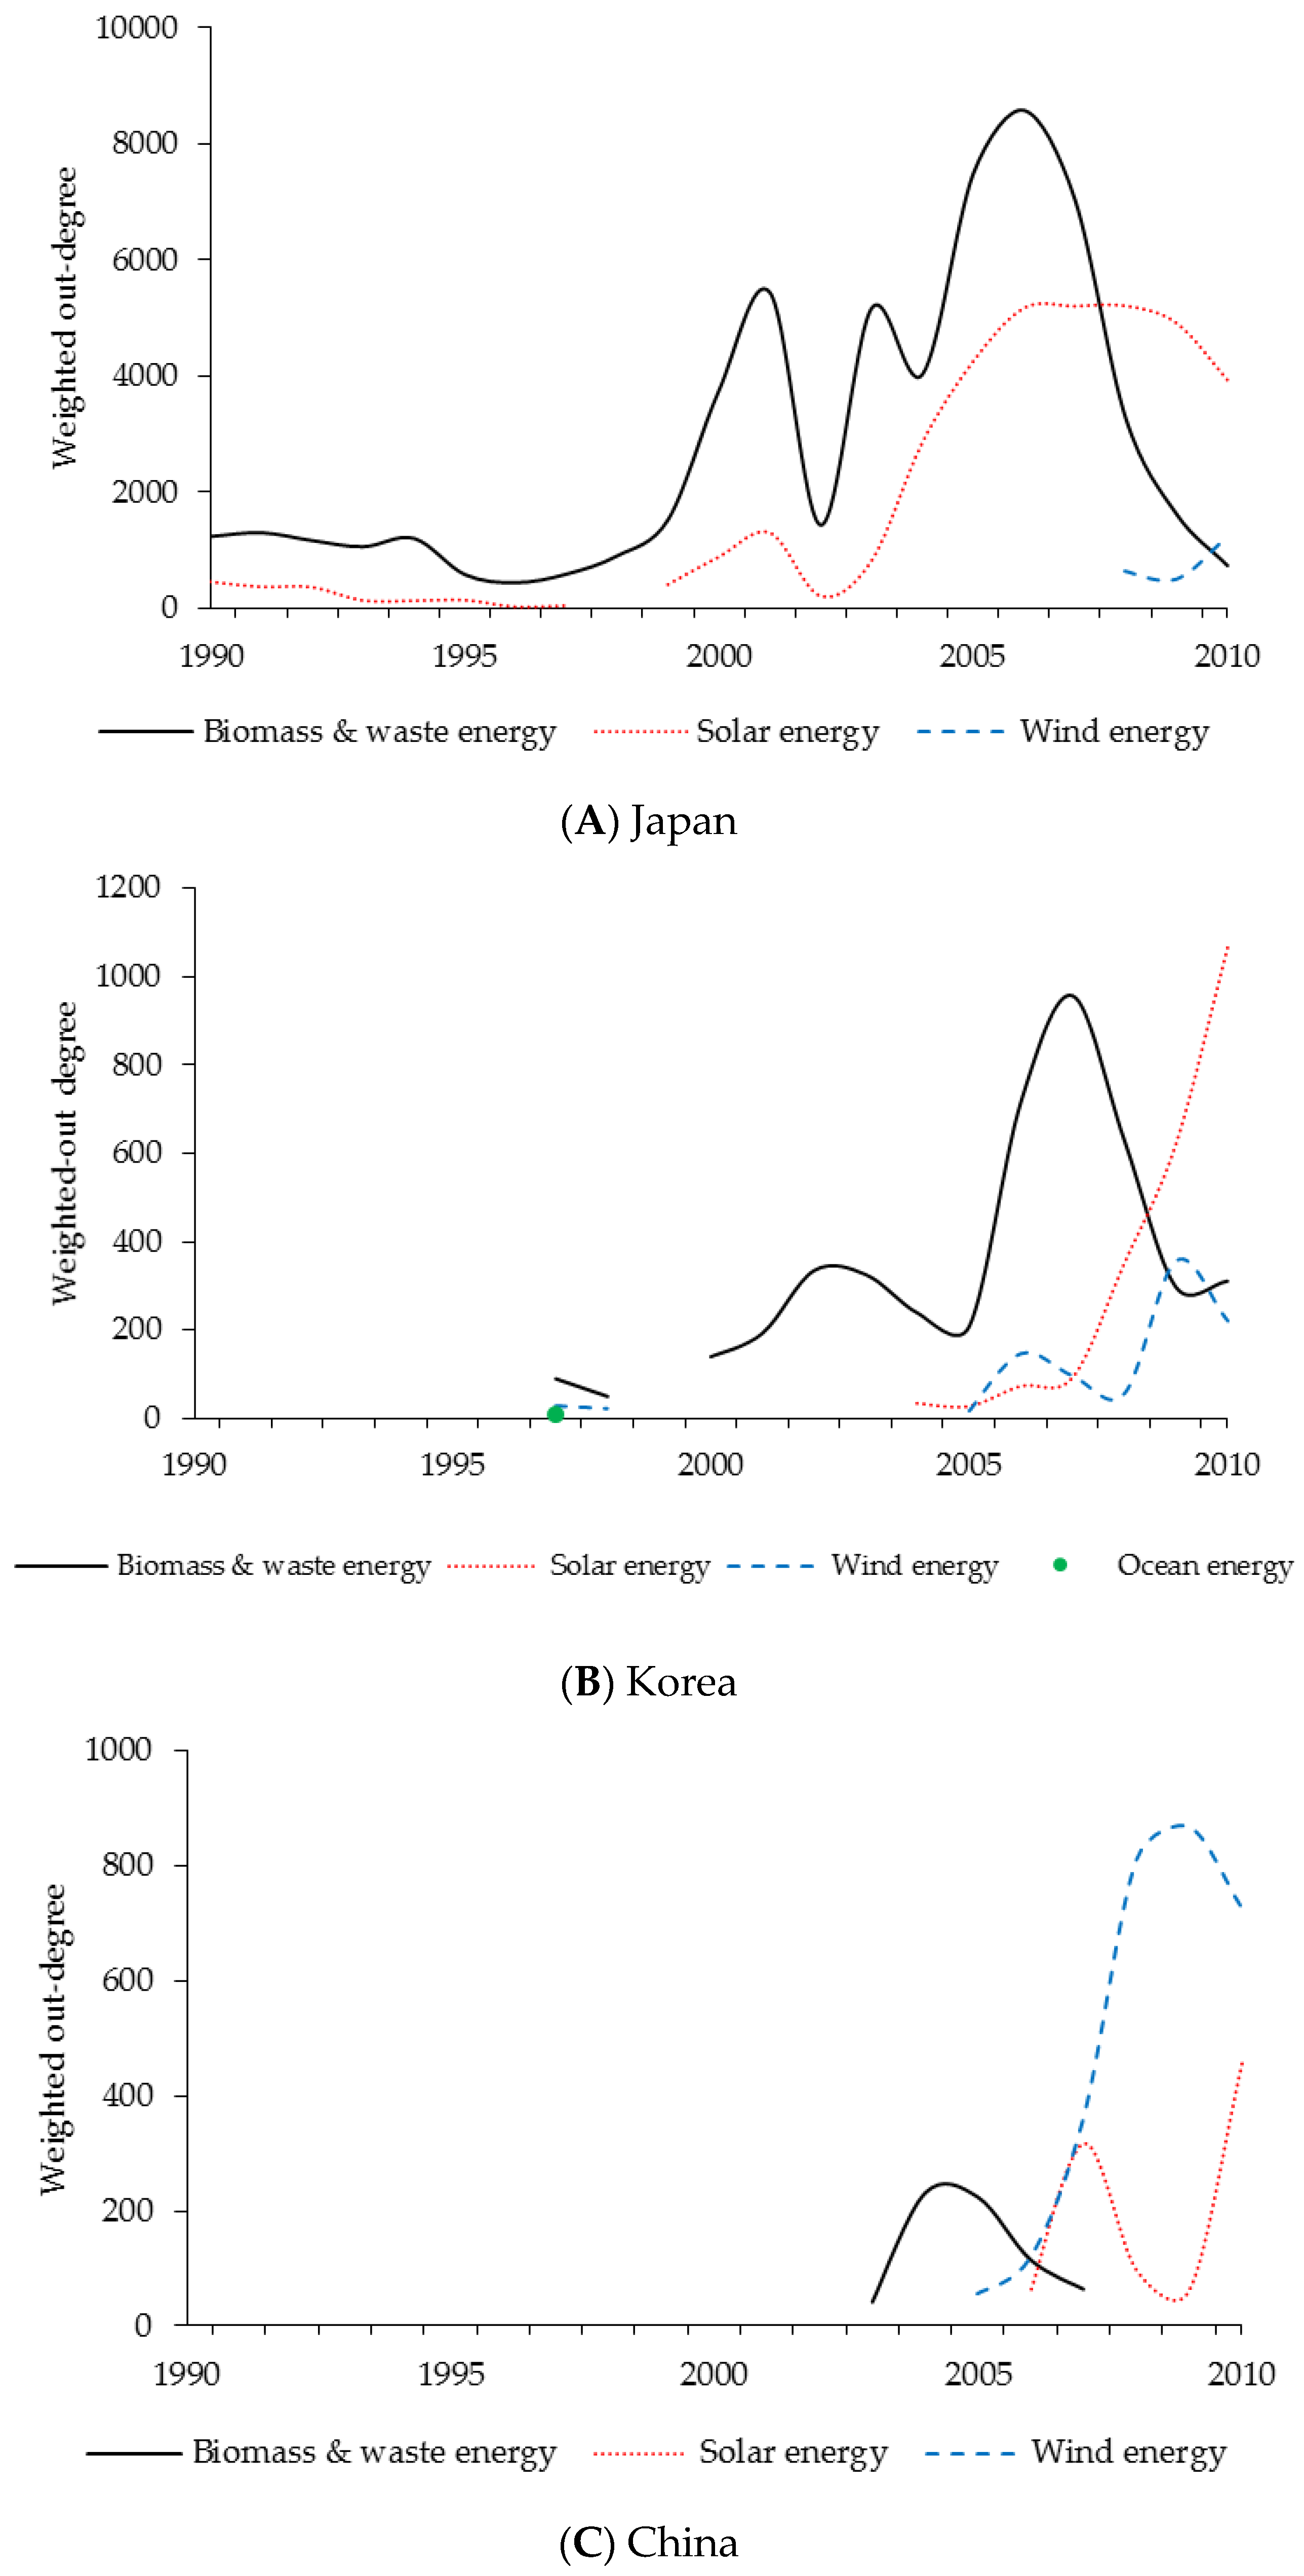
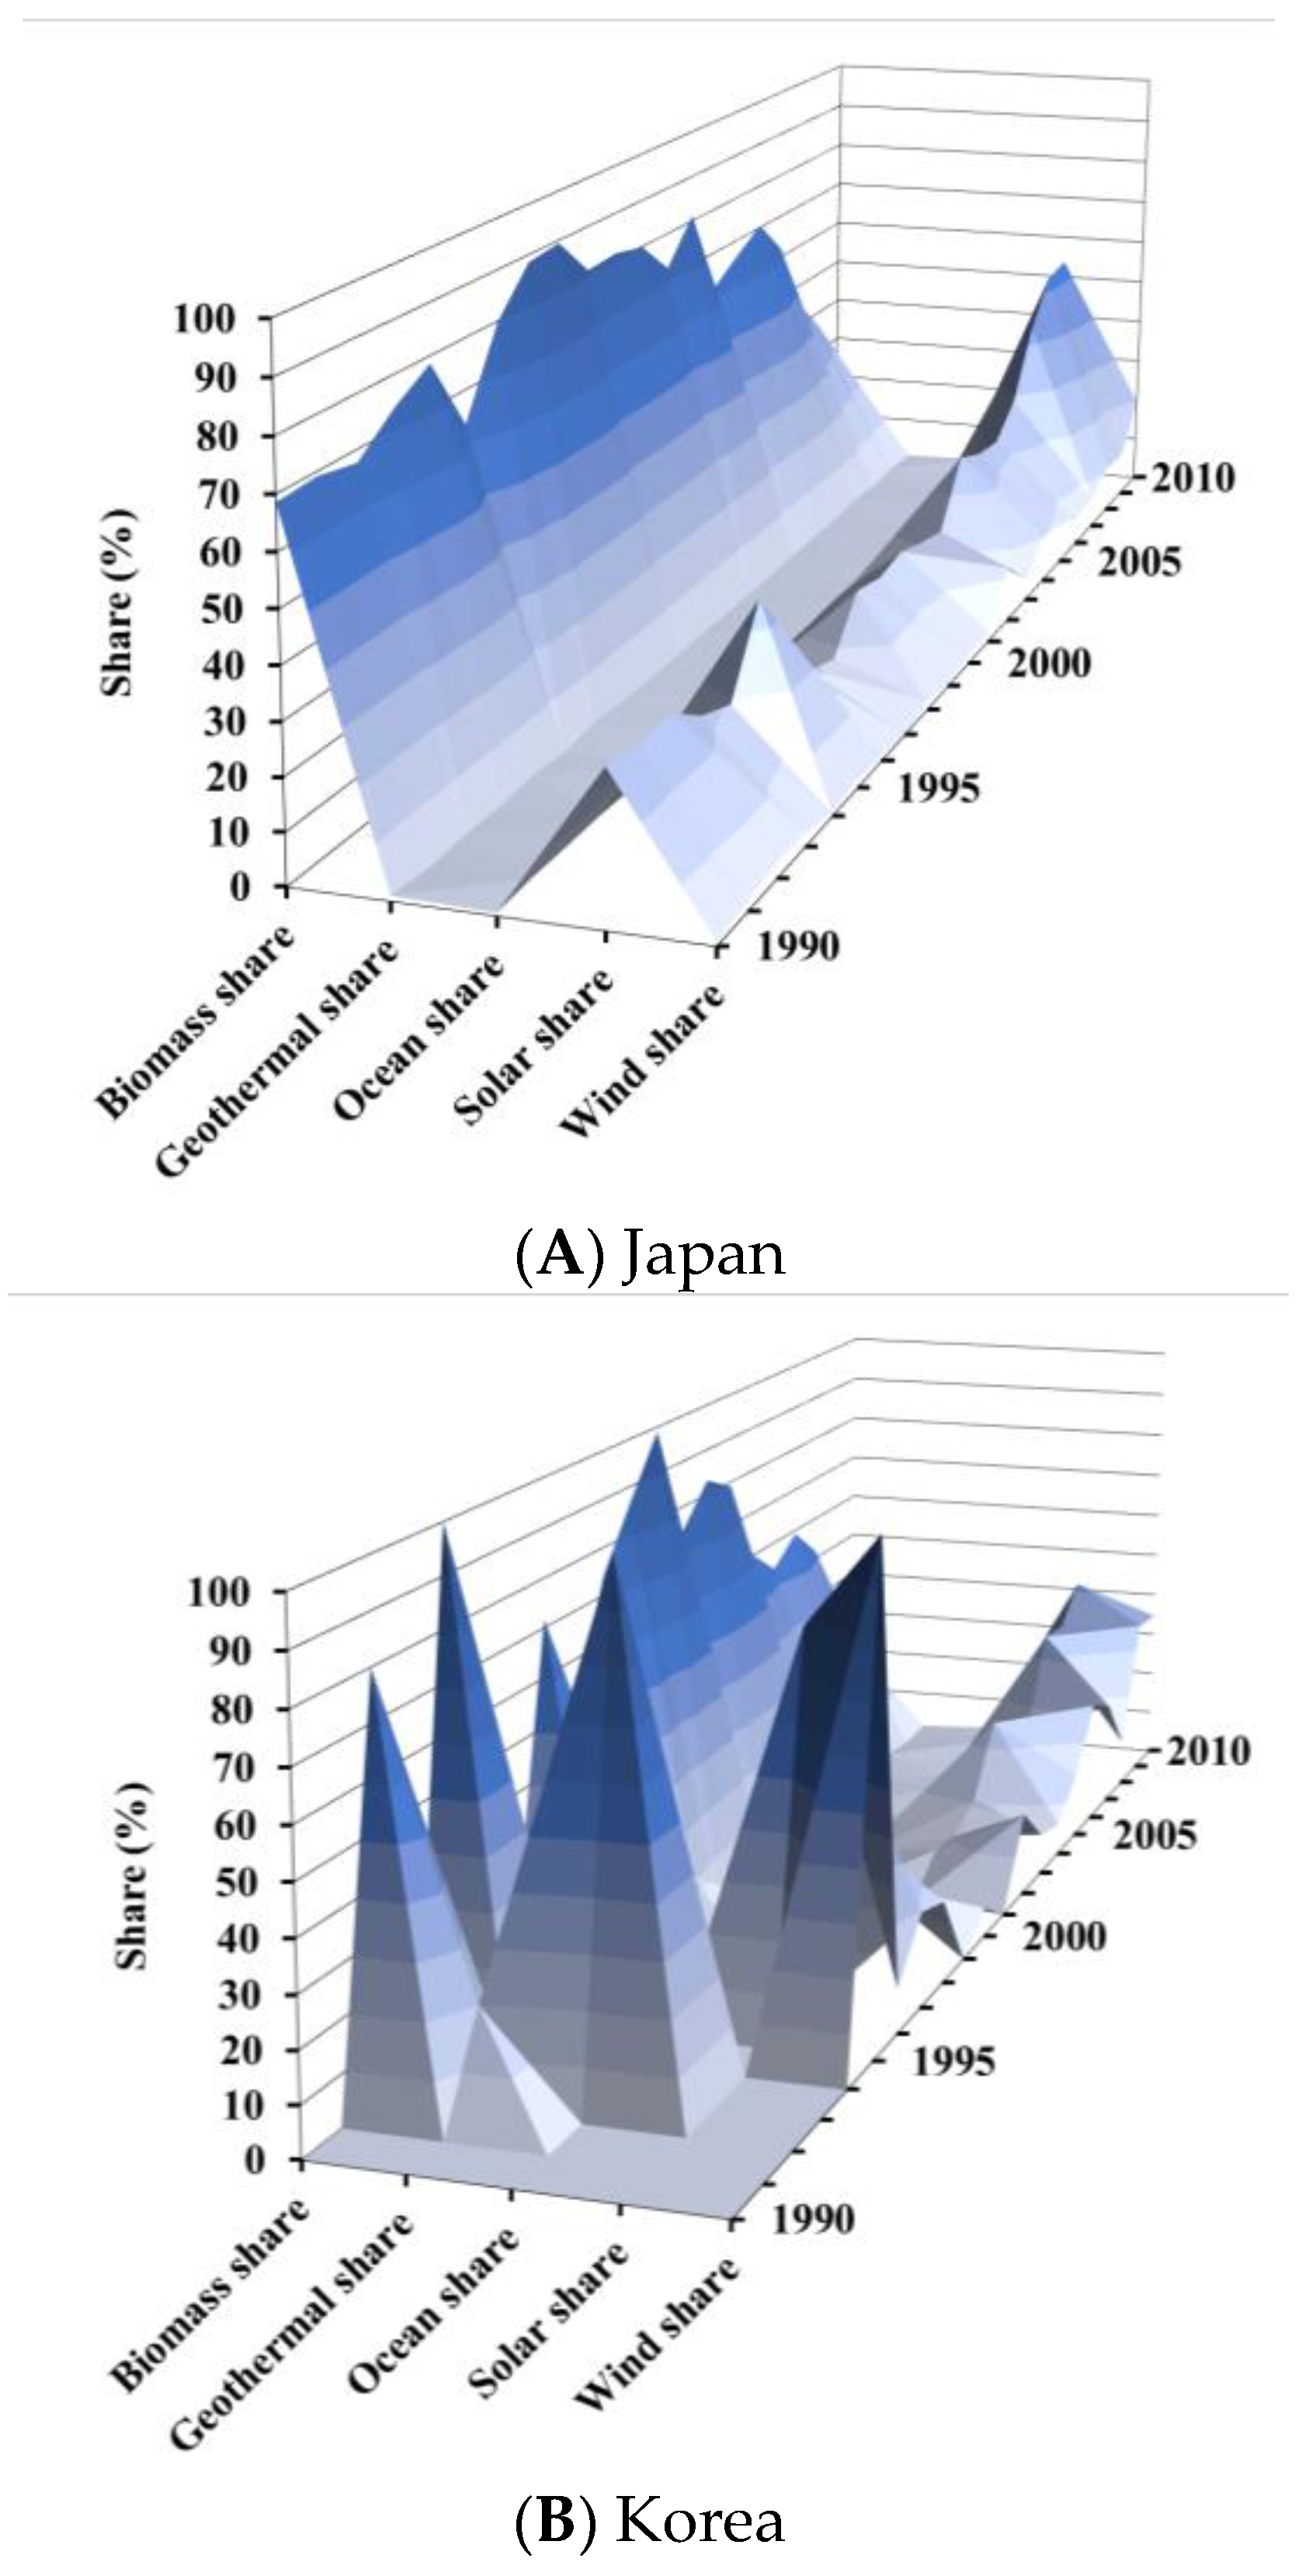
4.1. Evolution of Technology Network in Renewable Energy
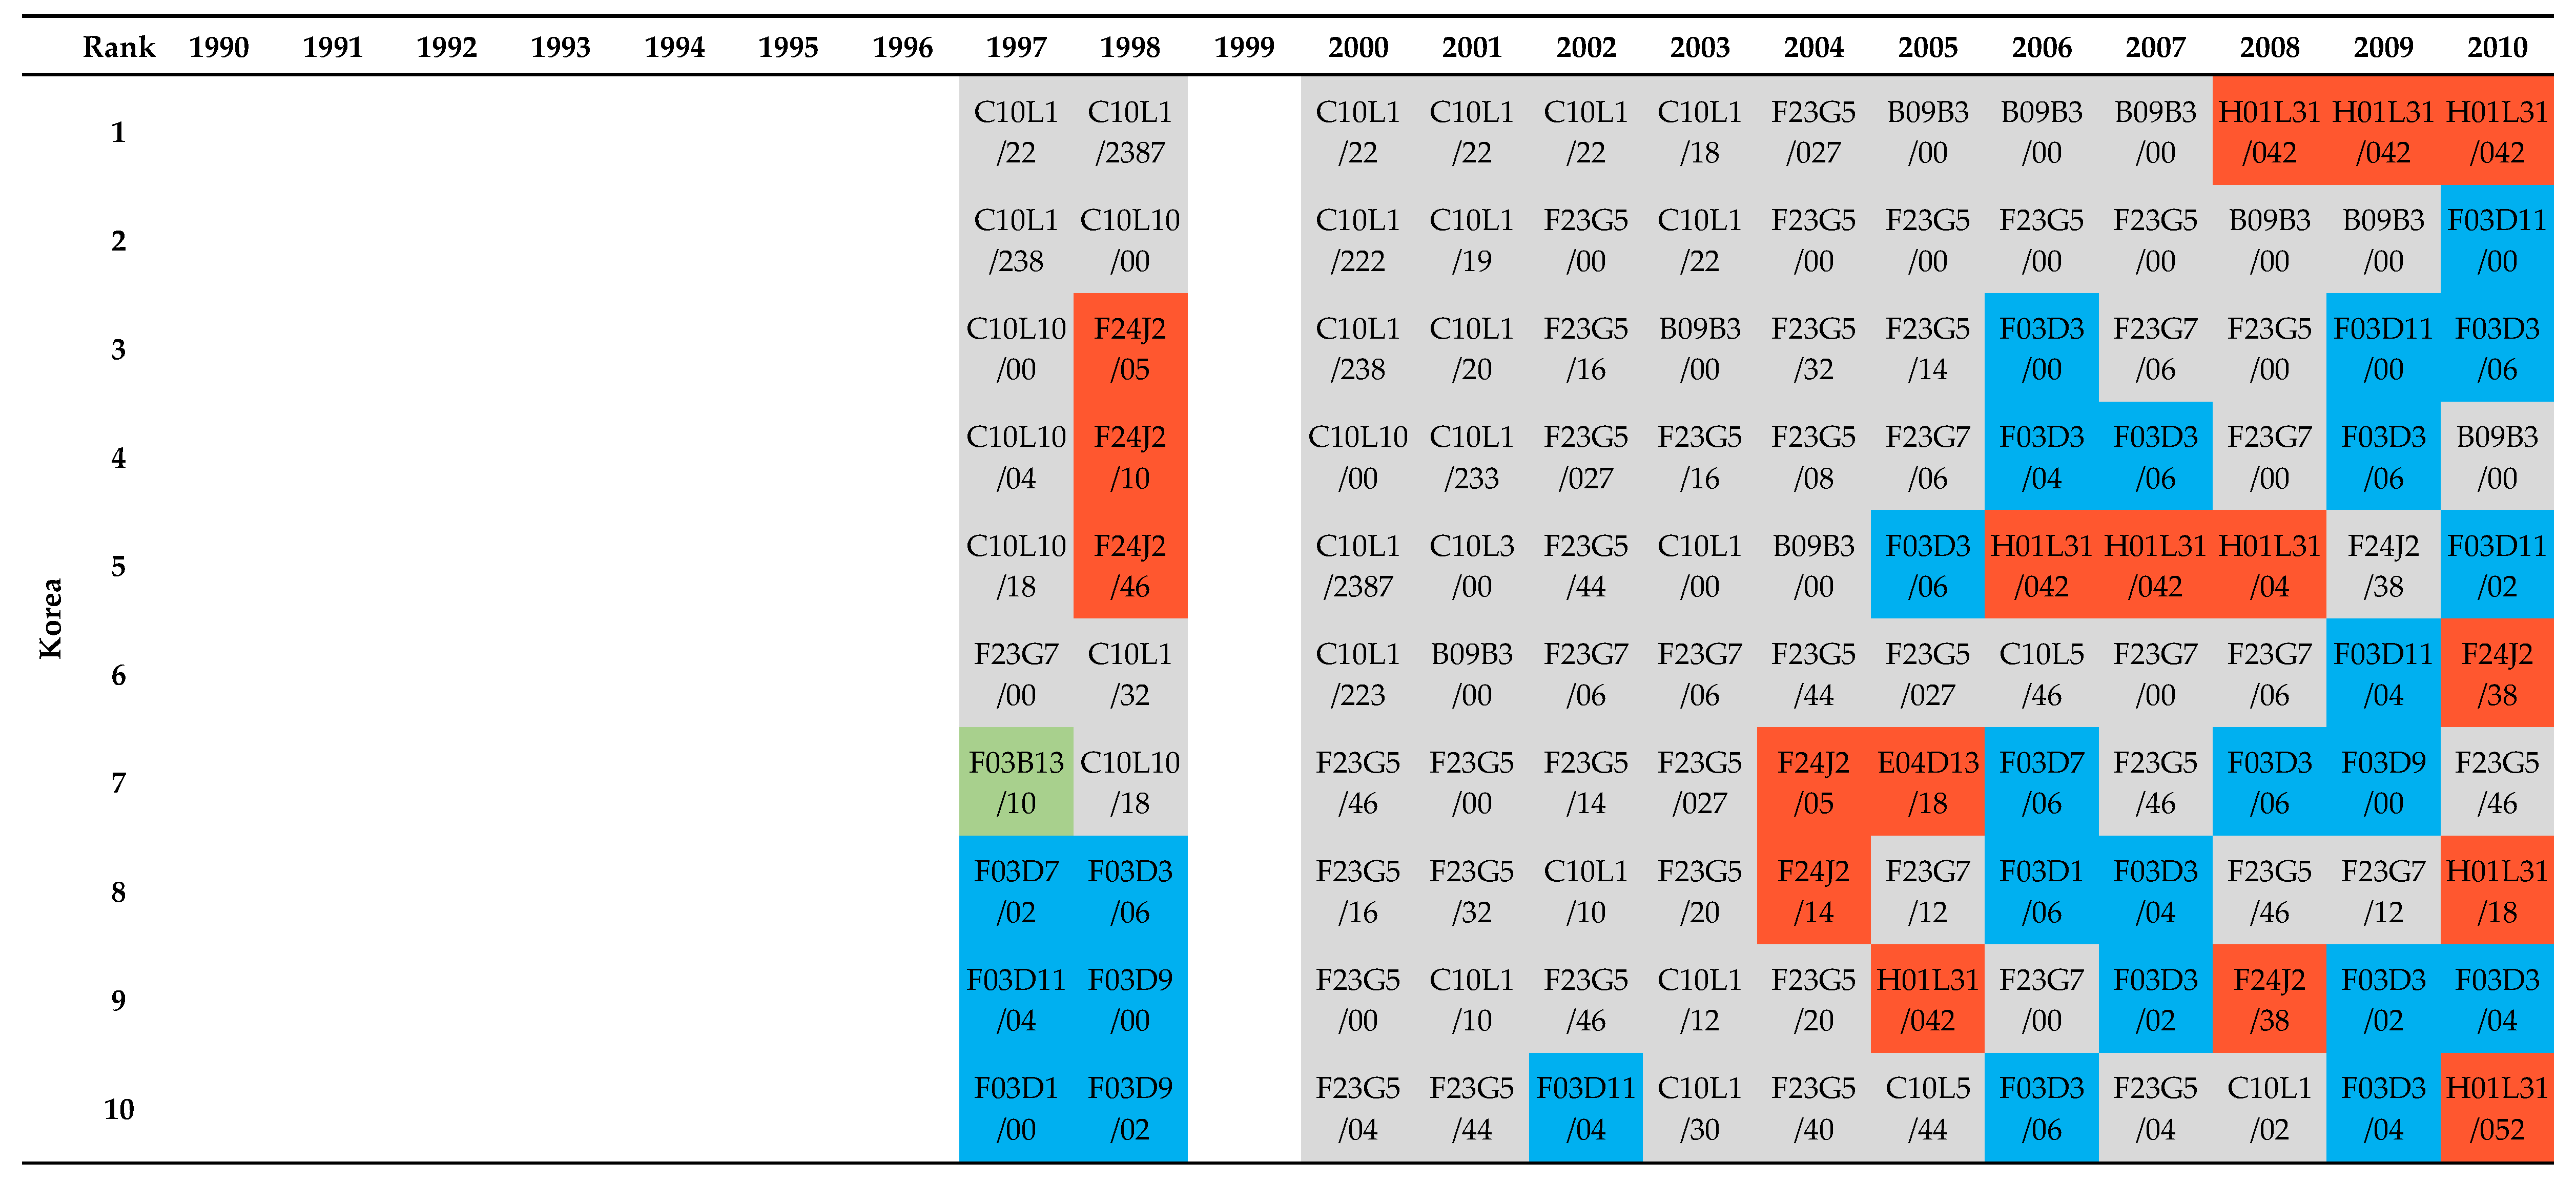
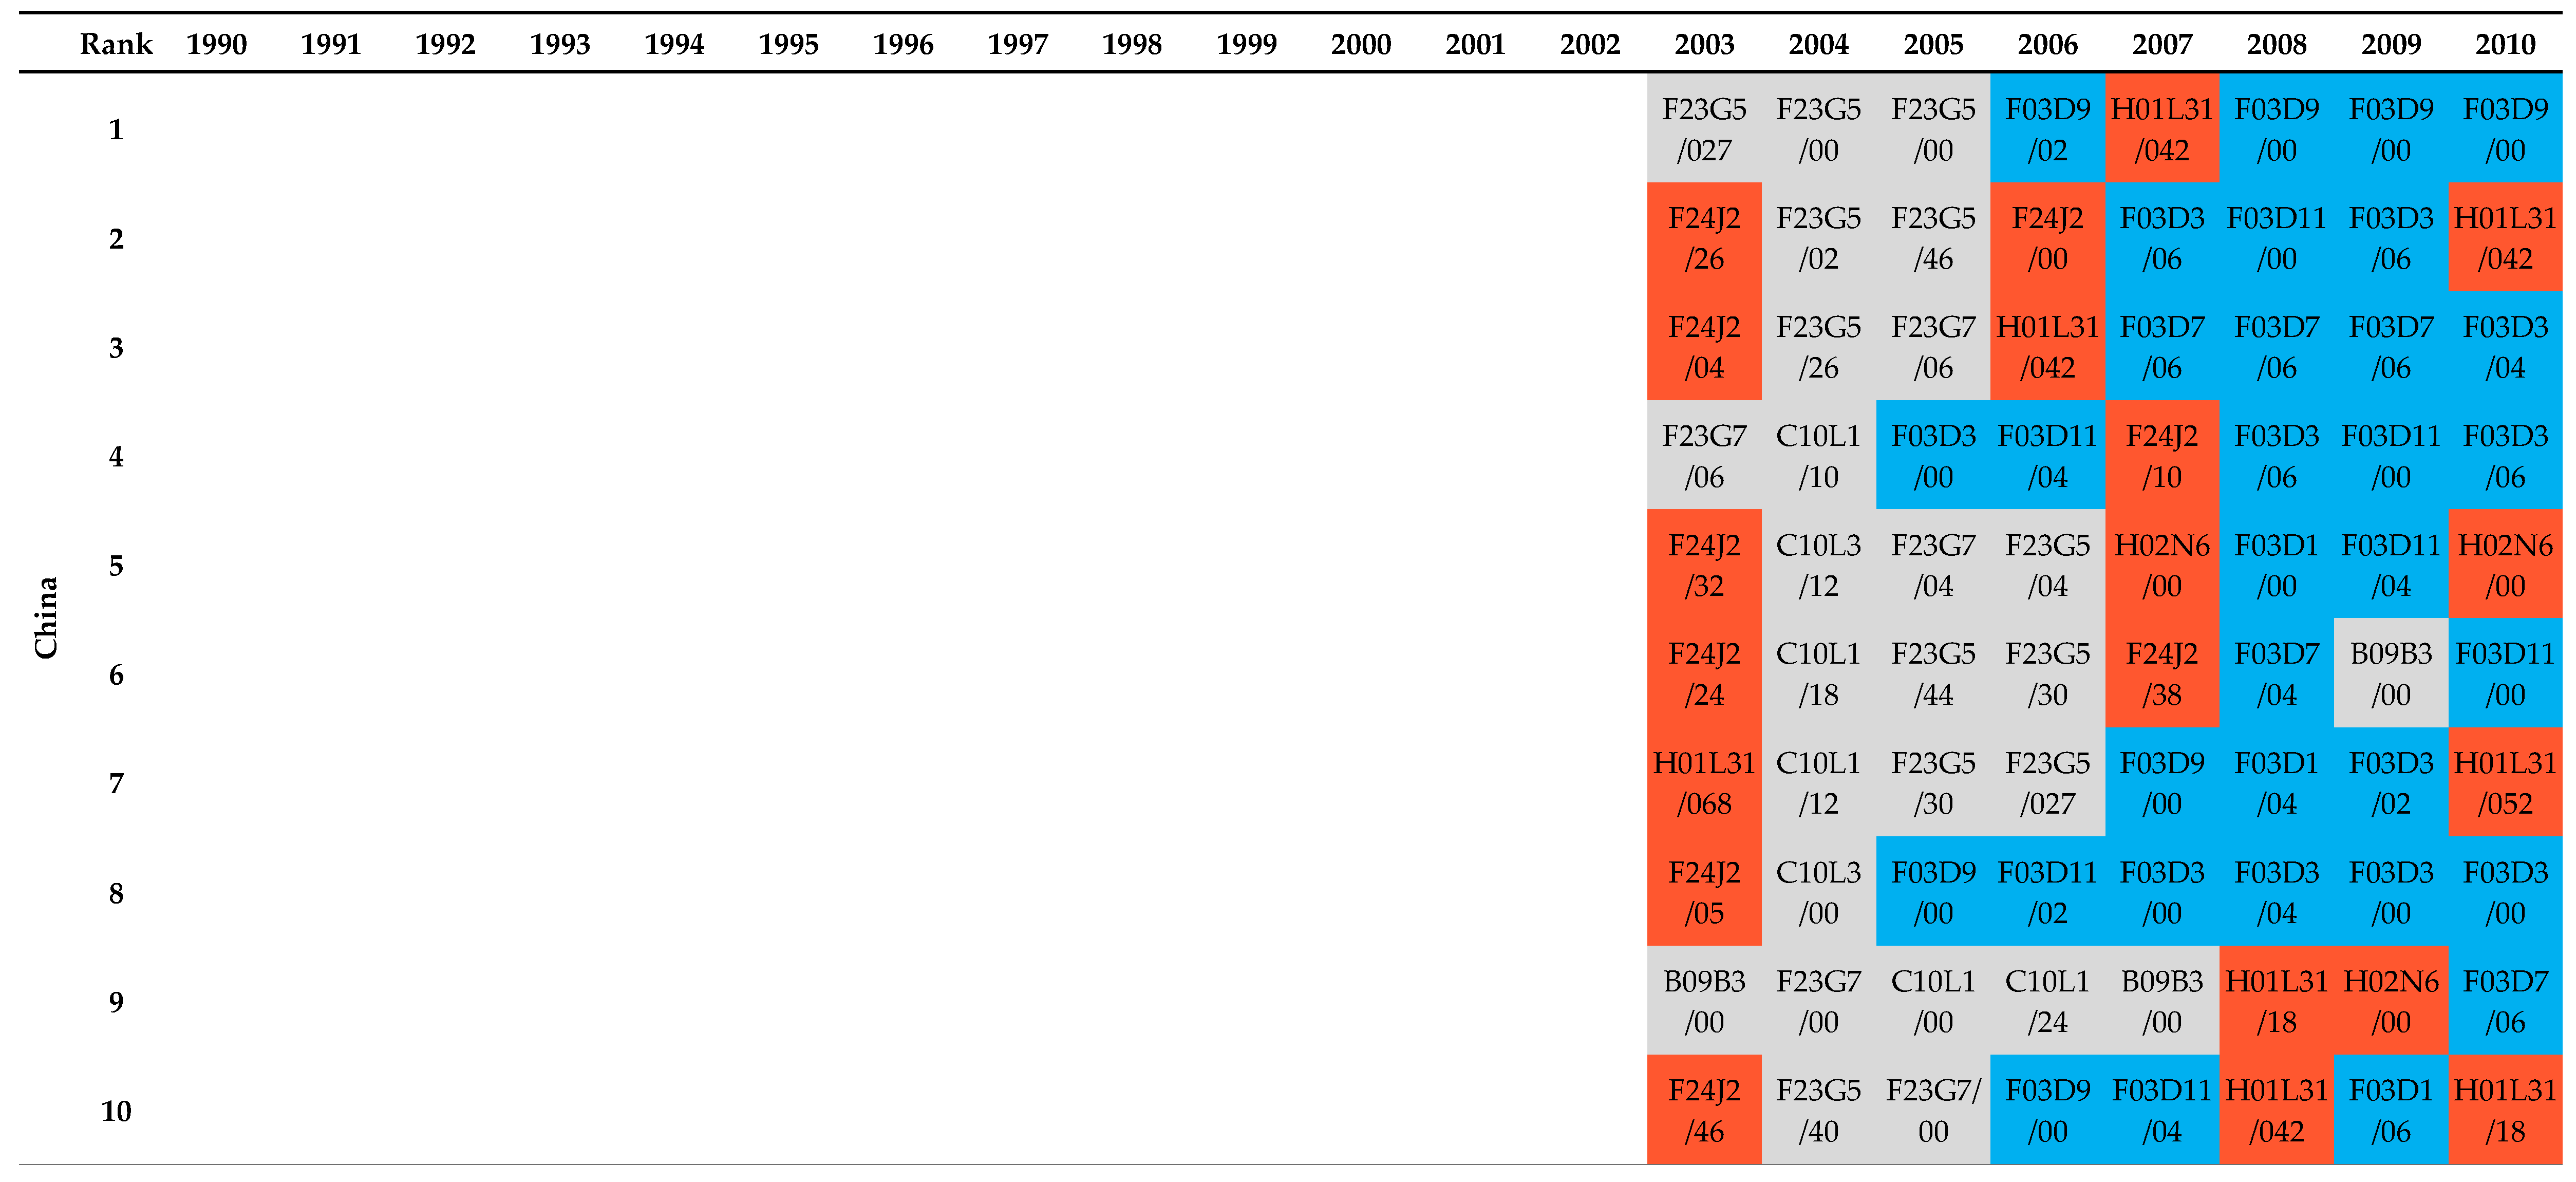
4.2. Technology Level Catch-Up and Leapfrogging
5. Conclusions
Author Contributions
Conflicts of Interest
Appendix A. IPC Codes for Generation Technologies

| Description | IPC Code |
|---|---|
| Fossil fuel technologies in general | |
| Production of fuel gases by carburetting air or other gases without pyrolysis | C10J |
| Steam engine plants; steam accumulators; engine plants not otherwise provided for; engines using special working fluids or cycles | F01K |
| Gas-turbine plants; air intakes for jet-propulsion plants; controlling fuel supply in air-breathing jet-propulsion plants | F02C |
| Hot-gas or combustion-product positive-displacement engine; use of waste heat of combustion engines, not otherwise provided for | F02G |
| Steam generation | F22 |
| Combustion apparatus; combustion processes | F23 |
| Furnaces; kilns; ovens; retorts | F27 |
| Description | IPC Code |
|---|---|
| Coal gasification | |
| Production of combustible gases containing carbon monoxide from solid carbonaceous fuels | C10J3 |
| Improved burners | |
| Combustion apparatus specially adapted for combustion of two or more kinds of fuel simultaneously or alternately, at least one kind of fuel being fluent | F23C1 |
| Combustion apparatus characterized by the arrangement or mounting of burners; disposition of burners to obtain a loop flame | F23C5/24 |
| Combustion apparatus characterized by the combination of two or more combustion chambers | F23C6 |
| Combustion apparatus characterized by the combination of two or more combustion chambers | F23B10 |
| Combustion apparatus with driven means for agitating the burning fuel; combustion apparatus with driven means for advancing the burning fuel through the combustion chamber | F23B30 |
| Combustion apparatus characterized by means for returning solid combustion residues to the combustion chamber | F23B70 |
| Combustion apparatus characterized by means creating a distinct flow path for flue gases or for non-combusted gases given off by the fuel | F23B80 |
| Burners for combustion of pulverulent fuel | F23D1 |
| Burners in which drops of liquid fuel impinge on a surface | F23D7 |
| Burners for combustion simultaneously or alternatively of gaseous or liquid or pulverulent fuel | F23D17 |
| Fluidized bed combustion | |
| Chemical or physical processes in general, conducted in the presence of fluids and solid particles; apparatus for such processes; with liquid as a fluidizing medium | B01J8/20-22 |
| Chemical or physical processes in general, conducted in the presence of fluids and solid particles; apparatus for such processes; according to “fluidized-bed” technique | B01J8/24-30 |
| Fluidized bed furnaces; Other furnaces using or treating finely divided materials in dispersion | F27B15 |
| Apparatus in which combustion takes place in a fluidized bed of fuel or other particles | F23C10 |
| Improved boilers for steam generation | |
| Modifications of boiler construction, or of tube systems, dependent on installation of combustion apparatus; Arrangements or dispositions of combustion apparatus | F22B31 |
| Steam generation plants, e.g., comprising steam boilers of different types in mutual association; combinations of low- and high-pressure boilers | F22B33/14-16 |
| Improved steam engines | |
| Plants characterized by the use of steam or heat accumulators, or intermediate steam heaters, therein | F01K3 |
| Plants characterized by use of means for storing steam in an alkali to increase steam pressure, e.g., of Honigmann or Koenemann type | F01K5 |
| Plants characterized by more than one engine delivering power external to the plant, the engines being driven by different fluids | F01K23 |
| Super-heaters | |
| Steam superheating characterized by heating method | F22G |
| Improved gas turbines | |
| Features, component parts, details or accessories; heating air supply before combustion, e.g., by exhaust gases | F02C7/08-105 |
| Features, component parts, details or accessories; cooling of plants | F02C7/12-143 |
| Features, component parts, details or accessories; preventing corrosion in gas-swept spaces | F02C7/30 |
| Combined cycles | |
| Plants characterized by more than one engine delivering power external to the plant, the engines being driven by different fluids; the engine cycles being thermally coupled | F01K23/02-10 |
| Gas turbine plants characterized by the use of combustion products as the working fluid; using special fuel, oxidant or dilution fluid to generate the combustion products | F02C3/20-36 |
| Plural gas-turbine plants; combinations of gas-turbine plants with other apparatus; supplying working fluid to a user, e.g., a chemical process, which returns working fluid to a turbine of the plant | F02C6/10-12 |
| Improved compressed-ignition engines | |
| Engines characterized by fuel-air mixture compression; with compression ignition | F02B1/12-14 |
| Engines characterized by air compression and subsequent fuel addition; with compression ignition | F02B3/06-10 |
| Engines characterized by the fuel-air charge being ignited by compression ignition of an additional fuel | F02B7 |
| Engines characterized by both fuel-air mixture compression and air compression, or characterized by both positive ignition and compression ignition, e.g., in different cylinders | F02B11 |
| Engines characterized by the introduction of liquid fuel into cylinders by use of auxiliary fluid; compression ignition engines using air or gas for blowing fuel into compressed air in cylinder | F02B13/02-04 |
| Methods of operating air-compressing compression-ignition engines involving introduction of small quantities of fuel in the form of a fine mist into the air in the engine‘s intake | F02B49 |
| Co-generation | |
| Use of steam or condensate extracted or exhausted from steam engine plant; returning energy of steam, in exchanged form, to process, e.g., use of exhaust steam for drying solid fuel of plant | F01K17/06 |
| Plants for converting heat or fluid energy into mechanical energy | F01K27 |
| Plural gas-turbine plants; combinations of gas-turbine plants with other apparatus; using the waste heat of gas-turbine plants outside the plants themselves, e.g., gas-turbine power heat plants | F02C6/18 |
| Profiting from waste heat of combustion engines | F02G5 |
| Machines, plant, or systems, using particular sources of energy; using waste heat, e.g., from internal-combustion engines | F25B27/02 |
| Description | IPC Code |
|---|---|
| Wind | |
| Wind motors with rotation axis substantially in wind direction | F03D1 |
| Wind motors with rotation axis substantially at right angle to wind direction | F03D3 |
| Wind motors with rotation axis substantially at right angle to wind direction | F03D5 |
| Controlling wind motors | F03D7 |
| Adaptations of wind motors for special use | F03D9 |
| Details, component parts, or accessories not provided for in, or of interest apart from, the other groups of this subclass | F03D11 |
| Solar | |
| Devices for producing mechanical power from solar energy | F03G6 |
| Use of solar heat, e.g., solar heat collectors | F24J2 |
| Devices consisting of a plurality of semiconductor components sensitive to infra-red radiation, light-specially adapted for the conversion of the energy of such radiation into electrical energy | H01L27/142 |
| Semiconductor devices sensitive to infra-red radiation, light-adapted as conversion devices | H01L31/04-78 |
| Generators in which light radiation is directly converted into electrical energy | H02N6 |
| Aspects of roofing for energy collecting devices—e.g., incl. solar panels | E04D13/18 |
| Geothermal | |
| Production or use of heat, not derived from combustion-using natural or geothermal heat | F24J3 |
| Devices for producing mechanical power from geothermal energy | F03G4 |
| Mechanical-power-producing mechanisms-using pressure differences or thermal differences occurring in nature | F03G7/04 |
| Ocean | |
| Tide or wave power plants | E02B9/08 |
| Submerged units incorporating electric generators or motors characterized by using wave or tide energy | F03B13/10-26 |
| Mechanical-power producing mechanisms-ocean thermal energy conversion | F03G7/05 |
| Biomass and waste | |
| Solid fuels essentially based on materials of non-mineral origin-animal or vegetable substances; sewage, town, or house refuse; industrial residues or waste materials | C10L5/40-48 |
| Engines or plants operating on gaseous fuel generated from solid fuel, e.g., wood | F02B43/08 |
| Liquid carbonaceous fuels | C10L1 |
| Gaseous fuels | C10L3 |
| Solid fuels | C10L5 |
| Dumping solid waste | B09B1 |
| Destroying solid waste or transforming solid waste into something useful or harmless | B09B3 |
| Incineration of waste; Incinerator constructions | F23G5 |
| Incinerators or other apparatus specially adapted for consuming specific waste or low grade fuels, e.g., chemicals | F23G7 |
| Plants for converting heat or fluid energy into mechanical energy; use of waste heat; | F01K27 |
| Profiting from waste heat of combustion engines | F02G5 |
| Machines, plant, or systems, using particular sources of energy-using waste heat, e.g., from internal-combustion engines | F25B27/02 |
| Plants or engines characterized by use of industrial or other waste gases | F01K25/14 |
| Incineration of waste-recuperation of heat | F23G5/46 |
Appendix B. Evolution of Technology Network in Renewable Energy


Appendix C. Top 10 Ranked Technologies (1990–2010)


References
- Dincer, I. Renewable energy and sustainable development: A crucial review. Renew. Sustain. Energy Rev. 2000, 4, 157–175. [Google Scholar] [CrossRef]
- Yeo, Y.; Shim, D.; Lee, J.-D.; Altmann, J. Driving forces of CO2 emissions emerging countries: LMDI decomposition analysis on China and India’s residential sector. Sustainability 2015, 7, 16108–16129. [Google Scholar] [CrossRef]
- Chen, T.-Y.; Yu, O.S.; Hsu, G.J.; Hsu, F.-M.; Sung, W.-N. Renewable energy technology portfolio planning with scenario analysis: A case study for Taiwan. Energy Policy 2009, 37, 2900–2906. [Google Scholar] [CrossRef]
- Ackermann, T.; Soder, L. Wind energy technology and current status: A review. Renew. Sustain. Energy Rev. 2000, 4, 315–374. [Google Scholar] [CrossRef]
- Park, E.; Ohm, J.Y. Factors influencing the public intention to use renewable energy technologies in South Korea: Effects of the Fukushima nuclear accident. Energy Policy 2014, 65, 198–211. [Google Scholar] [CrossRef]
- Lee, K.; Lee, S. Patterns of technological innovation and evolution in the energy sector: A patent-based approach. Energy Policy 2013, 59, 415–432. [Google Scholar] [CrossRef]
- Wong, C.-Y.; Keng, Z.-X.; Mohamad, Z.F.; Azizan, S.A. Patterns of technological accumulation: The comparative advantage and relative impact of Asian emerging economies in low carbon energy technological systems. Renew. Sustain. Energy Rev. 2016, 57, 977–987. [Google Scholar] [CrossRef]
- Amer, M.; Daim, T.U. Application of technology roadmaps for renewable energy sector. Technol. Forecast. Soc. Chang. 2010, 77, 1355–1370. [Google Scholar] [CrossRef]
- Walz, R. Competences for green development and leapfrogging in newly industrializing countries. Int. Econ. Econ. Policy 2010, 7, 245–265. [Google Scholar] [CrossRef]
- Jordan-Korte, K. Government Promotion of Renewable Energy Technologies: Policy Approaches and Market Development in Germany, the United States, and Japan; Gabler Verlag: Wiesbaden, Germany, 2011. [Google Scholar]
- Horbach, J.; Rammer, C.; Rennings, K. Determinants of eco-innovations by type of environmental impact—The role of regulatory push/pull, technology push and market pull. Ecol. Econ. 2012, 78, 112–122. [Google Scholar] [CrossRef]
- Altenburg, T. New global players in innovation? China’s and India’s technological catch-up and the low carbon economy (Discussion Paper 13). In Poor and Powerful—The Rise of China and India and the Implications for Europe; Schmitz, H., Messner, D., Eds.; Deutsches Institut für Entwicklungspolitik (DIE): Bonn, Germany, 2008. [Google Scholar]
- Mathews, J.A.; Cho, D.S. Tiger Technology: The Creation of a Semiconductor Industry in East Asia; Cambridge University Press: Cambridge, UK, 2000. [Google Scholar]
- International Energy Agency. CO2 Emissions from Fuel Combustion Highlights; IEA: Paris, France, 2015. [Google Scholar]
- McCrone, A.; Moslener, U.; Usher, E.; Grüning, C.; Sonntag-O’Brien, V. Global Trends in Renewable Energy Investment 2015; FS-UNEP: Frankfurt, Germany, 2015. [Google Scholar]
- Mathews, J.A.; Hu, M.; Wu, C. Fast-Follower Industrial Dynamics: The Case of Taiwan’s Emergent Solar Photovoltaic Industry. Ind. Innov. 2011, 18, 177–202. [Google Scholar] [CrossRef]
- Kristinsson, K.; Rao, R. Interactive Learning or Technology Transfer as a Way to Catch-Up? Analysing the Wind Energy Industry in Denmark and India. Ind. Innov. 2008, 15, 297–320. [Google Scholar] [CrossRef]
- Qiu, Y.; Ortolano, L.; David Wang, Y. Factors influencing the technology upgrading and catch-up of Chinese wind turbine manufacturers: Technology acquisition mechanisms and government policies. Energy Policy 2013, 55, 305–316. [Google Scholar] [CrossRef]
- Fagerberg, J.; Godinho, M. Innovation and catching-up. In The Oxford Handbook of Innovation; Fagerberg, J., Mowery, D., Nelson, R.R., Eds.; Oxford University Press: Oxford, UK, 2004; pp. 514–544. [Google Scholar]
- Lee, K.; Lim, C. Technological regimes, catching-up and leapfrogging: Findings from the Korean industries. Res. Policy 2001, 30, 459–483. [Google Scholar] [CrossRef]
- Abramovitz, M. Catching Up, Forging Ahead, and Falling Behind. J. Econ. Hist. 1986, 46, 385–406. [Google Scholar] [CrossRef]
- Kim, L. Imitation to Innovation: The Dynamics of Korea’s Technological Learning; Harvard Business School Press: Boston, MA, USA, 1997. [Google Scholar]
- Kohler-Koch, B. Catching up with Change: The Transformation of Governance in the European Union. J. Eur. Public Policy 1996, 3, 359–380. [Google Scholar] [CrossRef]
- Perez, C.; Soete, L. Catching up in technology: Entry barriers and windows of opportunity. In Technical Change and Economic Theory; Dosi, G., Freeman, C., Nelson, R., Silverberg, G., Soete, L., Eds.; Pinter Publishers: London, UK, 1988; pp. 458–479. [Google Scholar]
- Chen, D.; Li-Hua, R. Modes of technological leapfrogging: Five case studies from China. J. Eng. Technol. Manag. 2011, 28, 93–108. [Google Scholar] [CrossRef]
- Bhagavan, M.R. Technological Leapfrogging by Developing Countries; EOLSS: Paris, France, 2001. [Google Scholar]
- Sohn, E.; Chang, S.Y.; Song, J. Technological Catching-up and Latecomer Strategy: A Case Study of the Asian Shipbuilding Industry. Seoul J. Bus. 2009, 15, 25–57. [Google Scholar]
- Lee, K.; Lim, C.; Song, W. Emerging digital technology as a window of opportunity and technological leapfrogging: Catch-up in digital TV by the Korean firms. Int. J. Technol. Manag. 2005, 29, 40–63. [Google Scholar] [CrossRef]
- Mathews, J.A. Competitive Advantages of the Latecomer Firm: A Resource-Based Account of Industrial. Asia Pac. J. Manag. 2002, 19, 467–488. [Google Scholar] [CrossRef]
- Sauter, R.; Watson, J. Technology Leapfrogging: A Review of the Evidence; University of Sussex: Falmer, Sussex, UK, 2008. [Google Scholar]
- Park, K.H.; Lee, K. Linking the technological regime to the technological catch-up: Analyzing Korea and Taiwan using the US patent data. Ind. Corp. Chang. 2006, 15, 715–753. [Google Scholar] [CrossRef]
- Acs, Z.J.; Anselin, L.; Varga, A. Patents and innovation counts as measures of regional production of new knowledge. Res. Policy 2002, 31, 1069–1085. [Google Scholar] [CrossRef]
- Delaney, J.B.; Honeycutt, T.C. Determinants of Research and Development Activity by Electric Utilities: Comment. Bell J. Econ. Manag. Sci. 1976, 7, 722–725. [Google Scholar] [CrossRef]
- Mayo, J.W.; Flynn, J.E. The Effects of Regulation on Research and Development: Theory and Evidence. J. Bus. 1988, 61, 321–336. [Google Scholar] [CrossRef]
- Calderini, M.; Garrone, P. Liberalisation, industry turmoil and the balance of R&D activities. Inf. Econ. Policy 2001, 13, 199–230. [Google Scholar]
- Munari, F.; Roberts, E.B.; Sobrero, M. Privatization processes and the redefinition of corporate R&D boundaries. Res. Policy 2002, 31, 31–53. [Google Scholar]
- Cohen, L.; Sanyal, P. R&D choice in restructured industries: In-house v/s collaborative research in the US electricity industry. SSRN 2004. [Google Scholar] [CrossRef]
- Keller, W. International Trade, Foreign Direct Investment, and Technology Spillovers. In Handbook of the Economics of Innovation; Hall, B.H., Rosenberg, N., Eds.; Elsevier: North-Holland, The Netherlands, 2010; Volume 2, pp. 793–829. [Google Scholar]
- Mairesse, J.; Mohnen, P. Using innovation surveys for econometric analysis. In Handbook of the Economics of Innovation; Hall, B.H., Rosenberg, N., Eds.; Elsevier: North-Holland, The Netherlands, 2010; pp. 1129–1155. [Google Scholar]
- Coombs, R.; Narandren, P.; Richards, A. A literature-based innovation output indicator. Res. Policy 1996, 25, 403–413. [Google Scholar] [CrossRef]
- Malerba, F.; Orsenigo, L. Schumpeterian patterns of innovation are technology-specific. Res. Policy 1996, 25, 451–478. [Google Scholar] [CrossRef]
- Abraham, B.P.; Moitra, S.D. Innovation assessment through patent analysis. Technovation 2001, 21, 245–252. [Google Scholar] [CrossRef]
- Abbas, A.; Zhang, L.; Khan, S.U. A literature review on the state-of-the-art in patent analysis. World Pat. Inf. 2014, 37, 3–13. [Google Scholar] [CrossRef]
- Gassler, H.; Frohlich, J.; Kopcsa, A. Selective information on the national system of innovation as an important input for the technology management of firms. Int. J. Technol. Manag. 1996, 11, 329–342. [Google Scholar]
- Godoe, H.; Nygaard, S. System failure, innovation policy and patents: Fuel cells and related hydrogen technology in Norway 1990–2002. Energy Policy 2006, 34, 1697–1708. [Google Scholar] [CrossRef]
- Cambini, C.; Caviggioli, F.; Scellato, G. R&D, Patenting and Market Regulation: Evidence from EU Electricity industry; Working Paper Series—ISSN 1973-0381; SSRN: Rochester, NY, USA, 2015. [Google Scholar]
- Narin, F. Patent Bibliometrics. Scientometrics 1994, 30, 147–155. [Google Scholar] [CrossRef]
- Hirschey, M.; Richardson, V.J. Valuation effects of patent quality: A comparison for Japanese and U.S. firms. Pac. Basin Financ. J. 2001, 9, 65–82. [Google Scholar] [CrossRef]
- Archibugi, D.; Pianta, M. Specialization and size of technological activities in industrial countries: The analysis of patent data. Res. Policy 1992, 21, 79–93. [Google Scholar] [CrossRef]
- Brouwer, E.; Kleinknecht, A. Innovative Output, and A Firm’s Propensity to Patent. An Exploration of CIS Micro Data. Res. Policy 1999, 28, 615–624. [Google Scholar] [CrossRef]
- Deyle, H.G.; Grupp, H. Commuters and the regional assignment of innovative activities: A methodological patent study of German districts. Res. Policy 2005, 34, 221–234. [Google Scholar] [CrossRef]
- Pakes, A.; Griliches, Z. Patents and R&D at the firm level: A First Report. Econ. Lett. 1980, 5, 377–381. [Google Scholar]
- Hall, B.H.; Jaffe, A.B.; Trajtenberg, M. The NBER Patent Citations Data File: Lessons, Insights and Methodological Tools; Working Paper Series; The MIT Press: Cambridge, MA, USA, 2001. [Google Scholar]
- OECD. The Use and Analysis of Citations in Patents; OECD Publishing: Paris, France, 2009. [Google Scholar]
- Alcácer, J.; Gittelman, M. Patent Citations as a Measure of Knowledge Flows: The Influence of Examiner Citations. Rev. Econ. Stat. 2006, 88, 774–779. [Google Scholar] [CrossRef]
- Jaffe, A.B.; Trajtenberg, M. Patents, Citations, and Innovations: A Window on the Knowledge Economy; MIT Press: Cambridge, MA, USA, 2002. [Google Scholar]
- Dent, C.M. Renewable energy and East Asia’s new developmentalism: Towards a low carbon future? Pac. Rev. 2012, 25, 561–587. [Google Scholar] [CrossRef]
- WIPO. Patent-Based Technology Analysis Report–Alternative Energy Technology; WIPO: Geneva, Switzerland, 2009. [Google Scholar]
- Vijvers, W.G. The international patent classification as a search tool. World Pat. Inf. 1990, 12, 26–30. [Google Scholar] [CrossRef]
- Lanzi, E.; Verdolini, E.; Haščič, I. Efficiency-improving fossil fuel technologies for electricity generation: Data selection and trends. Energy Policy 2011, 39, 7000–7014. [Google Scholar] [CrossRef]
- Johnstone, N.; Haščiči, I.; Popp, D. Renewable energy policies and technological innovation: Evidence based on patent counts. Environ. Resour. Econ. 2010, 45, 133–155. [Google Scholar] [CrossRef]
- Noailly, J.; Smeets, R. Directing technical change from fossil-fuel to renewable energy innovation: An application using firm-level patent data. J. Environ. Econ. Manage. 2015, 72, 15–37. [Google Scholar] [CrossRef]
- Taylor, M. Renewable Power Generation Costs in 2014; IRENA: Abu Dhabi, United Arab Emirates, 2015. [Google Scholar]
- McCrone, A.; Moslener, U.; D’Estais, F.; Usher, E.; Grüning, C. Global Trends in Renewable Energy Investment 2016; FS-UNEP: Frankfurt, Germany, 2016. [Google Scholar]
- Dou, H.; Bai, Y. A rapid analysis of Avian Influenza patents in the Esp@cenet® database—R&D strategies and country comparisons. World Pat. Inf. 2007, 29, 26–32. [Google Scholar]
- Meyer, M. What do we know about innovation in nanotechnology? Some propositions about an emerging field between hype and path-dependency. Scientometrics 2007, 70, 779–810. [Google Scholar] [CrossRef]
- Verbeek, A.; Debackere, K.; Luwel, M.; Andries, P.; Zimmermann, E.; Deleus, F. Linking science to technology: Using bibliographic references in patents to build linkage schemes. Scientometrics 2002, 54, 399–420. [Google Scholar] [CrossRef]
- Otte, E.; Rousseau, R. Social network analysis: A powerful strategy, also for the information sciences. J. Inf. Sci. 2002, 28, 441–453. [Google Scholar] [CrossRef]
- Choi, H.; Park, S.; Lee, J. dong Government-driven knowledge networks as precursors to emerging sectors: A case of the hydrogen energy sector in Korea. Ind. Corp. Chang. 2011, 20, 751–787. [Google Scholar] [CrossRef]
- Albert, R.; Barabasi, A.L. Statistical mechanics of complex networks. Rev. Mod. Phys. 2002, 74, 47–97. [Google Scholar] [CrossRef]
- Okamura, K.; Vonortas, N.S. European Alliance and Knowledge Networks1. Technol. Anal. Strateg. Manag. 2006, 18, 535–560. [Google Scholar] [CrossRef]
- Coleman, T.F.; Moré, J.J. Estimation of Sparse Jacobian Matrices and Graph Coloring Blems. SIAM J. Numer. Anal. 1983, 20, 187–209. [Google Scholar] [CrossRef]
- Watts, D.J.; Strogatz, S.H. Collective dynamics of “small-world” networks. Nature 1998, 393, 440–442. [Google Scholar] [CrossRef] [PubMed]
- Lee, H.; Kim, C.; Cho, H.; Park, Y. An ANP-based technology network for identification of core technologies: A case of telecommunication technologies. Expert Syst. Appl. 2009, 36, 894–908. [Google Scholar] [CrossRef]
- Freeman, L.C. Centrality in Social Networks Conceptual Clarification. Soc. Netw. 1979, 1, 215–239. [Google Scholar] [CrossRef]
- Kim, K.N.; Oh, N.; Kang, G.Y.; Kim, D. Korean photovoltaic industry and technology: Now and future. In Proceedings of the IEEE Photovoltaic Specialists Conference, Seattle, WA, USA, 19–24 June 2011; pp. 112–117.
- Hong, J.H.; Kim, C.; Shin, H. Power Sector in Developing Asia: Current Status and Policy Issues, ADB Economics Working Paper Series. SSRN 2014. [Google Scholar] [CrossRef]
- Tseng, F.M.; Hsieh, C.H.; Peng, Y.N.; Chu, Y.W. Using patent data to analyze trends and the technological strategies of the amorphous silicon thin-film solar cell industry. Technol. Forecast. Soc. Chang. 2011, 78, 332–345. [Google Scholar] [CrossRef]


| Year | Number of Nodes | Number of Edges | Graph Density | Average Degree | Average Path Length | Diameter | Clustering Coefficient |
|---|---|---|---|---|---|---|---|
| 1990 | 43 | 4493 | 2.49 | 208.98 | 2.12 | 5 | 0.54 |
| 1991 | 43 | 3940 | 2.18 | 183.26 | 2.16 | 5 | 0.54 |
| 1992 | 42 | 3639 | 2.11 | 173.29 | 2.13 | 5 | 0.58 |
| 1993 | 41 | 2766 | 1.69 | 134.93 | 2.33 | 6 | 0.58 |
| 1994 | 41 | 2056 | 1.25 | 100.29 | 2.27 | 6 | 0.50 |
| 1995 | 37 | 1452 | 1.09 | 78.49 | 2.41 | 6 | 0.56 |
| 1996 | 35 | 817 | 0.69 | 46.69 | 2.21 | 6 | 0.57 |
| 1997 | 35 | 920 | 0.77 | 52.57 | 2.04 | 5 | 0.53 |
| 1998 | 36 | 1424 | 1.13 | 79.11 | 2.21 | 6 | 0.53 |
| 1999 | 41 | 2428 | 1.48 | 118.44 | 2.19 | 5 | 0.54 |
| 2000 | 43 | 7309 | 4.05 | 339.95 | 2.09 | 5 | 0.61 |
| 2001 | 44 | 12,059 | 6.37 | 548.14 | 1.86 | 4 | 0.65 |
| 2002 | 42 | 2585 | 1.50 | 123.10 | 2.20 | 6 | 0.65 |
| 2003 | 41 | 5774 | 3.52 | 281.66 | 2.26 | 6 | 0.68 |
| 2004 | 43 | 14,884 | 8.24 | 692.28 | 1.84 | 4 | 0.70 |
| 2005 | 43 | 24,896 | 13.79 | 1157.95 | 1.75 | 4 | 0.71 |
| 2006 | 42 | 26,988 | 15.67 | 1285.14 | 1.76 | 4 | 0.71 |
| 2007 | 43 | 27,520 | 15.24 | 1280.00 | 1.78 | 5 | 0.70 |
| 2008 | 43 | 20,380 | 11.28 | 947.91 | 1.87 | 5 | 0.67 |
| 2009 | 42 | 12,583 | 7.31 | 599.19 | 1.93 | 5 | 0.64 |
| 2010 | 44 | 9166 | 4.84 | 416.64 | 2.00 | 5 | 0.63 |
| Year | Number of Nodes | Number of Edges | Graph Density | Average Degree | Average Path Length | Diameter | Clustering Coefficient |
|---|---|---|---|---|---|---|---|
| 1990 | 1 | 2 | 4.00 | ||||
| 1991 | 1 | 3 | 6.00 | ||||
| 1992 | 6 | 9 | 0.30 | 3.00 | 1.00 | 1 | 0.00 |
| 1993 | 5 | 19 | 0.95 | 7.60 | 1.00 | 1 | 0.60 |
| 1994 | 9 | 28 | 0.39 | 6.22 | 1.48 | 3 | 0.48 |
| 1995 | 4 | 8 | 0.67 | 4.00 | 1.00 | 1 | |
| 1996 | 19 | 53 | 0.15 | 5.58 | 1.00 | 1 | 0.38 |
| 1997 | 13 | 45 | 0.29 | 6.92 | 1.24 | 2 | 0.69 |
| 1998 | 16 | 42 | 0.18 | 5.25 | 1.13 | 2 | 0.45 |
| 1999 | 14 | 38 | 0.21 | 5.43 | 1.31 | 2 | 0.55 |
| 2000 | 23 | 97 | 0.19 | 8.43 | 1.30 | 2 | 0.32 |
| 2001 | 25 | 184 | 0.31 | 14.72 | 2.68 | 6 | 0.34 |
| 2002 | 32 | 362 | 0.36 | 22.63 | 2.35 | 6 | 0.38 |
| 2003 | 31 | 399 | 0.43 | 25.74 | 2.26 | 5 | 0.47 |
| 2004 | 33 | 351 | 0.33 | 21.27 | 2.10 | 5 | 0.53 |
| 2005 | 36 | 532 | 0.42 | 29.56 | 2.49 | 6 | 0.43 |
| 2006 | 39 | 1860 | 1.26 | 95.38 | 2.35 | 6 | 0.47 |
| 2007 | 41 | 2124 | 1.30 | 103.61 | 2.23 | 6 | 0.60 |
| 2008 | 38 | 1498 | 1.07 | 78.84 | 2.47 | 7 | 0.45 |
| 2009 | 40 | 2122 | 1.36 | 106.10 | 2.52 | 6 | 0.48 |
| 2010 | 42 | 2965 | 1.72 | 141.19 | 2.36 | 5 | 0.54 |
| Year | Number of Nodes | Number of Edges | Graph Density | Average Degree | Average Path Length | Diameter | Clustering Coefficient |
|---|---|---|---|---|---|---|---|
| 1990 | |||||||
| 1991 | |||||||
| 1992 | |||||||
| 1993 | |||||||
| 1994 | 5 | 9 | 0.45 | 3.60 | 1.00 | 1 | 0.00 |
| 1995 | 4 | 13 | 1.08 | 6.50 | 1.00 | 1 | |
| 1996 | 5 | 21 | 1.05 | 8.40 | 1.00 | 1 | |
| 1997 | 11 | 31 | 0.28 | 5.64 | 1.00 | 1 | 0.60 |
| 1998 | 19 | 53 | 0.15 | 5.58 | 1.00 | 1 | 0.00 |
| 1999 | 11 | 36 | 0.33 | 6.55 | 1.00 | 1 | 0.00 |
| 2000 | 15 | 69 | 0.33 | 9.20 | 1.64 | 3 | 0.47 |
| 2001 | 18 | 93 | 0.30 | 10.33 | 1.36 | 2 | 0.43 |
| 2002 | 18 | 106 | 0.35 | 11.78 | 1.58 | 3 | 0.26 |
| 2003 | 20 | 110 | 0.29 | 11.00 | 1.45 | 3 | 0.00 |
| 2004 | 22 | 140 | 0.30 | 12.73 | 1.57 | 3 | 0.50 |
| 2005 | 26 | 248 | 0.38 | 19.08 | 1.93 | 4 | 0.29 |
| 2006 | 26 | 364 | 0.56 | 28.00 | 1.96 | 4 | 0.44 |
| 2007 | 38 | 870 | 0.62 | 45.79 | 3.07 | 9 | 0.50 |
| 2008 | 34 | 822 | 0.73 | 48.35 | 2.34 | 5 | 0.51 |
| 2009 | 36 | 1173 | 0.93 | 65.17 | 3.05 | 7 | 0.44 |
| 2010 | 42 | 2222 | 1.29 | 105.81 | 2.64 | 7 | 0.43 |
© 2016 by the authors; licensee MDPI, Basel, Switzerland. This article is an open access article distributed under the terms and conditions of the Creative Commons Attribution (CC-BY) license (http://creativecommons.org/licenses/by/4.0/).
Share and Cite
Oh, Y.; Yoon, J.; Lee, J.-D. Evolutionary Patterns of Renewable Energy Technology Development in East Asia (1990–2010). Sustainability 2016, 8, 721. https://doi.org/10.3390/su8080721
Oh Y, Yoon J, Lee J-D. Evolutionary Patterns of Renewable Energy Technology Development in East Asia (1990–2010). Sustainability. 2016; 8(8):721. https://doi.org/10.3390/su8080721
Chicago/Turabian StyleOh, Yoonhwan, Jungsub Yoon, and Jeong-Dong Lee. 2016. "Evolutionary Patterns of Renewable Energy Technology Development in East Asia (1990–2010)" Sustainability 8, no. 8: 721. https://doi.org/10.3390/su8080721