Substrate Depth, Vegetation and Irrigation Affect Green Roof Thermal Performance in a Mediterranean Type Climate


1
School of Ecosystem and Forest Sciences, Faculty of Science, The University of Melbourne, 500 Yarra Blvd, Richmond 3070, Australia
2
Renewable Energy and Energy Efficiency Group, Department of Infrastructure Engineering, Melbourne School of Engineering, The University of Melbourne, Melbourne 3010, Australia
3
CSIRO Land and Water, CSIRO, Clayton South Victoria 3169, Australia
*
Author to whom correspondence should be addressed.
Sustainability 2017, 9(8), 1451; https://doi.org/10.3390/su9081451
Submission received: 30 June 2017
/
Revised: 10 August 2017
/
Accepted: 10 August 2017
/
Published: 16 August 2017
(This article belongs to the Special Issue Climate Change Mitigation and Adaptation - ZEMCH 2016)
Abstract
:Green roofs are consistently being used to reduce some of the negative environmental impacts of cities. The increasing interest in extensive green roofs requires refined studies on their design and operation, and on the effects of their relevant parameters on green roof thermal performance. The effects of two design parameters, substrate thickness (ST) and conductivity of dry soil (CDS), and four operating parameters, leaf area index (LAI), leaf reflectivity (LR), stomatal resistance (SR), and moisture content (MC), were investigated using the green roof computer model developed by Sailor in 2008. The computer simulations showed that among the operating parameters, LAI has the largest effects on thermal performance while CDS is a more influential design parameter than ST. Experimental investigations of non-vegetated and sparsely vegetated green roofs in Melbourne were principally used to understand the effect of the substrate and enable better understanding of dominant heat transfer mechanisms involved. Investigated green roofs had three substrate thicknesses (100, 150 and 200 mm), and their performance was compared to a bare conventional roof. In contrast to the computer simulations, the experimental results for summer and winter showed the importance of MC and ST in reducing the substrate temperature and heat flux through the green roof.
1. Introduction
As part of efforts to reduce air pollutants, greenhouse gases and their carbon footprint [1,2], cities and towns have introduced new technologies and techniques to mitigate some of negative impact of cities on the environment and make cities greener and more sustainable [3,4,5]. Green roofs, also called vegetated or living roofs, are growing in popularity worldwide and offer a potential solution to the some of the negative environmental impacts of cities [6,7]. Green roofs are engineered ecological systems integrated with the built environment to provide a wide range of ecosystem services, such as air purification [8], social and recreational opportunities [9], mitigation of stormwater runoff [10] and urban heat island effect [11], and they can also provide biodiversity habitat [12]. Green roofs also offer direct energy benefits to buildings and their surrounding areas, such as decreasing building cooling and thermal loads, reducing building energy consumption and, to some extent, mitigation of the urban heat island (UHI) effect [13,14,15,16]. Reduction of building energy consumption produced from burning fossil-based fuels helps reduce the emission of greenhouse gases and air pollution [17].
Studies have been conducted all around the world to quantify the extent to which green roofs reduce the heating and cooling loads of commercial and residential buildings. Findings are varied and sometimes in contrast to one another. Common findings are that green roof thermal performance depends on the climate zone, the building materials, the seasonality and the green roof material selection [16,18,19,20,21,22,23]. For example, in cold climate areas, a thick substrate enhances thermal performance compared to a thin substrate [24]. In contrast, in hot and wet climate areas, a thin 10 cm deep substrate is sufficient to reduce the energy required for cooling the space below [25], while the greatest benefit to green roof thermal performance is offered by a dense and healthy vegetation [26]. For hot and dry climates, appropriate plant selection is essential because green roofs need to be drought tolerant [27].
Because of these wide ranging results, it is not possible to specify one “optimum” green roof build-up (drainage layer, substrate or growing medium and plants) that will maximise green roof thermal benefits in all countries or climate zones. In situ research is therefore necessary to help select substrates and plants for green roofs in various locations [19].
Parametric, also called sensitivity, analyses using existing green roof thermal models can help understand which parameters are most effective in enhancing green roof thermal benefits, and thus maximise green roof thermal performance in different locations. However, this is not sufficient, unless the results of the parametric analysis are validated with field measurements and a comprehensive evaluation.
In the first part of this study, we investigate the effect of two design parameters and four operating parameters using the green roof computer model developed by Sailor [28]. Design parameters refer to properties of green roofs, which do not change throughout the year or the life of the green roof, and are related to the substrate composition and depth. In contrast, operating parameters change during the life of green roofs and influence, and they are influenced by, their vegetation dynamics [29,30,31].
Subsequently, we present substrate temperatures and heat fluxes of three green roofs in non-vegetated and sparsely vegetated states and the heat flux values of a bare conventional roof to validate the magnitude of Sailor’s green roof thermal model outputs. Finally, we discuss the results from computer simulations and experimental green roofs.
2. Materials and Methods
2.1. Computer Simulations
Among the green roof thermal computational models developed and available from the literature [32,33,34,35], we selected the model developed by Sailor [28]. The model is a phenomenological model based on the Fast All-Season Soil Strength (FASST) model developed by Frankenstein and Koenig and it is available within EnergyPlus building energy simulation software tool [36].
Sailor’s model comprise many variables and parameters, some relevant to the vegetation layer, and others to the substrate layer, called soil in the model. As a result of a review of the literature [19], we selected three vegetation parameters and three soil parameters as the most relevant to a green roof thermal performance for further investigation. These are: (i) Leaf Area Index (LAI); (ii) Leaf reflectivity (LR); (iii) Minimum stomatal resistance (SR); (iv) Substrate thickness (ST); (v) Conductivity of dry soil (CDS); and (vi) Saturation volumetric moisture content (MC). These parameters were specifically selected to investigate the effects of design (ST and CDS) and operating parameters (LAI, LR, SR and MC) on green roof thermal performance.
Simulations were conducted with EnergyPlus 8.3.0. for a period of 30 days in summer (December 2014). Each input parameter was varied for three to four values (Table 1). The EnergyPlus weather file for the simulations was prepared with the data collected by a weather station on top of the two storey Main Building at The University of Melbourne’s Burnley campus (six kilometres from the centre of Melbourne). Data include ambient air temperature, ambient air relative humidity, rainfall, wind speed, wind direction and photosynthetically active radiation (PAR) collected every six minutes and averaged for one hour. Direct solar radiation was collected from another weather station located 500 m away from the roof weather station. Infrared downward radiation was calculated using the model developed by Bras [37]. The internal boundary conditions were set as 21 °C for heating and 20.9 °C for cooling.
The energy fluxes (Equations (1)–(6)) in Sailor’s model [28] were developed from FASST vegetation model by Frankenstein and Koenig [36]. Sailor’s model highlights two main fluxes: one for the soil (substrate) layer (Equation (1)) and the other for the vegetation (Equation (4)). The sensible and the latent heat flux components incorporated in each main equation are explained in Equations (2), (3), (5) and (6).
Energy flux for the soil (W m−2):
Sensible heat flux at the foliage/soil interface (W m−2):
Latent heat exchanges of the soil (W m−2):
Energy flux for vegetation (W m−2):
Sensible heat flux at the atmosphere/foliage interface (W m−2):
Latent heat exchanges of the foliage (W m−2):
2.2. Experimental Green Roofs
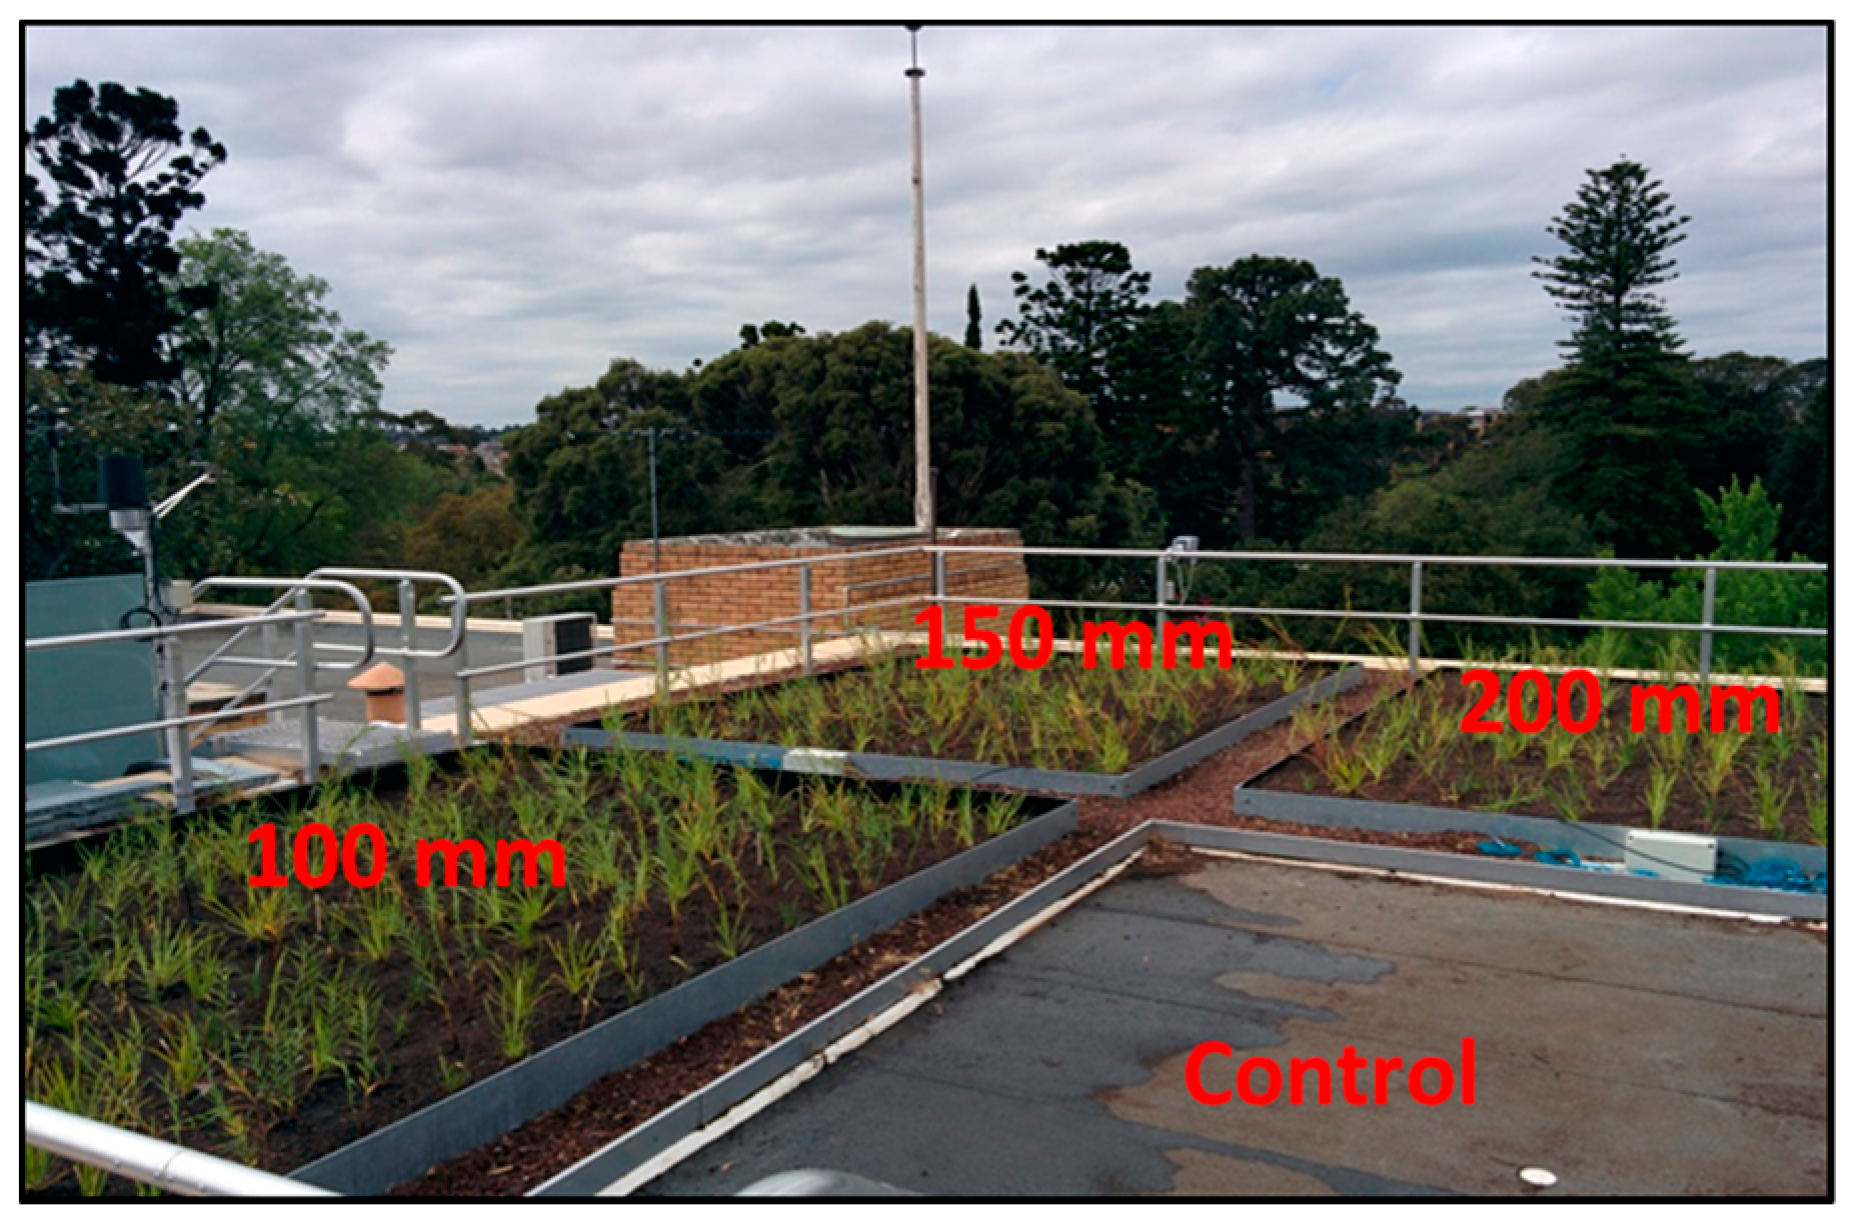
Computer simulations may provide inaccurate or, sometimes, unrealistic results when the conditions for the embedded assumptions are no longer valid. For this reason, we present substrate temperatures and heat fluxes collected from three experimental green roofs, and a bare conventional bituminous roof (no plants or substrates) on the Main Building at The University of Melbourne’s Burnley Campus.
Each of the three green roofs has an approximate area of 15 m2. They have a scoria mix (volcanic rock) substrate layer 100, 150 or 200 mm deep. Underneath the substrate layer, each green roof has:
- 0.6 mm filter layer (ZinCo filter sheet SF);
- 40 mm drainage layer (ZinCo Floradrain® FD 40-E);
- 5 mm protection layer (ZinCo SSM45 protection mat); and
- 0.36 mm high-density polyethylene (HDPE) root barrier.
The roof of the building is a 190 mm concrete slab lined with a waterproof bituminous coating and 10 mm of plaster board on the inside.
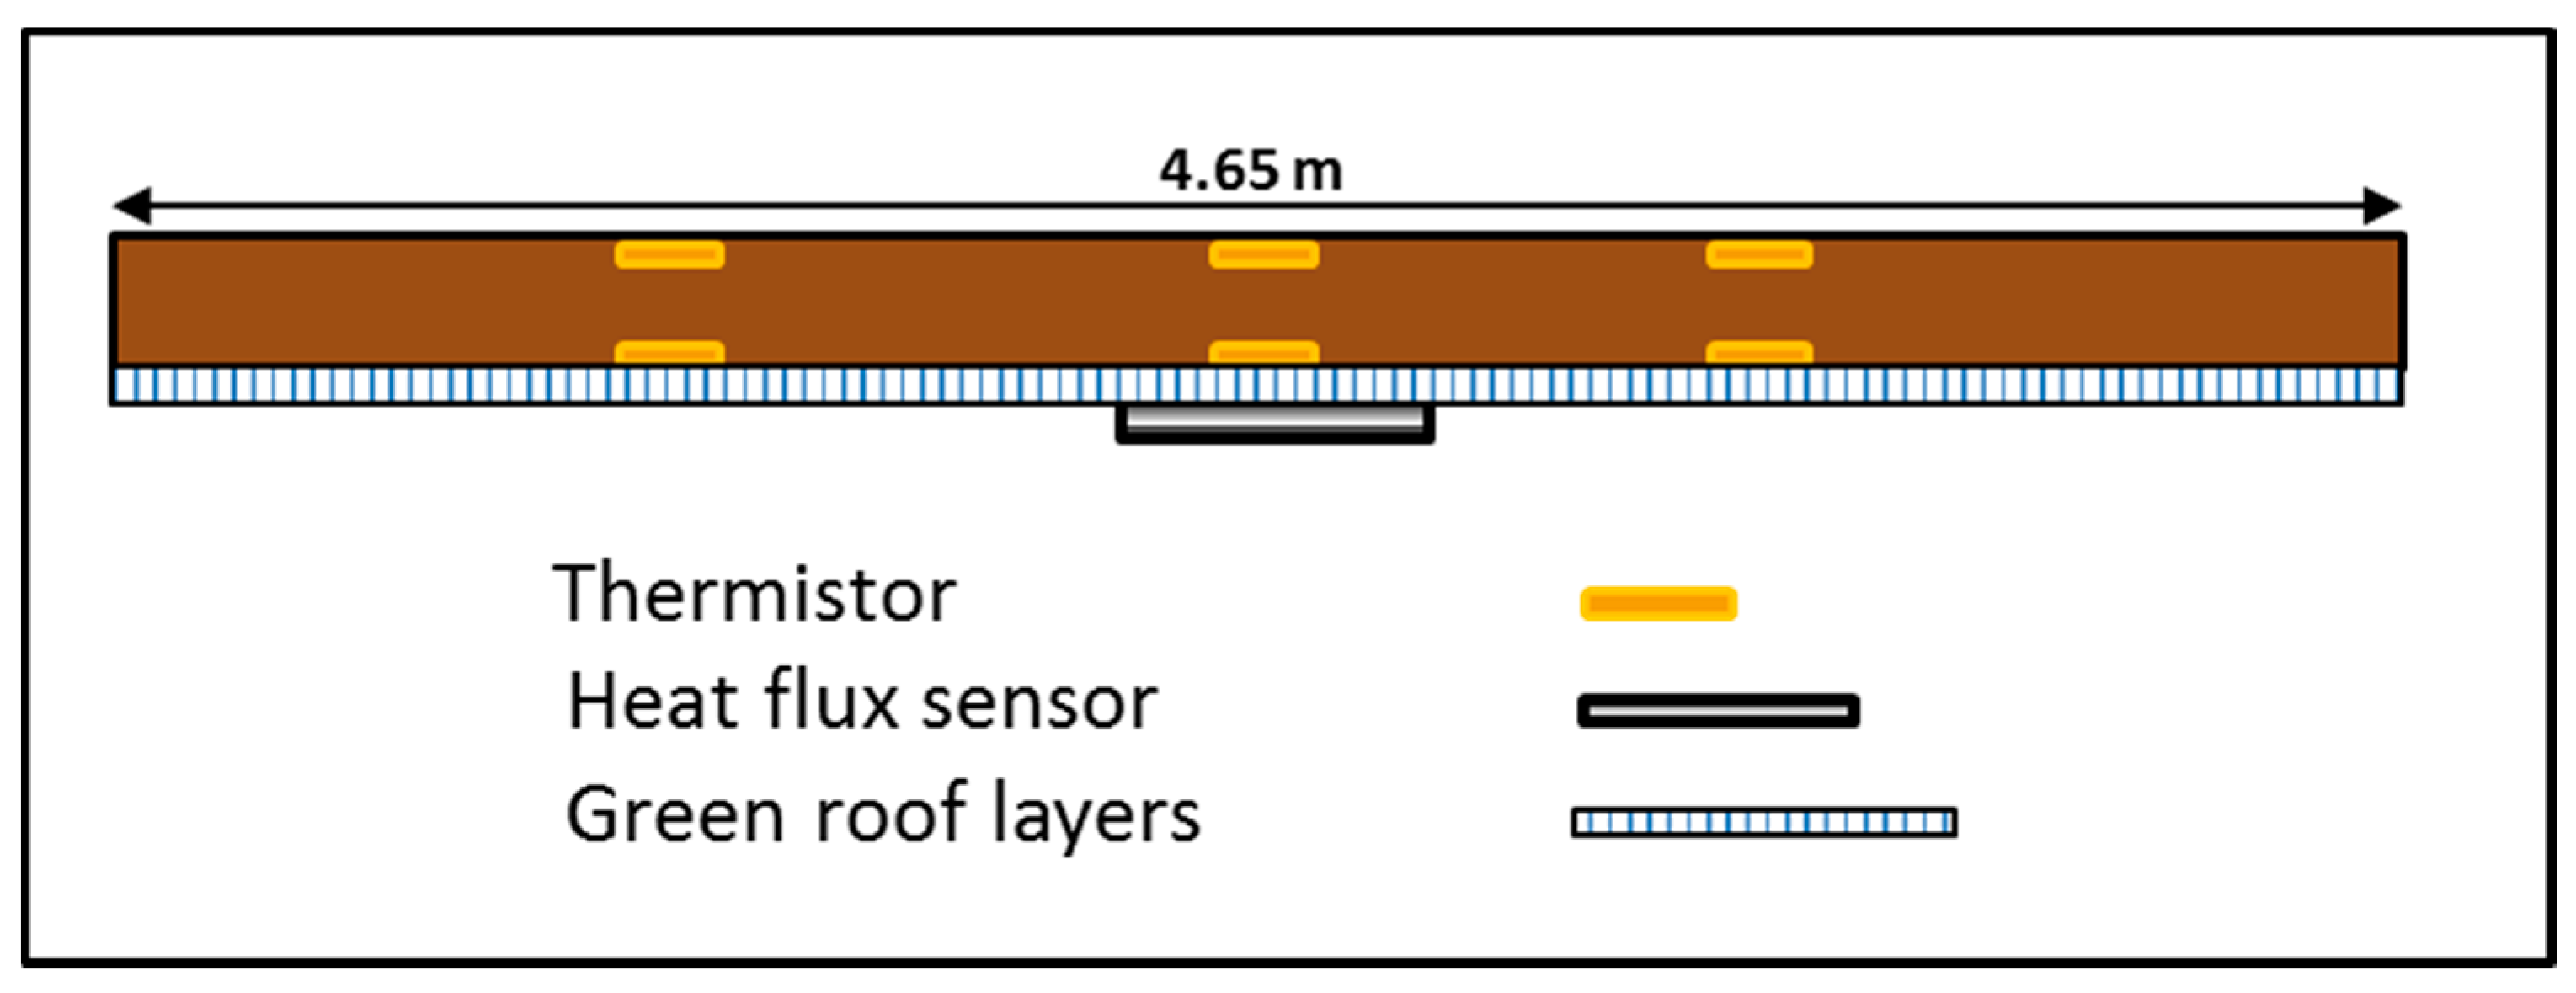
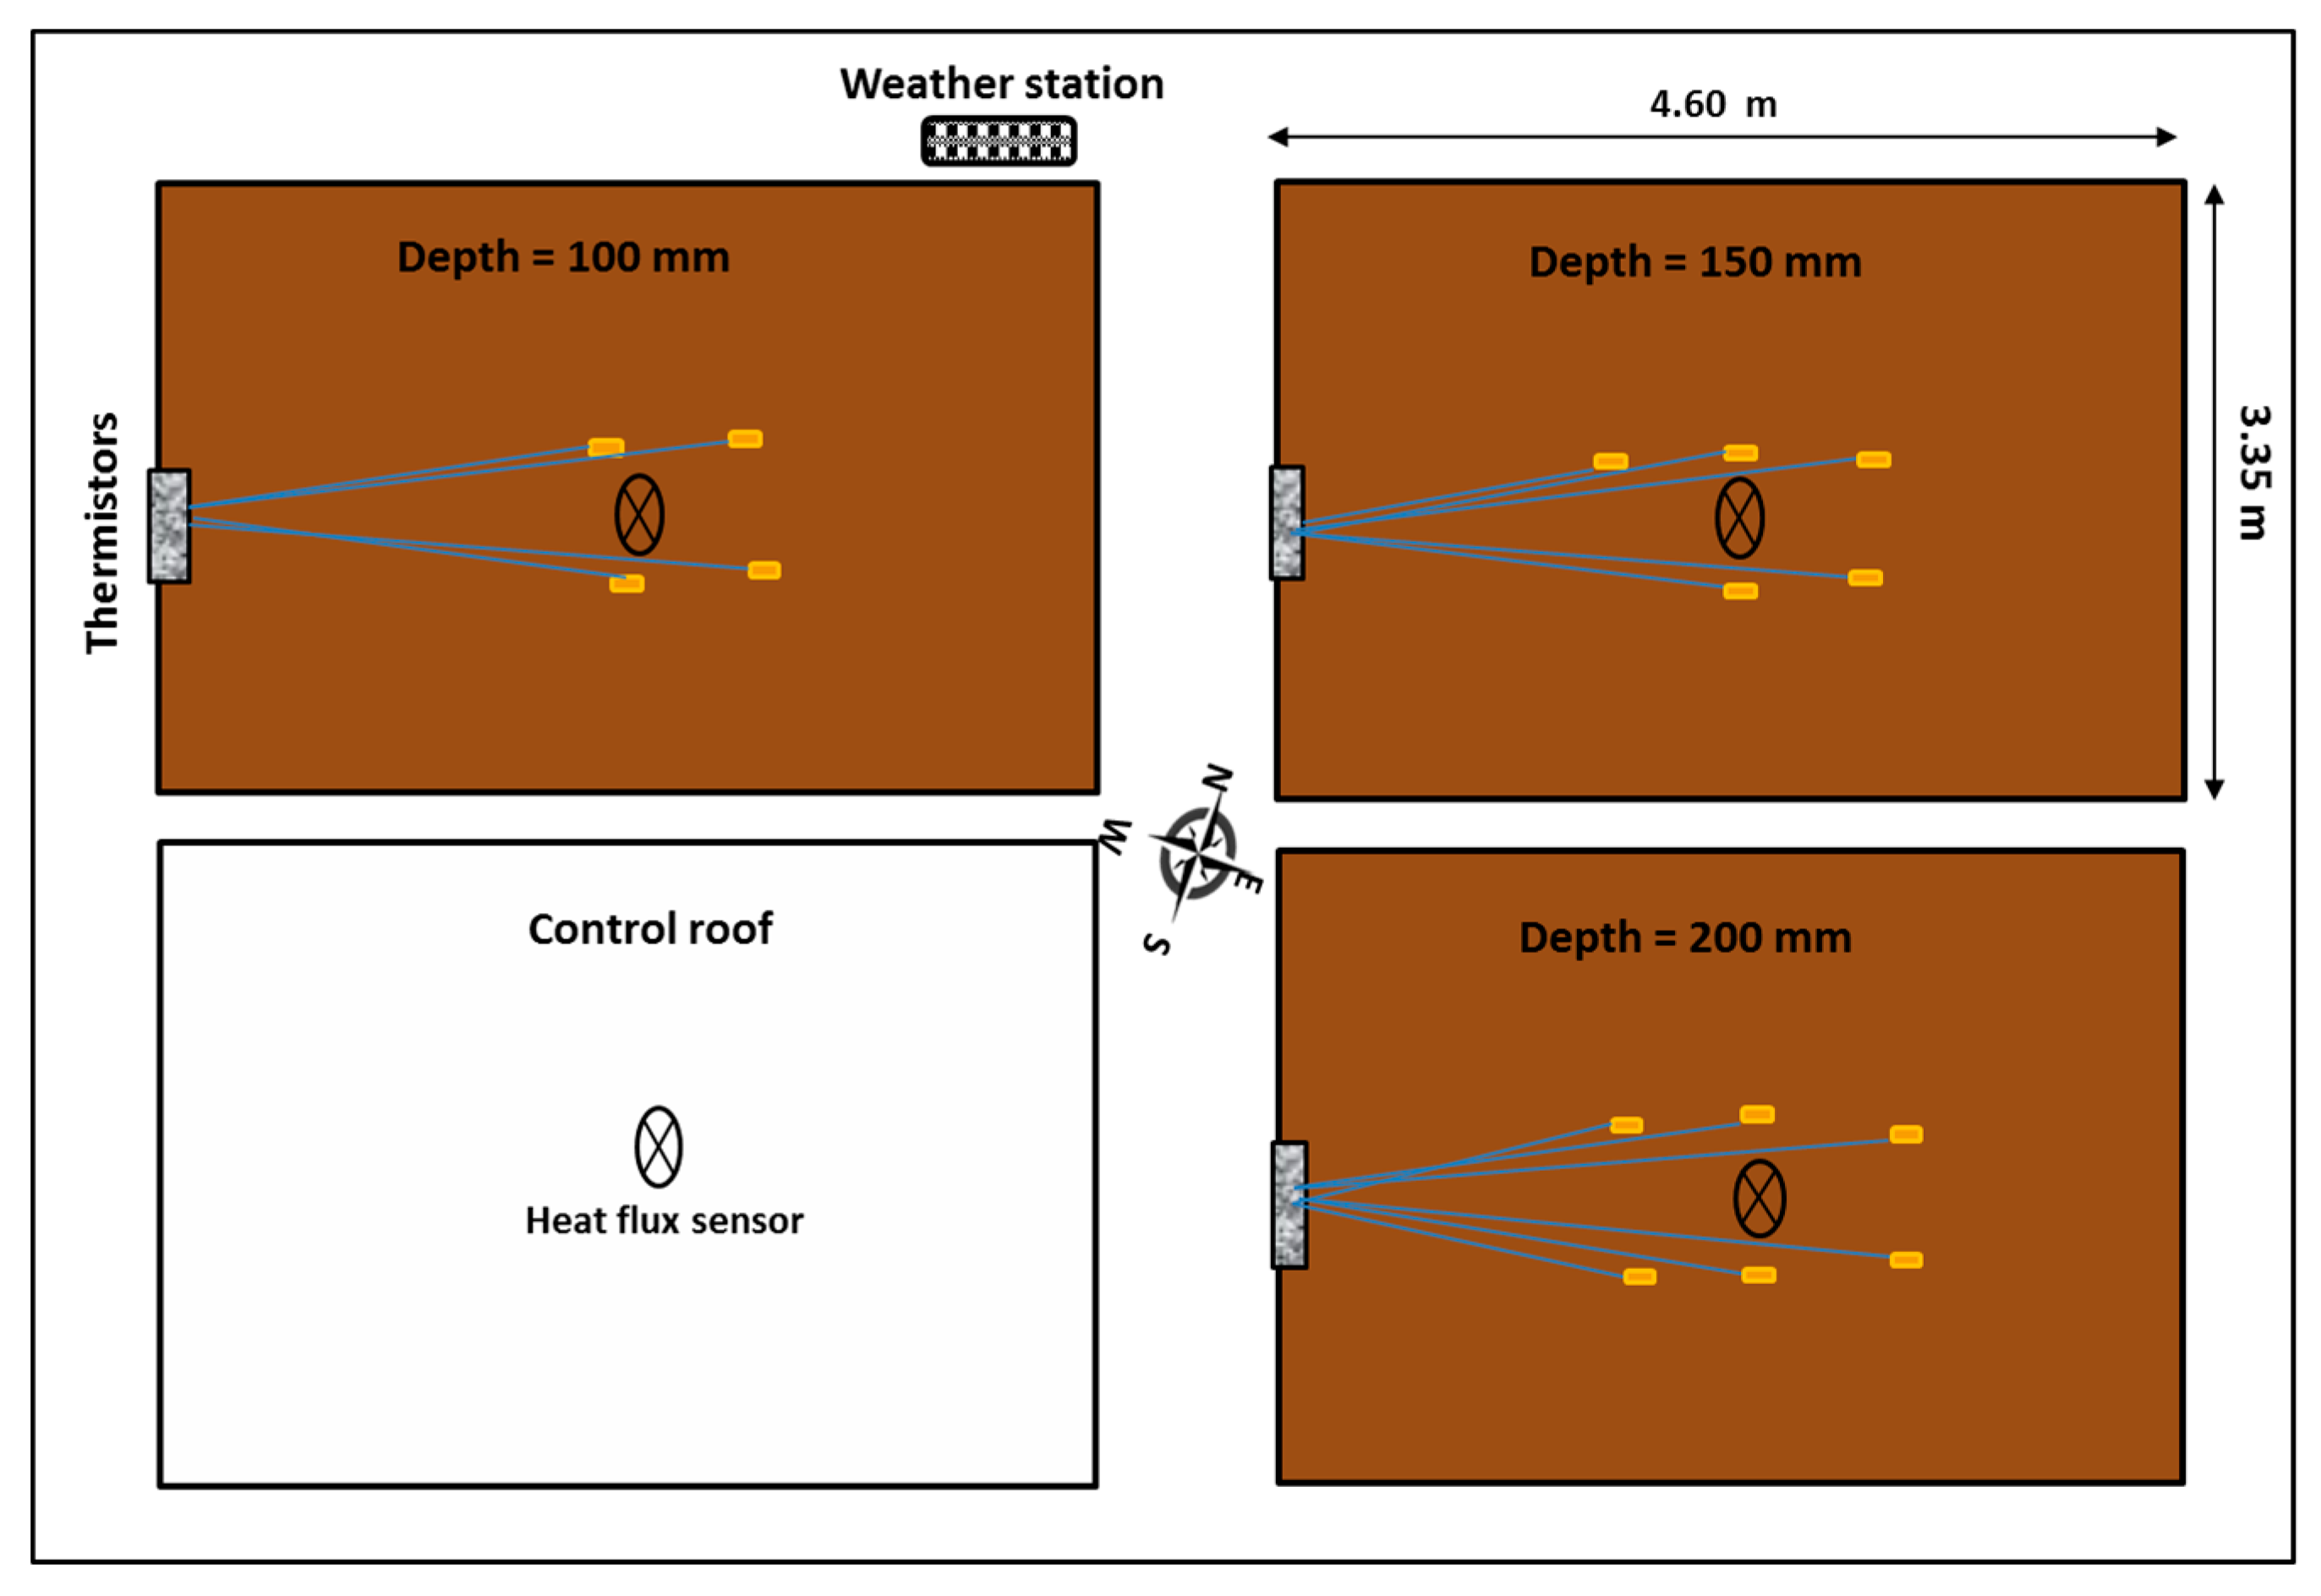
We first measured and recorded soil temperatures and heat fluxes from the green roofs in summer 2014 and winter 2015 before they were planted (non-vegetated), and then we collected data from the same green roofs when they were sparsely vegetated in summer 2015. Temperatures were measured with thermistors (Emerson Climate Technologies, Sidney, OH, USA, model 501-1125) placed at the surface and at the bottom of the substrate layer (Figure 1). Thermistors were placed in different locations across the three green roofs: four, five and six locations for the 100, 150 and 200 mm green roofs, respectively (Figure 2). Heat flux was measured in the centre of each roof with heat flux plate (Hukseflux, Delft, The Netherlands, model HFP01-L10m) placed between the green roof component layers and the top of the roof bituminous coating. The heat flux sensor for each roof, including the bare roof, was placed exactly at the middle to avoid edge influence. Data were recorded every six minutes by a Campbell Scientific data logger (CR1000-4M) and averaged over one hour.
After a data collection period with no vegetation (non-vegetated with substrate only), we planted each of the green roofs with three Australian high-water use plant species, Stypandra glauca, Dianella admixta and Lomandra longifolia. These plants were selected as part of a larger research project due to their high transpiration rates, but also because they can tolerate long drought periods common in Melbourne summers [38]. Plant foliage coverage was quantified through photo pixel counts using Adobe Photoshop CC 2015 program. Photos were taken by a GoPro Hero4 Camera (GoPro, Inc., San Mateo, CA, USA) 4 m above the central point of each green roof.
3. Results and Discussion
Results for the parametric analysis were simulated for 30 days in December 2014, but they are presented for only 10 days (2–11 December) in this paper. This was done primarily to aid interpretation through less condensed graphs. We selected two outputs from the simulations in EnergyPlus: the substrate temperature (°C) and the heat flux through the substrate (W m−2) (soil, in the model). The outputs are calculated from Equations (1)–(3), which, by default, relate to the interface between the soil and the vegetation. The heat flux is calculated by adding the “green roof soil sensible heat transfer rate per unit area” to the “green roof latent heat transfer rate per unit area” outputs given by the simulations. We have selected these two outputs to compare the results with the measured data from the experimental green roofs. For the period simulated, there is an unrealistic result for the third day (Hours 49–72). As the substrate was initially very dry, justification for this result may be related to the rain event that occurred during Hours 46–55. The consequent rapid change in the substrate moisture content and the issues around the moisture diffusion accuracy [39], are likely to justify the unrealistic result simulated after the first rain event. However, this result does not hinder the main scope of this study. Future study will look further on model validation.
Substrate temperature and heat flux data were analysed from the three experimental green roofs during the same period (2–11 December 2014) for comparison.
Substrate temperature and heat flux data were analysed for 10 winter days (1–10 June 2015) to provide additional data from non-vegetated green roofs to better understand the effect of operating and design parameters during winter. Analyses for summer and winter also show rainfall, ambient air temperature and total incoming solar radiation.
Heat flux for 10 summer days (11–20 December 2015) when the roof was sparsely vegetated is also included. During this time, substrate temperatures were not collected. Heat flux of the bare roof was also collected and presented.
3.1. Parametric Analysis
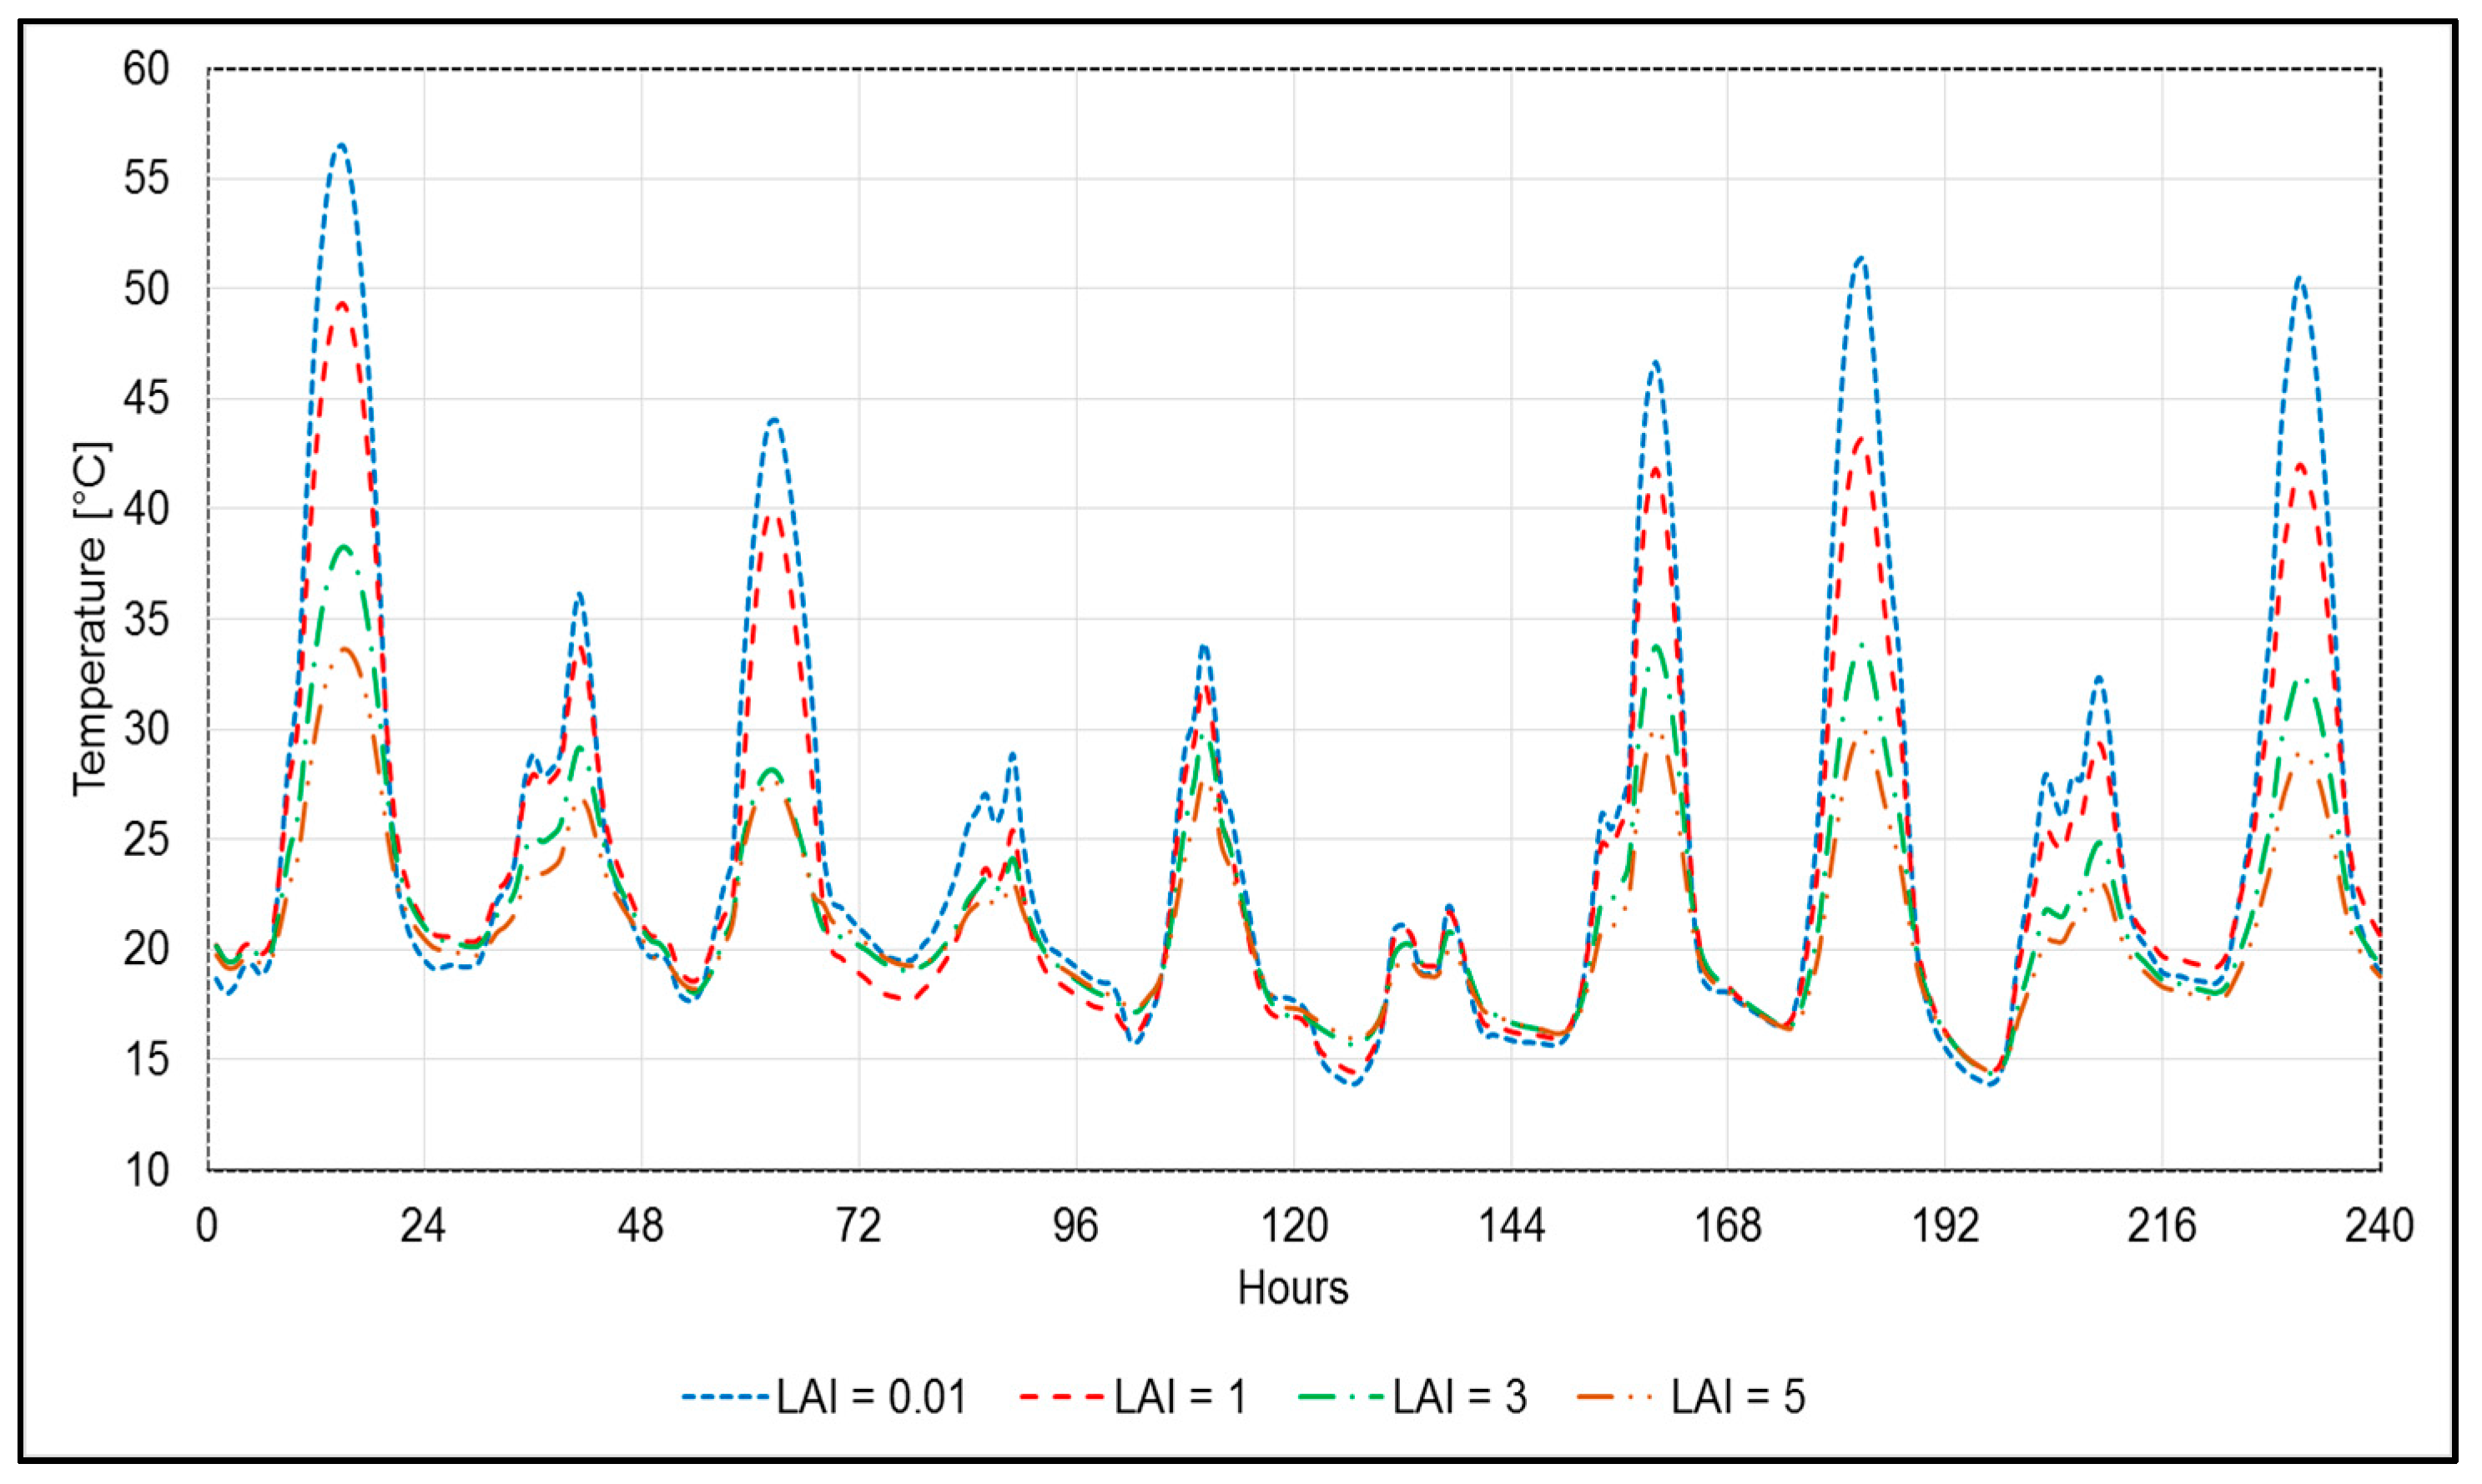
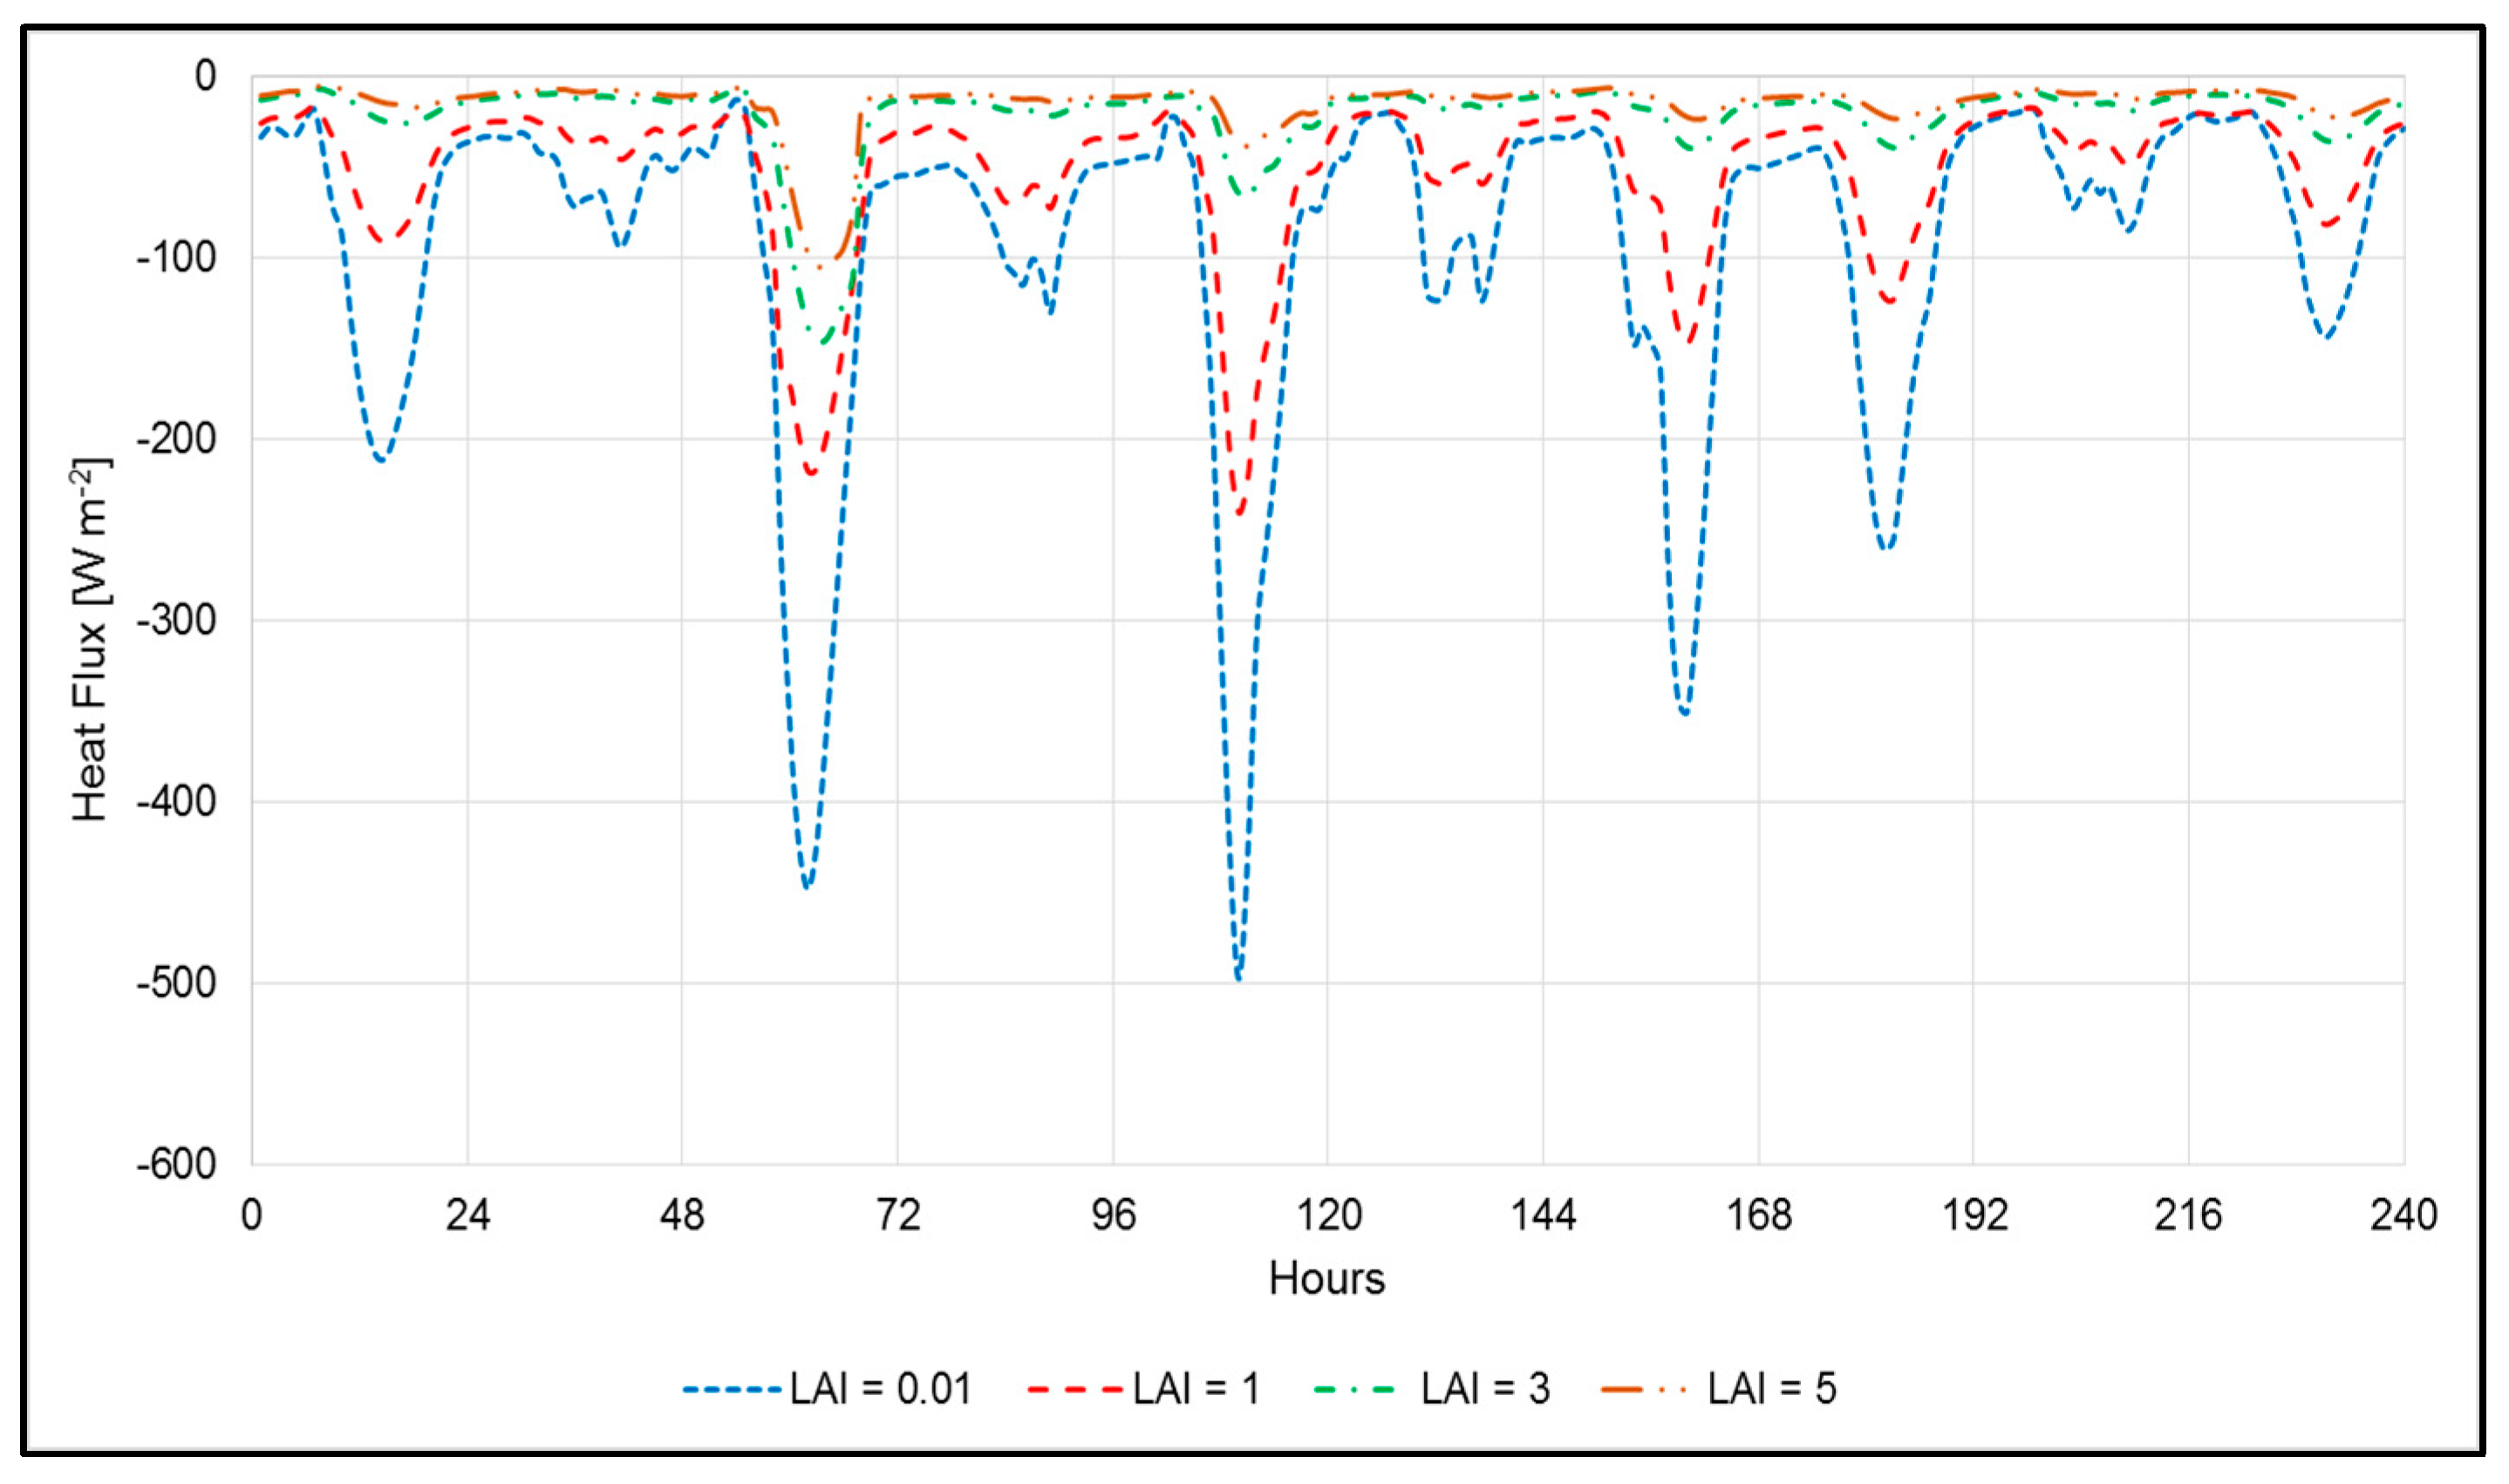
Among the vegetation and operational parameters, the parametric analysis showed that significantly higher LAI values reduced both the substrate temperature (Figure 3) and the heat flux (Figure 4). This agrees with studies conducted in Mediterranean climate areas [20,21]. Reduction of the temperature was apparent during daytime and particularly for sunny days. The highest Leaf Area Index value (LAI = 5) reduced the temperature by up to 25 °C compared to the lowest value (LAI = 0.01) (i.e., Hours 1–24 and 169–192). On cloudy days (i.e., Hours 25–48 and 121–144), the magnitude of this parameter was considerably reduced. Even though LAI = 5 offered the greatest temperature reduction benefits, results for LAI = 3 were less than 5 °C higher than LAI = 5 at maximum. Results were similar on cloudy days. For heat flux (Figure 4), LAI = 3 and LAI = 5 offered a comparable result, meaning that a less dense vegetation can provide the same effect as very dense vegetation. However, LAI is normally slow to accumulate on hot and dry green roofs when plants are planted as tube stock, therefore additional irrigation and high density planting would be necessary to reach such high LAI values and maintain healthy and dense plants.
In contrast to LAI findings, the other two vegetation and operational parameters tested (SR and LR) and soil parameters did not show such a significant benefit in all the simulations conducted. For this reason, LR figures are not reported here, but they can be found in the conference paper [40] together with figures for ST and MC.
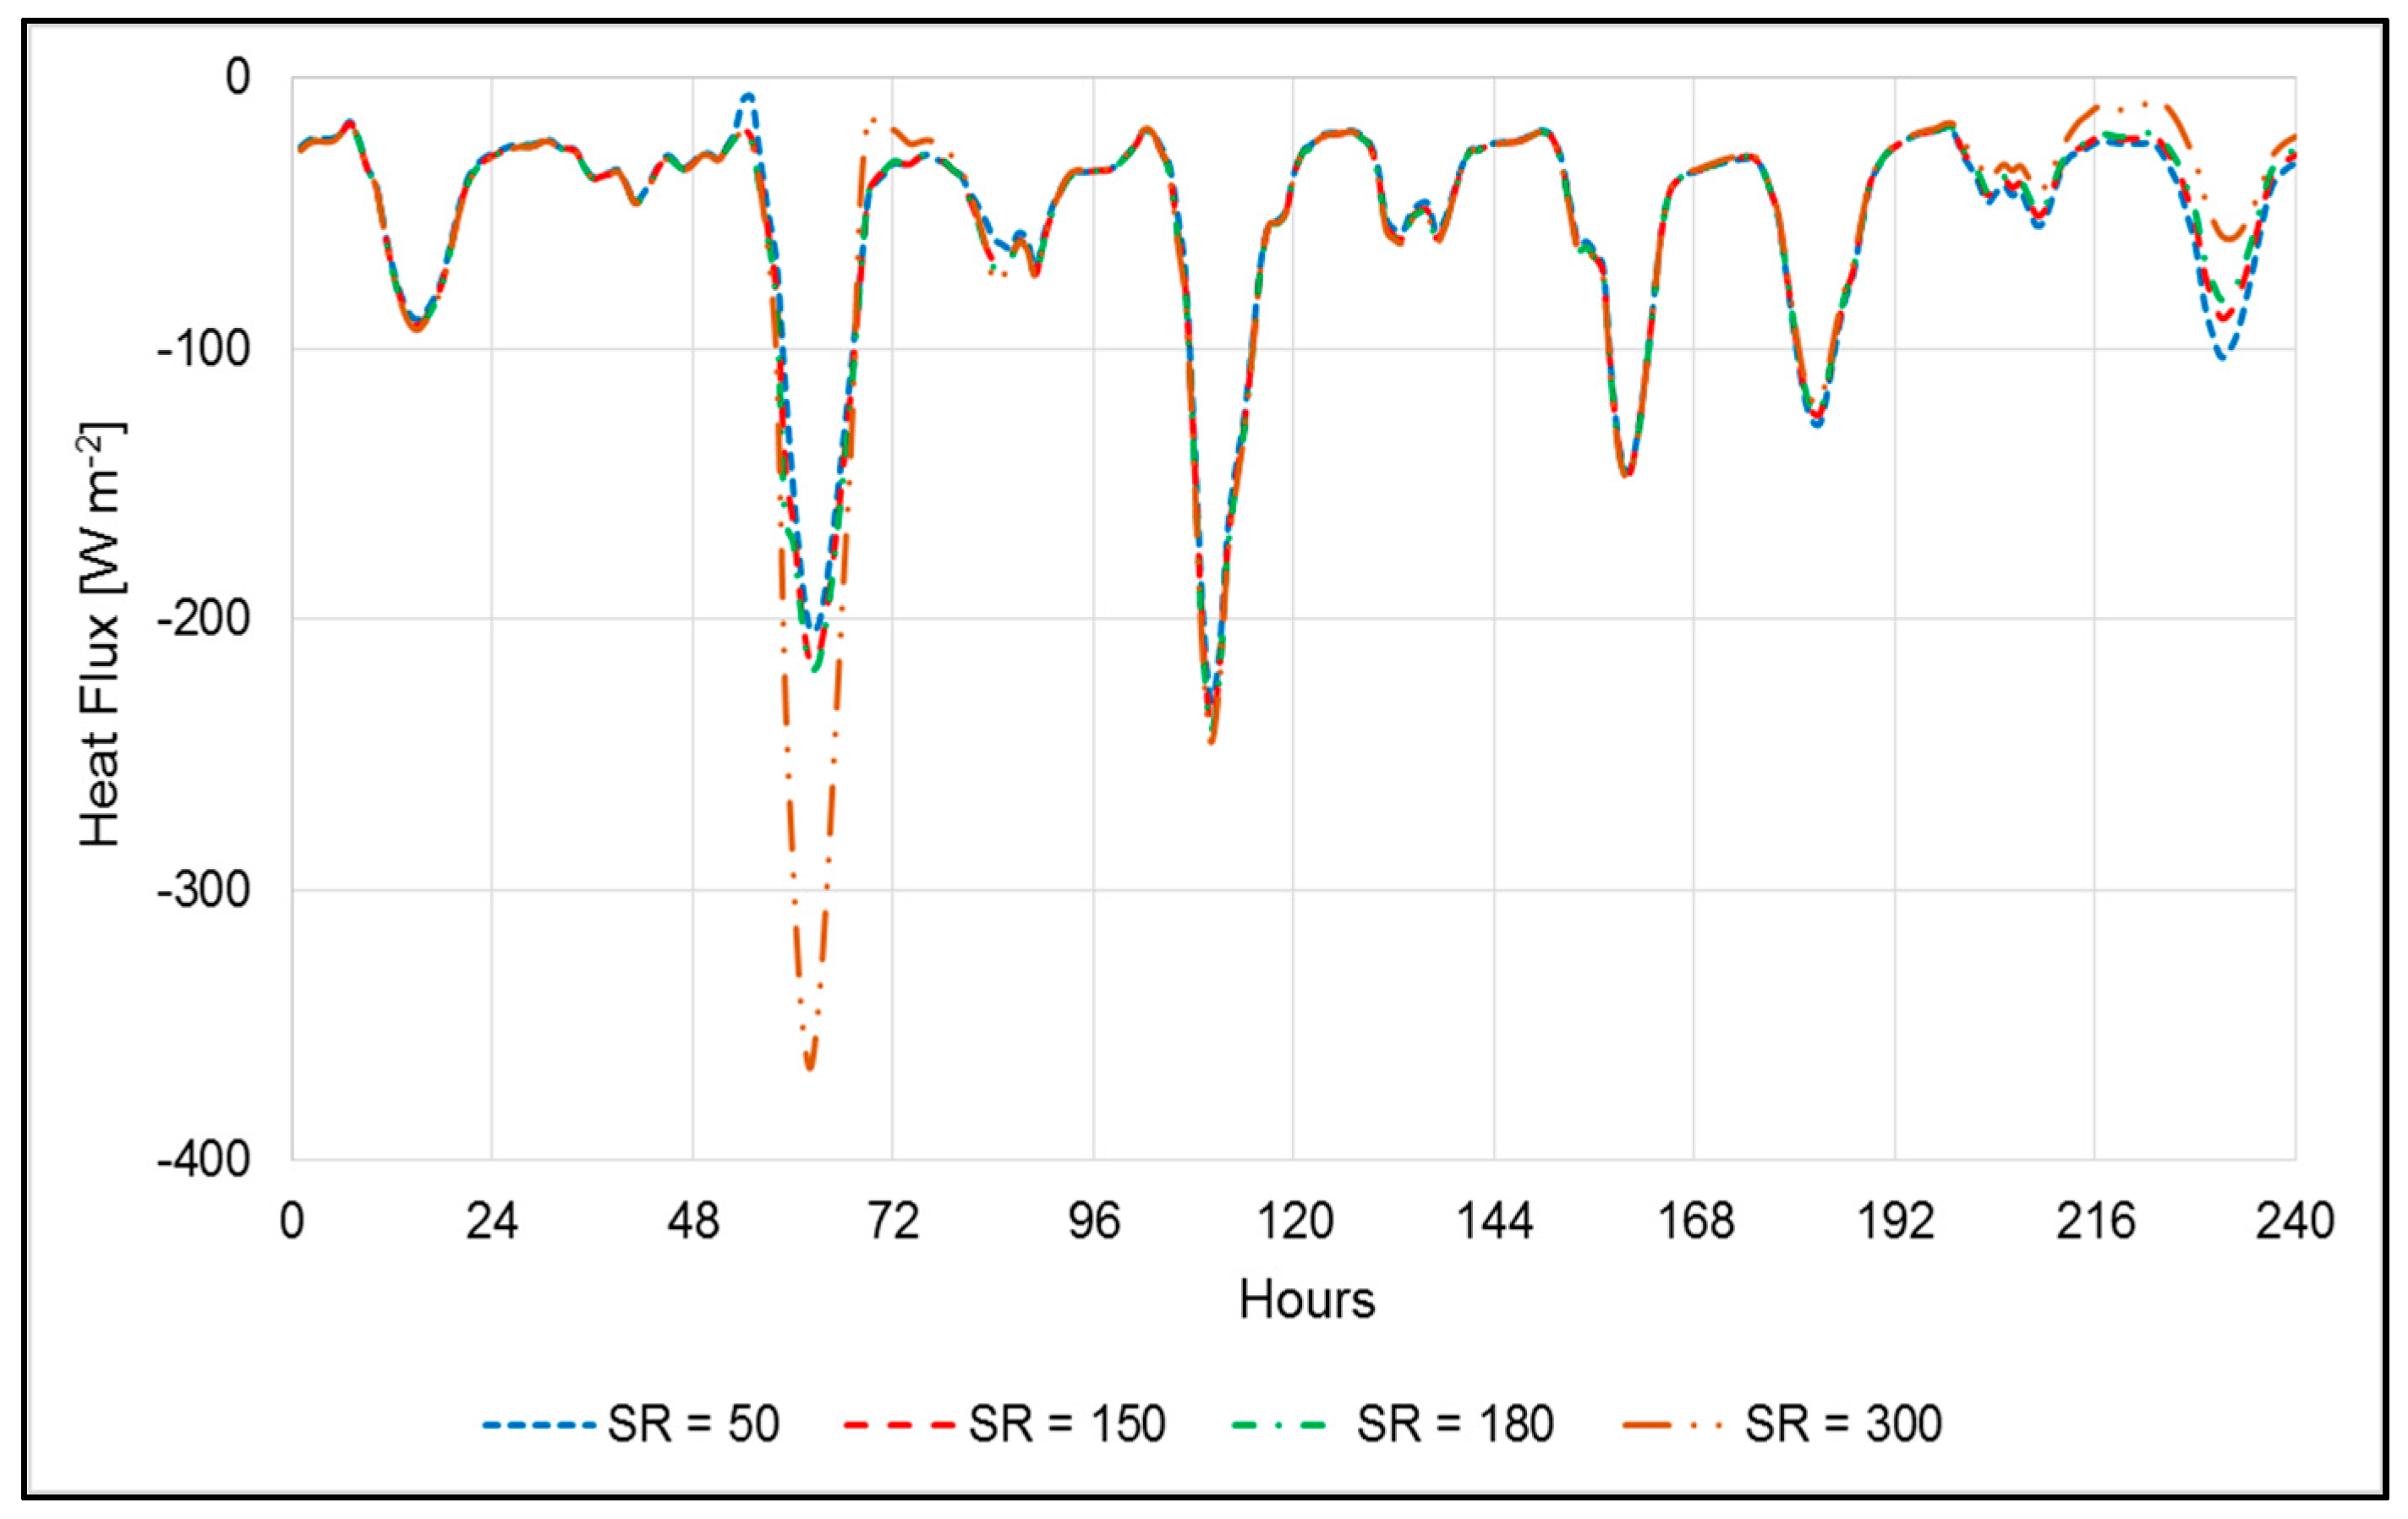
Simulations were done keeping LAI = 1 to better isolate the effect of Stomatal resistance (SR) (Figure 5 and Figure 6) and Leaf reflectivity (LR). On some dry days (i.e., Hours 1–24 and 217–240, Figure 5), simulations of high SR values showed a considerable difference compared to simulations of low SR values. For example, substrate temperature of SR = 300 simulation was up to 4 °C higher than SR = 50 (Hours 217–240). This is because high stomatal resistance value translates into a low transpiration rates, as the plants attempt to conserve water, and thus have a lesser cooling effect. In addition, we can notice slight differences in Hours 50–80. They occur after a rainfall event followed by a hot day, with temperature close to 30 °C. Under this condition, plants with higher SR conserved the water in their leaves, and thus increased the temperature by significantly reducing transpiration. After this period, additional rain events occur, however the following days were not particularly hot and the moisture content is likely to be retained longer until Hours 200–240 when the plants reach a similar stress as explained before.
None of the soil parameters considered significantly reduced soil temperature or the heat flux. However, this was expected because the simulations in EnergyPlus with Sailor’s model only consider the interface between vegetation and soil; hence, they overlooked the benefits of the layers underneath this interface (i.e., the whole substrate layer, the drainage layer, etc.).
Surprisingly, there was little effect of varying the design parameter substrate thickness (ST) as simulation results were consistent for all values, except on two dry days (i.e., Hours 73–96 and 210–225 [40]) where the thickest simulated extensive green roof substrate (ST = 0.30 m) had cooler temperatures than the other values. Heat flux of the thickest substrate on these days was lower [40], meaning that larger thermal mass, when dry, can provide a better cooling effect.
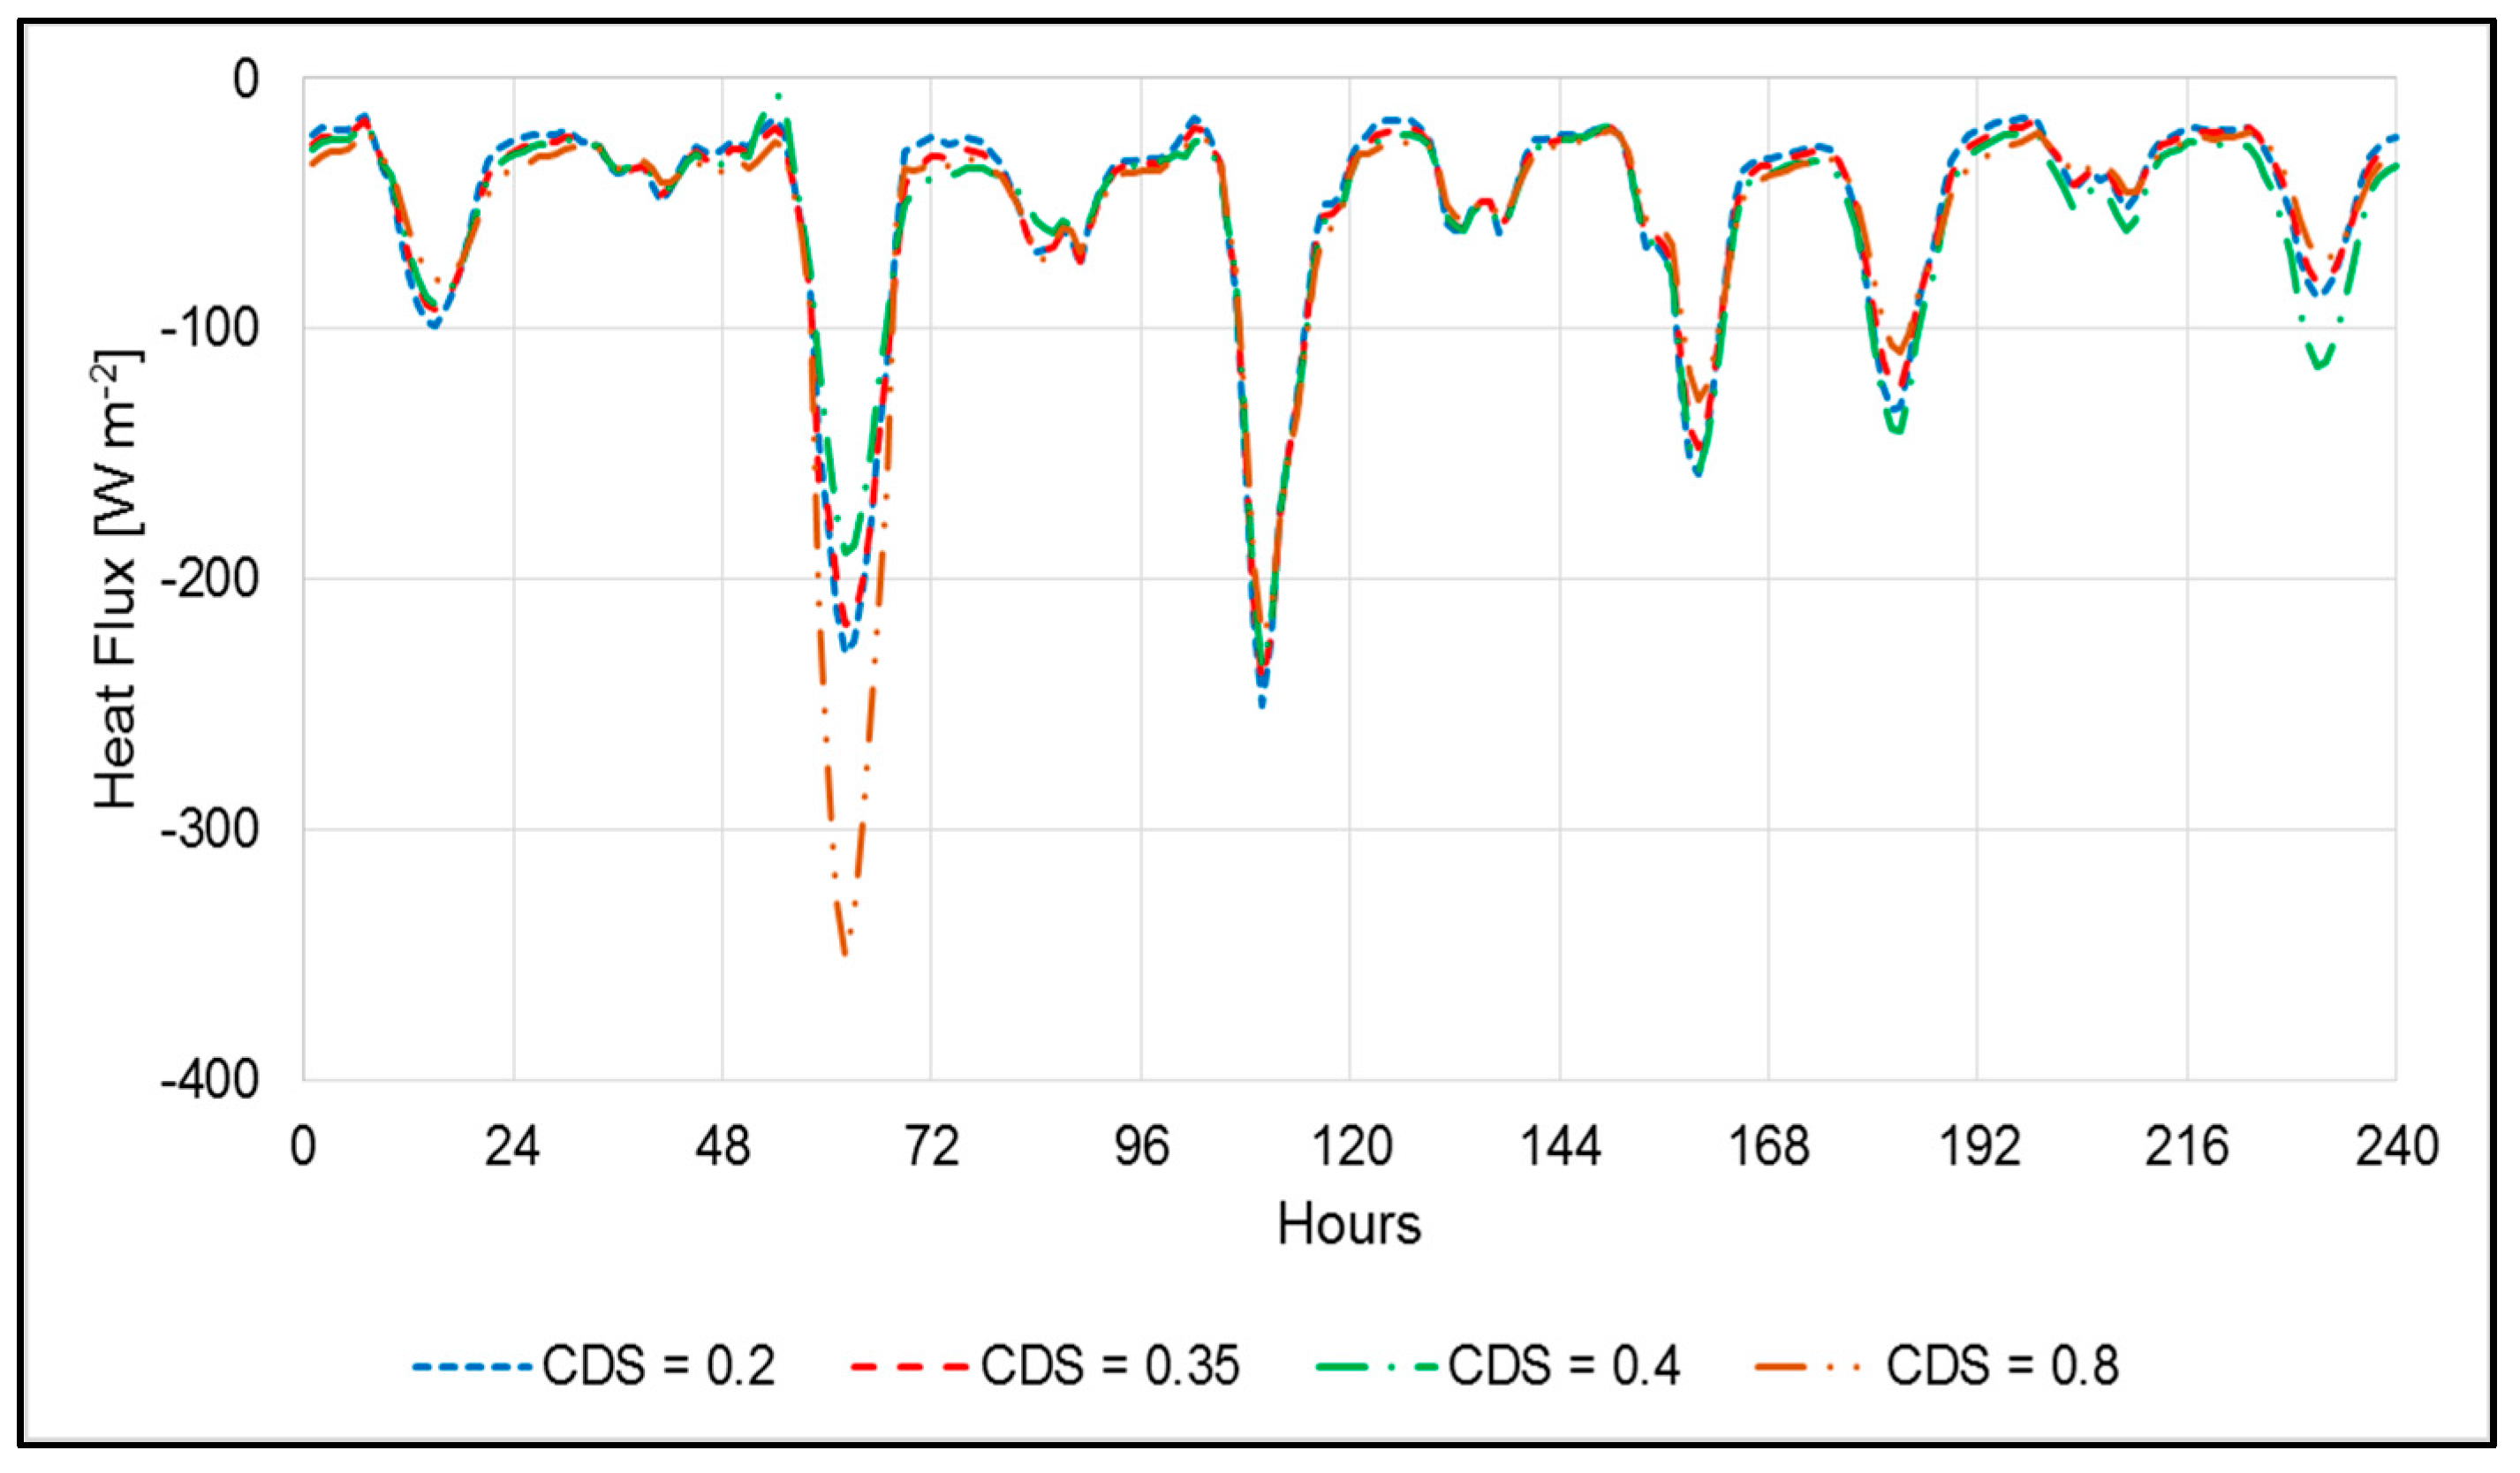
The conductivity of dry soil (CDS) design parameter (Figure 7 and Figure 8) showed varying results for most days across all simulations. CDS = 0.2 simulated temperatures up to 5 °C higher than CDS = 0.8 on sunny days (i.e., Hours 145–168 and 169–192), and provided similar temperatures as CDS = 0.35, CDS = 0.4 and CDS = 0.8 simulations on cloudy days (i.e., Hours 121–144, Figure 7). Similarly, heat flux (Figure 8) differences were more evident on sunny days, but did not have a clear pattern. Due to the limitations of the soil outputs, which we have already explained, the parametric analysis does not fully reveal the importance of the CDS for the green roof thermal performance as shown in previous studies [21,39,41].
Finally, the operational parameter soil moisture content (MC) showed small differences (~2 °C) in the temperature peaks on sunny days (i.e., Hours 169–192 [40]). The only significant differences were noted in the hours of a rainfall event (i.e., Hours 49 and 96 [40]). However, results were difficult to interpret for the soil temperature outputs, while they were generally uniform for the heat flux output [40].
Overall, the parametric analysis provided limited insight into the effects of the parameters tested, with the exception of the operational parameter LAI. To better understand the influence of different parameters, field measurements are recommended, in particular for those parameters that offered insignificant results, such as ST and MC. Examples are provided in the next section using results from experimental roofs in Melbourne.
3.2. Summer and Winter Temperatures and Heat Fluxes of Non-Vegetated Green Roofs
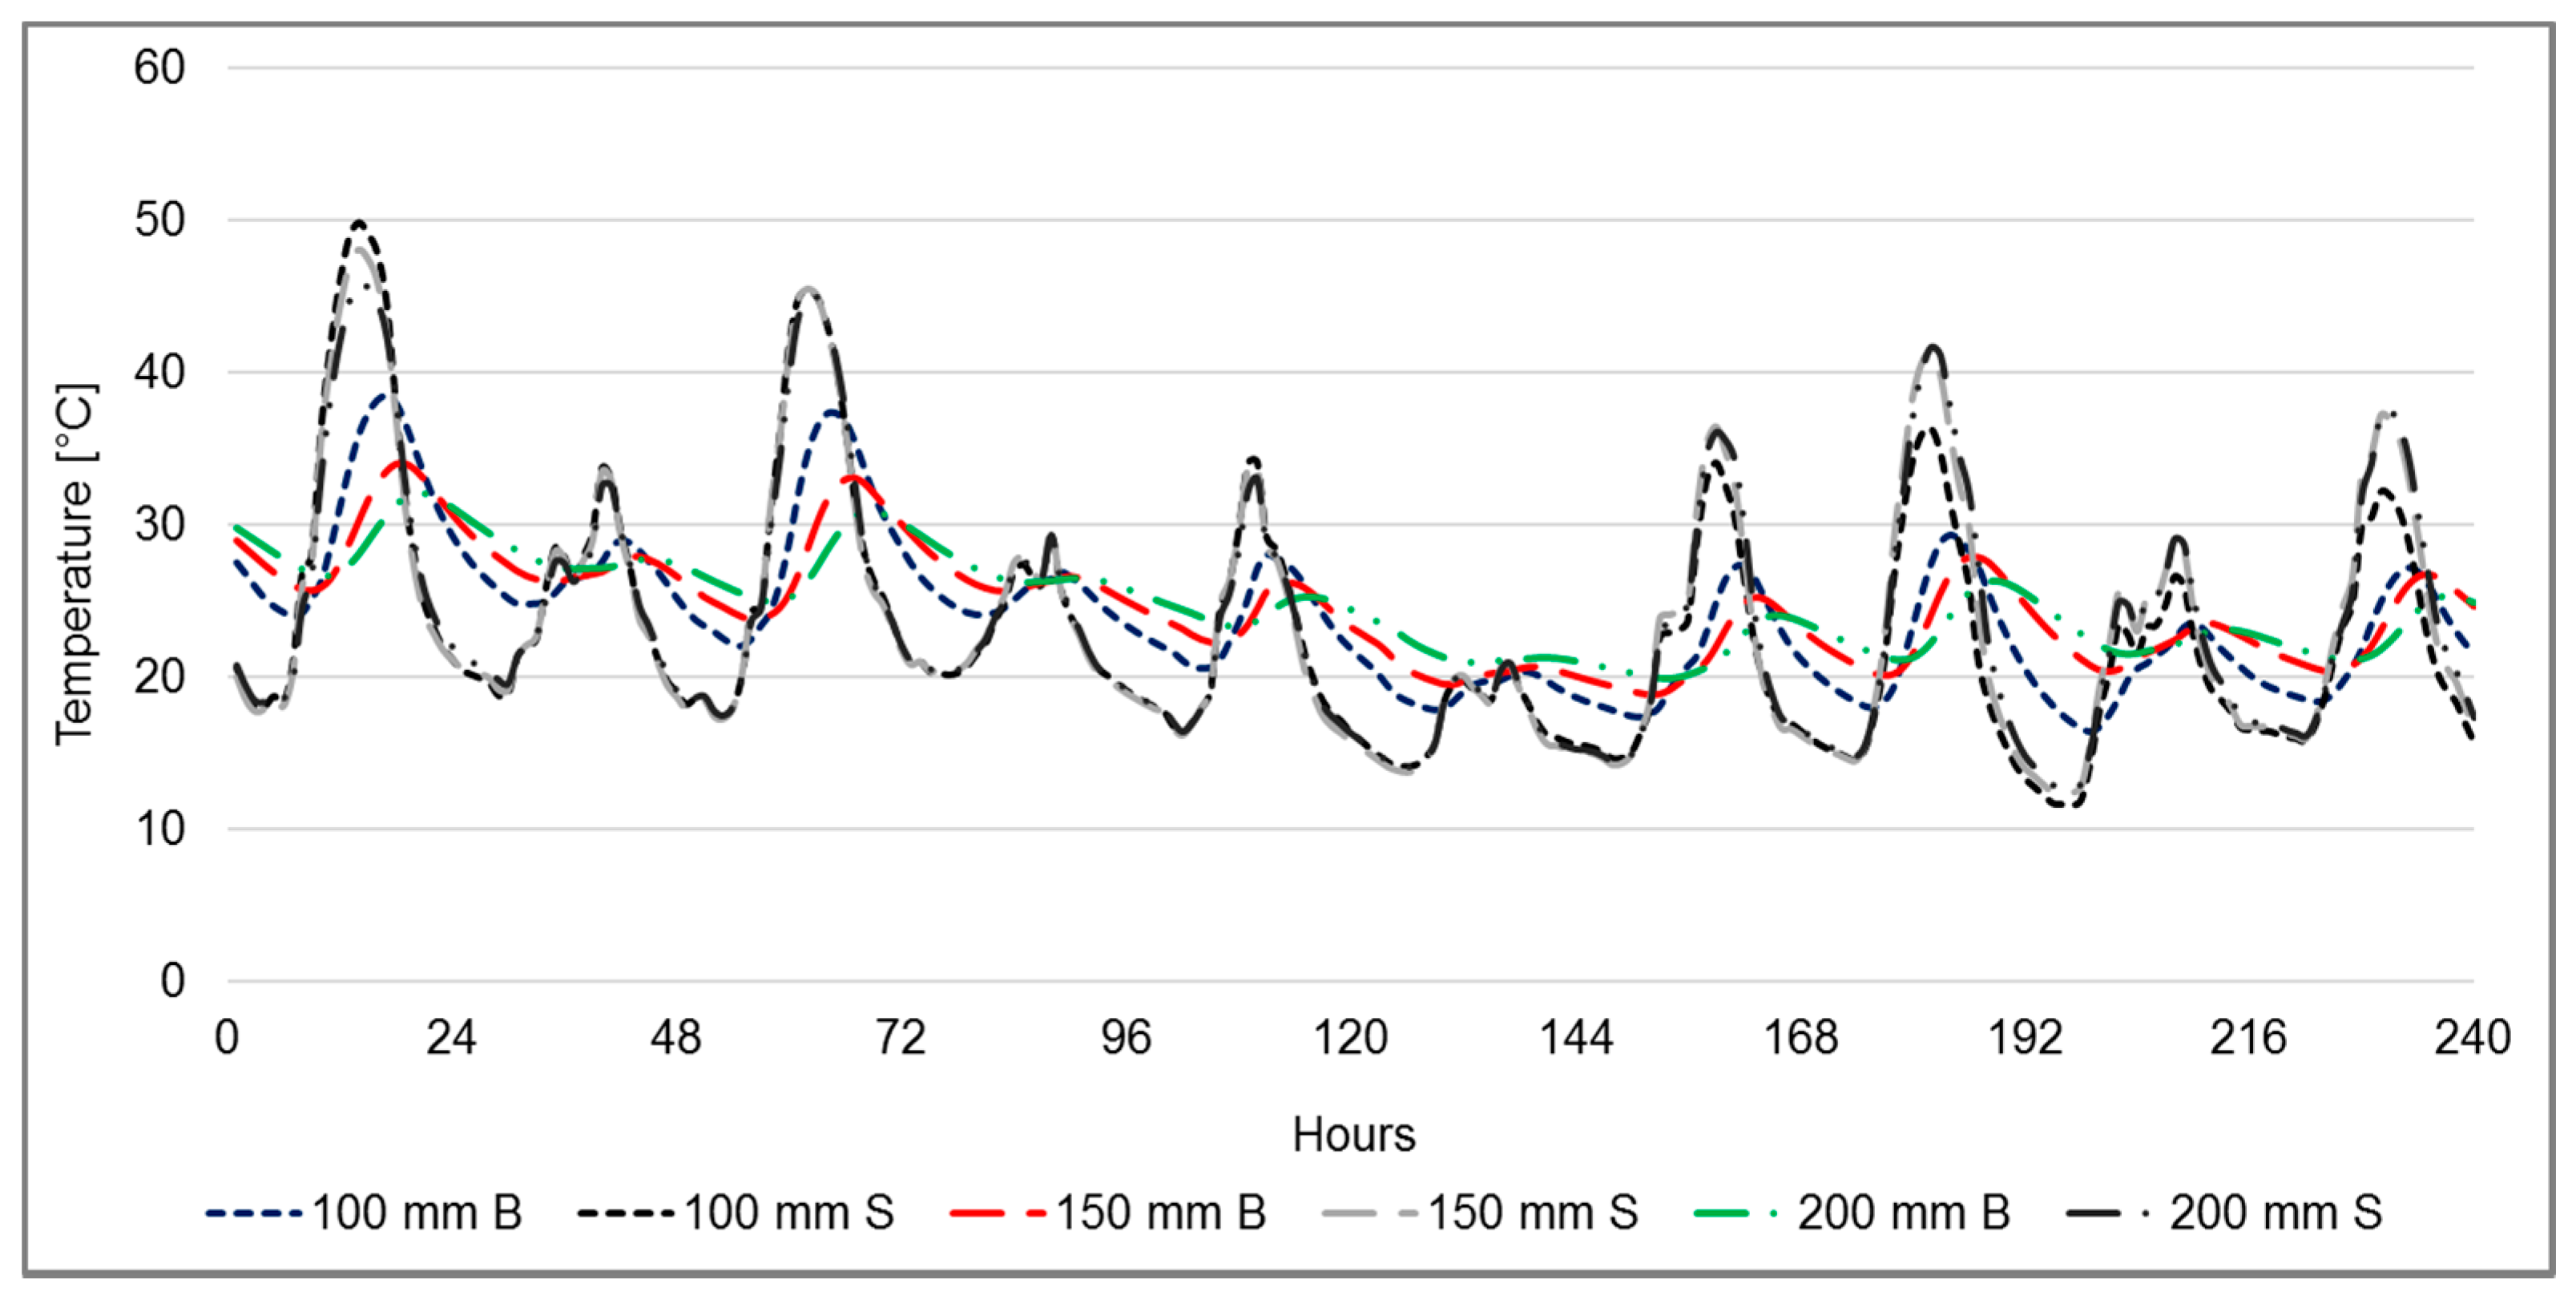
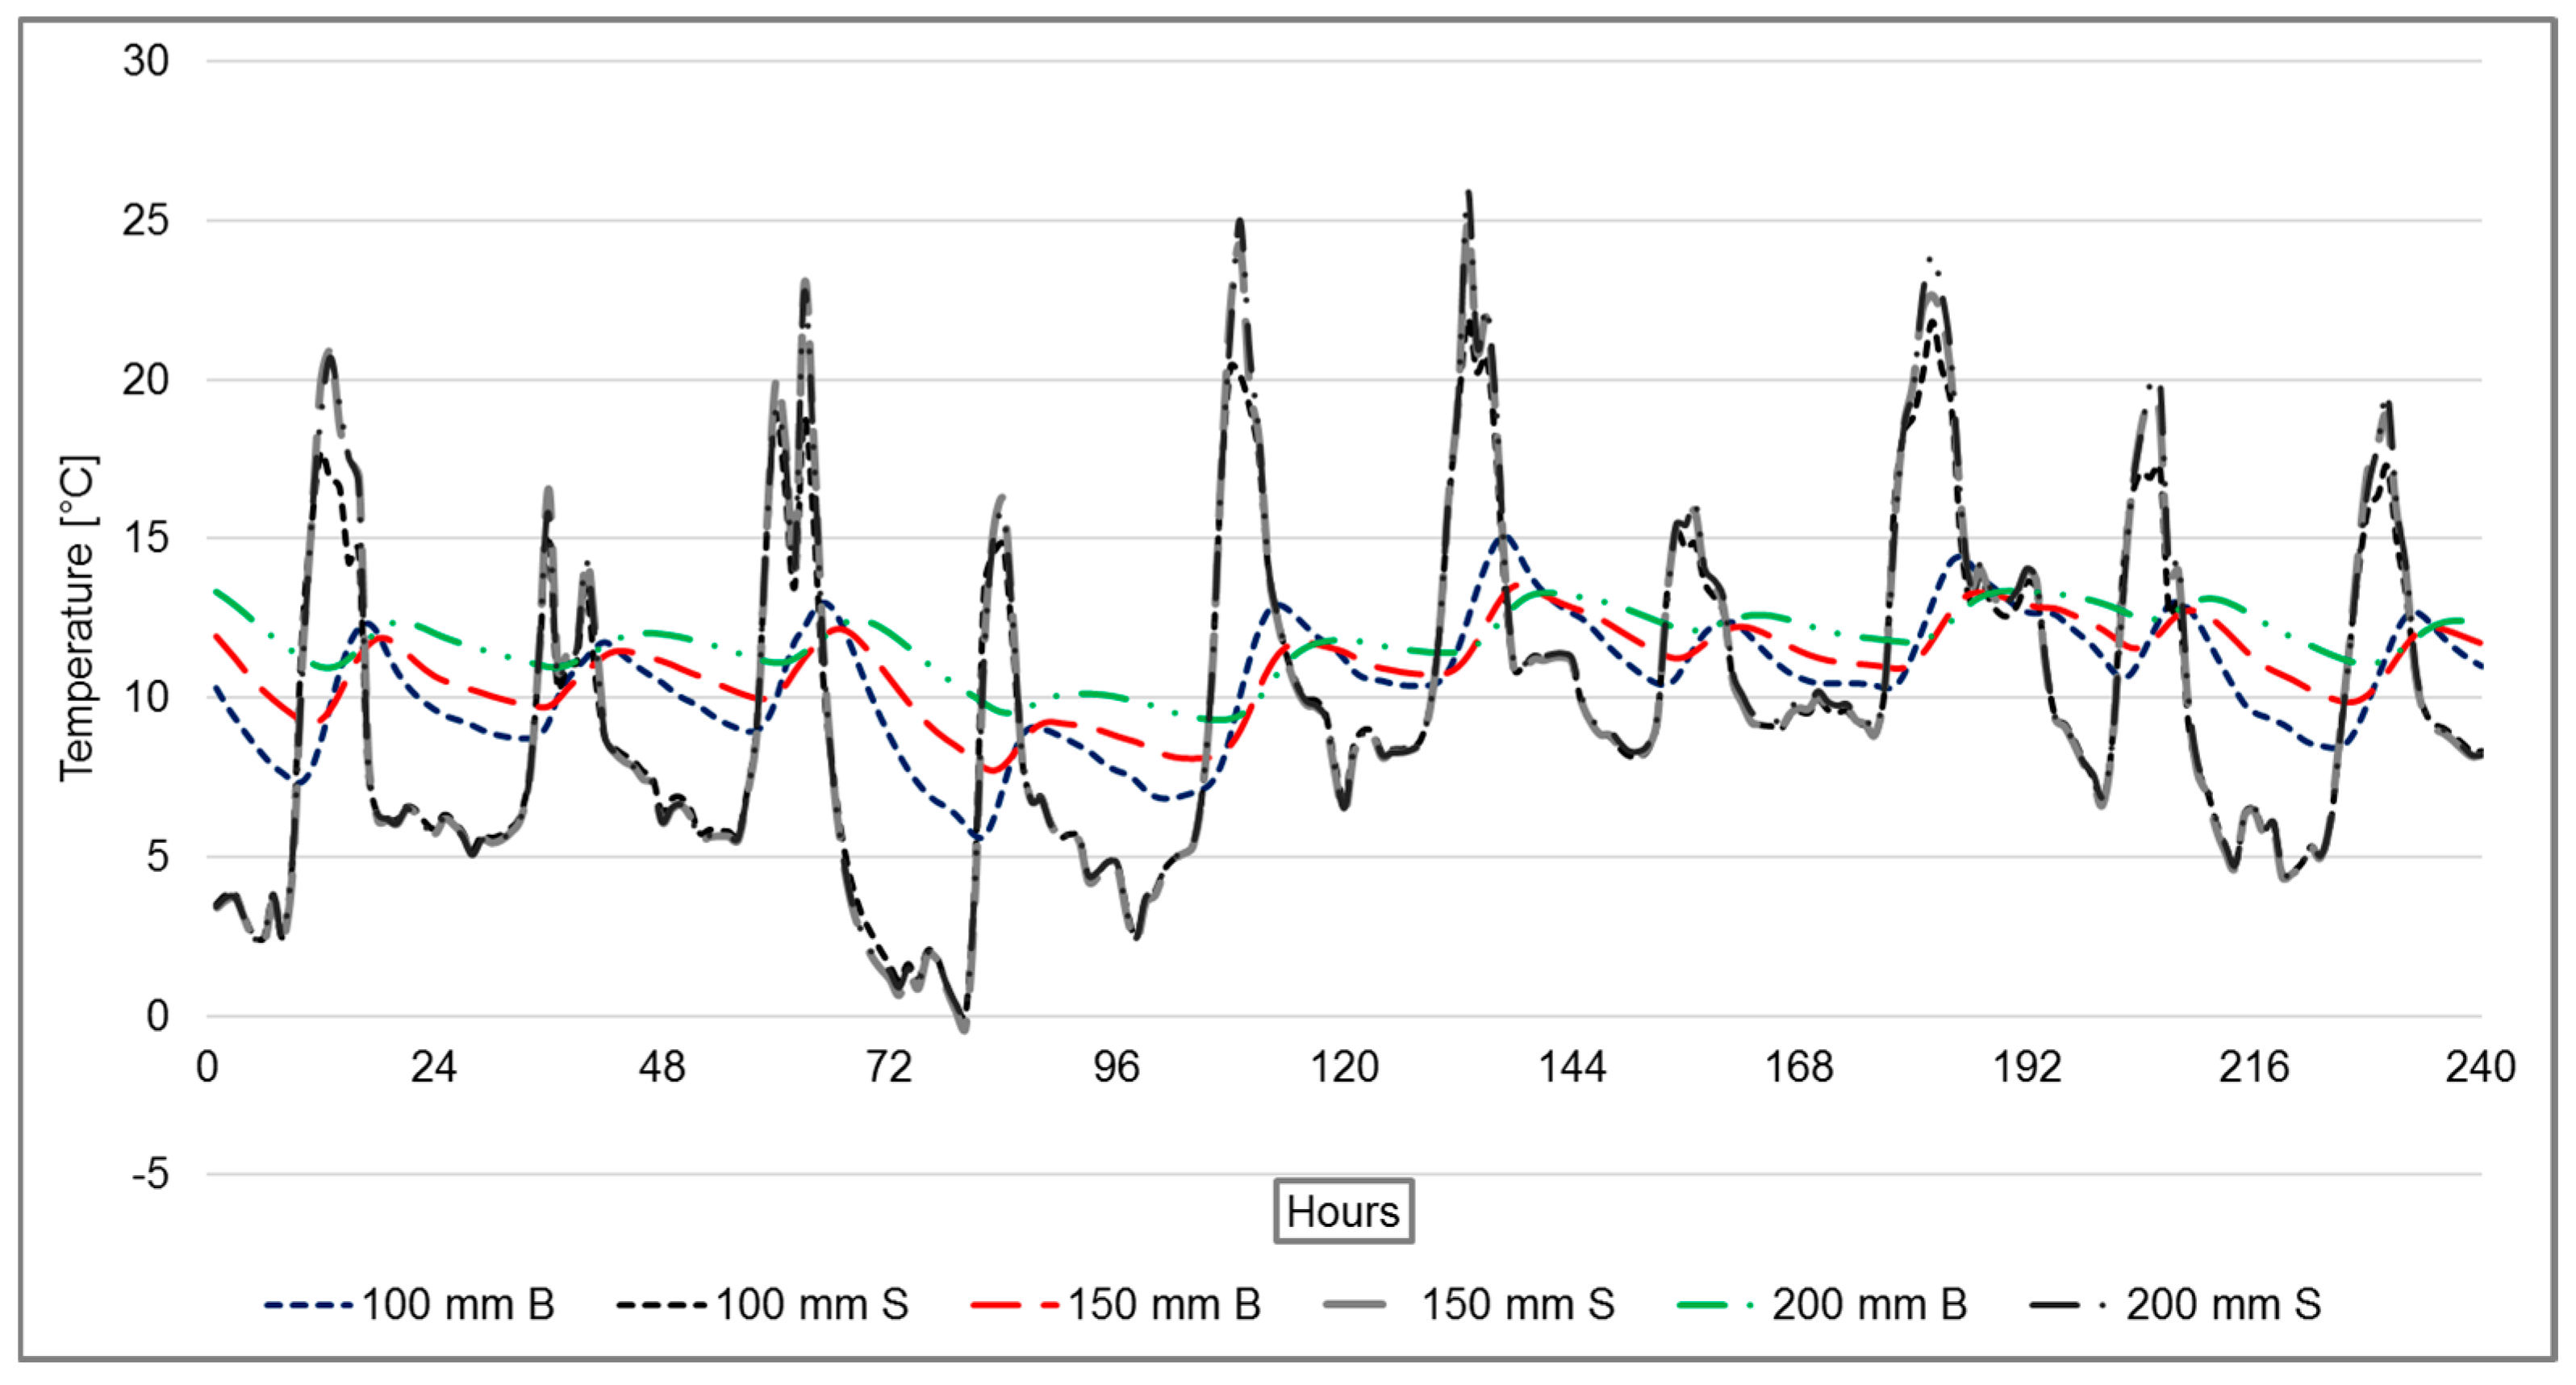
Temperatures and heat fluxes were measured on three non-irrigated and non-vegetated green roofs with depths of 100, 150 and 200 mm, and one bare conventional roof (heat flux only) in Melbourne over the same time period selected for the parametric analysis (2–11 December 2014). The period selected in this study represents typical days in Melbourne. They consist of rainy days followed by hot and sunny days within a relatively short period. This illustrates the various thermal characteristics of the experimental green roofs examined and their response to sudden changes. Additional temperatures and heat flux measurements are also provided for 10 days in the Australian winter, specifically from 1 to 10 June 2015. Temperatures collected at the bottom (B) and surface (S) of each green roof were hourly averaged for summer (Figure 9) and winter (Figure 10). Temperatures recorded at the surface of green roofs do not provide significant information on the benefits given by green roofs with different depths. Indeed, except for a limited number of small changes in the peak daily temperatures, the surface temperature trends of the three non-vegetated green roofs are generally identical. In contrast, heat fluxes and temperatures measured at the bottom of each non-vegetated green roofs have notable variation. For the purpose of this paper, we do not further analyse surface temperatures because compared to the temperatures at the bottom of a green roof profile, they do not provide significant evidence of the different green roof thermal performance.
3.2.1. Non-Vegetated Green Roof Thermal Performance in Summer
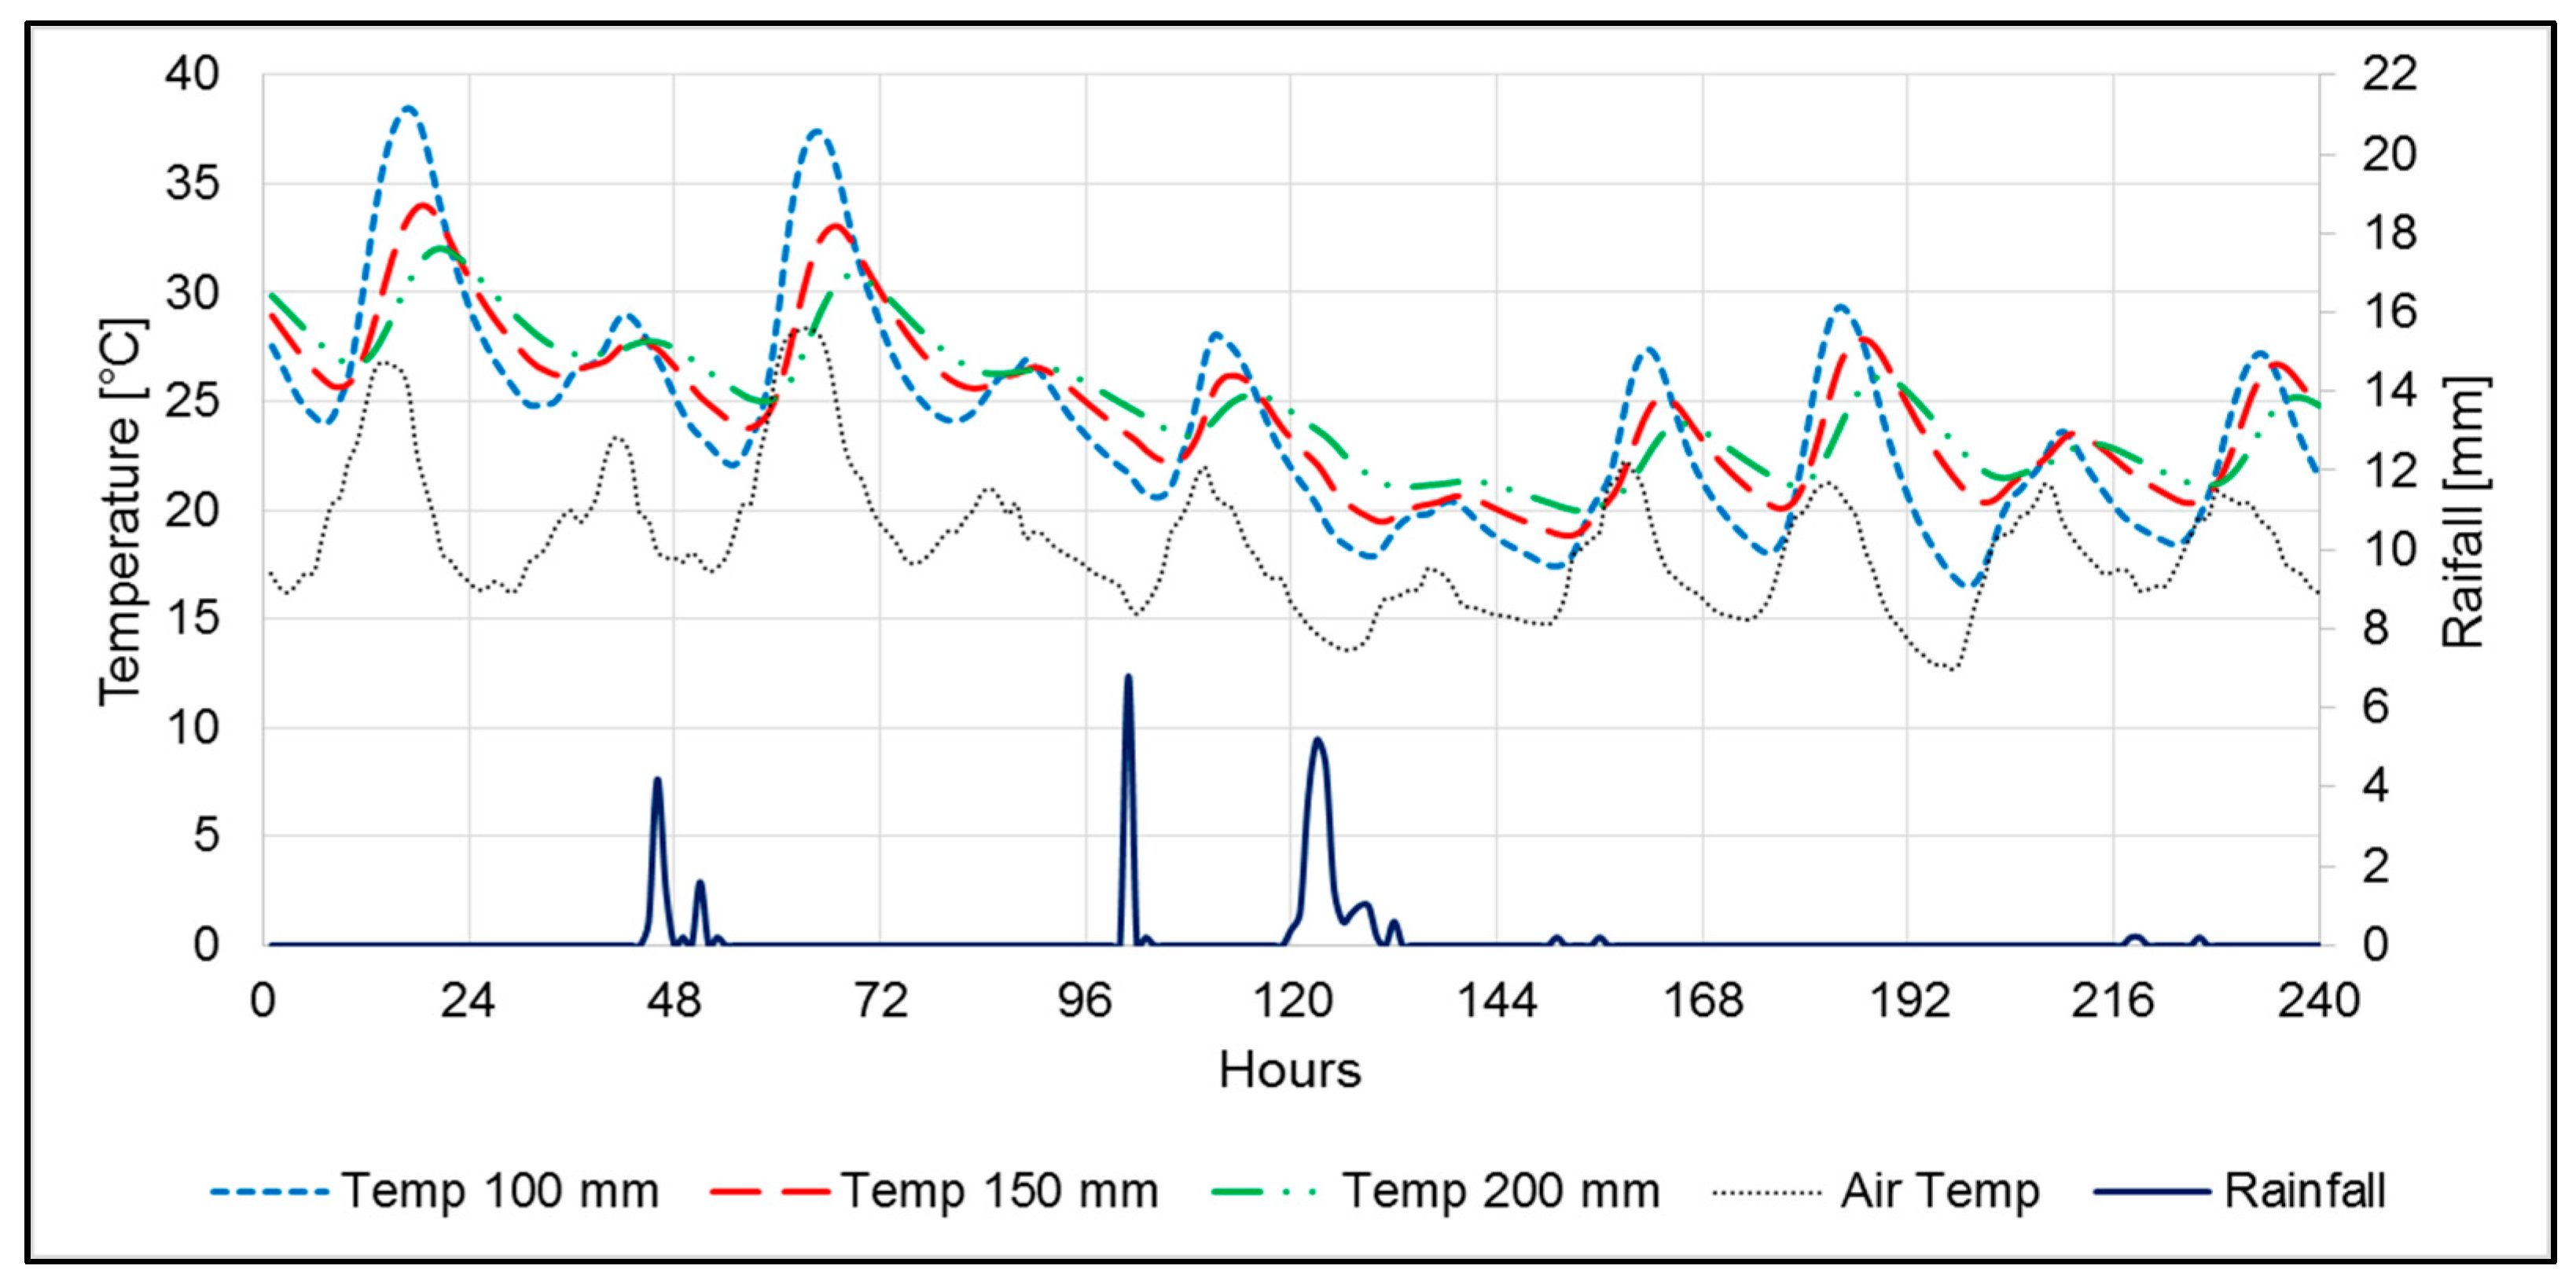
Figure 11 illustrates the temperature at the bottom of three non-vegetated green roofs 100, 150 and 200 mm thick. Temperature fluctuations were wider on sunny dry days (i.e., Hours 1–24 and 169–192) than cloudy rainy days (i.e., Hours 25–48 and 121–144) for every green roof. As expected, the 100 mm green roof had the largest fluctuations on all days ranging from 23.96 to 38.05 °C, compared to the 150 mm green roof, from 26.73 to 32.98 °C, and the 200 mm green roof, from 26.73 to 31.81 °C (Hours 1–24, Figure 11). The temperature difference between the 150 mm green roof and the 100 mm green roof was greater than between the 200 mm and 150 mm green roof, particularly on cloudy days. This suggested that the insulative effect of the additional thermal mass may increase until a green roof thickness of 150 mm and then may approach asymptote when the substrate is thicker than 150 mm.
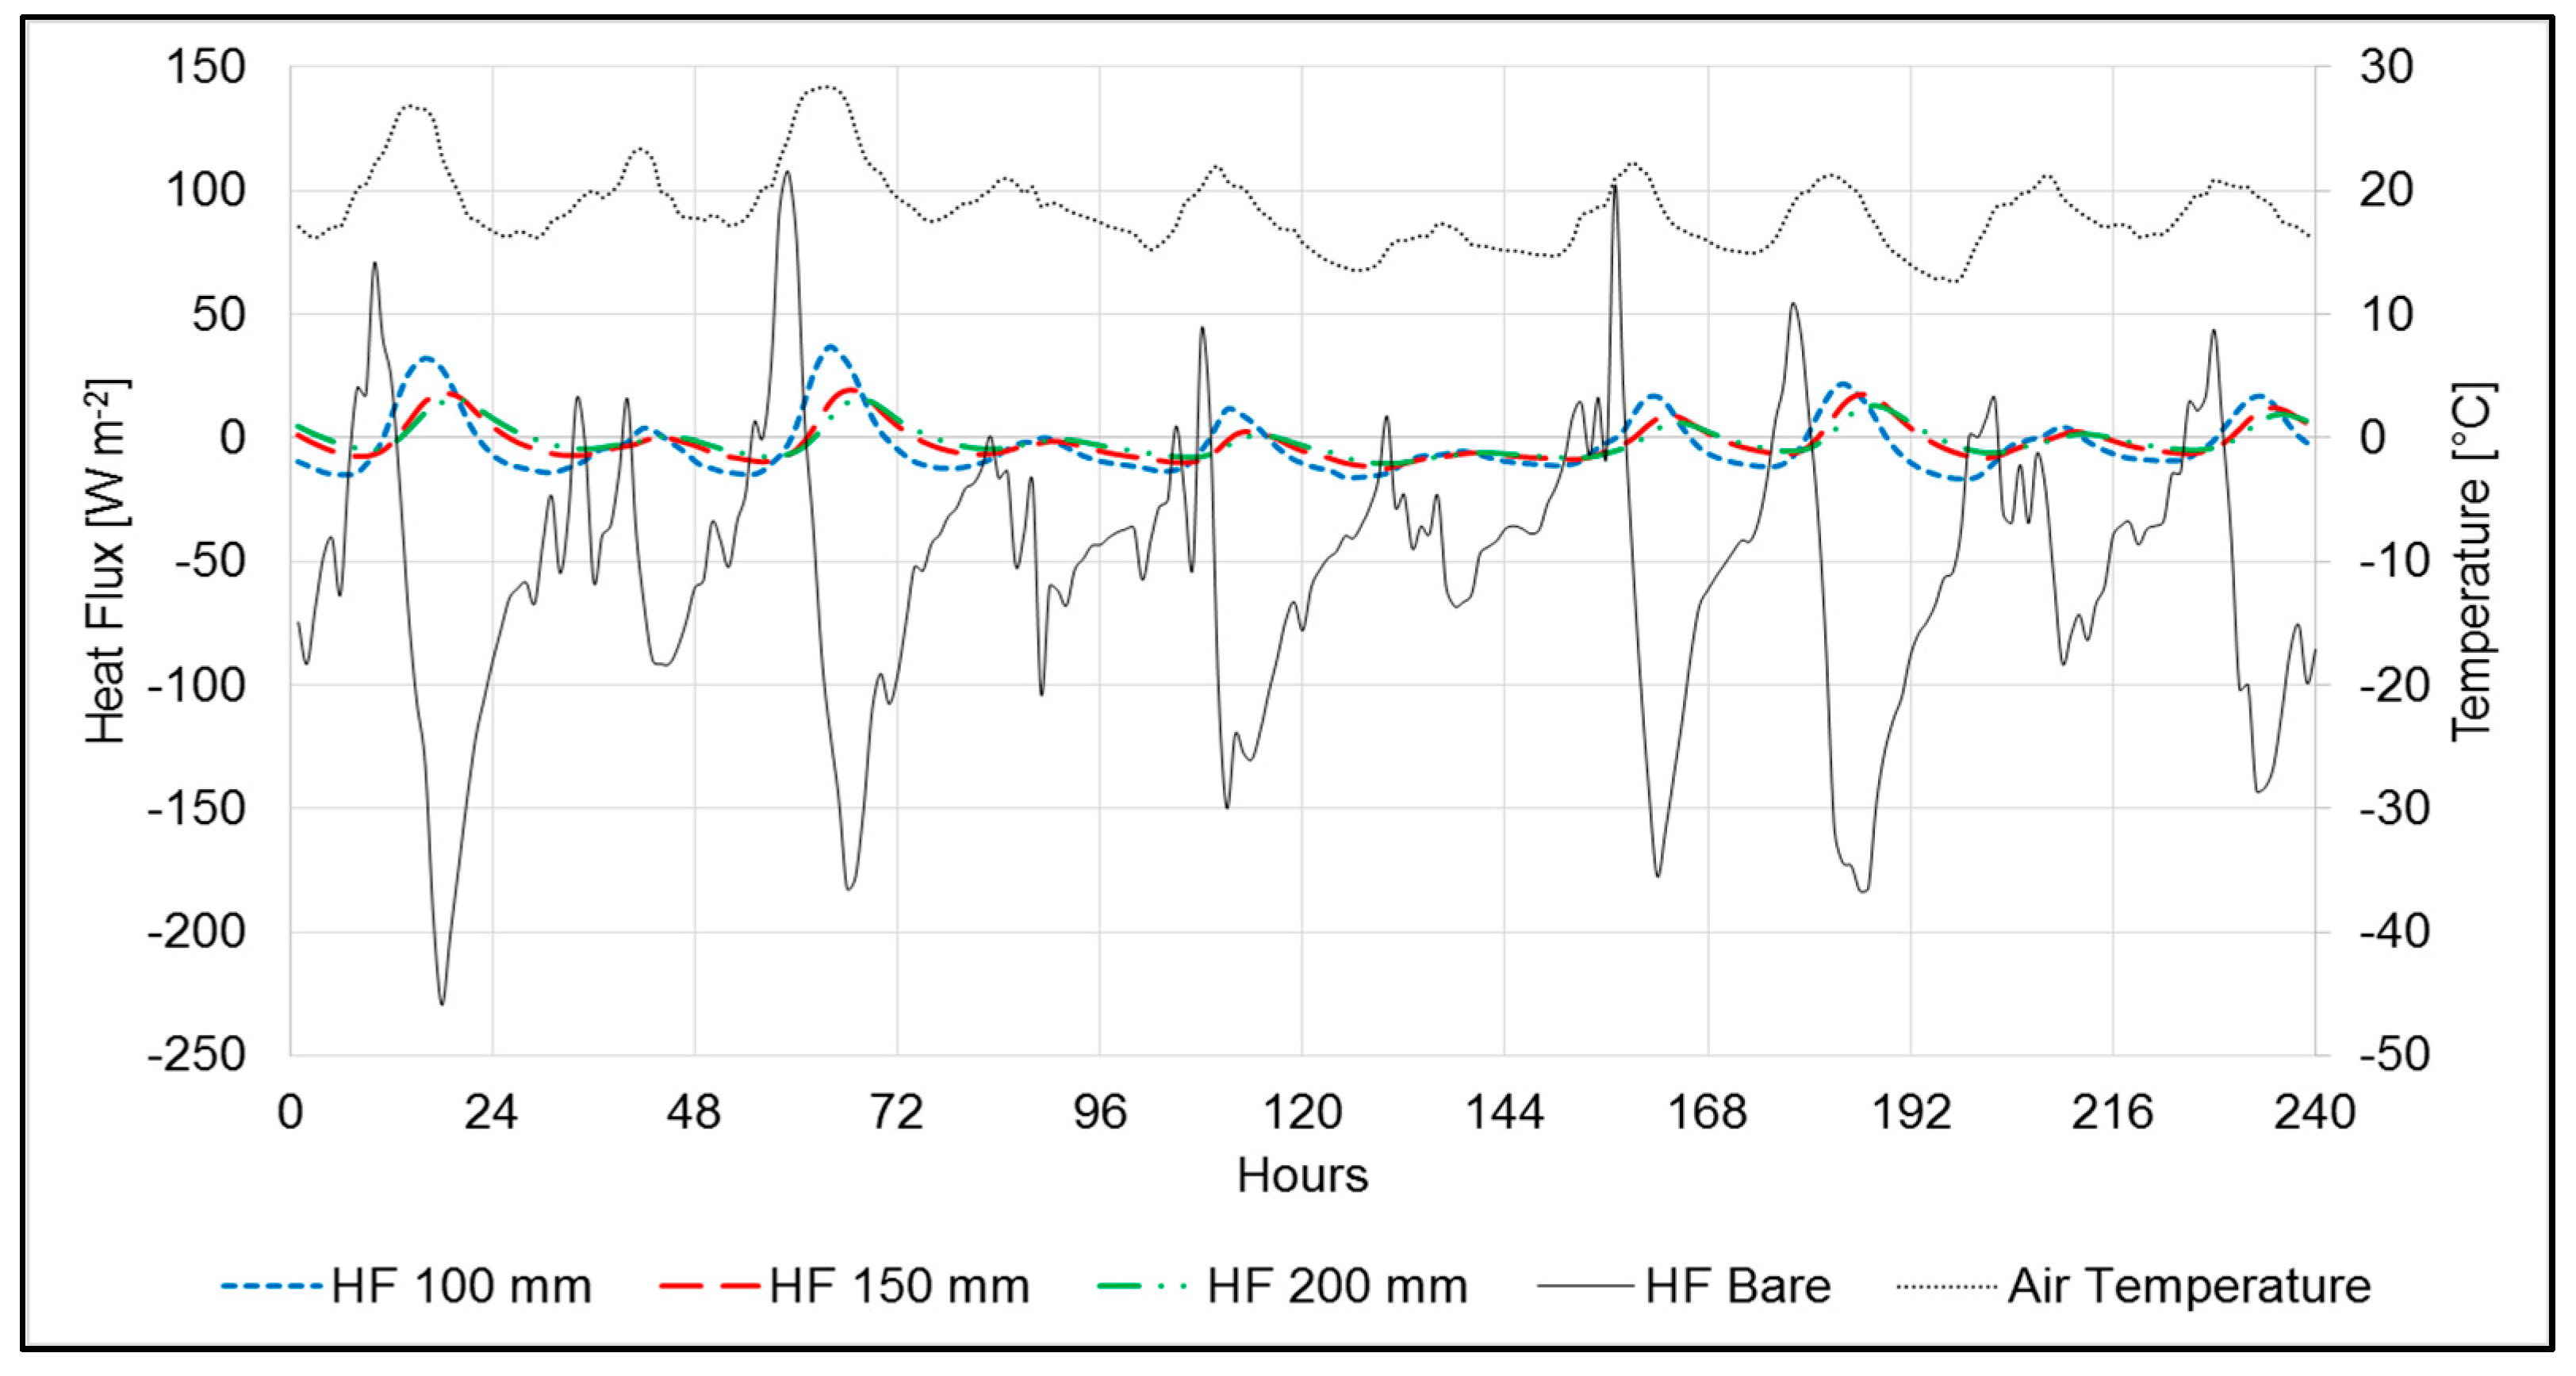
Generally, the daily temperature peak was delayed in every green roof compared to the air temperature, and the thickest green roof had the lowest temperature peak, which was delayed up to four hours later than the thinnest green roof in this study. This was also confirmed by heat flux measurements from the green roofs at Burnley (Figure 12 and Figure 13), where the 200 mm green roof delayed the heat flux peak up to eight hours compared to the heat flux of the bare roof (not shielded). As the heat flux measurements were collected at the interface between the building roof and the green roof, they took into account the effect of all the green roof component layers, and not only the substrate. Under this condition, the heat fluxes for the 150 mm and 200 mm green roofs were comparable, indicating that a 150 mm thick green roof may provide the same insulative effect as a thicker 200 mm deep green roof. The daily peak heat flux of the 100 mm green roof was double the other two green roofs (30 W m−2 vs. 15 W m−2, Hours 1–24, 49–72 Figure 12). On cloudy and rainy days, however, the differences among the three green roofs were minimal. The thermal benefits from different substrate thicknesses and moisture contents were not reported on the temperatures measured at the surface layer or on the parametric analysis of the ST design parameter, as the soil temperature and heat flux were simulated by default at the interface between the substrate and the vegetation, rather than below all the green roof component layers. Simulations should be performed at the interface between the green roof and the roof building to take into account the thermal performance of the whole green roof profile.
3.2.2. Non-Vegetated Green Roof Thermal Performance in Winter
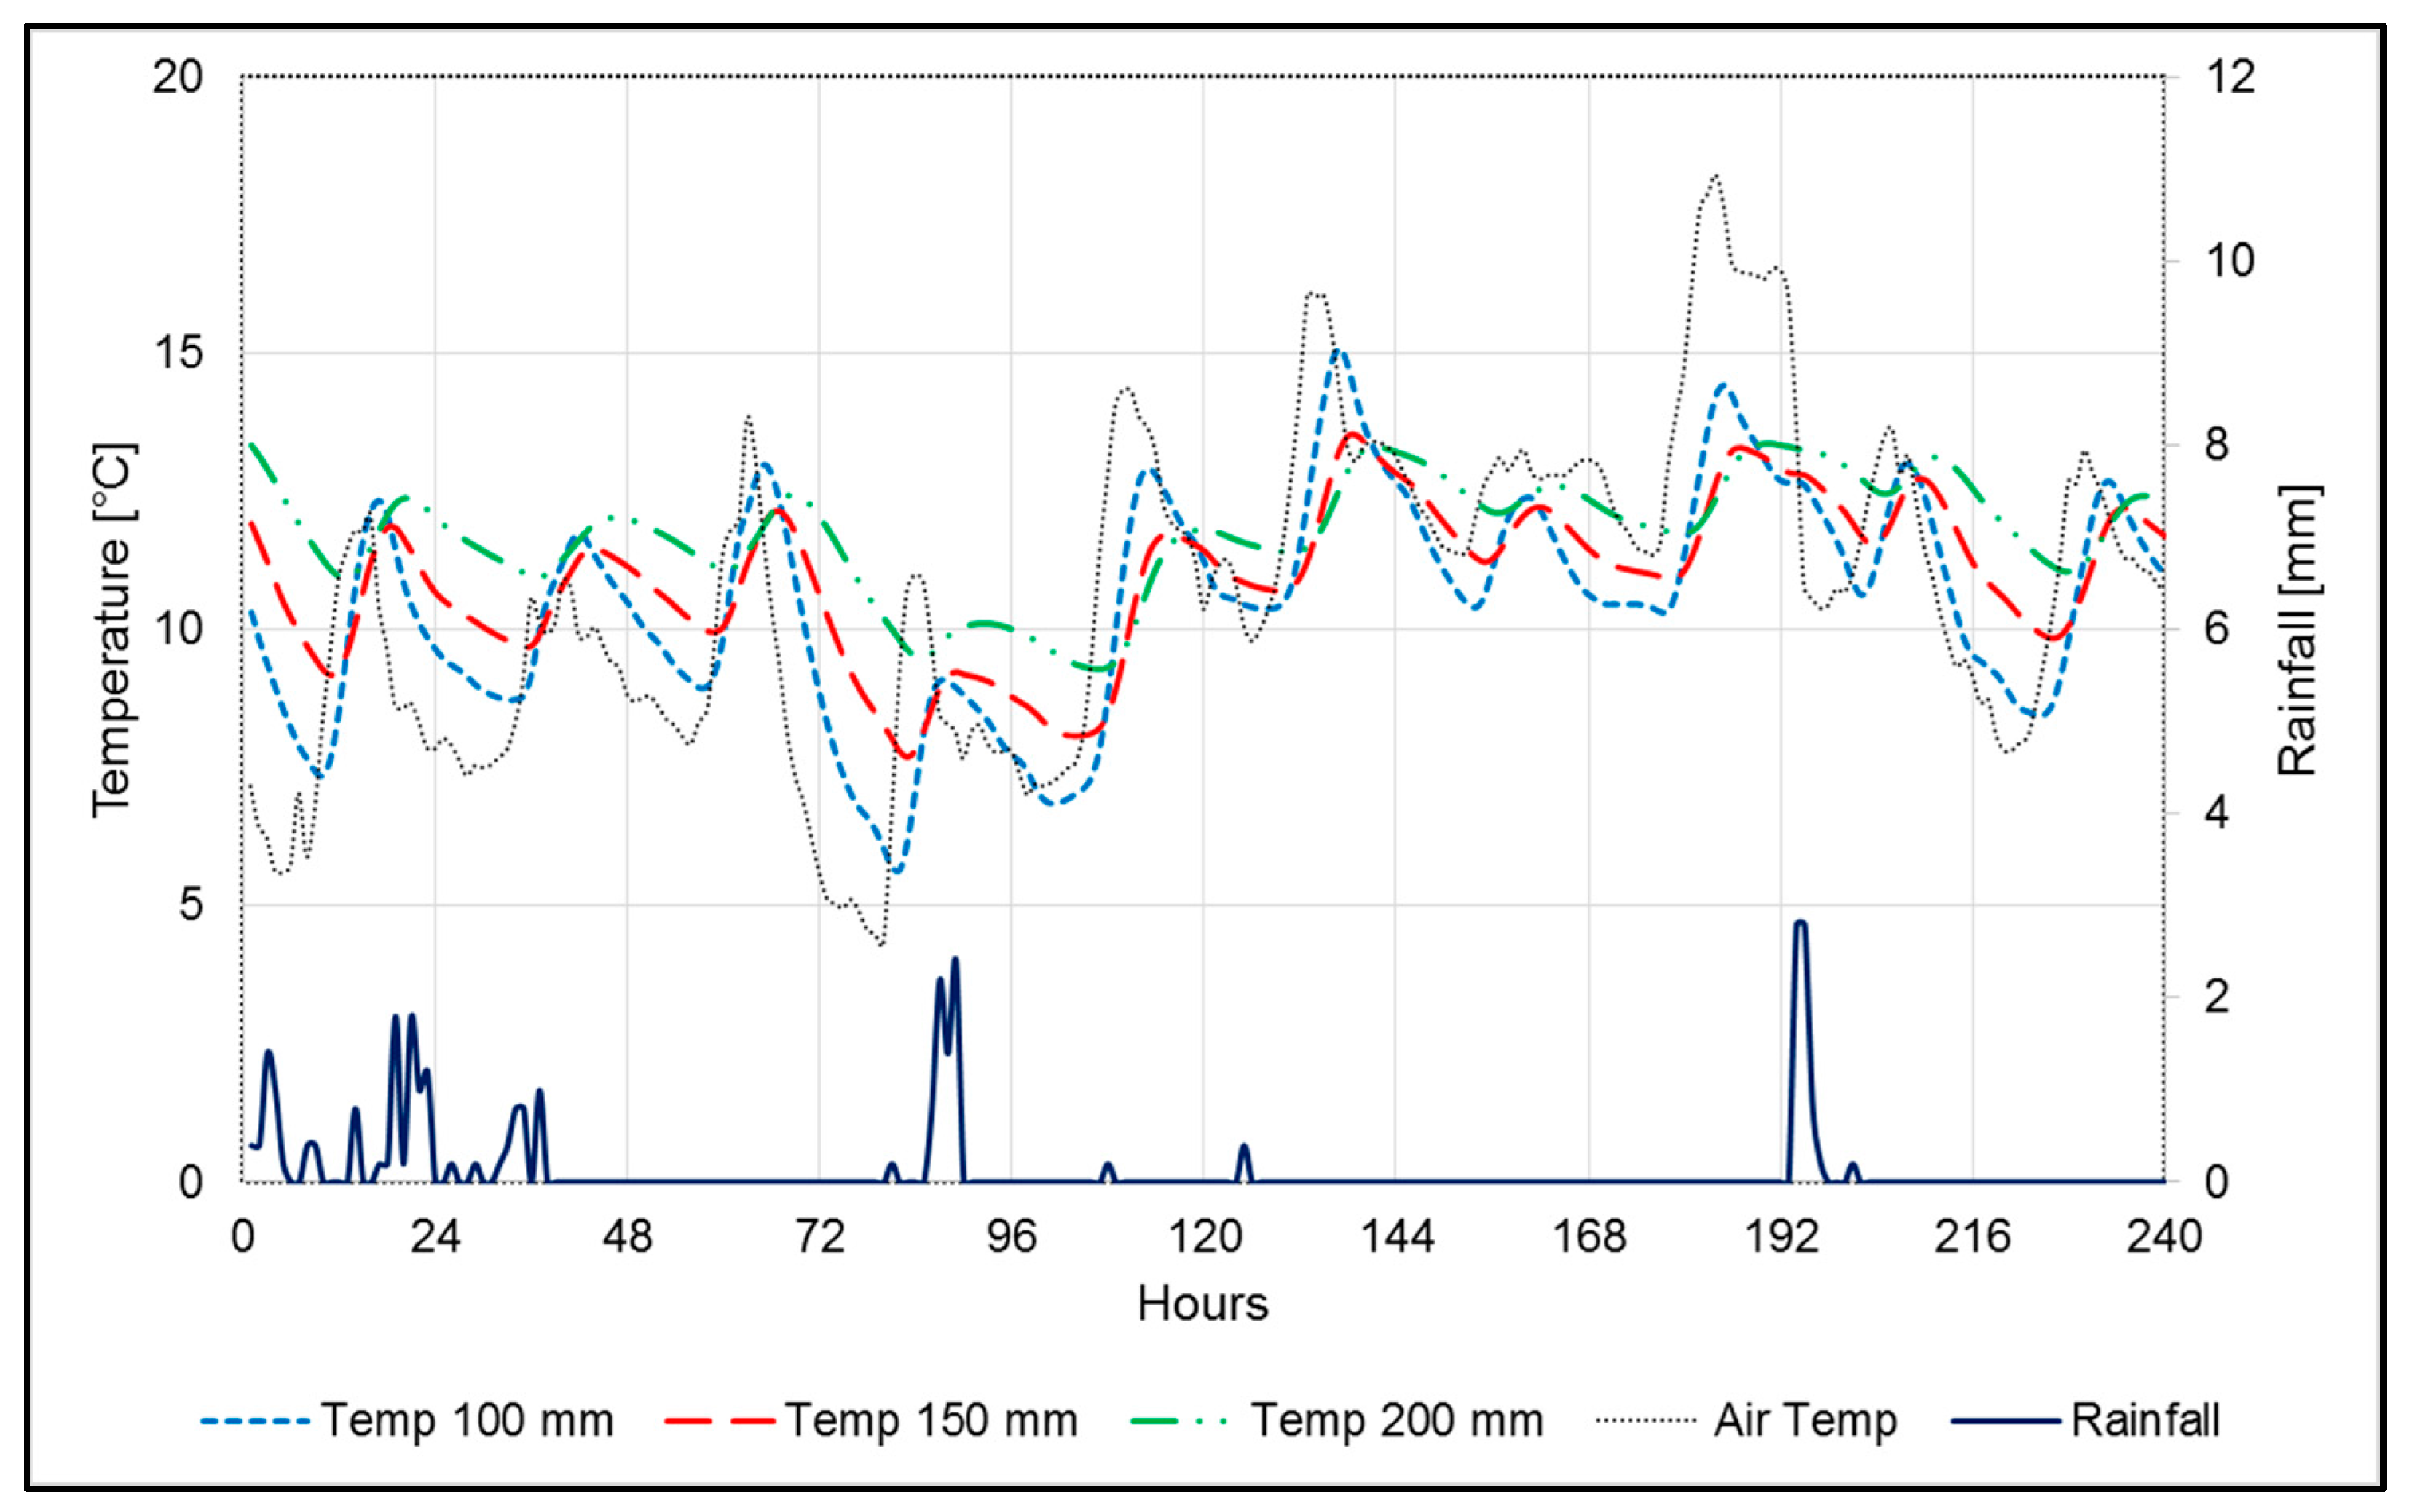
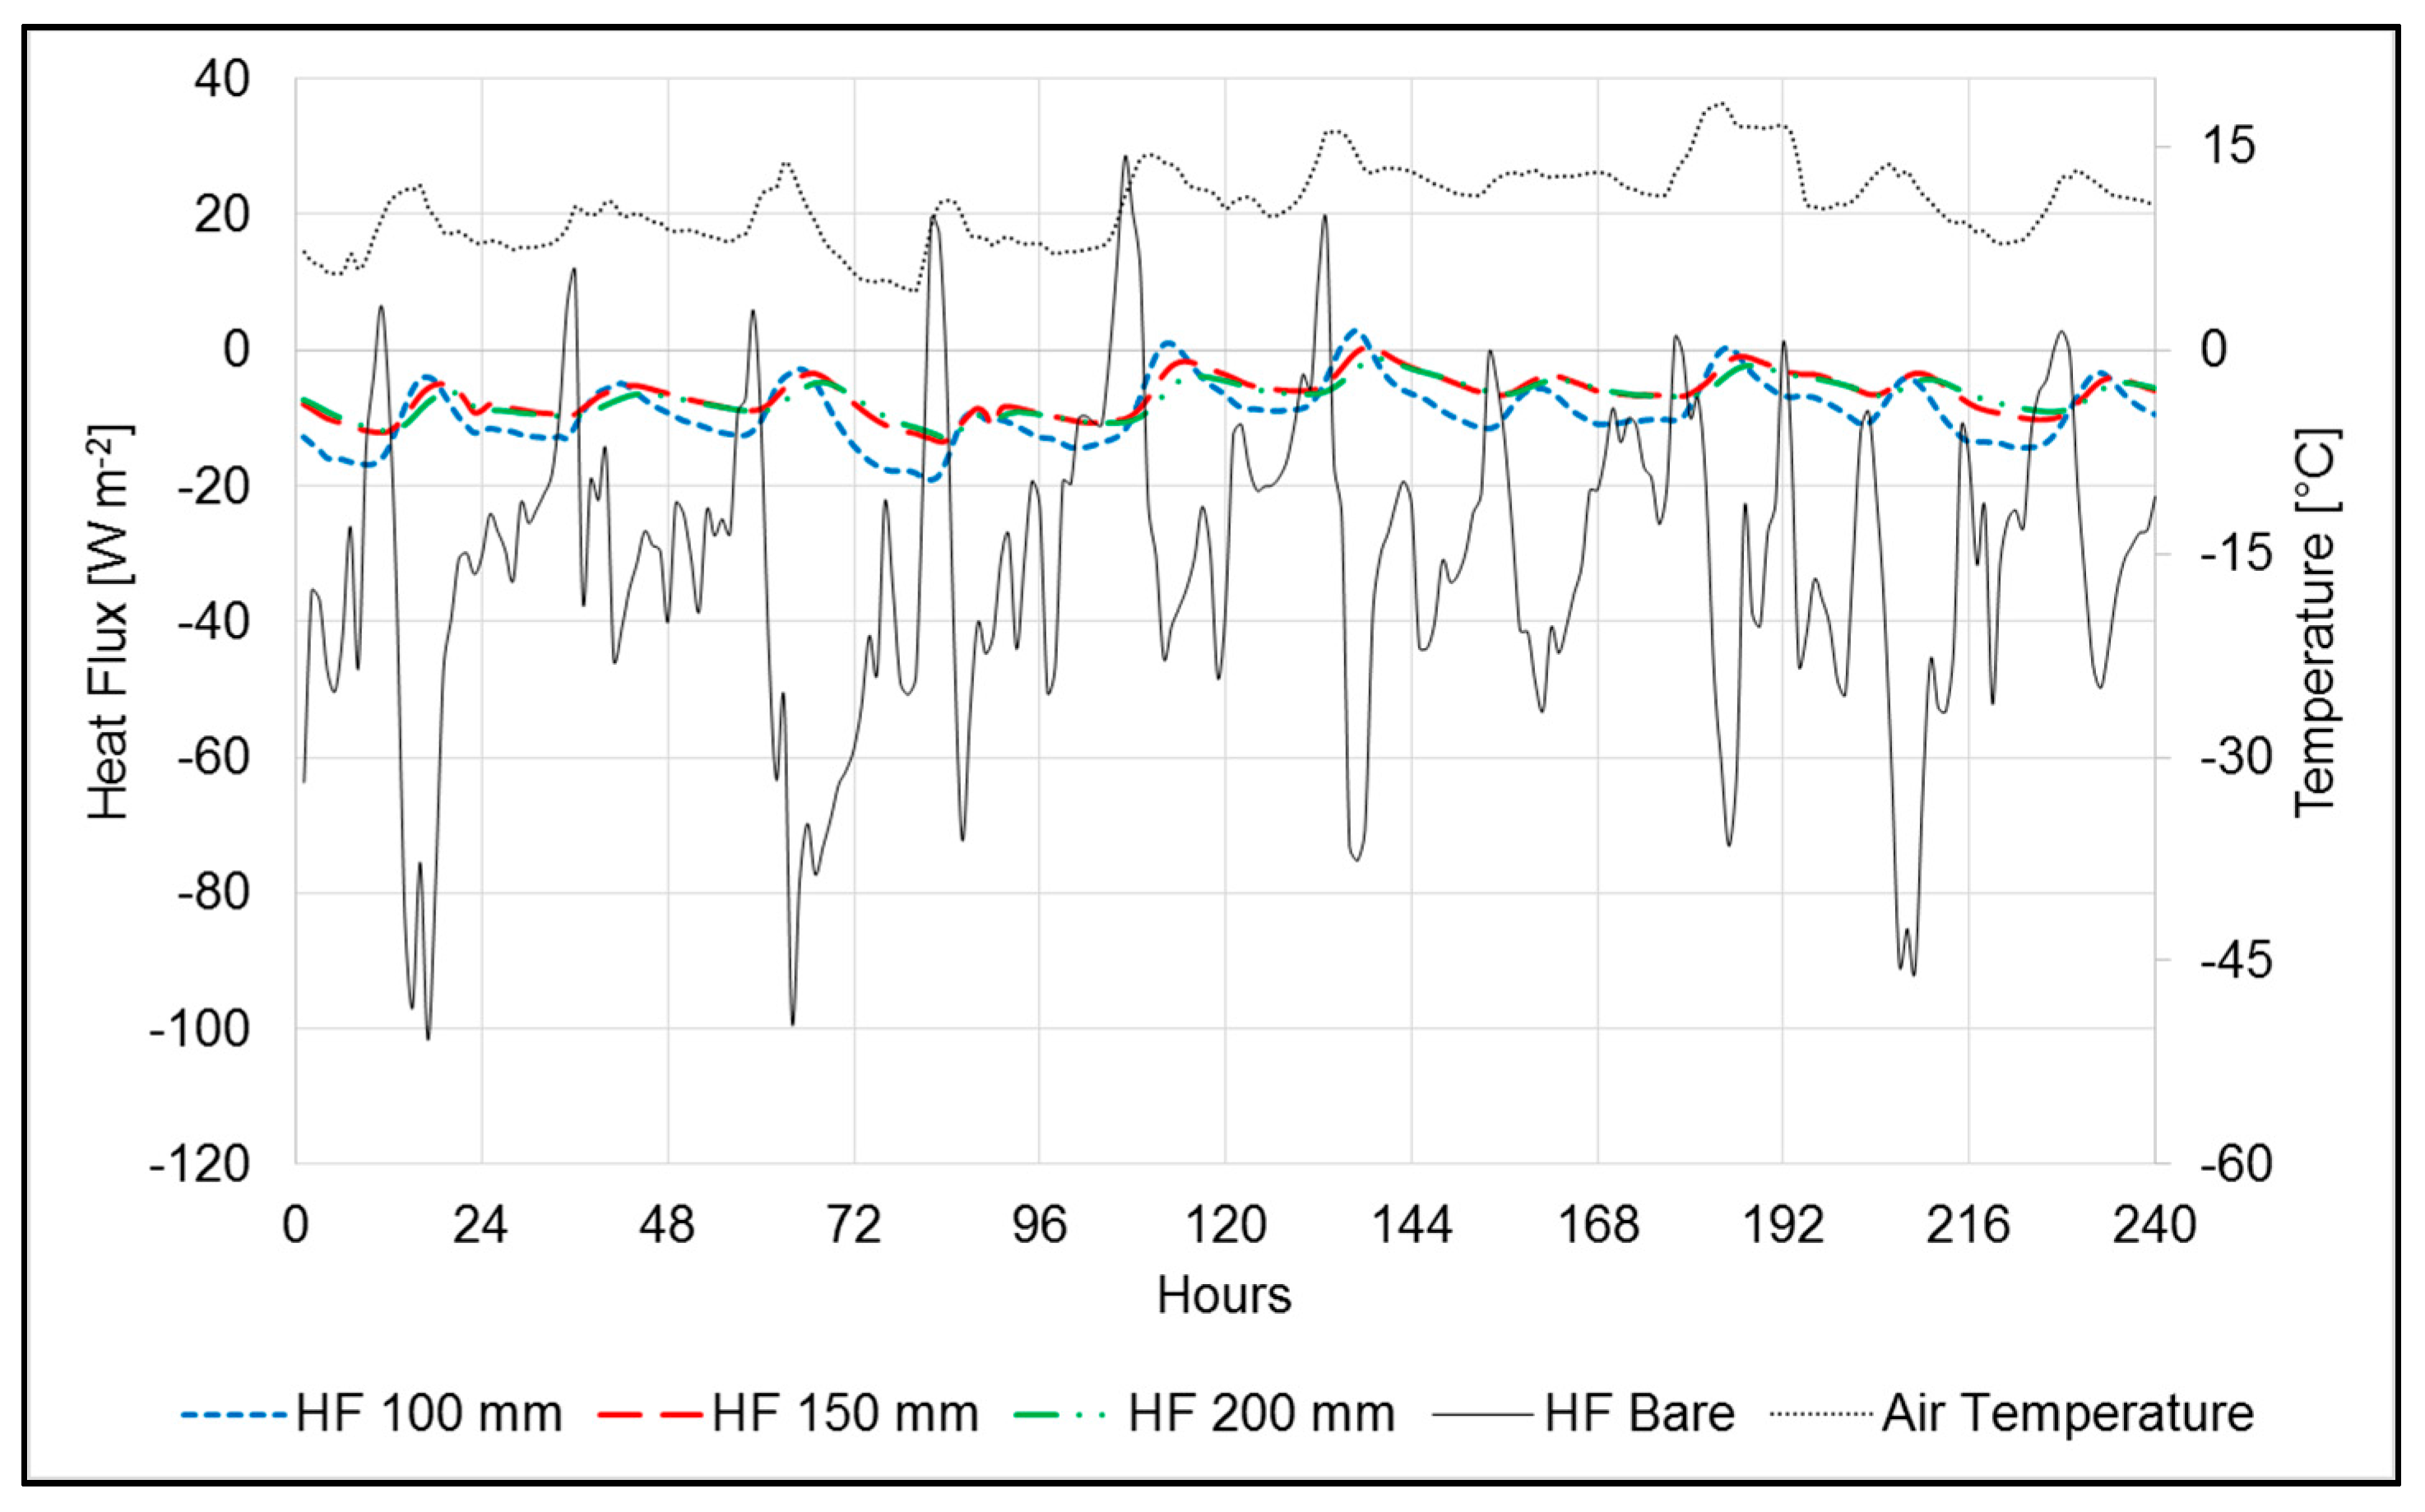
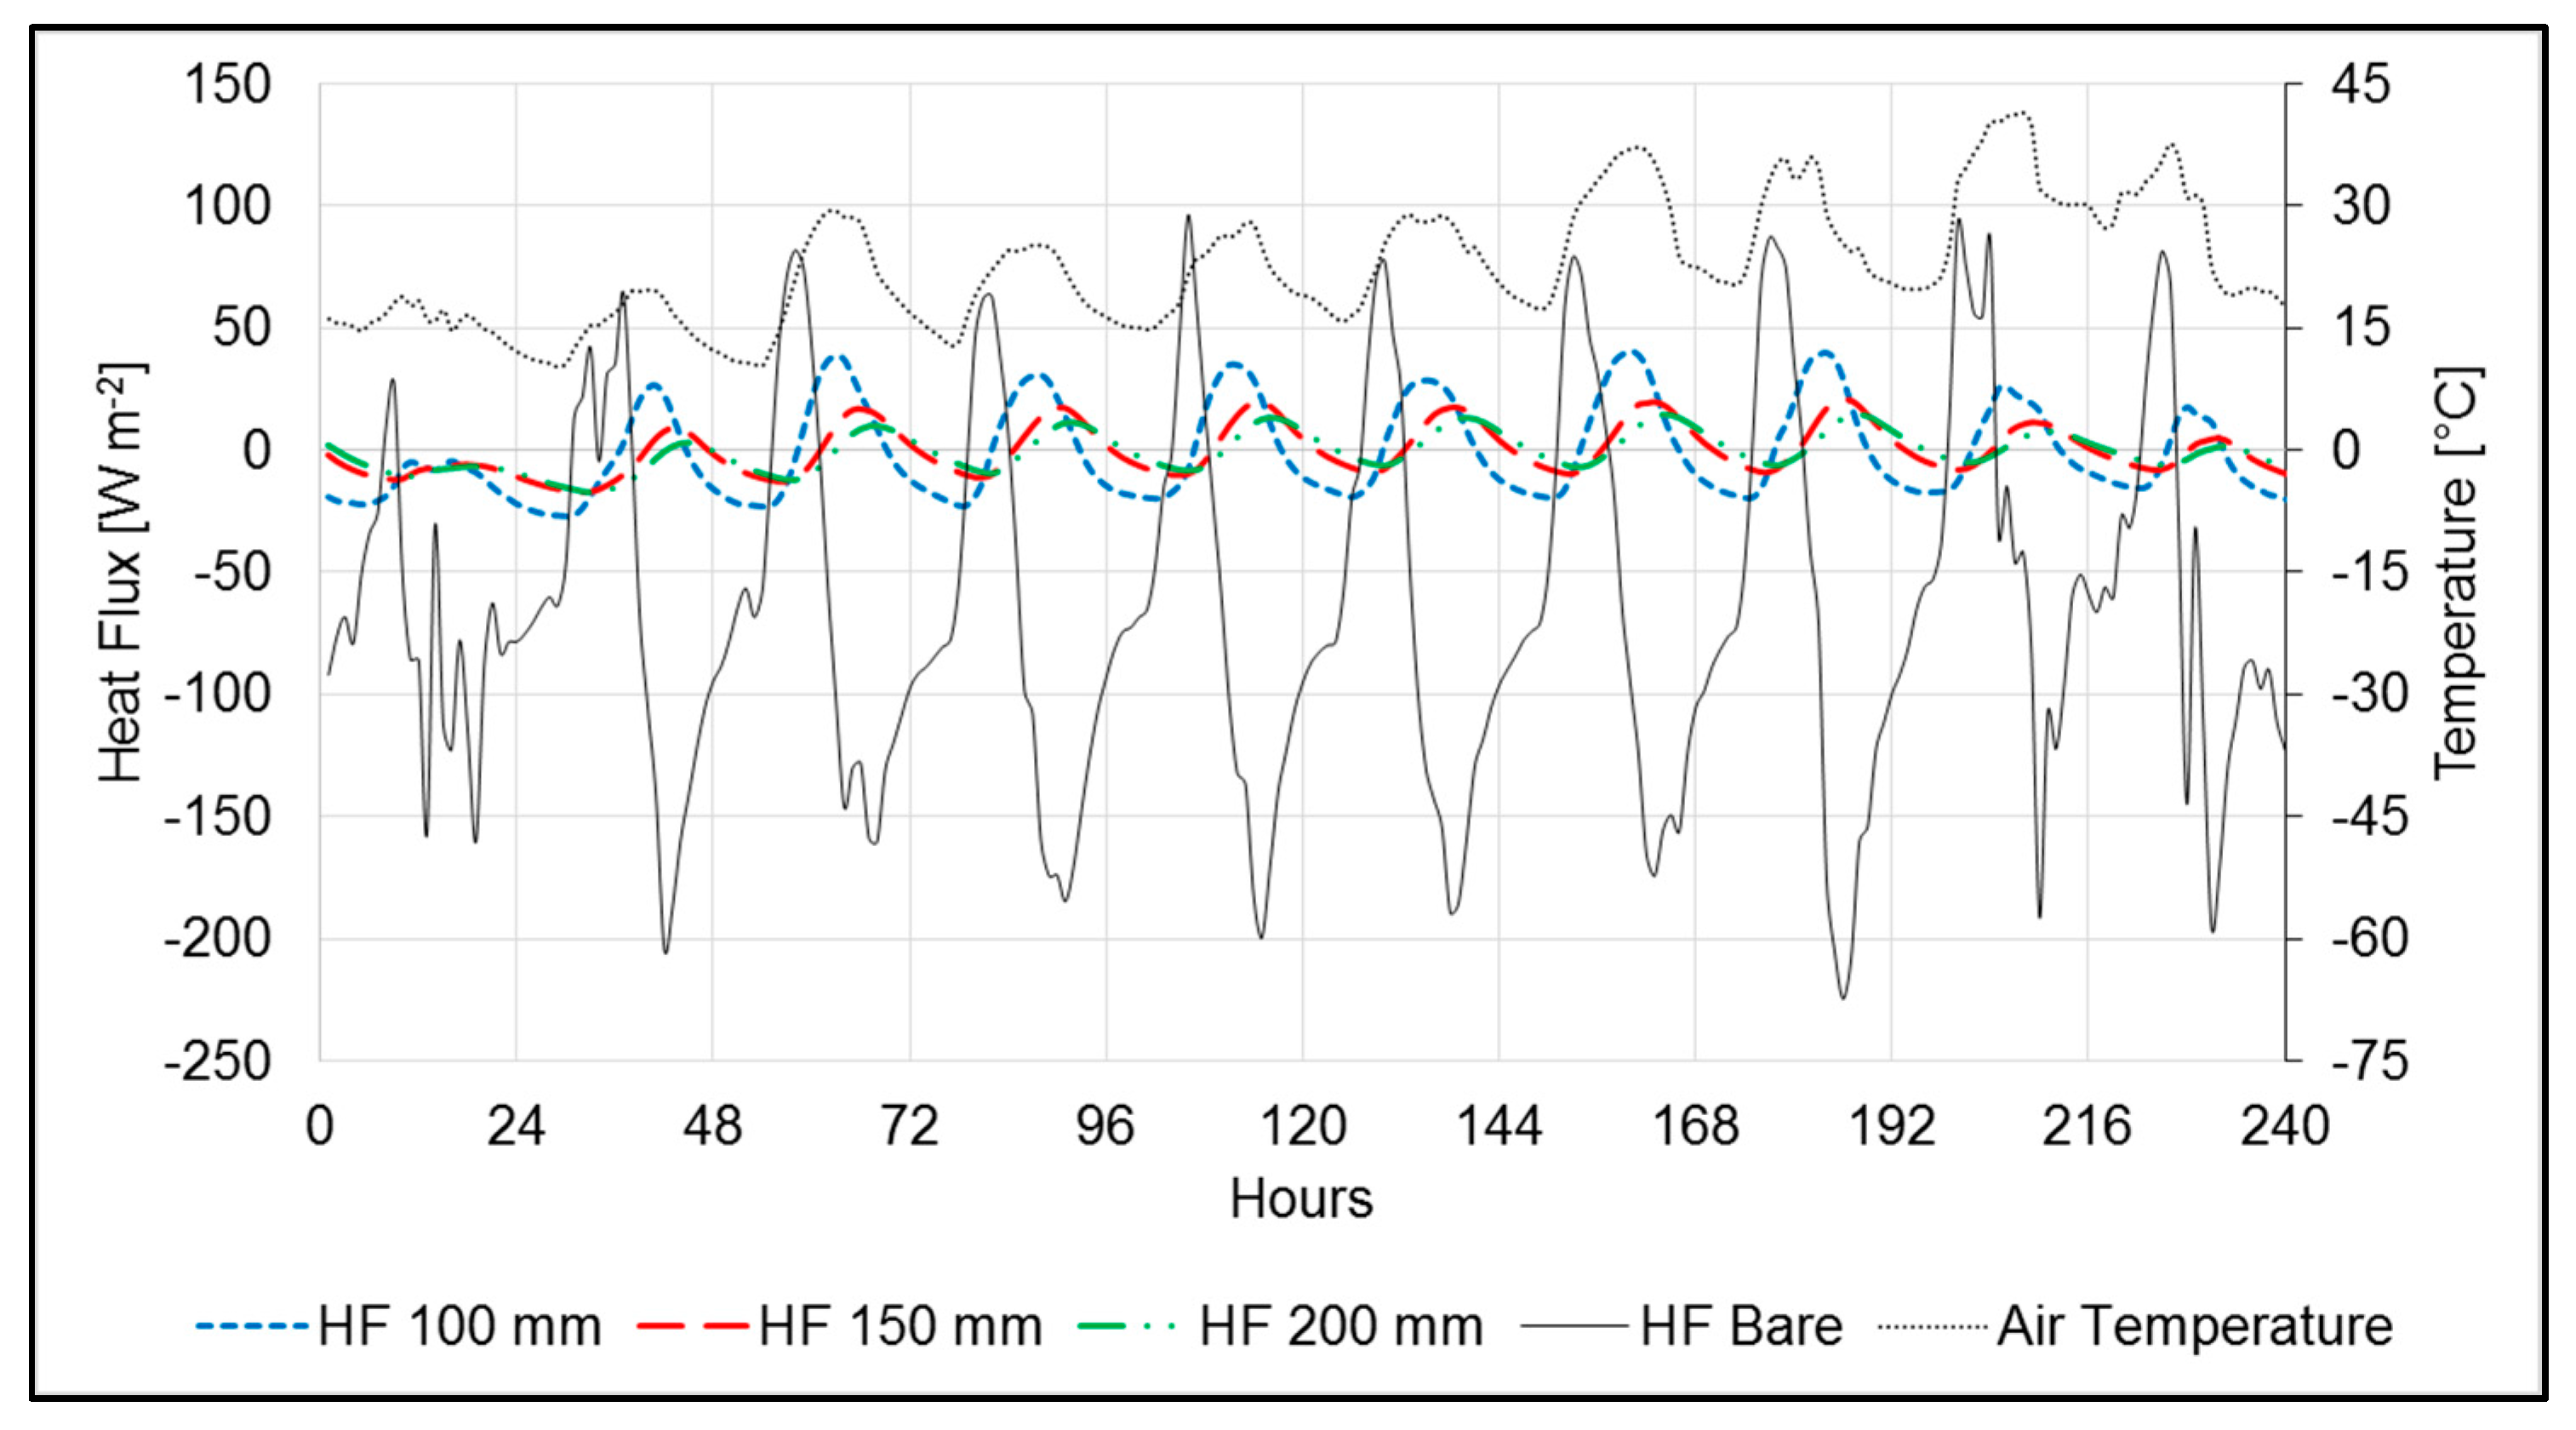
Winter data (Figure 14, Figure 15 and Figure 16) had the same general trends as the summer measurement period, although with smaller temperature and heat flux differences among the three non-vegetated roofs. Rainy days did not smooth the temperatures, but instead increased the temperature variations: the 100 mm green roof recorded the lowest temperature (6.5 °C), while the 200 mm the highest (10.11 °C) on a rainy day (Hours 73–96, Figure 14). The heat flux values had comparable results for the 150 mm and 200 mm green roofs, although the heat flux for the 200 mm green roof was always negative on the tested days, and the one contributing the most at the peaks delay and reduction (Figure 15 and Figure 16). The heat flux for the 100 mm green roof had always the greatest fluctuation, recording the lowest result in any day (i.e., −19.21 W m−2 Hour 82, Figure 15).
In summary, we found that thicker substrates provided larger benefits for the thermal performance of green roofs by reducing and delaying up to eight hours the heat flux into the building to a greater extent. However, the delay effect of thicker substrates was not observed in the parametric analysis because the green roof substrate’s temperature output overlooks the benefit of increasing thermal mass. The operational parameter MC, which changes after a rainfall event, influenced the substrate temperatures more in winter than in summer.
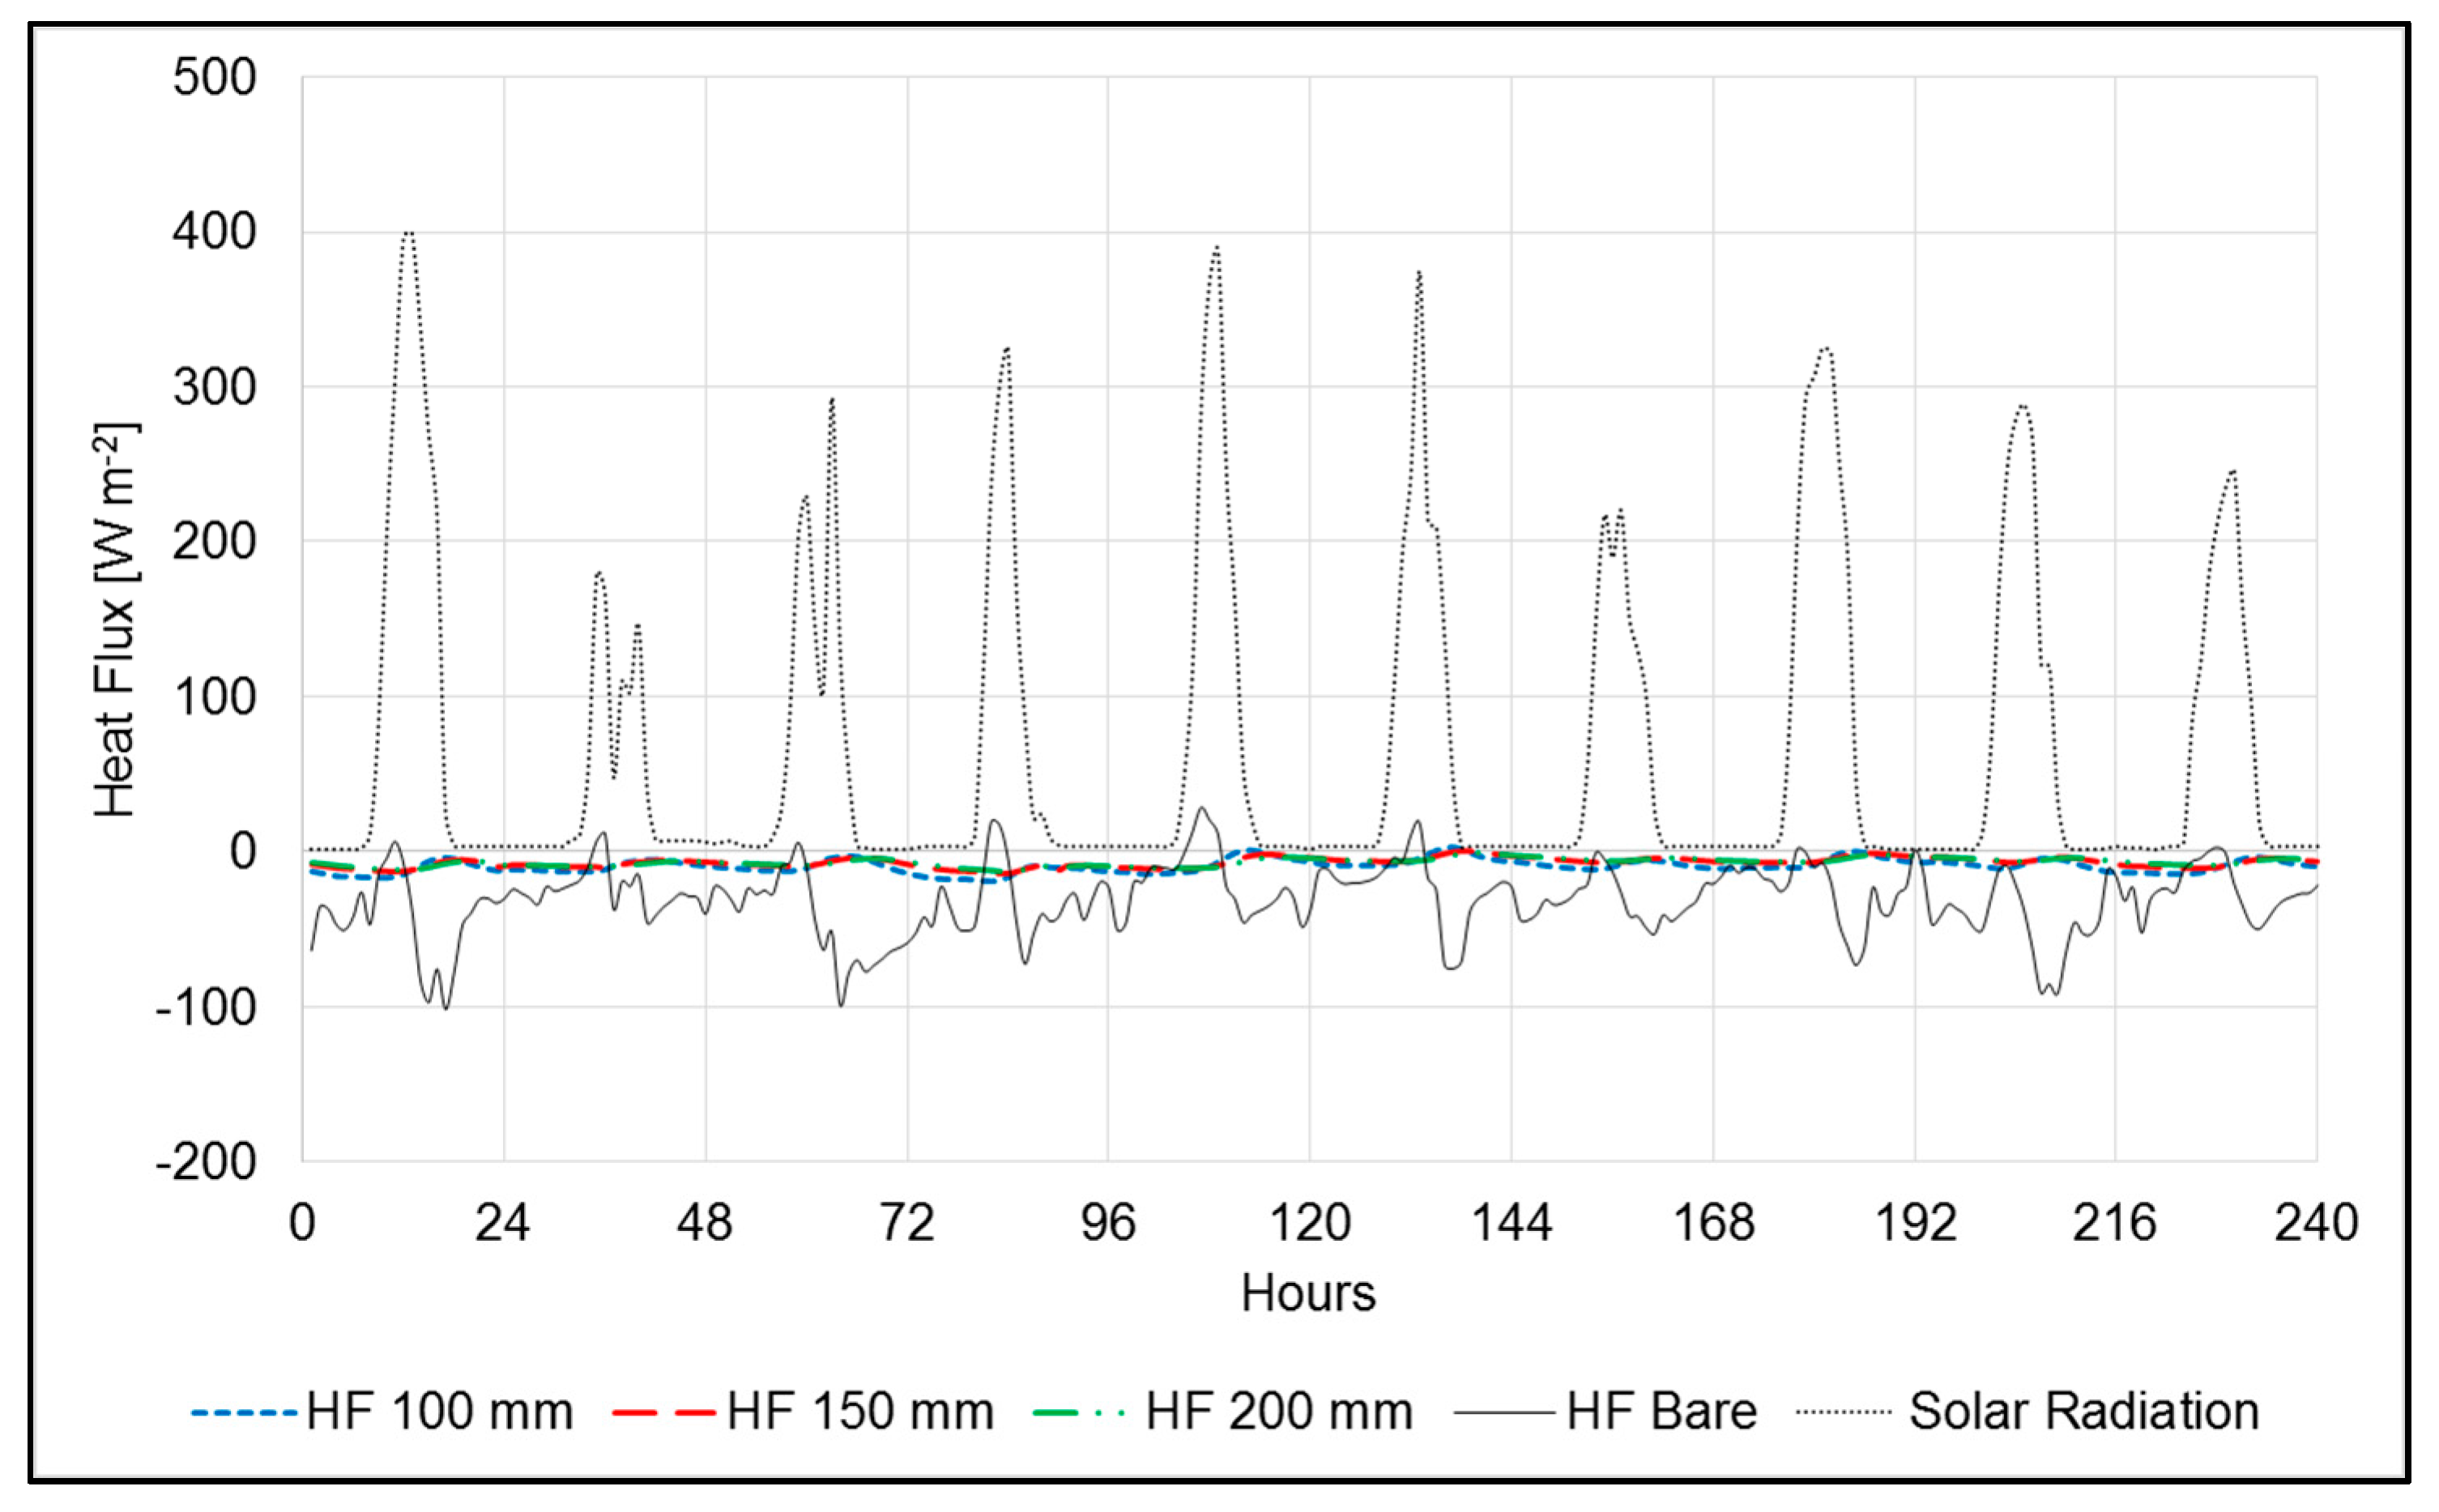
3.3. Summer Heat Fluxes of Sparsely Vegetated Green Roofs
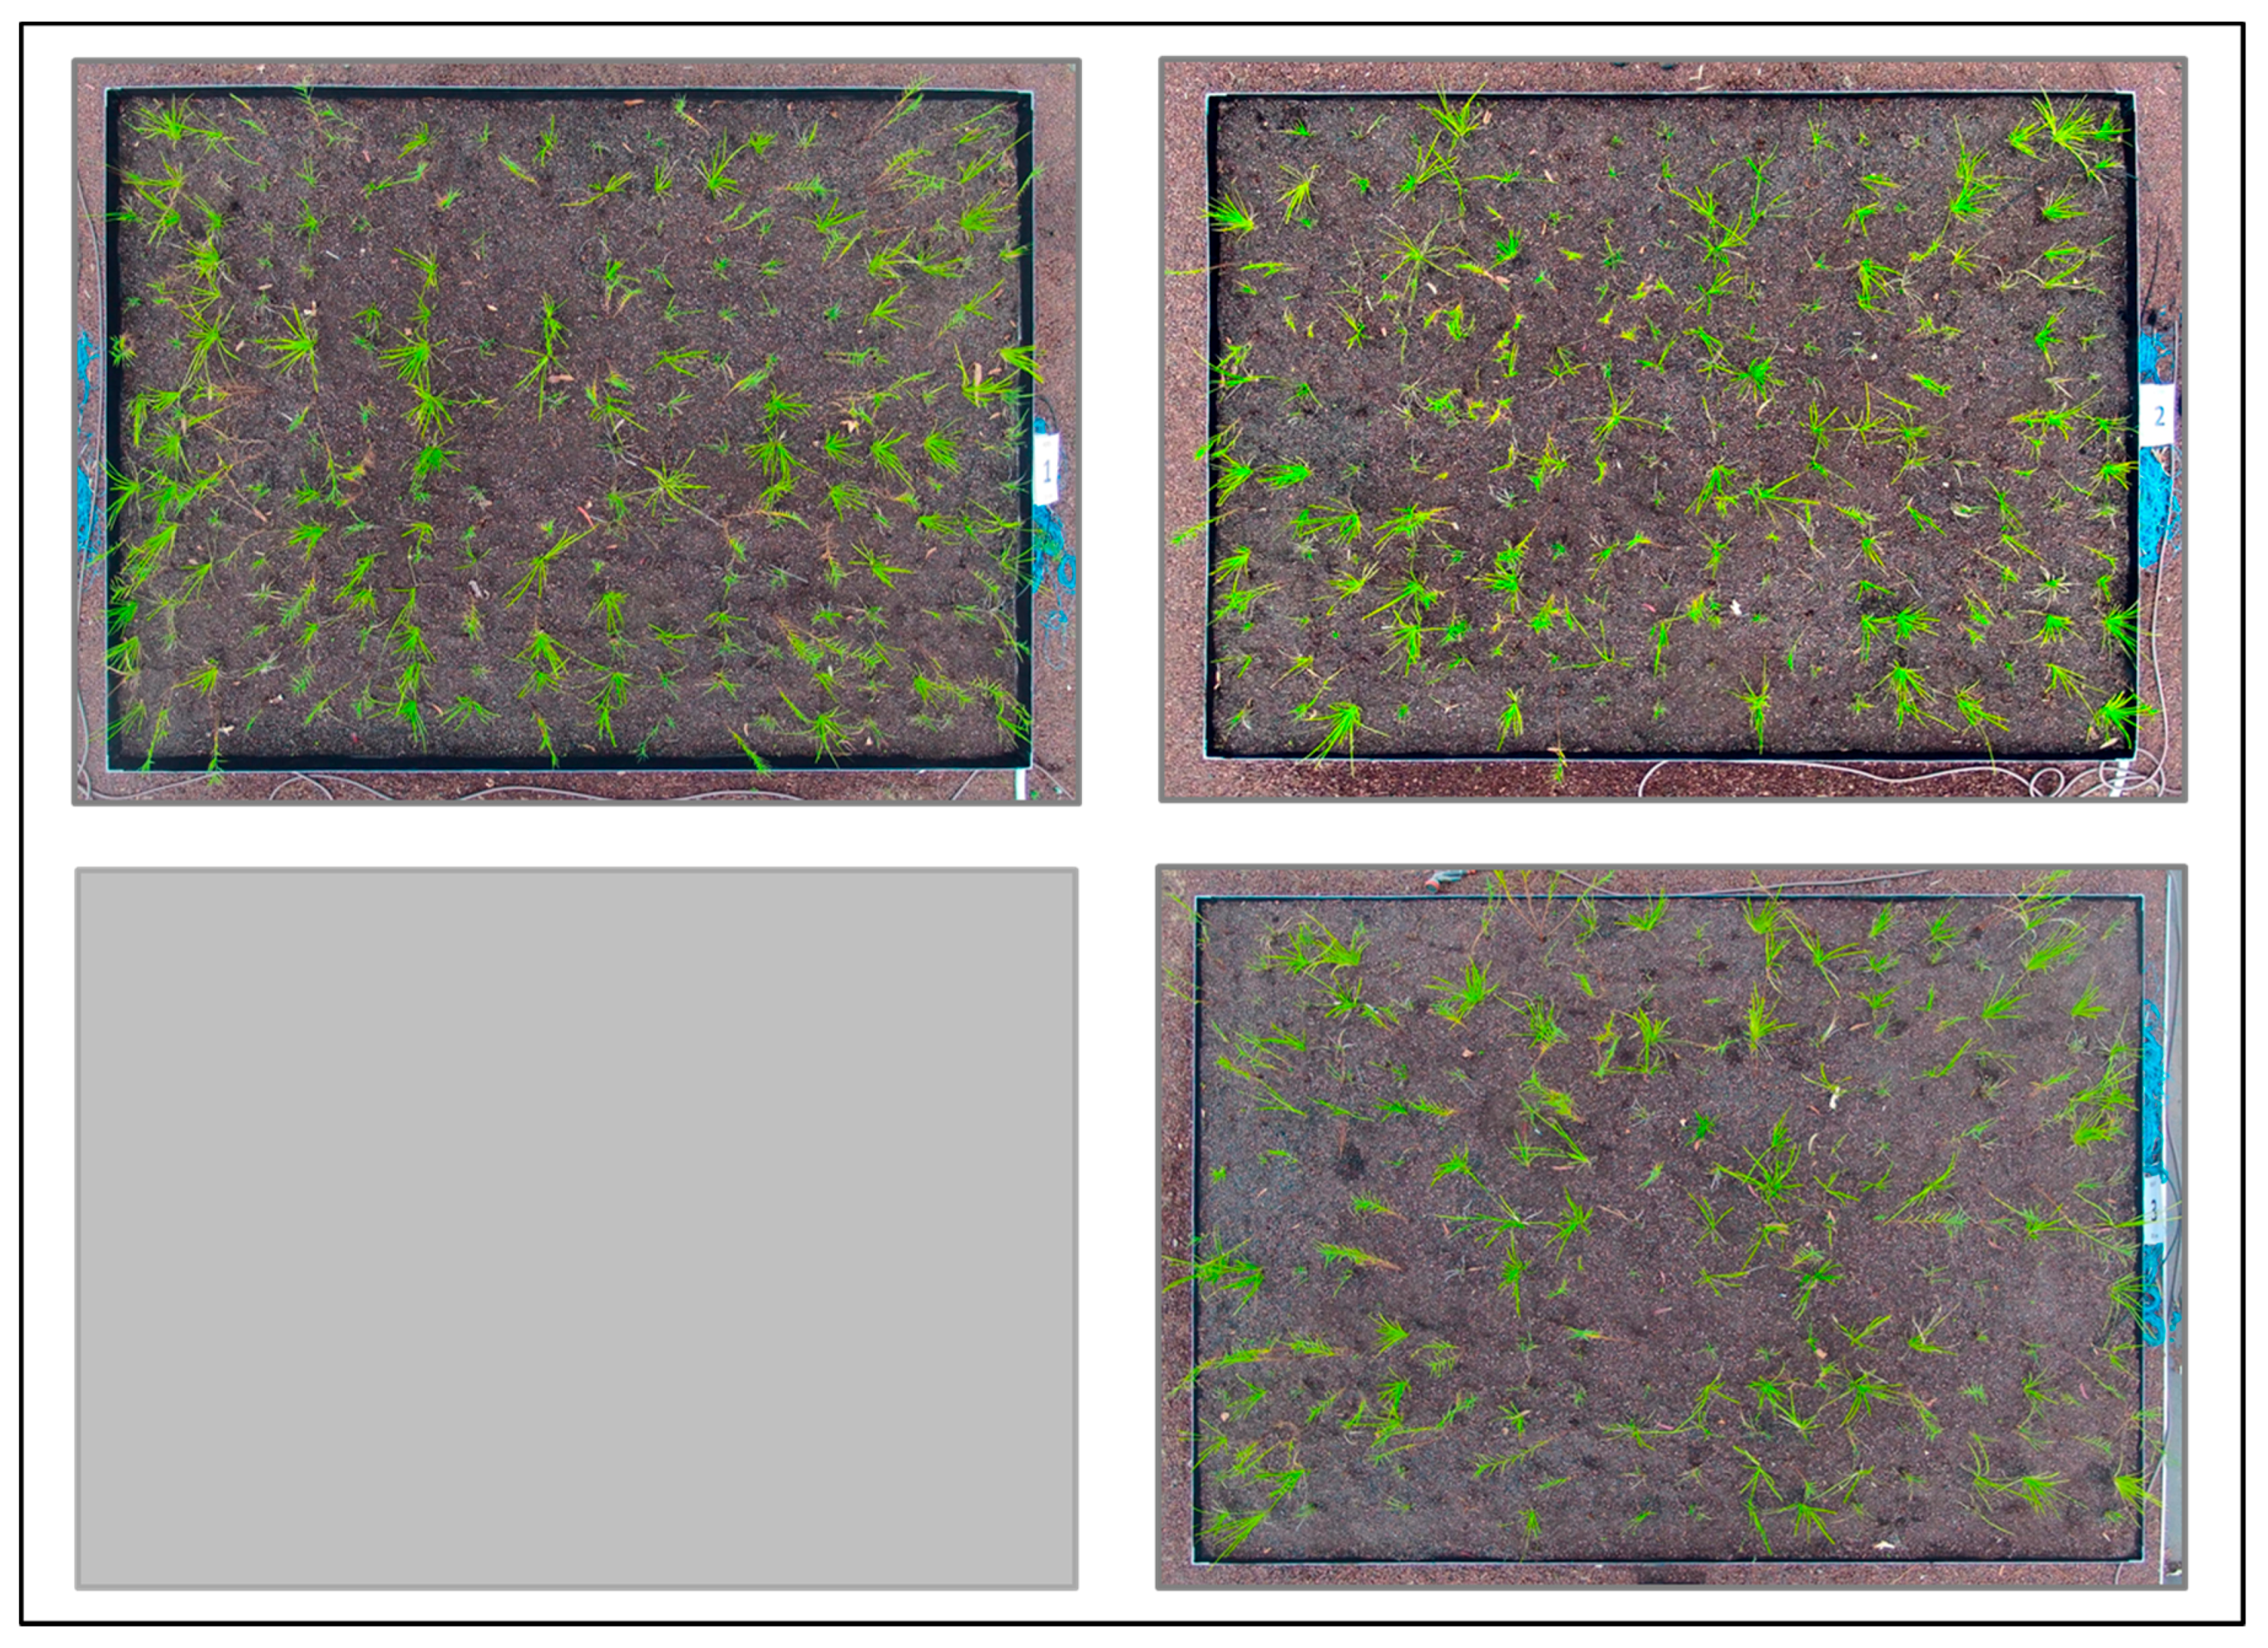
The green roofs were planted at the end of October 2015, and the vegetation coverage in December 2015 was similar and around 20% for all the green roofs (Figure 17 and Figure 18). As the plant species, density and size were the same for all of the plots, the associated LAI is also assumed similar. Establishment irrigation to field capacity (so that there was runoff) was provided three to five times a week for each green roof. Heat flux data were collected from 11 to 20 December 2015. Unfortunately, during summer 2015, temperatures for the green roof substrates were not collected. This period had mostly dry days, except for a few showers on the first (cumulative rain of 1.6 mm in a period of eight hours) and last day (cumulative rain of 4.4 mm in a period of 12 h); therefore, the green roofs were irrigated to retain high moisture content in the substrate, and maintain the plant health and growth. There was a heat wave event with maximum air temperatures between 35 °C and 41.5 °C for four consecutive days from 17 to 20 December.
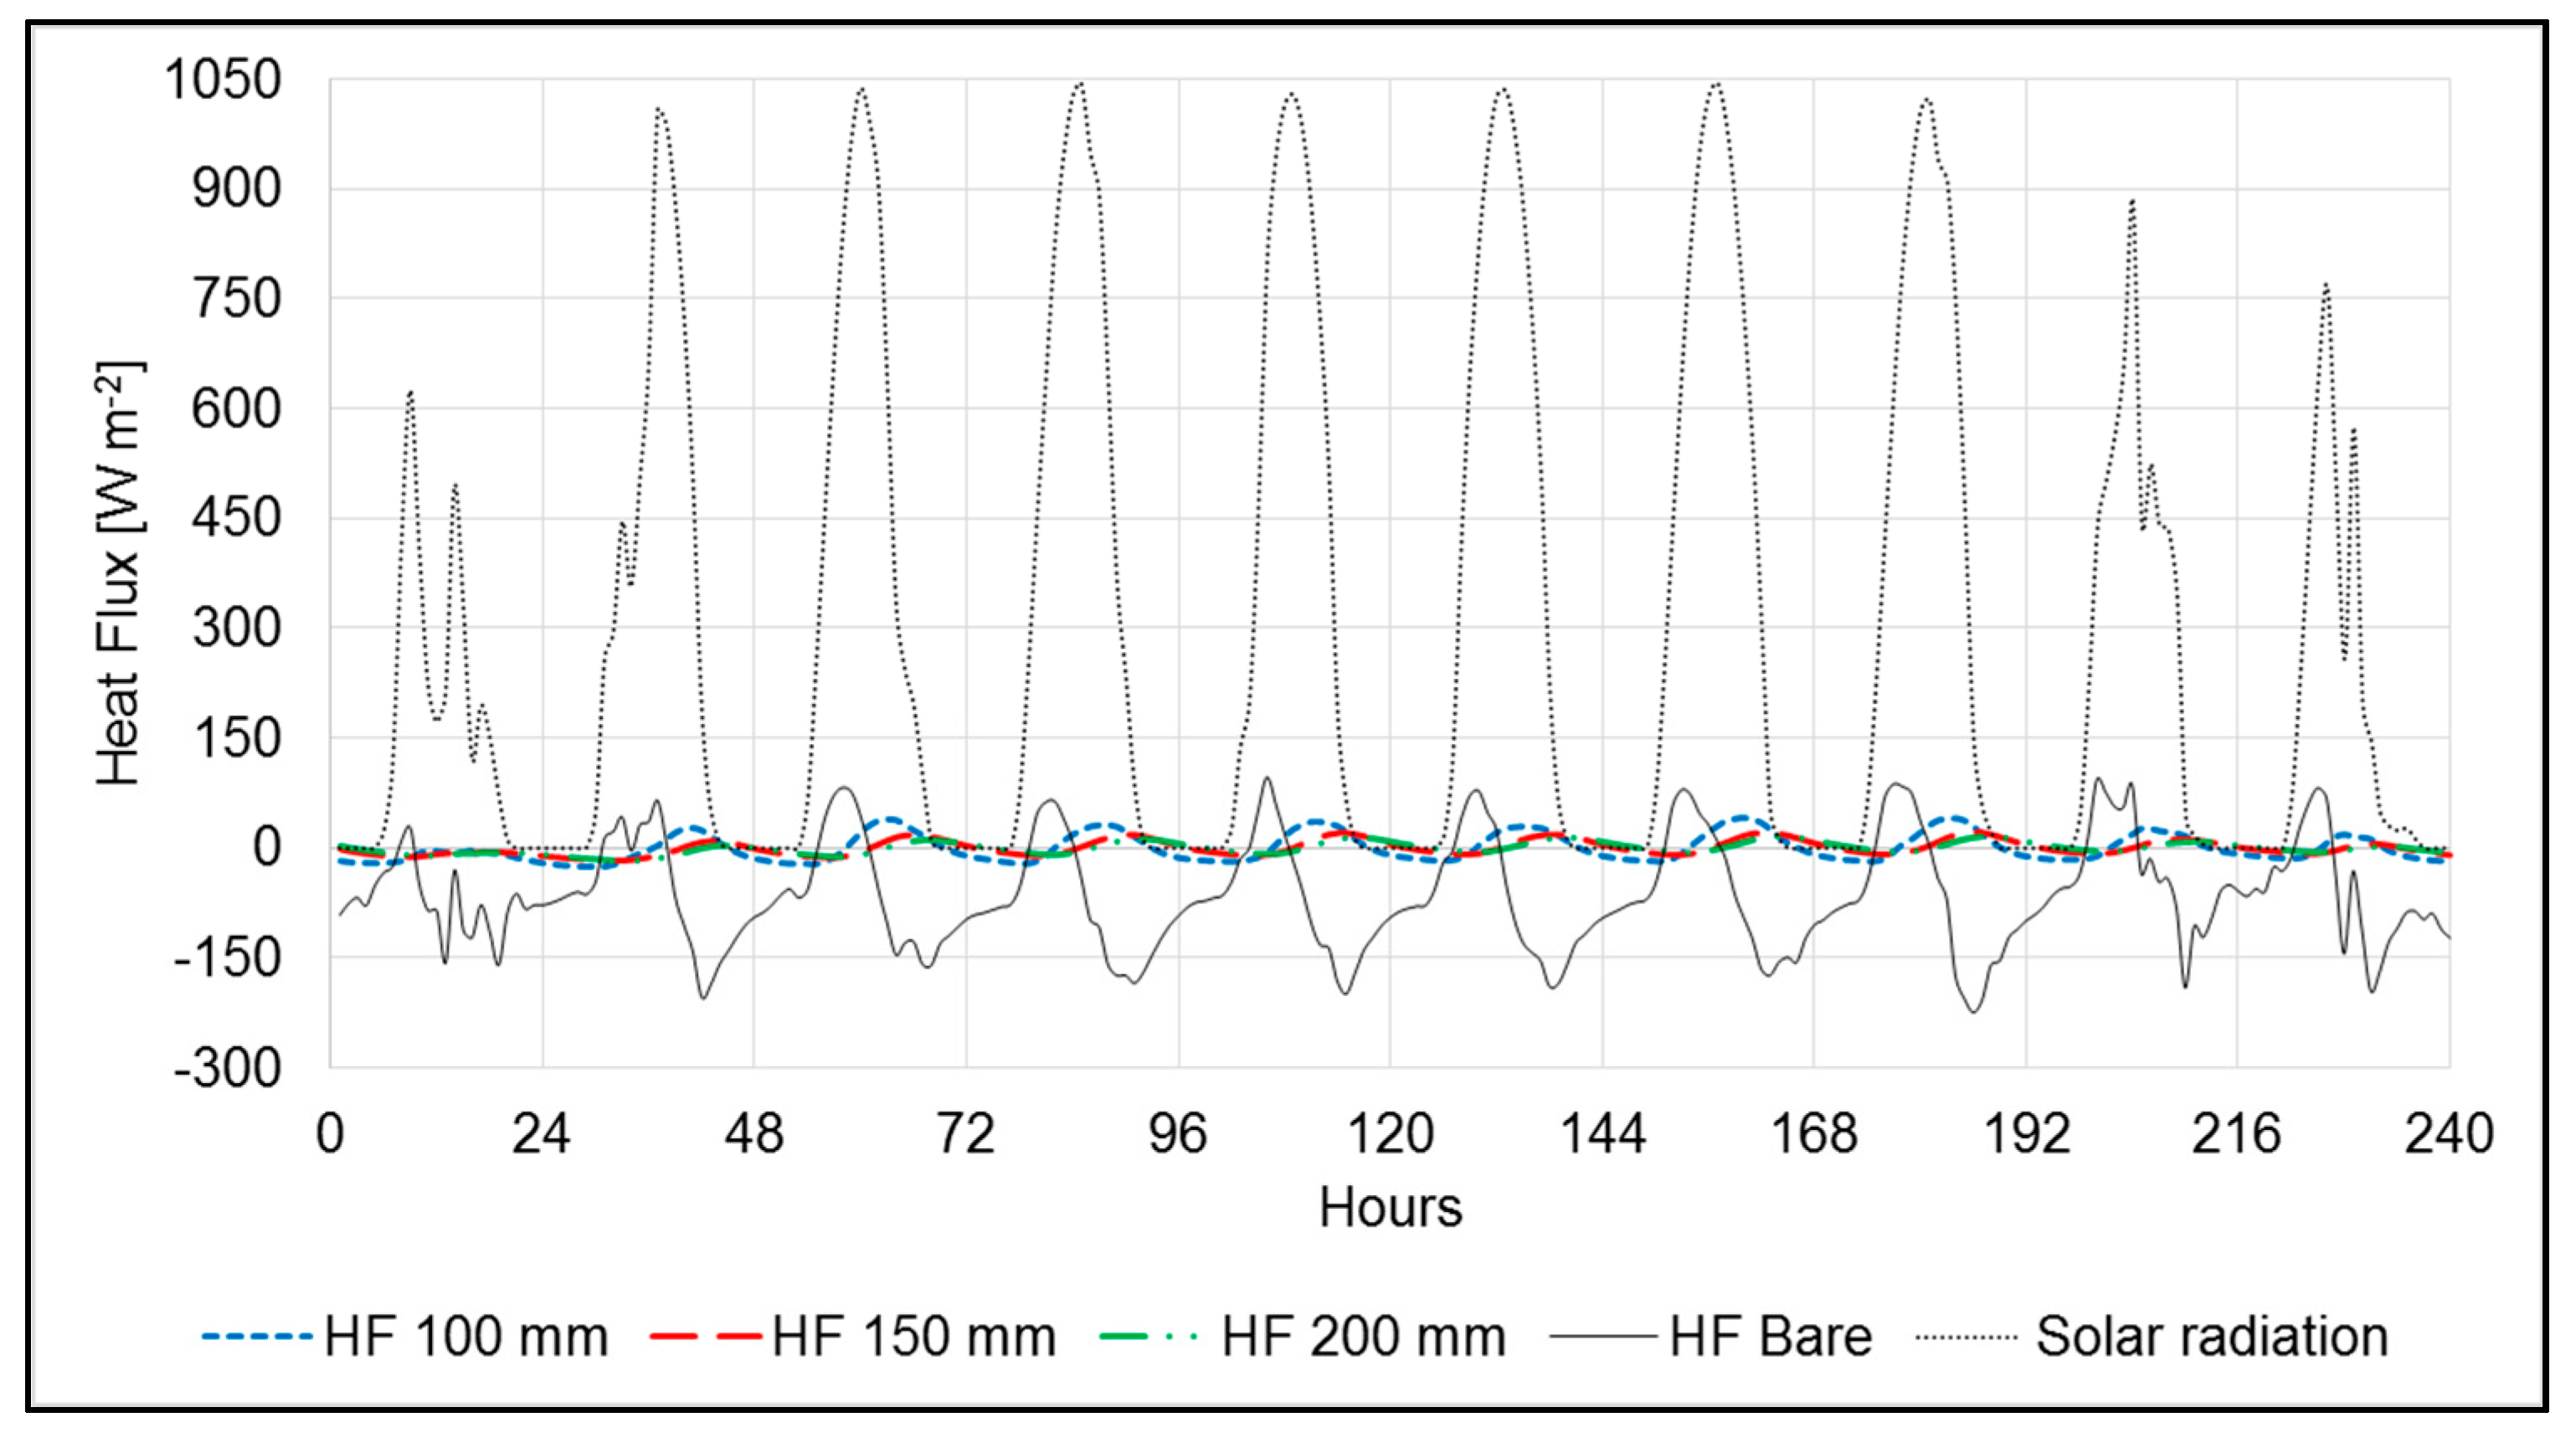
In 2014, when the 200 mm and 150 green roofs were unvegetated and not irrigated, their heat fluxes were similar in magnitude and temporal pattern (Section 3.2.1). In 2015, when vegetated and irrigated, the peak heat flux of the 200 mm green roof (Figure 19 and Figure 20) was distinctly lower than the 150 mm green roof (70% lower) and delayed about two hours (Hours 44–46, Figure 19). The difference between the two roofs is likely due to the large additional amount of irrigation water retained in the thicker 200 mm green roof and its larger cooling effect is likely due to both higher evaporation from the substrate and increased transpiration from the plants. In glasshouse conditions, Farrell et al. [38] found that these species increase water use according to water availability. However, due to the complexity of the evapotranspiration cooling effect of vegetated and irrigated green roofs in hot and dry climate, the authors understand that further study and research are necessary to better understand these dynamics.
Nonetheless, the heat flux difference between the 150 and 200 mm sparsely vegetated green roofs is minimal (i.e., heat peak flux 8.681 W m−2 versus 2.57 W m−2, Hours 44–46, Figure 19) compared to the difference between the 100 and 150 mm sparsely vegetated green roof (i.e., heat peak flux 23.043 versus 8.681 W m−2, Hours 42–44, Figure 19). This suggests again that the thermal performances of the 150 and 200 mm green roofs are overall comparable when all the green roof component layers (i.e., drainage layer, etc.) are included, as the heat flux are measured underneath the whole green roof. In addition, it suggests that the insulation thermal mass of the scoria substrate increases until a thickness of 150 mm, and then approaches the asymptote.
Although the 200 mm green roof gives the best thermal performance, it has an analogous performance to the 150 mm green roof when unirrigated and unvegetated, and there is a small difference when it is irrigated and sparsely vegetated, but it is considerably heavier in weight. The 150 mm green roof with the scoria mixture substrate has a dead load of ~2 kN m−2 versus the 200 mm green roof which is ~2.5 kN m−2 [41,42]. Under this circumstance, a 50 mm shallower scoria substrate would have less weight (between 0.466 (dry) and 0.554 (saturated) kN m−2) and would be a more viable option to retrofit to a wider range of existing buildings. While the extra dead load would be negligible for commercial buildings, this is not the case for most of Melbourne’s low-rise residential buildings which have modest weight loading capacity [43]. If an alternative substrate were used, such as crushed roof tile [41,44], total load would increase up to ~3.15 kN m−2, and it would be even more difficult to retrofit a residential building with a green roof [45].
4. Conclusions
Computer simulations using Sailor’s green roof thermal model [28] were employed to investigate the effect of its design and operating parameters in Melbourne by means of parametric analysis. Furthermore, measured substrate temperatures and heat fluxes from non-vegetated and sparsely vegetated green roofs were collected to compare the effect of those parameters between experimental results and simulations.
In the parametric analysis, we found that LAI (for the vegetation layer) and, to a smaller extent, CDS (for the substrate layer) influenced green roof thermal performance the most. In particular for LAI, the parametric analysis suggests that LAI = 3 offers analogous results to a denser vegetation, such as LAI = 5. To reach such LAI values, irrigation and high density planting would be necessary to maintain plants health and dense cover. Computer simulations did not show much benefit from the other parameters we analysed, particularly those associated with the substrate.
In contrast, the measured data from the experimental roofs showed the importance of the substrate parameters. The green roof substrate alone considerably reduces the heat flux at the building-roof interface compared to a bare conventional roof and delays heat flux into the building by up to eight hours. The largest effect is found with the substrate thickness (ST), which shows significant temperature and heat flux reduction when varying from 100 to 150 mm. The computer simulations using Sailor’s model do not reveal this benefit because the substrate’s temperature and heat flux are simulated by default at the interface between substrate and vegetation, rather than to the interface between the building original roof and the green roof.
The thermal performance of green roofs with 150 and 200 mm thick substrates are generally comparable in summer and winter when non-vegetated and unirrigated and consistently higher than the green roof with 100 mm of substrate. When irrigated and sparsely vegetated, the 200 mm green roof provides the best thermal performance during summer. However, differences between the 200 mm and the 150 mm green roofs are minimal, while both have a notably greater thermal performance than the 100 mm green roof. Consequently, the 150 mm thick green roof would be a more widely applicable option for building retrofit due to its lighter weight than the 200 mm green roof (0.466–0.554 kN m−2 lighter).
As our study has further confirmed, the thermal performance of green roofs varies significantly across different climate zones and buildings. We have also highlighted how computer simulations may provide inaccurate or, sometimes, unrealistic results when the conditions for the embedded assumptions are no longer valid. As such, results from computer simulations should be validated with experimental data. This will help design and select green roof materials to maximise the green roof thermal performance in different climates and buildings.
Acknowledgments
This article is an extended version of the conference paper presented at ZEMCH 2016 International Conference in Kuala Lumpur, Malaysia, on 20–23 December 2016 [40]. This research was funded by Australian Research Council Linkage grant LP130100731 supported by Melbourne Water and Inner Melbourne Action Plan (IMAP) municipal councils. Andrea Pianella is supported by the Melbourne International Research Scholarship (MIRS), Melbourne International Fee Remission Scholarship (MIFRS) and The Frank Keenan Trust Fund Scholarship.
Author Contributions
Andrea Pianella conceived, designed and performed the experimental part and parametric analysis, analysed the data, structured the article and wrote the draft. Lu Aye suggested the parametric analysis. Lu Aye, Zhengdong Chen and Nicholas S. G. Williams provided comments to the experimental design, data analysis and amended the draft.
Conflicts of Interest
The authors declare no conflict of interest.
Nomenclature
| Ceg | bulk heat transfer coefficient for latent heat near the ground |
| Cf | bulk heat transfer coefficient for turbulent heat in the foliage |
| Chg | bulk heat transfer coefficient for sensible heat near the ground |
| Cp,a | specific heat of air at constant pressure |
| Ea | atmospheric emissivity |
| e | vapour pressure |
| es(Ta) | saturated vapour pressure at the air temperature |
| Hf | sensible heat flux at the atmosphere foliage interface [J m−2] |
| Hg | sensible heat flux at the foliage/ground interface [J m−2] |
| Iir↓ | total incoming infrared radiation [W m−2] |
| IS↓ | total incoming solar radiation [W m−2] |
| K | von Karmen constant |
| LAI | Leaf area index [m2 m−2] |
| Lf | latent heat exchanges of the foliage [J m−2] |
| lf | latent heat of vaporization at the foliage temperature [J kg−1] |
| Lg | latent heat exchanges of the ground [J m−2] |
| lg | latent heat of vaporization at the ground temperature [J kg−1] |
| qaf | mixing ratio of the air at the foliage interface |
| qf,sat | saturated foliage mixing ratio |
| qg | mixing ratio of the air at the ground surface |
| r” | surface wetness factor |
| ra | aerodynamic resistance to transpiration [s m−1] |
| rs | foliage leaf stomatal resistance [s m−1] |
| Ta | air temperature [K] |
| Taf | air temperature in the foliage [K] |
| Tf | temperature of foliage [K] |
| Tg | temperature of the ground surface [K] |
| Waf | wind speed in the foliage [m s−1] |
| z | depth of the substrate [m] |
| αf | shortwave albedo for the foliage [0–1] |
| αg | shortwave albedo for the ground surface [0–1] |
| ε1 | εf + εg − εf εg |
| εf | longwave emissivity of the foliage [0–1] |
| εg | longwave emissivity of the ground surface [0–1] |
| ρaf | density of air near the atmosphere/foliage interface [kg m−3] |
| ρag | density of air at the ground temperature [kg m−3] |
| σ | Stefan-Boltzman constant |
References
- UNEP. The Emissions Gap Report. Are the Copenhagen Accord Pledges Sufficient to Limit Global Warming to 2° C or 1.5° C? A Preliminary Assessment. Available online: http://www.indiaenvironmentportal.org.in/files/The_EMISSIONS_GAP_REPORT.pdf (accessed on 16 August 2017).
- Broto, V.C.; Bulkeley, H. A survey of urban climate change experiments in 100 cities. Glob. Environ. Chang. 2013, 23, 92–102. [Google Scholar] [CrossRef] [PubMed] [Green Version]
- Doulos, L.; Santamouris, M.; Livada, I. Passive cooling of outdoor urban spaces. The role of materials. Sol. Energy 2004, 77, 231–249. [Google Scholar]
- Omer, A.M. Energy, environment and sustainable development. Renew. Sustain. Energy Rev. 2008, 12, 2265–2300. [Google Scholar] [CrossRef]
- Sadineni, S.B.; Madala, S.; Boehm, R.F. Passive building energy savings: A review of building envelope components. Renew. Sustain. Energy Rev. 2011, 15, 3617–3631. [Google Scholar] [CrossRef]
- Chwieduk, D. Towards sustainable-energy buildings. Appl. Energy 2003, 76, 211–217. [Google Scholar] [CrossRef]
- John, G.; Clements-Croome, D.; Jeronimidis, G. Sustainable building solutions: A review of lessons from the natural world. Build. Environ. 2005, 40, 319–328. [Google Scholar] [CrossRef]
- Baik, J.J.; Kwak, K.-H.; Park, S.-B.; Ryu, Y.-H. Effects of building roof greening on air quality in street canyons. Atmos. Environ. 2012, 61, 48–55. [Google Scholar] [CrossRef]
- Lee, K.E.; Williams, K.J.H.; Sargent, L.D.; Farrell, C.; Williams, N.S.G. Living roof preference is influenced by plant characteristics and diversity. Landsc. Urban Plan. 2014, 122, 152–159. [Google Scholar] [CrossRef]
- Stovin, V. The potential of green roofs to manage urban stormwater. Water Environ. J. 2010, 24, 192–199. [Google Scholar] [CrossRef]
- Gill, S.E.; Handley, J.F.; Ennos, A.R.; Pauleit, S. Adapting cities for climate change: The role of the green infrastructure. Built Environ. 2007, 33, 115–133. [Google Scholar] [CrossRef]
- Williams, N.S.G.; Lundholm, J.; Scott Macivor, J. Do green roofs help urban biodiversity conservation? J. Appl. Ecol. 2014, 51, 1643–1649. [Google Scholar] [CrossRef]
- Berardi, U.; Ghaffarian Hoseini, A.; Ghaffarian Hoseini, A. State-of-the-art analysis of the environmental benefits of green roofs. Appl. Energy 2014, 115, 411–428. [Google Scholar] [CrossRef]
- Oberndorfer, E.; Lundholm, J.; Bass, B.; Coffman, R.R.; Doshi, H.; Dunnett, N.; Gaffin, S.; Köhler, M.; Liu, K.K.Y.; Rowe, B. Green roofs as urban ecosystems: Ecological structures, functions, and services. BioScience 2007, 57, 823–833. [Google Scholar] [CrossRef]
- Wang, Y.; Berardi, U.; Akbari, H. Comparing the effects of urban heat island mitigation strategies for Toronto, Canada. Energy Build. 2016, 114, 2–19. [Google Scholar] [CrossRef]
- La Roche, P.; Berardi, U. Comfort and energy savings with active green roofs. Energy Build. 2014, 82, 492–504. [Google Scholar] [CrossRef]
- Ramesh, T.; Prakash, R.; Shukla, K.K. Life cycle energy analysis of buildings: An overview. Energy Build. 2010, 42, 1592–1600. [Google Scholar] [CrossRef]
- La Roche, P.; Carbonnier, E.; Halstead, C. Smart green roofs: Cooling with variable insulation. Proccedings of the PLEA2012-28th Conference, Opportunities, Limits & Needs towards an Environmentally Responsible Architecture, Lima, Peru, 7–9 November 2012. [Google Scholar]
- Pianella, A.; Bush, J.; Chen, Z.; Williams, N.S.G.; Aye, L. Green roofs in Australia: Review of thermal performance and associated policy development. In Proceedings of the Architectural Science Association Conference, Adelaide, Australia, 7–9 December 2016; Zuo, J., Daniel, L., Soebarto, V., Eds.; pp. 795–804. [Google Scholar]
- Bevilacqua, P.; Mazzeo, D.; Bruno, R.; Arcuri, N. Experimental investigation of the thermal performances of an extensive green roof in the Mediterranean area. Energy Build. 2016, 122, 63–79. [Google Scholar] [CrossRef]
- Olivieri, F.; Di Perna, C.; D’Orazio, M.; Olivieri, L.; Neila, J. Experimental measurements and numerical model for the summer performance assessment of extensive green roofs in a Mediterranean coastal climate. Energy Build. 2013, 63, 1–14. [Google Scholar] [CrossRef]
- Fioretti, R.; Palla, A.; Lanza, L.G.; Principi, P. Green roof energy and water related performance in the Mediterranean climate. Build. Environ. 2010, 45, 1890–1904. [Google Scholar] [CrossRef]
- Bevilacqua, P.; Mazzeo, D.; Bruno, R.; Arcuri, N. Surface temperature analysis of an extensive green roof for the mitigation of urban heat island in southern mediterranean climate. Energy Build. 2017, 150, 318–327. [Google Scholar] [CrossRef]
- Liu, K.; Baskaran, B. Thermal performance of green roofs through field evaluation. In Proceedings of the First North American Green Roof Infrastructure Conference, Awards and Trade Showm, Chicago, IL, USA, 29–30 May 2003. [Google Scholar]
- Jim, C.Y.; Tsang, S.W. Biophysical properties and thermal performance of an intensive green roof. Build. Environ. 2011, 46, 1263–1274. [Google Scholar] [CrossRef]
- Jim, C.Y. Effect of vegetation biomass structure on thermal performance of tropical green roof. Landsc. Ecol. Eng. 2012, 8, 173–187. [Google Scholar] [CrossRef] [Green Version]
- Schweitzer, O.; Erell, E. Evaluation of the energy performance and irrigation requirements of extensive green roofs in a water-scarce Mediterranean climate. Energy Build. 2014, 68, 25–32. [Google Scholar] [CrossRef]
- Sailor, D.J. A green roof model for building energy simulation programs. Energy Build. 2008, 40, 1466–1478. [Google Scholar] [CrossRef]
- Brown, C.; Lundholm, J. Microclimate and substrate depth influence green roof plant community dynamics. Landsc. Urban Plan. 2015, 143, 134–142. [Google Scholar] [CrossRef]
- Dunnett, N.; Nagase, A.; Hallam, A. The dynamics of planted and colonising species on a green roof over six growing seasons 2001–2006: Influence of substrate depth. Urban Ecosyst. 2008, 11, 373–384. [Google Scholar] [CrossRef]
- Lundholm, J.T. Spontaneous dynamics and wild design in green roofs. Isr. J. Ecol. Evol. 2016, 62, 23–31. [Google Scholar] [CrossRef]
- Palomo Del Barrio, E. Analysis of the green roofs cooling potential in buildings. Energy Build. 1998, 27, 179–193. [Google Scholar] [CrossRef]
- Tabares-Velasco, P.C.; Srebric, J. A heat transfer model for assessment of plant based roofing systems in summer conditions. Build. Environ. 2012, 49, 310–323. [Google Scholar] [CrossRef]
- Lazzarin, R.M.; Castellotti, F.; Busato, F. Experimental measurements and numerical modelling of a green roof. Energy Build. 2005, 37, 1260–1267. [Google Scholar] [CrossRef]
- Ouldboukhitine, S.E.; Belarbi, R.; Jaffal, I.; Trabelsi, A. Assessment of green roof thermal behavior: A coupled heat and mass transfer model. Build. Environ. 2011, 46, 2624–2631. [Google Scholar] [CrossRef]
- Frankestein, S.; Koeing, G. FASST Vegetation Models, Technical Report TR-04-25; U.S. Army Engineer Research and Development Center: Vicksburg, MS, USA, 2004. [Google Scholar]
- Bras, R.L. Hydrology: An Introduction to Hydrologic Science; Addison-Wesley: Reading, MA, USA, 1990. [Google Scholar]
- Farrell, C.; Szota, C.; Williams, N.S.G.; Arndt, S.K. High water users can be drought tolerant: Using physiological traits for green roof plant selection. Plant Soil 2013, 372, 177–193. [Google Scholar] [CrossRef]
- Vera, S.; Pinto, C.; Tabares-Velasco, P.C.; Bustamante, W.; Victorero, F.; Gironás, J.; Bonilla, C.A. Influence of vegetation, substrate, and thermal insulation of an extensive vegetated roof on the thermal performance of retail stores in semiarid and marine climates. Energy Build. 2017, 146, 312–321. [Google Scholar] [CrossRef]
- Pianella, A.; Aye, L.; Chen, Z.; Williams, N.S.G. Effects of design and operating parameters on green roof thermal performance in Melbourne. Proccedings of the 5th International Conference on Zero Energy Mass Customised Housing (ZEMCH), Kuala Lumpur, Malaysia, 20–23 December 2016; Hashemi, A., Ed.; pp. 11–31. [Google Scholar]
- Pianella, A.; Clarke, R.E.; Williams, N.S.G.; Chen, Z.; Aye, L. Steady-state and transient thermal measurements of green roof substrates. Energy Build. 2016, 131, 123–131. [Google Scholar] [CrossRef]
- Victorian Department of Environment and Primary Industries. Growing Green Guide: A Guide to Green Roofs, Walls and Facades in Melbourne and Victoria, Australia; Victorian Department of Environment and Primary Industries: Melbourne, Australia, 2014.
- Sofi, M.; Zhong, A.; Lumantarna, E.; Cameron, R. Addition of green: Re-evaluation of building structural elements. In Proceedings of the Practical Responses to Climate Change Conference, Melbourne, Australia, 25–27 November 2014; Engineers Australia: Barton ACT, Australia; pp. 100–107. [Google Scholar]
- Farrell, C.; Mitchell, R.E.; Szota, C.; Rayner, J.P.; Williams, N.S.G. Green roofs for hot and dry climates: Interacting effects of plant water use, succulence and substrate. Ecol. Eng. 2012, 49, 270–276. [Google Scholar] [CrossRef]
- Wilkinson, S.; Feitosa, R.C.; Kaga, I.T.; deFranceschi, I.H. Evaluating the Thermal Performance of Retrofitted Lightweight Green Roofs and Walls in Sydney and Rio de Janeiro. Procedia Eng. 2017, 180, 231–240. [Google Scholar] [CrossRef]
Figure 1.
Hortizontal profile of the experimental green roofs at the University of Melbourne Burnley Campus illustrating sensor positions.
Figure 1.
Hortizontal profile of the experimental green roofs at the University of Melbourne Burnley Campus illustrating sensor positions.

Figure 2.
Design of the experimental green roofs at the University of Melbourne Burnley Campus illustrating the green and control roofs and sensor locations.
Figure 2.
Design of the experimental green roofs at the University of Melbourne Burnley Campus illustrating the green and control roofs and sensor locations.

Figure 3.
Parametric analysis using Sailor’s (2008) green roof thermal model of soil temperature with varying Leaf Area Index (LAI) values for 10 summer days in Melbourne (2–11 December 2014).
Figure 3.
Parametric analysis using Sailor’s (2008) green roof thermal model of soil temperature with varying Leaf Area Index (LAI) values for 10 summer days in Melbourne (2–11 December 2014).

Figure 4.
Parametric analysis using Sailor’s (2008) green roof thermal model of soil heat flux with varying Leaf Area Index (LAI) values for 10 summer days in Melbourne (2–11 December 2014).
Figure 4.
Parametric analysis using Sailor’s (2008) green roof thermal model of soil heat flux with varying Leaf Area Index (LAI) values for 10 summer days in Melbourne (2–11 December 2014).

Figure 5.
Parametric analysis using Sailor’s (2008) green roof thermal model of soil temperature with varying minimum Stomatal Resistance (SR) [s m−1] values for 10 summer days in Melbourne (2–11 December 2014).
Figure 5.
Parametric analysis using Sailor’s (2008) green roof thermal model of soil temperature with varying minimum Stomatal Resistance (SR) [s m−1] values for 10 summer days in Melbourne (2–11 December 2014).

Figure 6.
Parametric analysis using Sailor’s (2008) green roof thermal model of soil temperature with varying minimum Stomatal Resistance (SR) [s m−1] values for 10 summer days in Melbourne (2–11 December 2014).
Figure 6.
Parametric analysis using Sailor’s (2008) green roof thermal model of soil temperature with varying minimum Stomatal Resistance (SR) [s m−1] values for 10 summer days in Melbourne (2–11 December 2014).

Figure 7.
Parametric analysis using Sailor’s (2008) green roof thermal model of soil temperature with varying Conductivity of Dry Soil (CDS) [W m−1 K−1] values for 10 summer days in Melbourne (2–11 December 2014).
Figure 7.
Parametric analysis using Sailor’s (2008) green roof thermal model of soil temperature with varying Conductivity of Dry Soil (CDS) [W m−1 K−1] values for 10 summer days in Melbourne (2–11 December 2014).

Figure 8.
Parametric analysis using Sailor’s (2008) green roof thermal model of soil heat flux with varying Conductivity of Dry Soil (CDS) [W m−1 K−1] values for 10 summer days in Melbourne (2–11 December 2014).
Figure 8.
Parametric analysis using Sailor’s (2008) green roof thermal model of soil heat flux with varying Conductivity of Dry Soil (CDS) [W m−1 K−1] values for 10 summer days in Melbourne (2–11 December 2014).

Figure 9.
Green roof substrate temperature at the bottom (B) and at the surface (S) of three non-vegetated green roofs with different thickness for 10 summer days in Melbourne (2–11 December 2014).
Figure 9.
Green roof substrate temperature at the bottom (B) and at the surface (S) of three non-vegetated green roofs with different thickness for 10 summer days in Melbourne (2–11 December 2014).

Figure 10.
Green roof substrate temperature at the bottom (B) and at the surface (S) of three non-vegetated green roofs with different thickness for 10 winter days in Melbourne (1–10 June 2015).
Figure 10.
Green roof substrate temperature at the bottom (B) and at the surface (S) of three non-vegetated green roofs with different thickness for 10 winter days in Melbourne (1–10 June 2015).

Figure 11.
Rainfall and green roof substrate temperature at the bottom of three non-vegetated green roofs with different thickness for 10 summer days in Melbourne (2–11 December 2014).
Figure 11.
Rainfall and green roof substrate temperature at the bottom of three non-vegetated green roofs with different thickness for 10 summer days in Melbourne (2–11 December 2014).

Figure 12.
Ambient air temperature and heat flux of three non-vegetated green roofs with different thickness and one bare conventional roof for 10 summer days in Melbourne (2–11 December 2014).
Figure 12.
Ambient air temperature and heat flux of three non-vegetated green roofs with different thickness and one bare conventional roof for 10 summer days in Melbourne (2–11 December 2014).

Figure 13.
Solar radiation and heat flux of three non-vegetated green roofs with different thickness and one bare conventional roof for 10 summer days in Melbourne (2–11 December 2014).
Figure 13.
Solar radiation and heat flux of three non-vegetated green roofs with different thickness and one bare conventional roof for 10 summer days in Melbourne (2–11 December 2014).

Figure 14.
Rainfall and green roof substrate temperature at the bottom of three non-vegetated green roofs with different thickness for 10 winter days in Melbourne (1–10 June 2015).
Figure 14.
Rainfall and green roof substrate temperature at the bottom of three non-vegetated green roofs with different thickness for 10 winter days in Melbourne (1–10 June 2015).

Figure 15.
Ambient air temperature and heat flux of three non-vegetated green roofs with different thickness and one bare conventional roof for 10 winter days in Melbourne (1–10 June 2015).
Figure 15.
Ambient air temperature and heat flux of three non-vegetated green roofs with different thickness and one bare conventional roof for 10 winter days in Melbourne (1–10 June 2015).

Figure 16.
Solar radiation and heat flux of three non-vegetated green roofs with different thickness and one bare conventional roof for 10 winter days in Melbourne (1–10 June 2015).
Figure 16.
Solar radiation and heat flux of three non-vegetated green roofs with different thickness and one bare conventional roof for 10 winter days in Melbourne (1–10 June 2015).

Figure 17.
The experimental green roofs at The University of Melbourne’s Burnley Campus in December 2015 with sparse (20% cover) vegetation.
Figure 17.
The experimental green roofs at The University of Melbourne’s Burnley Campus in December 2015 with sparse (20% cover) vegetation.

Figure 18.
From top left corner clockwise, aerial view of vegetation coverage of 100, 150 and 200 mm sparsely vegetated experimental green roofs and reference concrete roof (Melbourne, December 2015).
Figure 18.
From top left corner clockwise, aerial view of vegetation coverage of 100, 150 and 200 mm sparsely vegetated experimental green roofs and reference concrete roof (Melbourne, December 2015).

Figure 19.
Ambient air temperature and heat flux of three sparsely vegetated green roofs with different thickness and one bare conventional roof for 10 summer days in Melbourne (11–20 December 2015).
Figure 19.
Ambient air temperature and heat flux of three sparsely vegetated green roofs with different thickness and one bare conventional roof for 10 summer days in Melbourne (11–20 December 2015).

Figure 20.
Solar radiation and heat flux of three sparsely vegetated green roofs with different thickness and one bare conventional roof for 10 summer days in Melbourne (11–20 December 2015).
Figure 20.
Solar radiation and heat flux of three sparsely vegetated green roofs with different thickness and one bare conventional roof for 10 summer days in Melbourne (11–20 December 2015).


Table 1.
Input values for EnergyPlus simulations.
| Input Variable/Parameter | Units | Input Values |
|---|---|---|
| Height of plants | m | 0.20 |
| Leaf area index | - | 0.01–1–3–5 |
| Leaf reflectivity | - | 0.10–0.22–0.30–0.50 |
| Leaf emissivity | - | 0.95 |
| Minimum stomatal resistance | s m−1 | 50–150–180–30 |
| Roughness | - | MediumRough |
| Thickness | m | 0.07–0.10–0.15–0.30 |
| Conductivity of dry soil | W m−1 K−1 | 0.20–0.35–0.40–0.80 |
| Density of dry soil | kg m−3 | 1100 |
| Specific heat of dry soil | J kg−1 K−1 | 1200 |
| Thermal infrared absorptance | - | 0.90 |
| Solar absorptance | - | 0.70 |
| Visible absorptance | - | 0.75 |
| Saturation volumetric moisture content of the soil | - | 0.20–0.30–0.40 |
| Residual volumetric moisture content of the soil | - | 0.01 |
| Initial volumetric moisture content of the soil | - | 0.10 |
| Moisture diffusion calculation method | - | Advanced |
© 2017 by the authors. Licensee MDPI, Basel, Switzerland. This article is an open access article distributed under the terms and conditions of the Creative Commons Attribution (CC BY) license (http://creativecommons.org/licenses/by/4.0/).
Share and Cite
MDPI and ACS Style
Pianella, A.; Aye, L.; Chen, Z.; Williams, N.S.G. Substrate Depth, Vegetation and Irrigation Affect Green Roof Thermal Performance in a Mediterranean Type Climate. Sustainability 2017, 9, 1451. https://doi.org/10.3390/su9081451
AMA Style
Pianella A, Aye L, Chen Z, Williams NSG. Substrate Depth, Vegetation and Irrigation Affect Green Roof Thermal Performance in a Mediterranean Type Climate. Sustainability. 2017; 9(8):1451. https://doi.org/10.3390/su9081451
Chicago/Turabian StylePianella, Andrea, Lu Aye, Zhengdong Chen, and Nicholas S. G. Williams. 2017. "Substrate Depth, Vegetation and Irrigation Affect Green Roof Thermal Performance in a Mediterranean Type Climate" Sustainability 9, no. 8: 1451. https://doi.org/10.3390/su9081451
Note that from the first issue of 2016, this journal uses article numbers instead of page numbers. See further details here.