Effect of Uncertainties in Estimated Carbon Reduction from Deforestation and Forest Degradation on Required Incentive Payments in Developing Countries


1
Institute for History of Science and Technology, Nanjing University of Information Science & Technology, 219 Ningliu Road, Nanjing 210044, China
2
School of Economics and Management, Nanjing University of Information Science & Technology, 219 Ningliu Road, Nanjing 210044, China
Sustainability 2017, 9(9), 1608; https://doi.org/10.3390/su9091608
Submission received: 18 July 2017
/
Revised: 7 September 2017
/
Accepted: 7 September 2017
/
Published: 9 September 2017
(This article belongs to the Section Environmental Sustainability and Applications)
Abstract
:For reducing emissions from deforestation and forest degradation (REDD+) programs, it is particularly important that monitoring for emission reductions is tied to the revenues a developing country receives from REDD+ projects; any estimated uncertainties will have significant impacts on the emission reduction estimation and incentive scheme of REDD+. However, the effects of estimated uncertainties on incentives for developing countries have not been deeply discussed in the current literature. To fill this gap, two estimation approaches for emission reductions are introduced by considering the incentive coefficient by the principle of reliable minimum estimation. The relationship between estimated uncertainties and incentive coefficient is simulated to illustrate the effects of estimated uncertainties on the emission reduction estimation and incentive scheme. Data from six tropical developing countries are used, including Nigeria, Honduras, Indonesia, Cambodia, Ghana, and Brazil. The results indicate that both the errors of referential and actual carbon stock must be considered when estimating and predicting emission reductions. The effects of the error of actual carbon stock on the emission reduction estimation and incentive coefficient were determined to be more influential. The current incentive scheme was more favorable to developing countries with high carbon stock variability, while developing countries with low carbon stock variability had insufficient incentives to implement REDD+ project.
1. Introduction
Emissions from deforestation and forest degradation have accounted for 12–20% of global anthropogenic carbon emissions [1]. Thus, a program entitled “Reducing emissions from deforestation and forest degradation (REDD+)” has become the priority means to deal with global climate change in developing countries [2]. Under this program, developing countries could receive rewards or compensations for avoiding or reducing deforestation and forest degradation [3]. REDD+ can help developing countries reduce deforestation and forest degradation, and it also promotes sustainable forest management, forest conservation, and increasing carbon stocks. Even some other activities of forest management are likely to be integrated into ongoing REDD+, such as regrowing tropical secondary forests after shifting cultivation [4,5]. All these measures can effectively improve the value of forest resources in developing countries and provide incentives for those countries to conserve their forests. More and more developing countries have joined the REDD+ readiness program under the United Nations Framework Convention on Climate Change (UNFCCC). For example, 47 partner countries have joined the World Bank’s Forest Carbon Partnership Facility (FCPF), which is mainly used for REDD+ projects in developing countries [6].
The accurate monitoring and measurement of emission reductions are particularly important because they are directly related to the benefits from REDD+ projects. The uncertainties in REDD+ projects refer to the uncertainties of the reported estimates and all of their components, which may arise from the use of default volume to biomass-expansion factors, sampling, modeling and systematic errors [7]. Current research on estimated uncertainties in the REDD+ projects has demonstrated that the economic and political dimensions of REDD+ projects and their results-based criteria require highly accurate monitoring, reporting and verification (MRV) of emissions from forest [8]. Due to the high level of uncertainty that plagues emissions estimates from the forest sector [9], a reliable MRV system for carbon emissions is the key to ensure the successful implementation of REDD+ projects that can effectively reduce deforestation and forest degradation [10]. However, many developing countries lack effective MRV systems. Thus, there are many estimated uncertainties associated with the REDD+ projects [11]. For example, Romijn, et al. [12] suggest the vast majority of developing countries, except China, India, Mexico, and Argentina, still cannot estimate carbon stocks and flows from forests. Since land use change and forestry operations are often the largest sources of estimated uncertainties [13], Pelletier, et al. [14] argue that how to deal with the estimated uncertainty of emission reductions in REDD+ projects is likely to be a contentious issue with tremendous influence. If it is possible to take some measures to estimate better the uncertainties of carbon reductions, the accounting of greenhouse gas emissions would be more accurate, which will be conducive to the implementation of the REDD+ project in the future [15].
Pelletier, Busch and Potvin [14] argue that REDD+ projects aim to effectively reduce emissions from deforestation and forest degradation by using the incentive mechanism, which is mainly used to compensate developing countries for successful efforts to slow, halt, or revert forest cover change. However, the uncertainties in estimation errors may affect the financing and incentive mechanism of REDD+ projects. Most studies focus on data availability in MRV systems [16,17,18,19] and related costs [20,21]. Only a few studies have considered the potential effects of estimated uncertainties on incentives. Pelletier, et al. [11] argue that relevant estimated uncertainties may overshadow the actual emission reductions in developing countries. Thus, Sunderlin, et al. [22] suggest that estimated uncertainties arising from imperfect MRV may prevent widespread implementation of results-based financing. Similarly, Bucki, et al. [23] and Pelletier, Martin and Potvin [9] both argue that estimated uncertainties in REDD+ projects may lead to the effects of changes in forest management remaining within error ranges for a few years. Thus, REDD+ incentives cannot be allocated to the developing countries with actual emission reductions on a reliable benchmark. Lusiana, et al. [24] also argue that the estimated uncertainties are directly tied to differences in stakeholders’ interests. Moreover, Engel, et al. [25] find that the estimated uncertainties may also reduce incentives for landowners to postpone committing their properties to forest conservation. Consequently, the estimated uncertainties may diminish the role of incentive mechanisms, thus making the current financial mechanism less effective [9]. It is critical that the effects of these estimated uncertainties on incentives be considered in designing REDD+ projects. However, the effects of estimated uncertainties on incentives in different types of developing countries are not well analyzed and distinguished.
Several approaches are developed to estimate the uncertainties under REDD+ or other contexts. Within the Clean Development Mechanism (CDM) framework, the Verified Carbon Standard (VCS) is proposed to deal with the estimated uncertainties by using conservative factors specified. However, discussions continue on the measurement of estimated uncertainty within the CDM framework but have not yet been formally adopted [14]. Grassi, et al. [26] propose another approach to estimate the emission reductions conservatively. According to the principle of conservativeness, Penman, et al. [27] put forward the approach of reliable minimum estimate (RME) to estimate the carbon stocks. Kohl, et al. [28] argue that the significant advantage of RME is that it can estimate the overall uncertainty, which includes sampling error, prediction error, measurement error, and classification error. Another recommendation to deal with estimated uncertainties is the “risk charging method” [29]. According to such approach, it is advisable to estimate uncertainties from confidence intervals. However, Plugge, et al. [30] find that the confidence interval contains only the sampling error. Thus, the magnitude of the estimated change in carbon stock using RME is less than that estimated using a confidence interval approach, while RME contains a variety of errors. Thus, Grassi, Monni, Federici, Achard and Mollicone [26] argue that the RME method is a more conservative approach, which can improve the reliability of emission reduction estimates. Based on the above considerations, this paper will examine the estimated uncertainty within REDD+ framework by using RME as a whole without breaking it into several components. According to the conservative principle, the RME estimates the emission reductions by comparing the difference between the lower error bound of the referential period and the upper error bound of the assessment period. Since UNFCCC [31] demanded that emission reductions should not be overestimated, the adoption of RME in the assessment period is a prerequisite for establishing an MRV system in the REDD+ project. Thus, only the lower error bound of emission reductions in the referential period can comply with the accounting requirements. However, the current literature has not well discussed the effects of estimated uncertainties of referential and actual carbon stocks.
This paper develops some of these estimated uncertainty arguments on emission reductions and incentives in different types of developing countries. This paper makes the following three contributions: (i) considering incentives in the estimation of carbon stock variability through a series of national datasets to simulate the effects of estimated uncertainties on emission reduction estimates and incentives; (ii) considering the current incentive scheme of REDD+ projects and determining if they are more beneficial to developing countries with high carbon stock; and (iii) comparing the effect difference between the error of referential carbon stocks and the error of actual carbon stocks on emission reduction estimates.
2. Methods
2.1. Estimation Approaches for Emission Reductions under Current Incentive Schemes
This paper assumes a “business-as-usual” (BAU) scenario without any efforts to avoid or reduce emissions related to deforestation and forest degradation to assess the effects of the REDD+ project on emission reductions. With this approach, this paper could obtain the emission reductions by comparing the difference between the referential carbon stocks under BAU scenario and the observed carbon stocks at the end of the assessment period (ΔC).
where CR represent actual carbon stocks at the end of the assessment period, and CB represents the referential carbon stocks under BAU scenario. The parameter C0 represents the initial carbon stocks, and the parameters θR and θB represent the actual variability and the referential carbon stock variability, respectively. Since REDD+ projects may create the incentives to avoid or reduce deforestation and forest degradation, the actual carbon stocks would be equal or greater than the referential carbon stocks, i.e., ΔC ≥ 0. Similarly, due to the incentive scheme, landholders would reduce deforestation or even increase afforestation and reforestation efforts, which could produce actual carbon stock variability being equal or greater than the referential variability, i.e., θR ≥ θB. Consequently, θR and θB have the following relation:
where α represents the incentive coefficient, which reflects the effects of the incentive scheme in REDD+ projects. If the REDD+ project has a positive incentive, which reflects reduced deforestation and forest degradation, then α ≥ 0; if not, then α < 0. By substituting Equation (2) into Equation (1), the emission reductions become:
According to Equation (3), the emission reductions (ΔC) depend on three variables: initial carbon stocks (C0), referential carbon stock variability (θB), and the incentive coefficient (α).
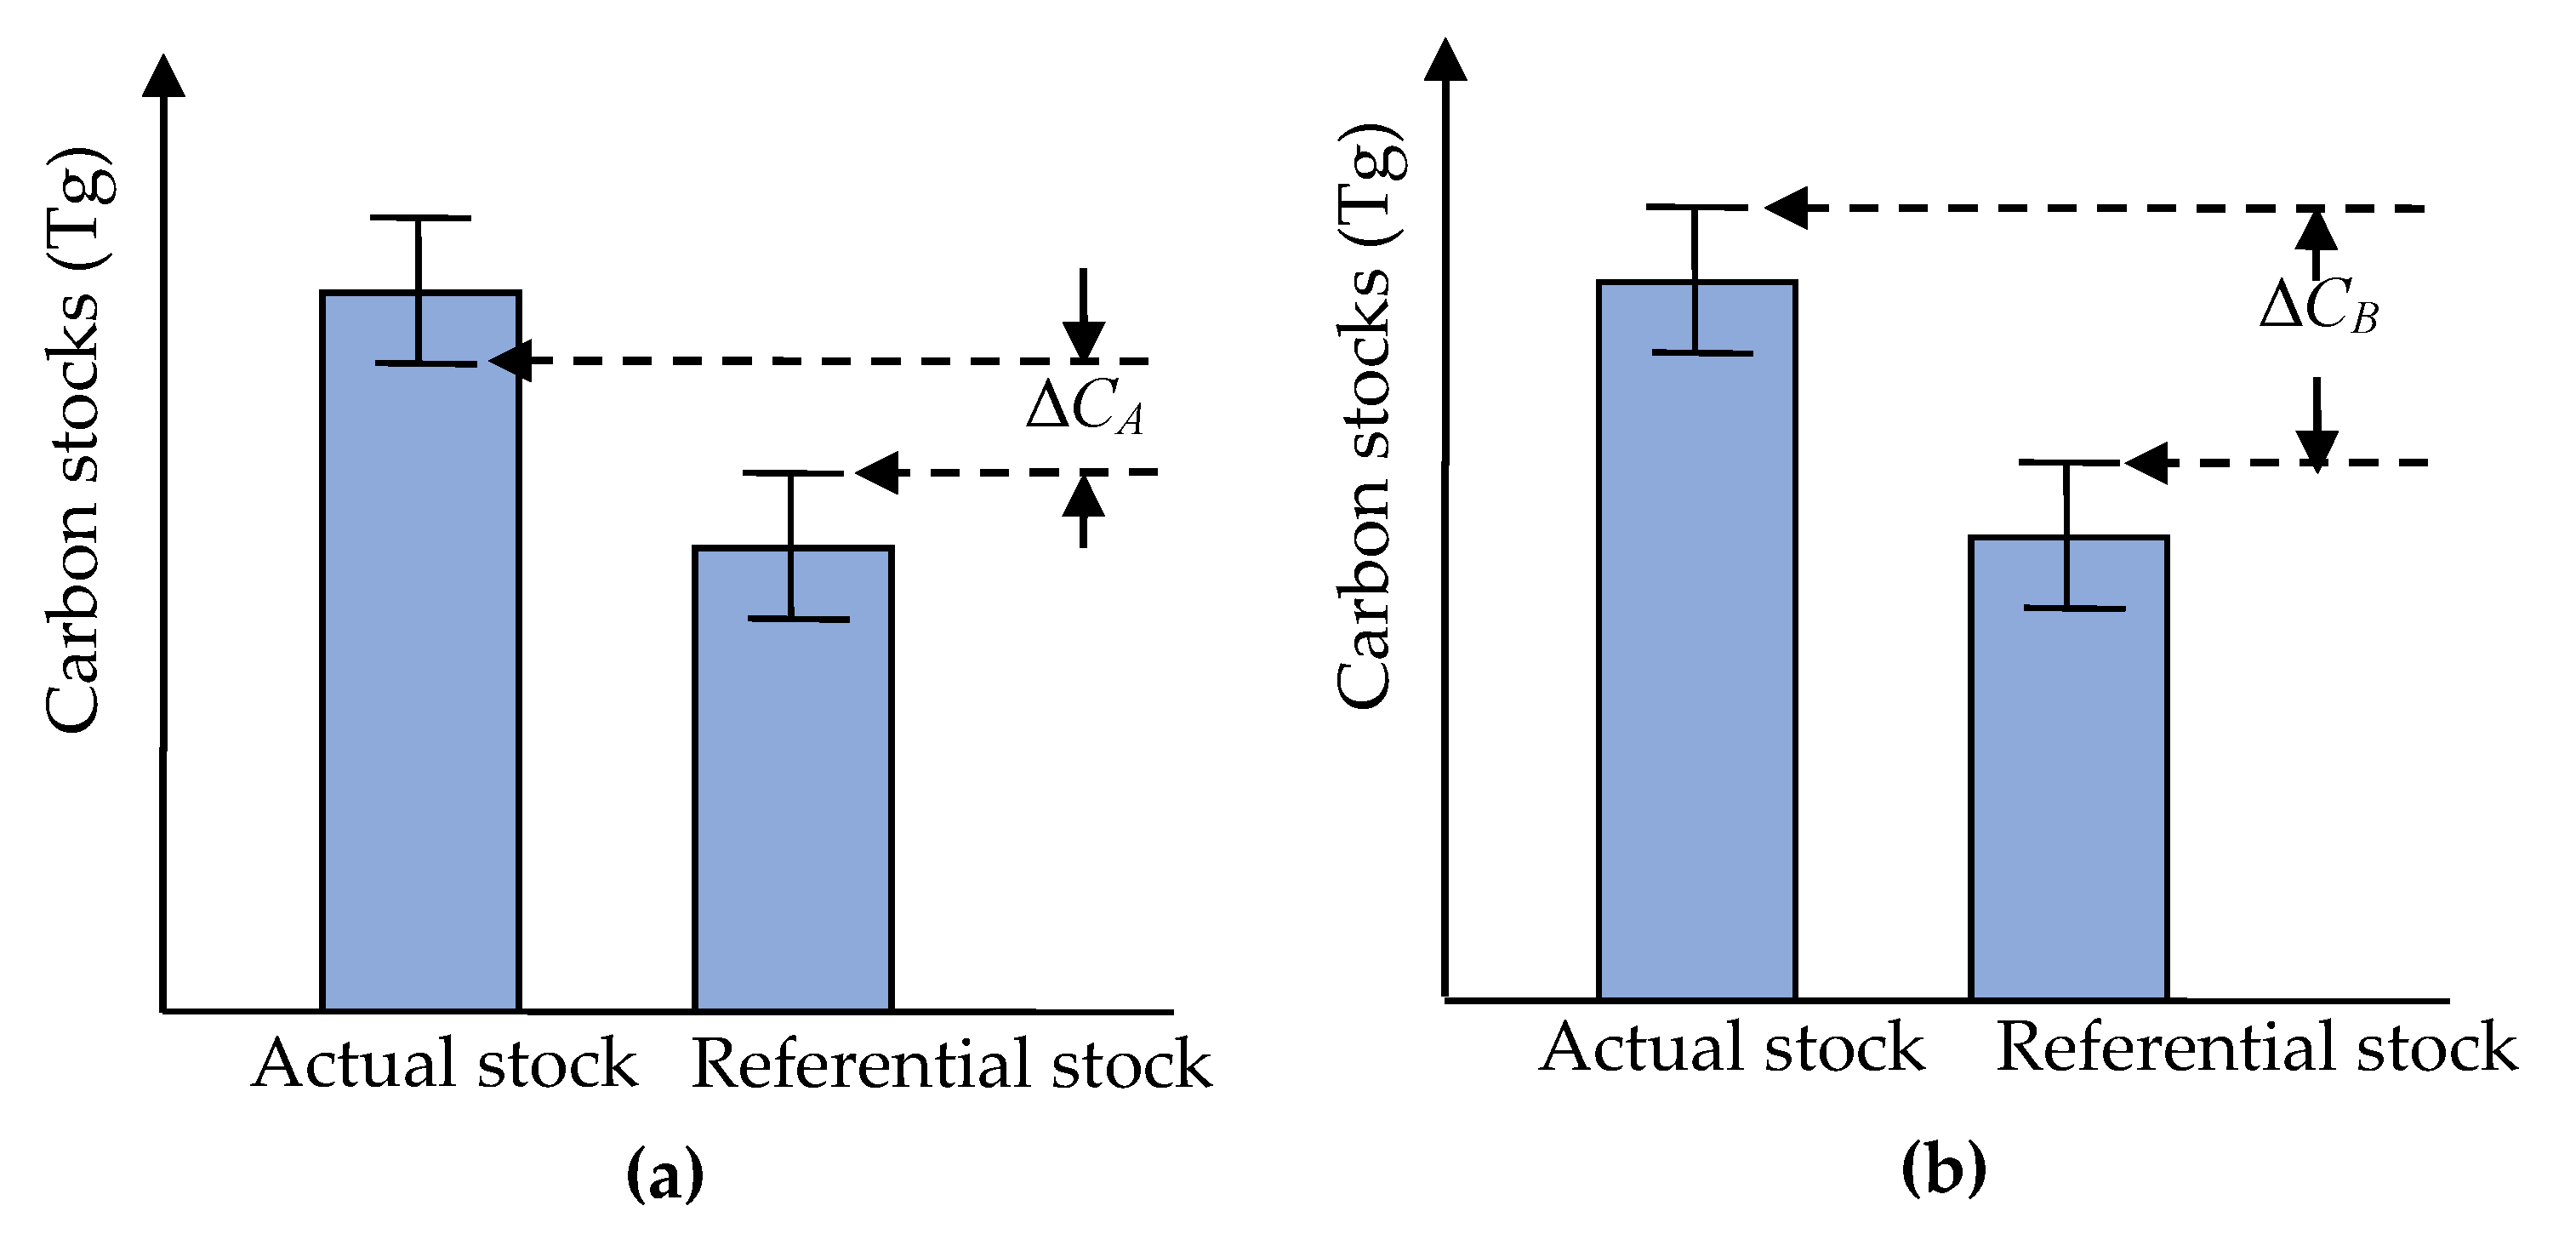
This paper does not take into account the estimated uncertainties in the above calculations of emission reductions. There are two kinds of estimated uncertainties in measuring the emission reductions: the estimated uncertainty of referential carbon stocks and the estimated uncertainty of actual carbon stocks. According to the conservative approach, emission reductions should not be overestimated to ensure the estimation reliability [26]. When the RME method is employed to estimate emission reductions, only the upper error bound of referential carbon stocks is consistent with the conservative principle for estimating uncertainties. Following Plugge and Köhl [32], I established two estimation approaches for emission reductions that consider incentives. Figure 1 depicts these two estimation approaches. Approach A (see Figure 1a) considers both the estimated uncertainty of actual carbon stocks and the estimated uncertainty of referential carbon stocks. Thus, the final emission reduction estimates are the difference between the lower error bound of actual carbon stocks and the upper error bound of referential carbon stocks. Approach B (see Figure 1b) focuses on the estimated uncertainty of referential carbon stocks, and this paper can obtain the emission reduction estimates by calculating the difference between the upper error bound of actual carbon stocks and the upper error bound of referential carbon stocks. Since Approach A is more conservative than Approach B, the estimated emission reductions using Approach A are commonly lower than the estimated emission reductions using Approach B.
To distinguish the two kinds of estimated uncertainties, e1 (e1 ≥ 0) and e2 (e2 ≥ 0) are used to represent the errors of referential and actual carbon stocks, respectively. According to Equation (3), the estimated emission reductions using Approaches A and B are as follows:
where ΔCA and ΔCB represent the estimated emission reductions using Approaches A and B, respectively. According to Equations (4) and (5), the emission reductions (ΔCA and ΔCB) are functions that depend on initial carbon stocks (C0), referential carbon stock variability (θB), incentive coefficient (α), the error of referential carbon stocks (e1), and error of actual carbon stocks (e2). Since the estimated uncertainties may offset the positive incentive effect of REDD+ projects, the emission reductions should be positive to guarantee the incentive scheme plays a role in reducing emissions related to deforestation and forest degradation. Assuming ΔCA = 0 or ΔCB = 0, the minimal incentive coefficient to ensure the successful implementation of REDD+ projects can be obtained as follows:
or
2.2. Simulation Study
A simulation study was conducted to illustrate the effects of two estimated uncertainties on emission reduction estimations and the incentive coefficient. The carbon stock variability between 2010 and 2015 was utilized to establish the baseline and thereby predict the referential carbon stocks at the end of commitment period (i.e., 2020) under the BAU scenario. Correspondingly, this paper regards the carbon stocks in 2015 as the initial carbon stocks.
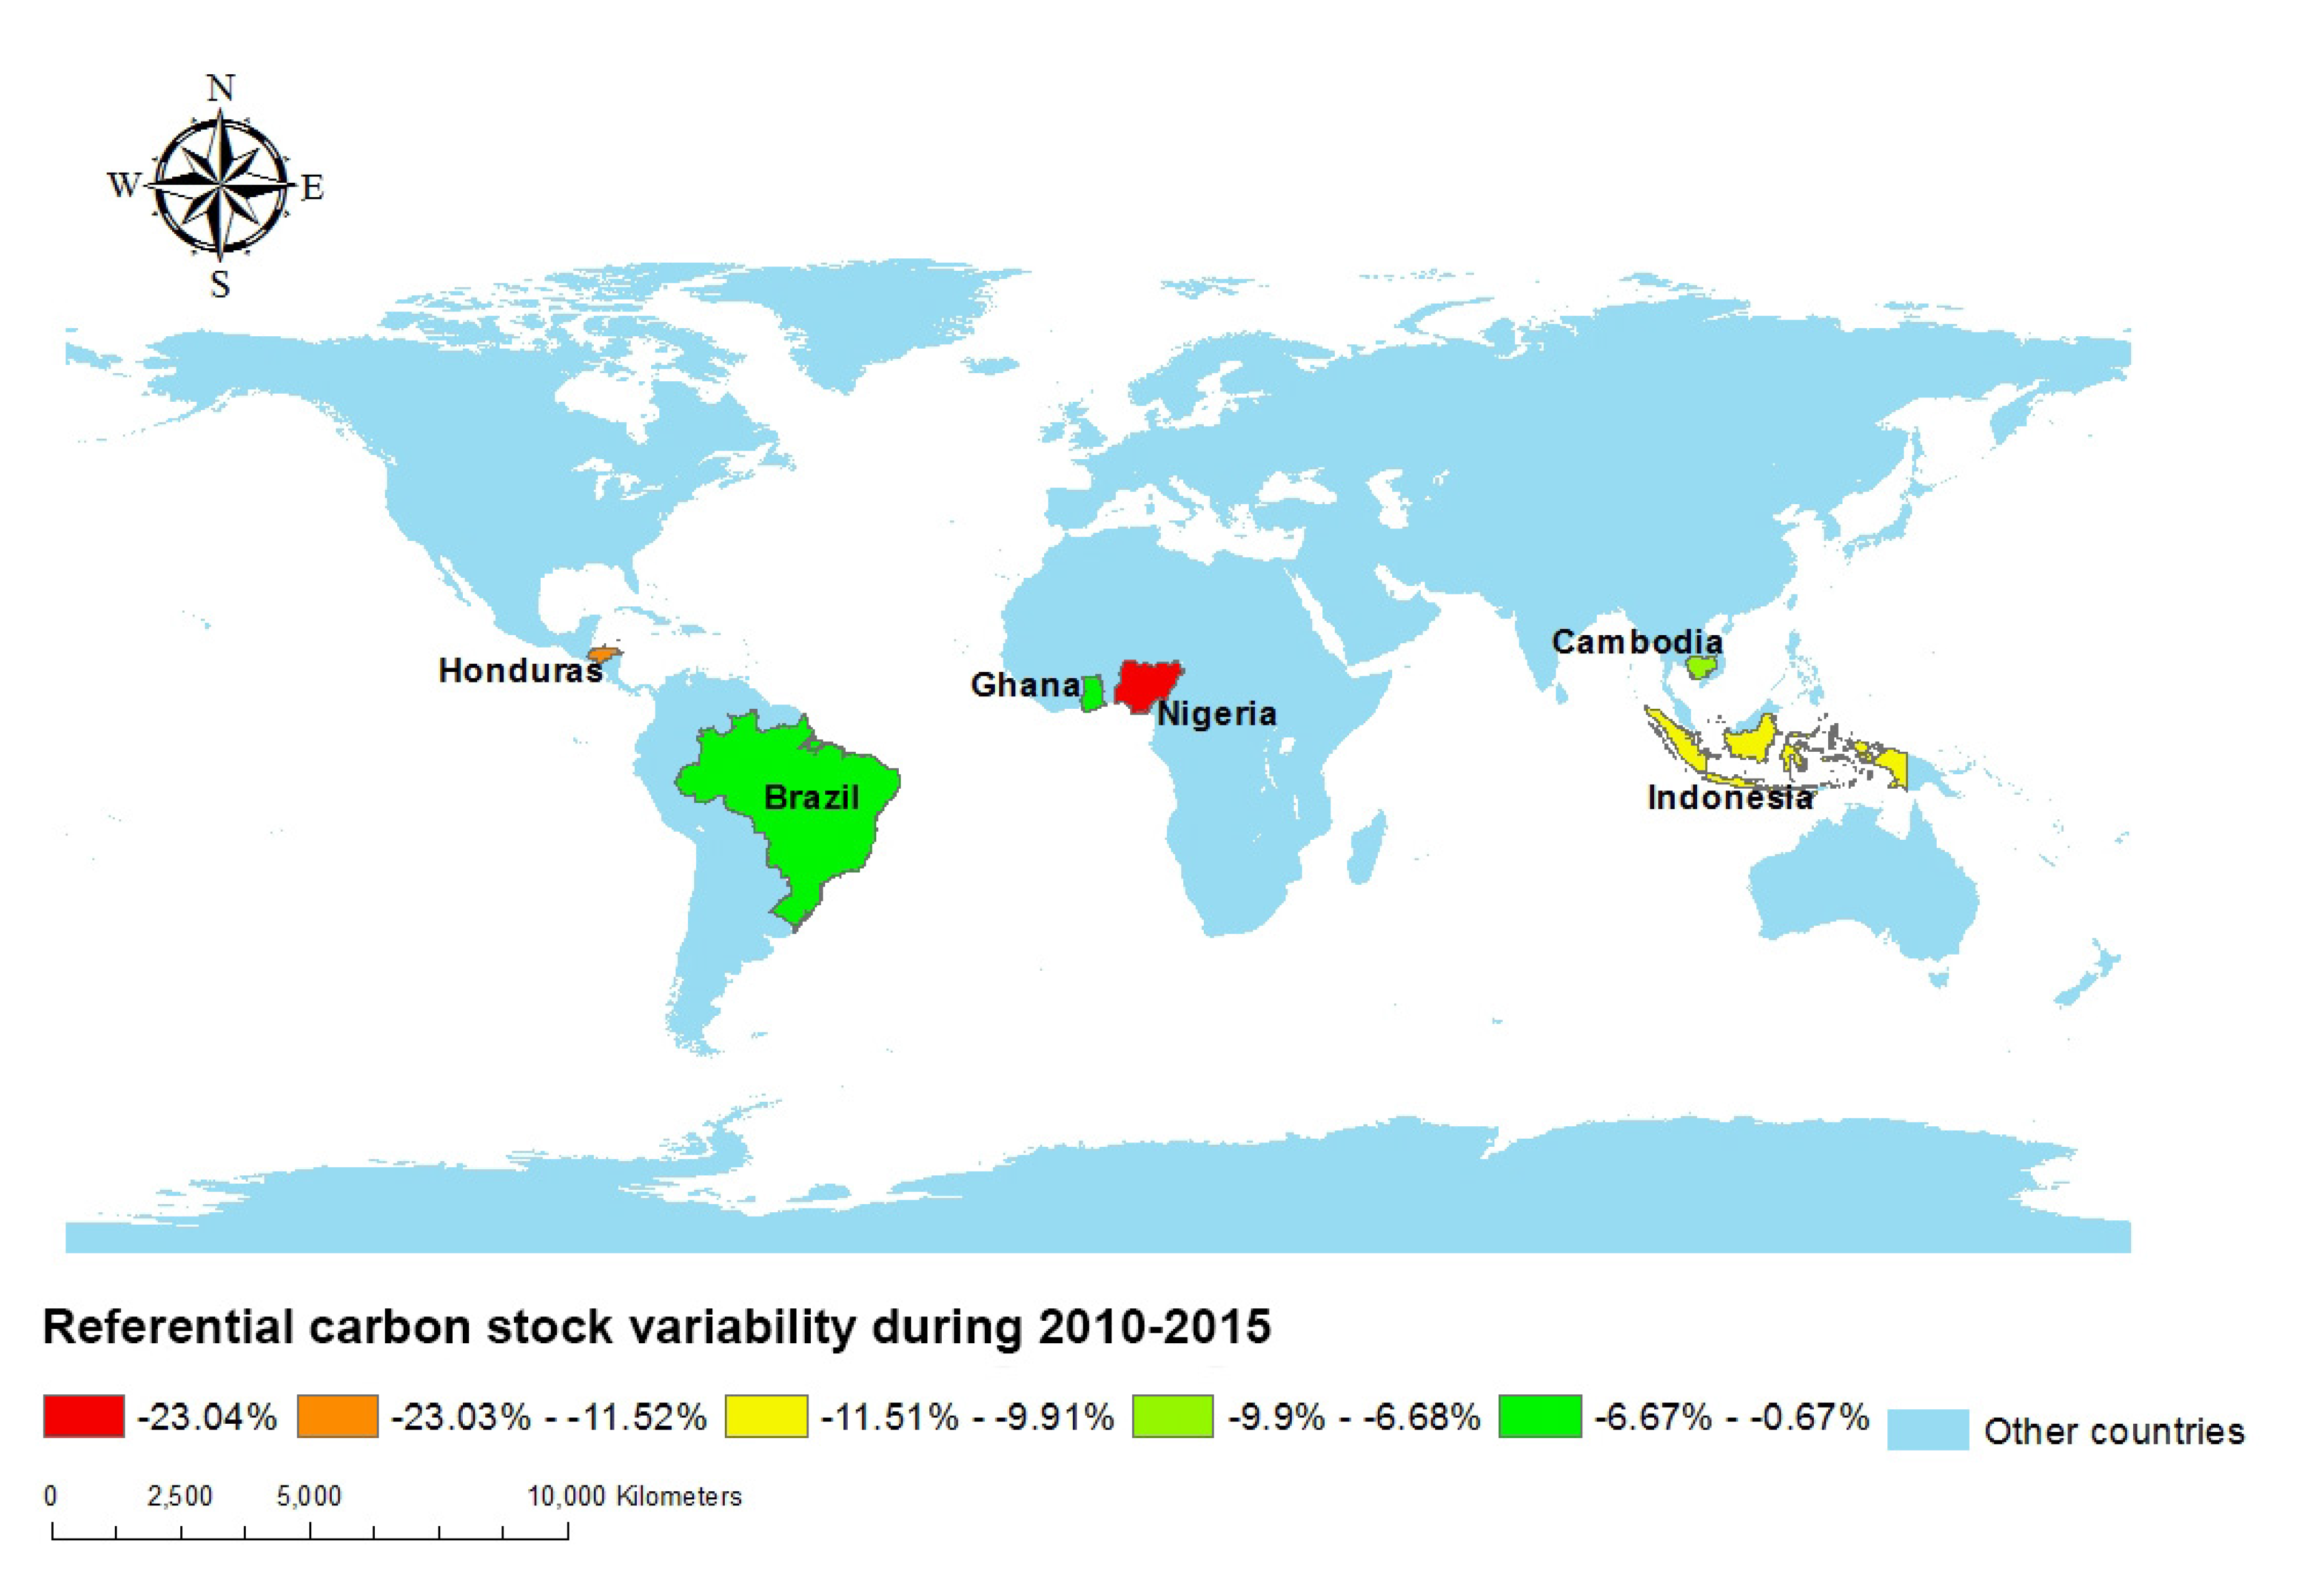
Following Plugge, Baldauf and Köhl [30], this paper selects six tropical developing countries with different carbon stock variability to examine the effects of estimated uncertainties: Nigeria, Honduras, Indonesia, Cambodia, Ghana, and Brazil. These developing countries show high (−23.04%) to low (−0.67%) variabilities of carbon stocks (Figure 2), which can adequately reflect the difference in the effects of estimated uncertainties in the developing countries with different carbon stock variability.
The data on carbon stocks in 2010 and 2015 are available via FAO’s Global Forest Resources Assessment (FRA) [33]. However, country reporting is criticized as inaccurate, and, in some cases, the statistics seem to be made up because they differ so little from period to period [34]. Thus, it is recommended to use the data of carbon stocks from remote sensing from (e.g., Hansen, et al. [35]). However, remote sensing estimates have their shortcomings. The remote sensing-based estimates of net deforestation are usually too small and are not statistically significantly different from zero [36]. Furthermore, it is poor to estimate the values of carbon stocks next to the minimum or maximum of the data range [37]. Although there are no perfect data on carbon stock variability, FRA is still a valid data source for estimating carbon stock variability by using the Tier designations to provide a measure of relative confidence in data at the variable level [38,39]. Thus, the data of FRA are used to set up the referential carbon stock variability (θB) between 2015 and 2020 (the referential period is five years). The corresponding data are shown in Table 1.
The simulation process requires consideration of errors. The current forest inventories showed that the realistic error intervals ranged from 1% to 10% [40]. Thus, the range of error (ei) is assumed as {0%, 1%, 2%, 5%, 10%}, where i = 1, 2 represents the referential level, and the actual level. ei = 0 represents the ideal situation without any errors.
3. Results
3.1. Effects of Estimated Uncertainties on Emission Reductions
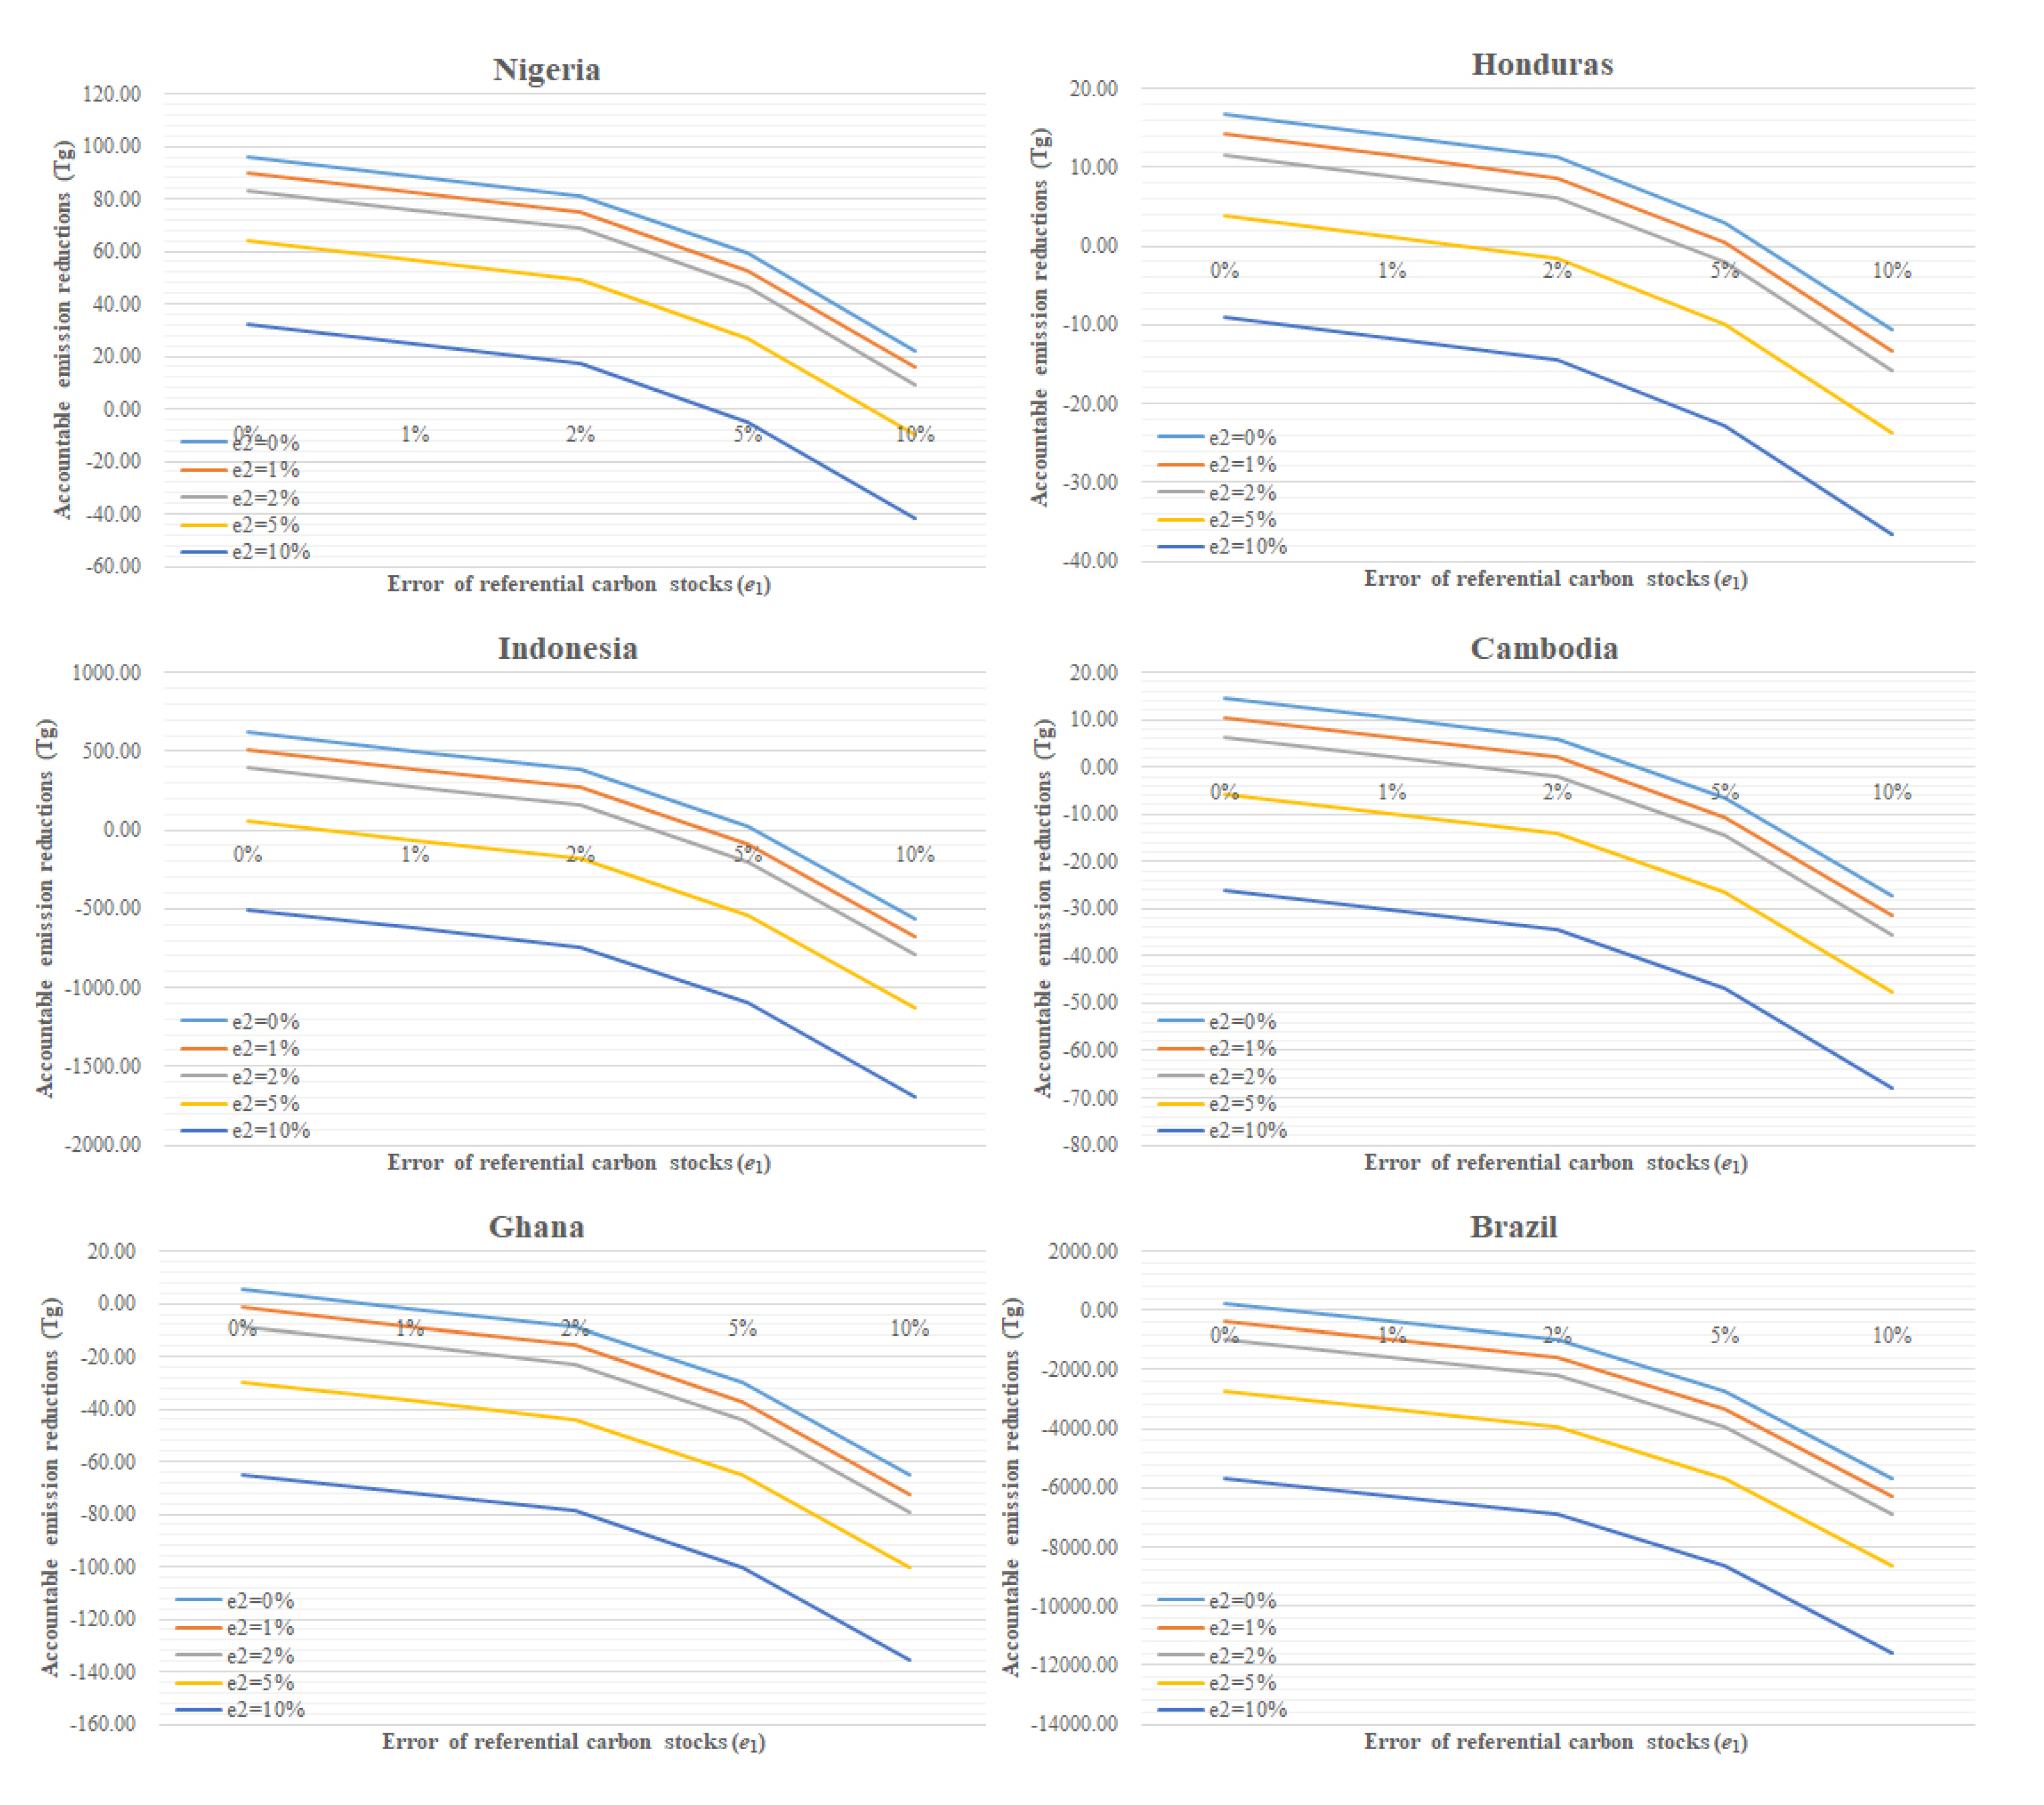
According to Equations (4) and (5), the emission reductions of the selected developing countries in 2020 could be predicted using Approaches A and B in the presence of errors of referential and actual carbon stocks. Following Plugge, Baldauf and Köhl [30], the incentive coefficient is assumed to be 0.5 (α = 0.5); it means the actual carbon stock variability has decreased by 50% compared to the referential variability due to the effects of the incentive schemes to reduce deforestation and forest degradation. The predicted emission reductions using Approaches A and B are shown in Figure 3 and Figure 4, respectively.
The errors of referential carbon stocks (e1) showed negative correlations with the emission reductions (ΔCA), which mean the emission reductions would significantly decrease with increased errors of referential carbon stocks (see Figure 3). The results demonstrated that the larger predicted errors of referential carbon stocks would overestimate the referential carbon stocks, thus resulting in smaller predicted emission reductions. The errors of actual carbon stocks (e2) also had negative correlations with the emission reductions (ΔCA). The increase of e2 would produce underestimates of actual carbon stocks and decreased emission reductions. The negative emission reductions in Figure 3 demonstrate that the uncertainties would overestimate the referential carbon stocks and underestimate the actual carbon stocks, resulting in lower actual carbon stocks compared to the referential carbon stocks.
Developing countries with high carbon stock variability in the reference scenario were less affected by the estimated uncertainties than developing countries with low carbon stock variability (see Figure 3). Nigeria had the maximum carbon stock variability (θB = −23.04%), and its emission reductions were negative only when e1 ≥ 5% and e2 = 10%, or e1 = 10% and e2 ≥ 5%. As a comparison, Brazil had the minimum carbon stock variability (θB = −0.67%), and its emission reductions were positive only when both errors were zero (i.e., e1 = 0% and e2 = 0%). Brazil’s emission reductions would be negative if there were any errors, which suggested that developing countries with low carbon stock variability were more sensitive to errors. The negative emission reductions imply that the increase of the errors would offset the positive incentive effects of REDD+ projects; therefore, reducing the errors of referential and actual carbon stocks could improve the incentive effects.
Comparing the effects of two errors indicated that the predicted emission reductions were more likely to be underestimated due to the error of actual carbon stocks (e2). In Indonesia, for example, the emission reductions were 55.99 Tg when e1 = 5% and e2 = 0%, but the emission reductions were 25.09 Tg when e1 = 0% and e2 = 5%. That means that the error of actual carbon stocks (e2) is more likely to cause underestimated emission reductions than the error of referential carbon stocks (e1).
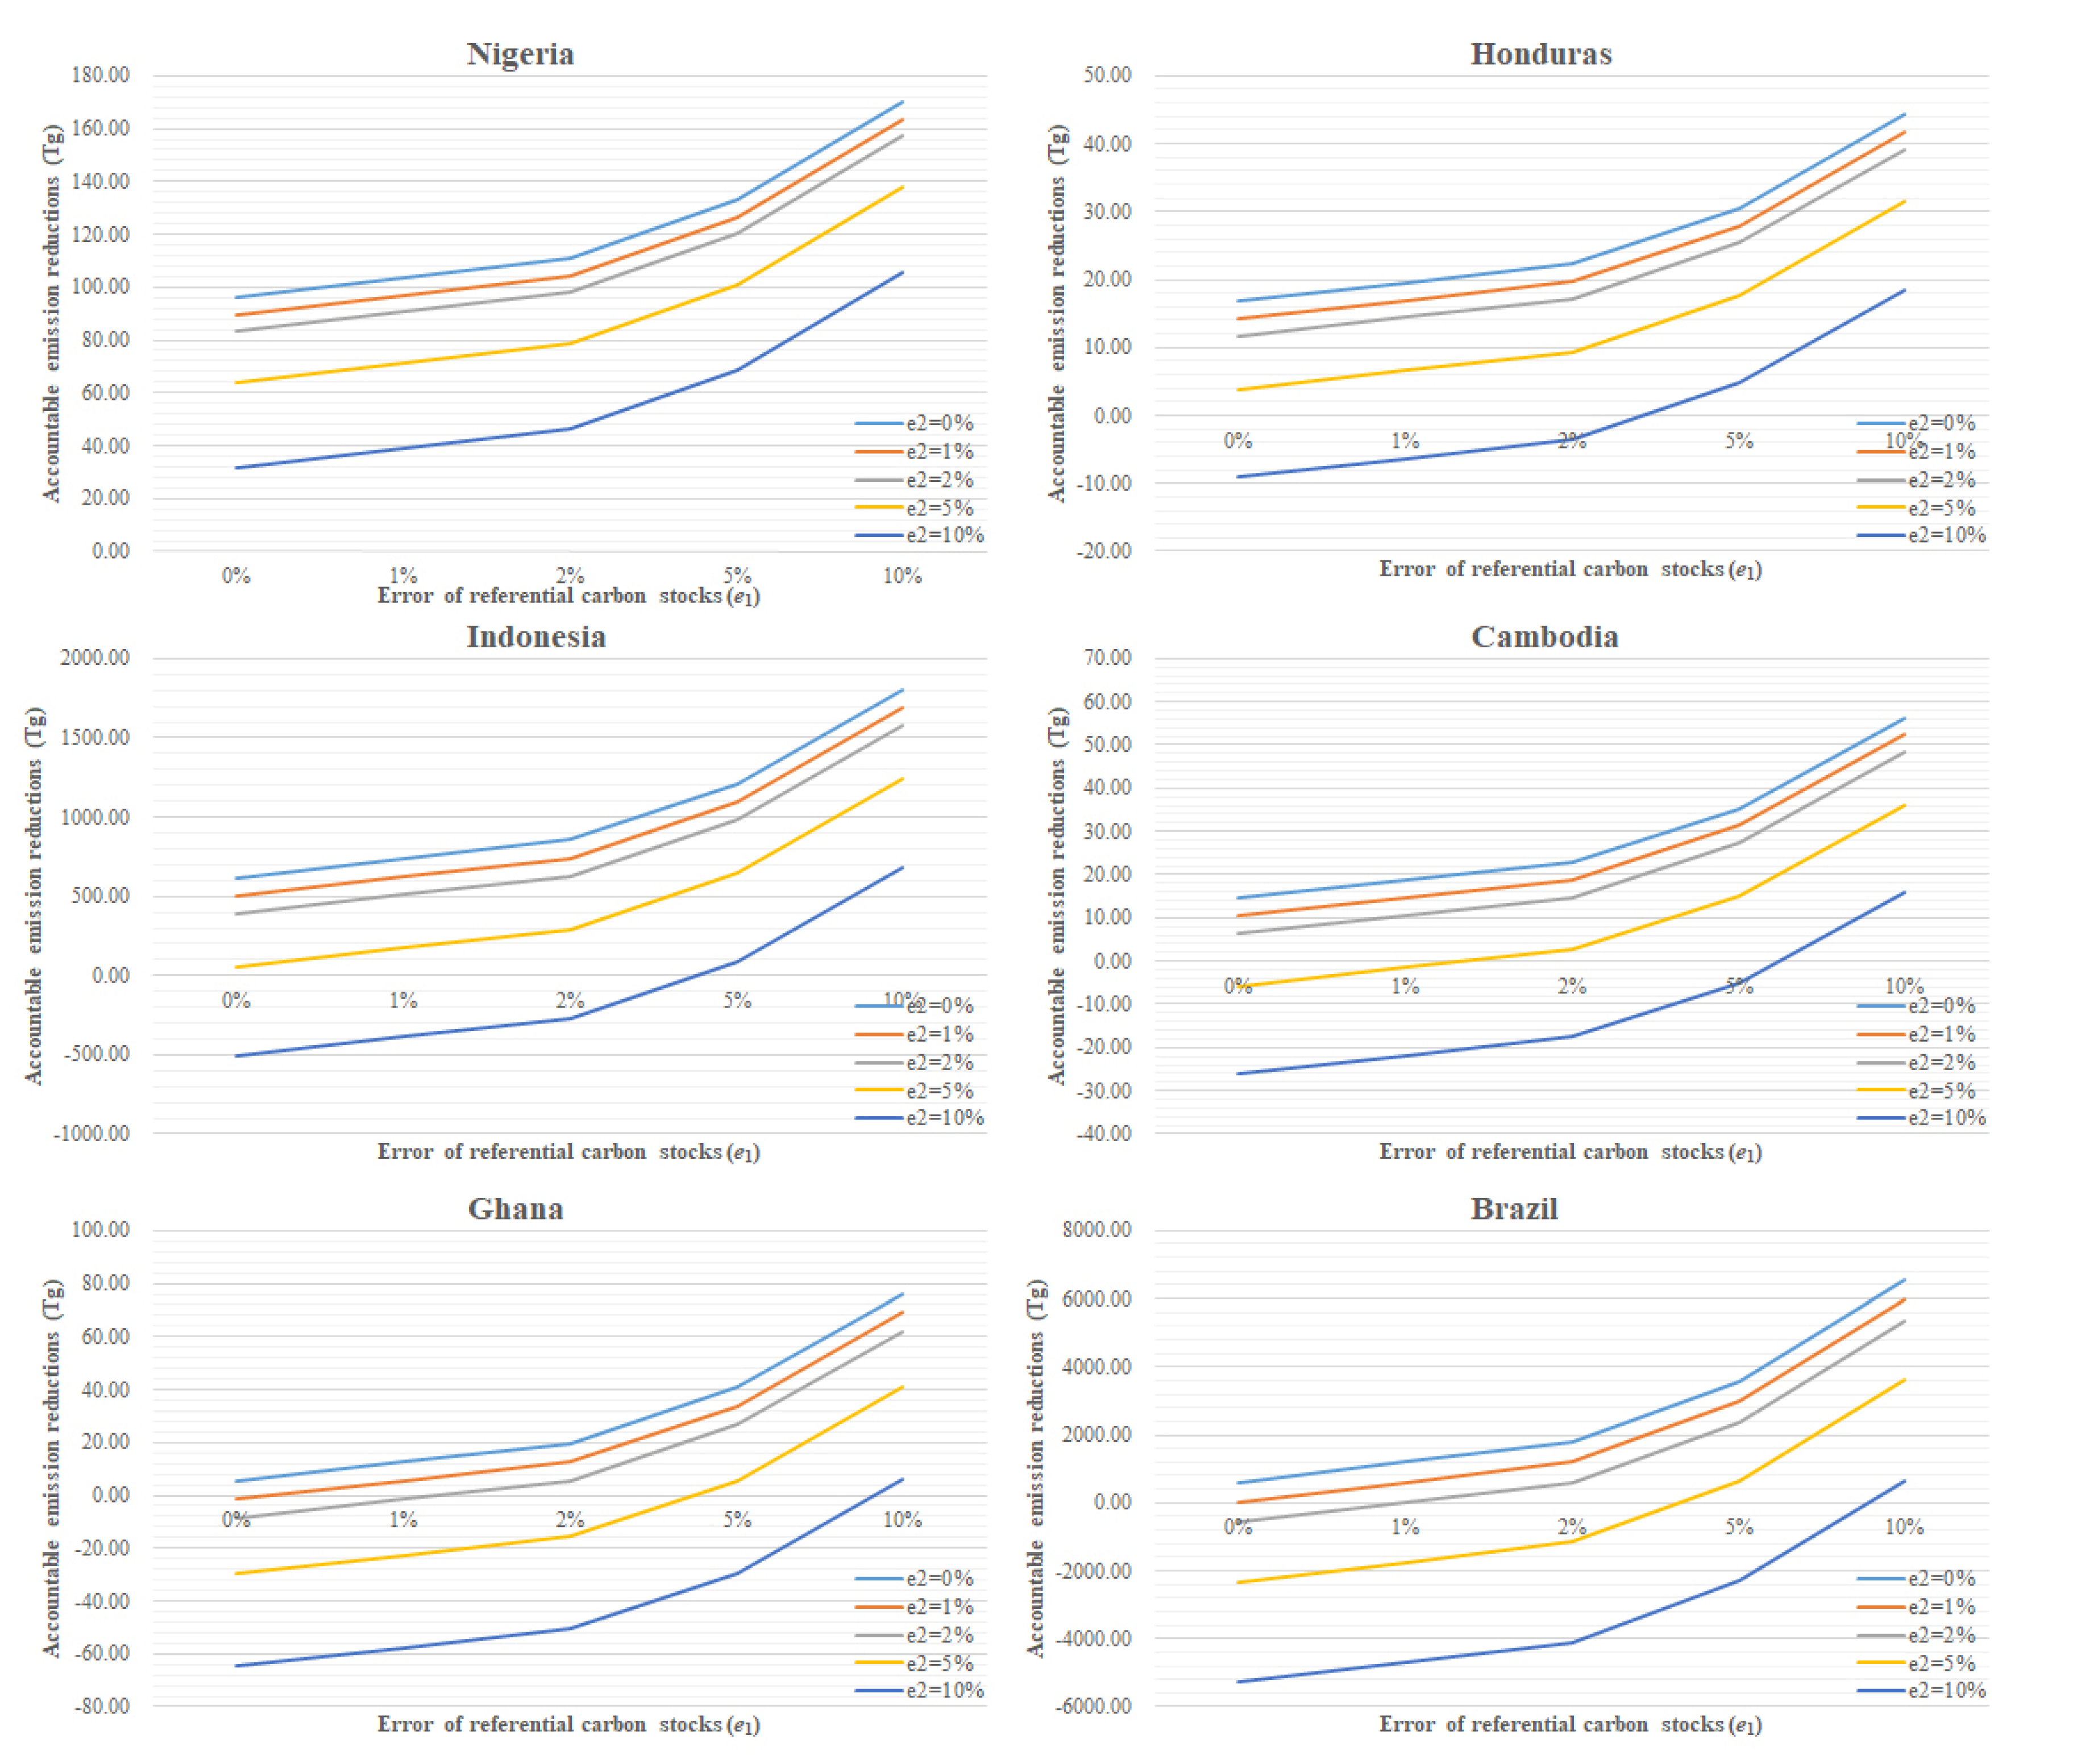
The errors of referential carbon stocks (e1) had a positive correlation with emission reductions (ΔCB), which resulted in increasing ΔCB values with e1 (see Figure 4). However, the errors of actual carbon stocks (e2) displayed a negative correlation with the emission reductions (ΔCB), which suggests ΔCB would decrease with an increase of e2. The results in Figure 4 also implied that reducing e1 or increasing e2 could both improve the incentive effects of REDD+ projects.
Our findings suggested that developing countries with low carbon stock variability were more sensitive to the errors of the referential carbon stock (e1) (see Figure 4). The predicted emission reductions were all positive with any error in Nigeria, which had the maximum carbon stock variability (θB = −23.04%). However, the predicted emission reductions were positive when e1 ≤ 1% and negative when e1 ≥ 2% in Brazil, which has the minimum carbon stock variability (θB = −0.67%). Meanwhile, developing countries with low carbon stock variability fared better with the errors of actual carbon stock (e2). In Brazil, the predicted emission reductions were 6540.97 Tg when e1 = 0% and e2 = 10%, but they were −5283.61 Tg when e1 = 10% and e2 = 0%. By contrast, the predicted emission reductions were 170.08 Tg when e1 = 0% and e2 = 10%, but they were 31.94 Tg when e1 = 10% and e2 = 0% in Nigeria, which had the maximum carbon stock variability. Therefore, developing countries with low carbon stock variability could switch emission reductions from negative to positive by increasing the errors of actual carbon stocks, which is not consistent with reality.
Our results in Figure 4 indicated that the errors of referential carbon stocks (e1) would offset the positive incentive effects of REDD+ projects, while the errors of actual carbon stocks (e2) would enhance the incentive effects. However, the promoting effects of e2 were achieved only by overestimating actual carbon stocks, which is not consistent with the target of reducing emissions from deforestation and forest degradation. Since Approach B only considers the error of referential carbon stocks rather than the error of actual carbon stocks, it will trigger the incentive to increase the error of actual carbon stocks when predicting emission reductions, which does not conform to the original intentions of REDD+ projects. Thus, Approach B will not be used to measure the effects of estimated uncertainties on emission reduction estimations and incentives in this paper. In contrast, Approach A is consistent with the target of REDD+ projects; thus, this approach will be used to measure the effects of estimated uncertainties on incentive coefficient for our analysis. This paper will consider the error of referential carbon stocks and the error of actual carbon stocks when measuring the effects of estimated uncertainties.
3.2. Effects of Estimated Uncertainties on Incentives
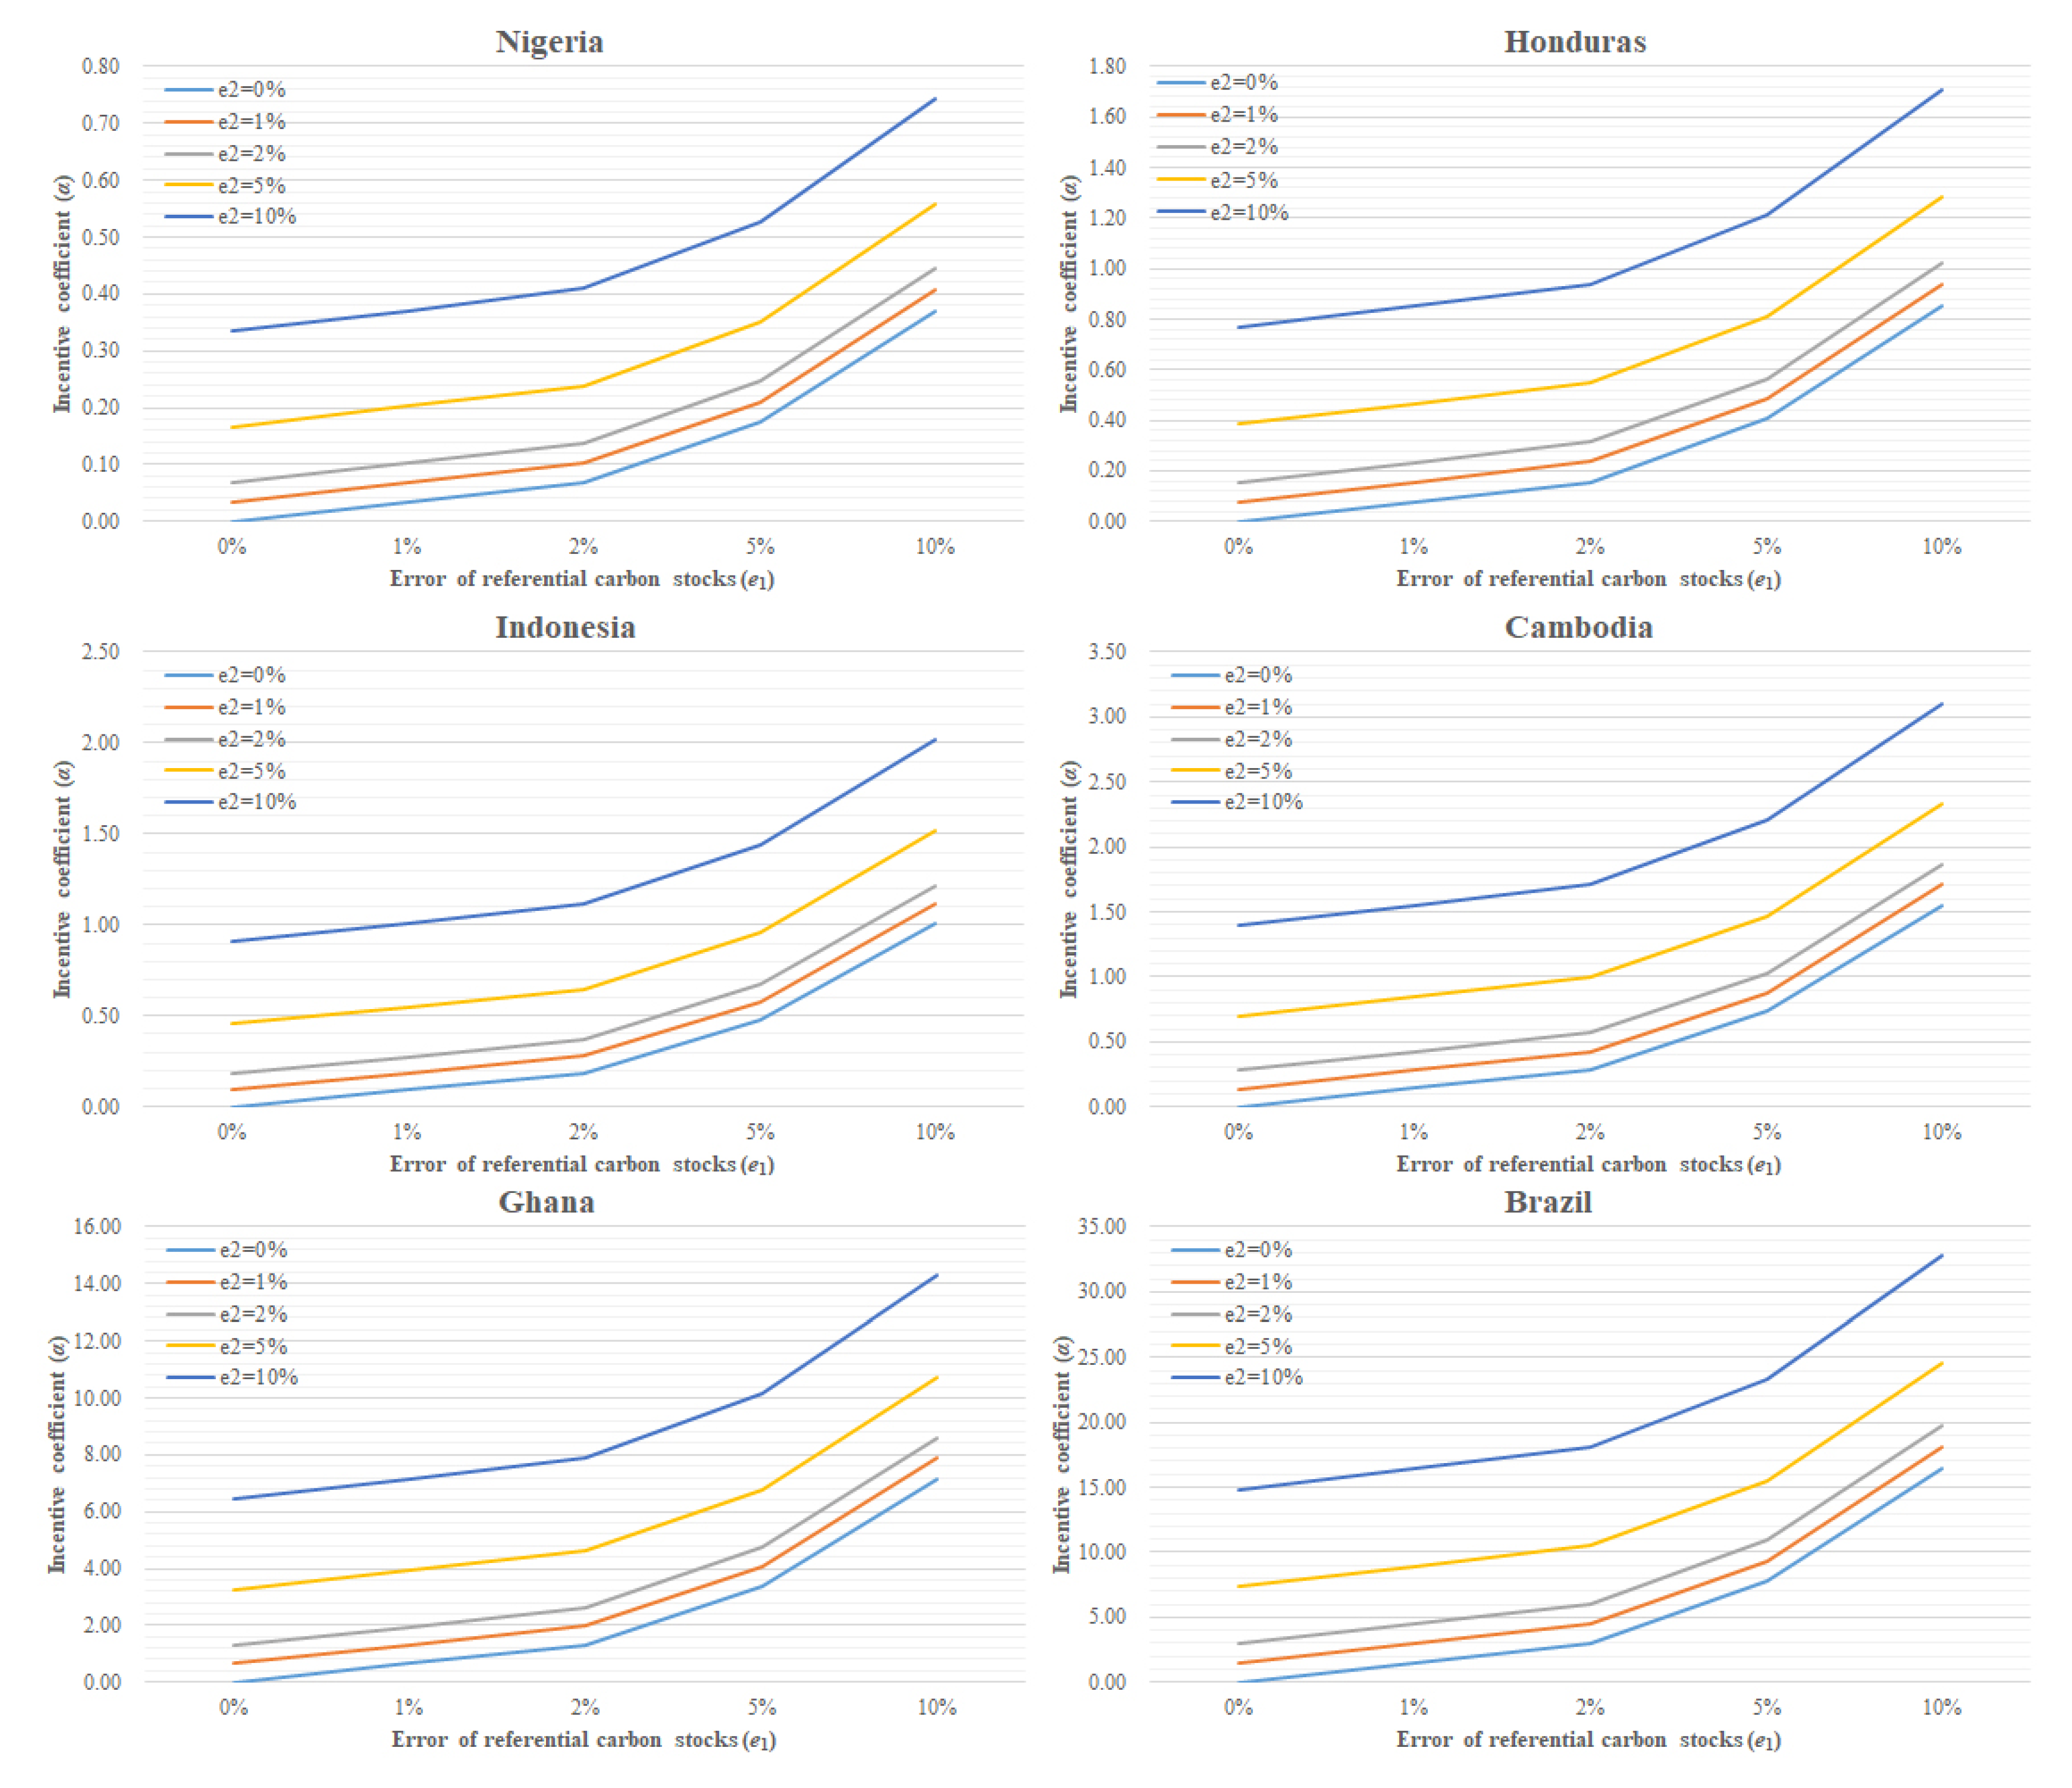
Our findings indicated that using Approach A to predict emission reductions is consistent with the target of REDD+ projects. Thus, the required minimum incentive coefficients to make the emission reductions positive (α) can be obtained using Equation (6). Finally, Approach A is adopted to analyze the sensitivity of incentive coefficient using the data in Table 1. The results are displayed in Figure 5.
The simulation results suggested that the incentive coefficient displayed a tendency to increase with increasing e1 and e2 values in the selected six developing countries, which implied a positive correlation between the errors and incentive coefficients. It demonstrates that the errors of referential and actual carbon stocks can both lead to underestimates of emission reduction values. Thus, with the increase of errors, more incentives would be required to offset the underestimates of emission reductions caused by the errors.
The increase of errors would lead to increasing incentive coefficients, regardless of whether it was the error of referential carbon stocks or the error of actual carbon stocks (see Figure 5). Since it is assumed that the estimated uncertainties may offset the positive incentive effect of REDD+ projects, it is necessary to provide more incentives as the errors increasing to ensure that the carbon emission reductions are greater than zero. Taking Cambodia as an example, the actual carbon stocks could be the same with the referential carbon stocks without any incentives (α = 0) when e1 = 0% and e2 = 0%. However, more incentives are required to ensure the emission reductions are greater than zero with the errors rising. The incentive coefficient became 3.10 when e1 = 10% and e2 = 10%, which suggests that, compared to the scenario without errors, REDD+ projects need to provide 3.10 times the incentive coefficient to play a role in reducing emissions. Thus, reducing errors could significantly reduce the required incentives for REDD+ projects, which can reduce project costs and improve project performance.
By comparing the incentive coefficients of each country, it can be found that the developing countries with low carbon stock variability would require more incentives given the same errors. The required incentive coefficient to achieve reducing emissions (i.e., ΔCA ≥ 0) was smallest in Nigeria (α = 0.74), which has the maximum referential carbon stock variability (θB = −23.04%). By contrast, the required incentive coefficient was largest in Brazil (α = 32.82) with the minimum referential carbon stock variability (θB = −0.67%). When the incentive coefficient was greater than one, a developing country not only needs to prevent or reduce deforestation and forest degradation, but it also needs additional afforestation to achieve emission reductions at the end of the commitment period. Since the developing countries with low carbon stock variability need more incentives with the increase of errors, the estimated uncertainties would implement REDD+ projects more difficult in these developing countries.
The effects of e2 on incentive coefficients (α) are more significant than the effects of e1 in the selected developing countries. Such phenomenon becomes more significant with the errors rising. Take Honduras as an example, the incentive coefficient was 0.85 when e1 = 0% and e2 = 10%, but it was 0.77 when e1 = 10% and e2 = 0%. It suggests that compared to the error of referential carbon stocks, the error of actual carbon stocks is more likely to lead to underestimation of emission reductions, thereby requiring more incentives.
4. Discussion
According to the principle of the reliable minimum estimate, this paper establishes an estimation approach for emission reductions by considering incentives, which could measure the effects of estimated uncertainties on incentives. In fact, the emission reductions depend mainly on the initial carbon stocks, referential carbon stock variability, and the incentive coefficient. The simulation results showed that the prediction of emission reductions should consider the errors of referential and actual carbon stocks. If only the errors of referential carbon stocks are considered, then the incentive of increasing emission reductions would be created by increasing the error of actual carbon stocks, which would be incompatible with the target of establishing a reliable and acceptable MRV system [32].
The simulation results also confirmed that the two estimated uncertainties might lead to an underestimation of emission reductions, thereby reducing the incentive effects of REDD+ projects. With the increase of errors, the required minimum incentive coefficient would also rise to ensure positive emission reduction values. In developing countries with low carbon stock variability, the accountable emission reductions are difficult to obtain with estimated uncertainties. Since the developing countries with low carbon stock variability need more prevention of deforestation and forest degradation, and even additional afforestation to achieve reducing emissions, they often do not benefit from REDD+ projects [30]. By contrast, REDD+ projects tend to have more incentives for developing countries with high carbon stock variability. According to data from the Multi-Partner Trust Fund Office (http://mptf.undp.org/factsheet/fund/) (see Table 2), UN-REDD Program has funded four of the selected developing countries as of the end of October 2016. However, Brazil and Ghana, both of which have low carbon stock variability, have not received any funding from the UN-REDD Program. This evidence also confirms that the incentive scheme of REDD+ projects is more favorable to developing countries with high carbon stock variability, and the estimated uncertainties would make these developing countries more inclined to implement REDD+ projects.
It can be found that the effects of error of actual carbon stocks are more significant by comparing the effect differences of two errors. Thus, the required incentive coefficient would decline more rapidly by reducing the error of actual carbon stocks than by reducing the error of referential carbon stock, which would make implementing REDD+ projects easier. Better estimates of the total uncertainty of emission reductions require reliable data and transparency regarding land use change (LUC), and an adequate method to estimate the error of LUC [14]. Compared with the error of referential carbon stocks, it is easier to determine the error of actual carbon stocks by establishing an accurate MRV system to monitor the change of above-ground biomass [41]. Due to the heterogeneity of national conditions and capabilities, the REDD+ framework is determined to represent a compromise [42]. Thus, there is no international standardized method to determine referential carbon stocks. Moreover, errors of referential carbon stocks have been more difficult to obtain. It is better to reduce the error of actual carbon stocks when estimating emission reductions of REDD+ projects to improve the incentive effects, which is helpful to implement REDD+ projects.
Finally, we note that these results have implications for designing incentive schemes of REDD+ projects in developing countries. This paper has demonstrated that the incentive schemes of REDD+ projects are more favorable to developing countries with high carbon stock variability due to the estimated uncertainties. Therefore, the setting method of referential carbon stocks needs to be improved to provide more equitable incentives for developing countries with high carbon stock variability and low carbon stock variability. Furthermore, since the effects of error of actual carbon stocks are more significant than those of error of referential carbon stocks, developed countries need to provide more financial and technical supports for developing countries to enhance their forest-monitoring capacity [43]. Such measures could help developing countries build and improve their MRV systems, which may reduce errors of actual carbon stocks and increase incentives for implementing REDD+ projects [44].
5. Conclusions
This paper contributes a better understanding of the effects of estimated uncertainties on emission reduction estimations and incentive schemes by simulating the relationship between estimated uncertainties and the incentive coefficient. The types of estimated uncertainties and the effect difference could be identified more readily by introducing two estimation approaches for emission reductions, which could provide a scientific basis for the further implementation of REDD+ projects in the future. The two approaches, based on the RME principle, were used to analyze the effects of estimated uncertainties, which could provide new ideas for estimating the uncertainties in REDD+ projects. Since Approach B was not consistent with the target of establishing a reliable MRV system, only Approach A was used to simulate the effects of estimated uncertainties on the incentive coefficient using data from six developing countries during the period 2010–2015.
This paper makes the following three contributions: (i) establishing two estimation approaches for emission reductions, and simulating the effects of estimated uncertainties by using a series of national data with different variabilities of carbon stocks; (ii) demonstrating that estimating emission reductions should consider the errors of referential and actual carbon stocks, and the error of actual carbon stocks commonly had a more significant effect on emission reduction estimations and the incentive coefficient; and (iii) revealing that the current incentive scheme of REDD+ projects is more beneficial to developing countries with high carbon stock variability, while the developing countries with low carbon stock variability often do not have enough incentives. The above analysis and discussion offer new insight into estimating and predicting emission reductions in developing countries. To easily improve the incentives for developing countries, reducing the error of actual carbon stocks by establishing an accurate MRV system in estimating and predicting the emission reductions should be a priority in the future designs of REDD+ projects. The incentives for developing countries with low carbon stock variability should also be increased by improving the setting method of referential carbon stocks to follow the “3E” criteria proposed by Angelsen [45], namely carbon effective, cost efficiency, and equity. Such policy intervention could ensure that developing countries with different carbon stock variabilities can receive equitable incentives.
However, some limitations in this paper need to be acknowledged. The findings rely mostly on theoretical analysis, and have not yet been used for practice. Thus, this paper has not examined the practical value. Moreover, this paper has not fully considered some reporting standards adopted internationally, such as the emission factors and area change in IPCC Good Practice Guidance [27].
Acknowledgments
The authors are grateful to the financial support provided by the National Natural Science Foundation of China (Nos. 71774088, 71303123, 91546117 and 71373131), Philosophy and Social Science Foundation for Colleges and Universities in Jiangsu Province (2016SJB630014), Opening Foundation of Institute for History of Science and Technology, NUIST (2016KJSKT015), Key Project of National Social and Scientific Fund Program (16ZDA047), and National Industry-specific Topics (GYHY 201506051). This paper is also funded by the Qing Lan Project and the Top-notch Academic Programs Project of Jiangsu Higher Education Institutions (TAPP).
Author Contributions
Jichuan Sheng contributed to study design, data collection, and writing the manuscript.
Conflicts of Interest
The author declares no conflict of interest.
References
- Van der Werf, G.R.; Morton, D.C.; DeFries, R.S.; Olivier, J.G.J.; Kasibhatla, P.S.; Jackson, R.B.; Collatz, G.J.; Randerson, J.T. CO2 emissions from forest loss. Nat. Geosci. 2009, 2, 737–738. [Google Scholar] [CrossRef]
- Stern, N. The Economics of Climate Change: The Stern Review; Cambridge University Press: Cambridge, UK, 2007. [Google Scholar]
- Agrawal, A.; Nepstad, D.; Chhatre, A. Reducing emissions from deforestation and forest degradation. Annu. Rev. Environ. Resour. 2011, 36, 373–396. [Google Scholar] [CrossRef]
- Mukul, S.A.; Herbohn, J.; Firn, J. Co-benefits of biodiversity and carbon sequestration from regenerating secondary forests in the Philippine uplands: Implications for forest landscape restoration. Biotropica 2016, 48, 882–889. [Google Scholar] [CrossRef]
- Mukul, S.A.; Herbohn, J.; Firn, J. Tropical secondary forests regenerating after shifting cultivation in the Philippines uplands are important carbon sinks. Sci. Rep. 2016, 6, 22483. [Google Scholar] [CrossRef] [PubMed]
- Pelletier, J.; Goetz, S.J. Baseline data on forest loss and associated uncertainty: Advances in national forest monitoring. Environ. Res. Lett. 2015, 10, 021001. [Google Scholar] [CrossRef]
- Birdsey, R.; Angeles-Perez, G.; Kurz, W.A.; Lister, A.; Olguin, M.; Pan, Y.; Wayson, C.; Wilson, B.; Johnson, K. Approaches to monitoring changes in carbon stocks for REDD+. Carbon Manag. 2013, 4, 519–537. [Google Scholar] [CrossRef]
- Herold, M.; Skutsch, M. Monitoring, reporting and verification for national REDD+ programmes: Two proposals. Environ. Res. Lett. 2011, 6, 014002. [Google Scholar] [CrossRef]
- Pelletier, J.; Martin, D.; Potvin, C. REDD+ emissions estimation and reporting: Dealing with uncertainty. Environ. Res. Lett. 2013, 8, 034009. [Google Scholar] [CrossRef]
- United Nations Framework Convention on Climate Change (UNFCCC). Report of the Conference of the Parties on Its Sixteenth Session, Held in Cancun from 29 November to 10 December 2010. Part Two: Action Taken by the Conference of the Parties at Its Sixteenth Session. Decisions Adopted by the Conference of the Parties; UNFCCC: Bonn, Germany, 2011. [Google Scholar]
- Pelletier, J.; Ramankutty, N.; Potvin, C. Diagnosing the uncertainty and detectability of emission reductions for REDD+ under current capabilities: An example for Panama. Environ. Res. Lett. 2011, 6, 024005. [Google Scholar] [CrossRef]
- Romijn, E.; Herold, M.; Kooistra, L.; Murdiyarso, D.; Verchot, L. Assessing capacities of non-Annex I countries for national forest monitoring in the context of REDD+. Environ. Sci. Policy 2012, 19–20, 33–48. [Google Scholar] [CrossRef]
- Canadell, J.G.; Ciais, P.; Dhakal, S.; Dolman, H.; Friedlingstein, P.; Gurney, K.R.; Held, A.; Jackson, R.B.; Le Quere, C.; Malone, E.L. Interactions of the carbon cycle, human activity, and the climate system: A research portfolio. Curr. Opin. Environ. Sustain. 2010, 2, 301–311. [Google Scholar] [CrossRef]
- Pelletier, J.; Busch, J.; Potvin, C. Addressing uncertainty upstream or downstream of accounting for emissions reductions from deforestation and forest degradation. Clim. Chang. 2015, 130, 635–648. [Google Scholar] [CrossRef]
- Olofsson, P.; Foody, G.M.; Stehman, S.V.; Woodcock, C.E. Making better use of accuracy data in land change studies: Estimating accuracy and area and quantifying uncertainty using stratified estimation. Remote Sens. Environ. 2013, 129, 122–131. [Google Scholar] [CrossRef]
- Gibbs, H.K.; Brown, S.; Niles, J.O.; Foley, J.A. Monitoring and estimating tropical forest carbon stocks: Making REDD a reality. Environ. Res. Lett. 2007, 2, 045023. [Google Scholar] [CrossRef]
- Joseph, S.; Murthy, M.; Thomas, A. The progress on remote sensing technology in identifying tropical forest degradation: A synthesis of the present knowledge and future perspectives. Environ. Earth Sci. 2011, 64, 731–741. [Google Scholar] [CrossRef]
- Goetz, S.; Dubayah, R. Advances in remote sensing technology and implications for measuring and monitoring forest carbon stocks and change. Carbon Manag. 2011, 2, 231–244. [Google Scholar] [CrossRef]
- De Sy, V.; Herold, M.; Achard, F.; Asner, G.P.; Held, A.; Kellndorfer, J.; Verbesselt, J. Synergies of multiple remote sensing data sources for REDD+ monitoring. Curr. Opin. Environ. Sustain. 2012, 4, 696–706. [Google Scholar] [CrossRef]
- Bottcher, H.; Eisbrenner, K.; Fritz, S.; Kindermann, G.; Kraxner, F.; McCallum, I.; Obersteiner, M. An assessment of monitoring requirements and costs of ‘Reduced Emissions from Deforestation and Degradation’. Carbon Balance Manag. 2009, 4, 7. [Google Scholar] [CrossRef] [PubMed] [Green Version]
- Pratihast, A.K.; Herold, M.; de Sy, V.; Murdiyarso, D.; Skutsch, M. Linking community-based and national REDD+ monitoring: A review of the potential. Carbon Manag. 2013, 4, 91–104. [Google Scholar] [CrossRef]
- Sunderlin, W.D.; Ekaputri, A.D.; Sills, E.O.; Duchelle, A.E.; Kweka, D.; Diprose, R.; Doggart, N.; Ball, S.; Lima, R.; Enright, A. The Challenge of Establishing REDD+ on the Ground: Insights from 23 Subnational Initiatives in Six Countries; CIFOR: Bogor, Indonesia, 2014; Volume 104. [Google Scholar]
- Bucki, M.; Cuypers, D.; Mayaux, P.; Achard, F.; Estreguil, C.; Grassi, G. Assessing REDD+ performance of countries with low monitoring capacities: The matrix approach. Environ. Res. Lett. 2012, 7, 014031. [Google Scholar] [CrossRef]
- Lusiana, B.; Van Noordwijk, M.; Johana, F.; Galudra, G.; Suyanto, S.; Cadisch, G. Implications of uncertainty and scale in carbon emission estimates on locally appropriate designs to reduce emissions from deforestation and degradation (REDD+). Mitig. Adapt. Strateg. Glob. Chang. 2014, 19, 757–772. [Google Scholar] [CrossRef]
- Engel, S.; Palmer, C.; Taschini, L.; Urech, S. Conservation payments under uncertainty. Land Econ. 2015, 91, 36–56. [Google Scholar] [CrossRef]
- Grassi, G.; Monni, S.; Federici, S.; Achard, F.; Mollicone, D. Applying the conservativeness principle to REDD to deal with the uncertainties of the estimates. Environ. Res. Lett. 2008, 3, 035005. [Google Scholar] [CrossRef]
- Penman, J.; Gytarsky, M.; Hiraishi, T.; Krug, T.; Kruger, D.; Pipatti, R.; Buendia, L.; Miwa, K.; Ngara, T.; Tanabe, K.; et al. Good Practice Guidance for Land Use, Land-Use Change and Forestry; Institute for Global Environmental Strategies: Hayama, Kanagawa, Japan, 2003. [Google Scholar]
- Kohl, M.; Baldauf, T.; Plugge, D.; Krug, J. Reduced emissions from deforestation and forest degradation (REDD): A climate change mitigation strategy on a critical track. Carbon Balance Manag. 2009, 4, 10. [Google Scholar] [CrossRef] [PubMed]
- Marland, E.; Cantrell, J.; Kiser, K.; Marland, G.; Shirley, K. Valuing uncertainty part I: The impact of uncertainty in GHG accounting. Carbon Manag. 2014, 5, 35–42. [Google Scholar] [CrossRef]
- Plugge, D.; Baldauf, T.; Köhl, M. The global climate change mitigation strategy REDD: Monitoring costs and uncertainties jeopardize economic benefits. Clim. Chang. 2013, 119, 247–259. [Google Scholar] [CrossRef]
- United Nations Framework Convention on Climate Change (UNFCCC). Reducing Emissions from Deforestation in Developing Countries: Approaches to Stimulate Action. Draft Conclusions Proposed by the Chair; UNFCCC: Bonn, Germany, 2008. [Google Scholar]
- Plugge, D.; Köhl, M. Estimating carbon emissions from forest degradation: Implications of uncertainties and area sizes for a REDD+ MRV system. Can. J. For. Res. 2012, 42, 1996–2010. [Google Scholar] [CrossRef]
- Food and Agriculture Organization (FAO). Global Forest Resources Assessment 2015; Food and Agriculture Organization of the United Nations: Rome, Italy, 2015. [Google Scholar]
- Matthews, E. Understanding the FRA 2000. Oceania 2001, 88, 129. [Google Scholar]
- Hansen, M.C.; Potapov, P.V.; Moore, R.; Hancher, M.; Turubanova, S.; Tyukavina, A.; Thau, D.; Stehman, S.; Goetz, S.; Loveland, T. High-resolution global maps of 21st-century forest cover change. Science 2013, 342, 850–853. [Google Scholar] [CrossRef] [PubMed]
- McRoberts, R.E.; Walters, B.F. Statistical inference for remote sensing-based estimates of net deforestation. Remote Sens. Environ. 2012, 124, 394–401. [Google Scholar] [CrossRef]
- Immitzer, M.; Stepper, C.; Böck, S.; Straub, C.; Atzberger, C. Use of WorldView-2 stereo imagery and National Forest Inventory data for wall-to-wall mapping of growing stock. For. Ecol. Manag. 2016, 359, 232–246. [Google Scholar] [CrossRef]
- MacDicken, K.G. Global forest resources assessment 2015: What, why and how? For. Ecol. Manag. 2015, 352, 3–8. [Google Scholar] [CrossRef]
- Sheng, J.; Han, X.; Zhou, H.; Miao, Z. Effects of corruption on performance: Evidence from the UN-REDD Programme. Land Use Policy 2016, 59, 344–350. [Google Scholar] [CrossRef]
- Scott, C.T.; Köhl, M. Sampling with partial replacement and stratification. For. Sci. 1994, 40, 30–46. [Google Scholar]
- Vargas, R.; Paz, F.; de Jong, B. Quantification of forest degradation and belowground carbon dynamics: Ongoing challenges for monitoring, reporting and verification activities for REDD+. Carbon Manag. 2013, 4, 579–582. [Google Scholar] [CrossRef]
- Hargita, Y.; Günter, S.; Köthke, M. Brazil submitted the first REDD+ reference level to the UNFCCC-Implications regarding climate effectiveness and cost-efficiency. Land Use Policy 2016, 55, 340–347. [Google Scholar] [CrossRef]
- Dunlop, T.; Corbera, E. Incentivizing REDD+: How developing countries are laying the groundwork for benefit-sharing. Environ. Sci. Policy 2016, 63, 44–54. [Google Scholar] [CrossRef]
- Blais-McPherson, M.; Rudiak-Gould, P. Strengthening inter-disciplinary and inter-ideological collaboration on REDD: A cultural theory approach. Glob. Environ. Chang. 2017, 42, 13–23. [Google Scholar] [CrossRef]
- Angelsen, A. Moving ahead with REDD: Issues, Options and Implications; Cifor: Bogor, Indonesia, 2008. [Google Scholar]
Figure 1.
Estimation approaches of emission reductions; (a) Emission reduction estimation by using Approach A; (b) Emission reduction estimation by using Approach B.
Figure 1.
Estimation approaches of emission reductions; (a) Emission reduction estimation by using Approach A; (b) Emission reduction estimation by using Approach B.

Figure 2.
Referential carbon stock variability during 2010–2015 (source: Food and Agriculture Organization of the United Nations (FAO) [33]).
Figure 2.
Referential carbon stock variability during 2010–2015 (source: Food and Agriculture Organization of the United Nations (FAO) [33]).

Figure 3.
Accountable emission reductions by using Approach A.

Figure 4.
Accountable emission reductions by using Approach B.

Figure 5.
Incentive coefficient by using Approach A.


Table 1.
Data of carbon stock during 2010–2015.
| Country | Carbon Stock (Tg) | Carbon Stock Change (Tg) | Referential Carbon Stock Variability θB (%) | |
|---|---|---|---|---|
| 2010 | 2015 | |||
| Nigeria | 1085 | 835 | −250 | −23.04% |
| Honduras | 330 | 292 | −38 | −11.52% |
| Indonesia | 13849 | 12477 | −1372 | −9.91% |
| Cambodia | 464 | 433 | −31 | −6.68% |
| Ghana | 723.66 | 712.61 | −11.05 | −1.53% |
| Brazil | 59622.71 | 59221.75 | −400.96 | −0.67% |
Source: FAO [33].
Table 2.
The REDD+ funds from UN-REDD Program.
| Country | Referential Carbon Stock Variability θB (%) | Approved Budget (US$) |
|---|---|---|
| Nigeria | −23.04% | 4000000 |
| Honduras | −11.52% | 3609645 |
| Indonesia | −9.91% | 5644250 |
| Cambodia | −6.68% | 3001350 |
| Ghana | −1.53% | 0 |
| Brazil | −0.67% | 0 |
Source: Multi-Partner Trust Fund Office (http://mptf.undp.org/factsheet/fund/).
© 2017 by the author. Licensee MDPI, Basel, Switzerland. This article is an open access article distributed under the terms and conditions of the Creative Commons Attribution (CC BY) license (http://creativecommons.org/licenses/by/4.0/).
Share and Cite
MDPI and ACS Style
Sheng, J. Effect of Uncertainties in Estimated Carbon Reduction from Deforestation and Forest Degradation on Required Incentive Payments in Developing Countries. Sustainability 2017, 9, 1608. https://doi.org/10.3390/su9091608
AMA Style
Sheng J. Effect of Uncertainties in Estimated Carbon Reduction from Deforestation and Forest Degradation on Required Incentive Payments in Developing Countries. Sustainability. 2017; 9(9):1608. https://doi.org/10.3390/su9091608
Chicago/Turabian StyleSheng, Jichuan. 2017. "Effect of Uncertainties in Estimated Carbon Reduction from Deforestation and Forest Degradation on Required Incentive Payments in Developing Countries" Sustainability 9, no. 9: 1608. https://doi.org/10.3390/su9091608
Note that from the first issue of 2016, this journal uses article numbers instead of page numbers. See further details here.