
Additional Solar System Gravitational Anomalies


Department of Finance, The University of Melbourne, Parkville, VIC 3010, Australia
Symmetry 2021, 13(9), 1696; https://doi.org/10.3390/sym13091696
Submission received: 9 August 2021
/
Revised: 3 September 2021
/
Accepted: 13 September 2021
/
Published: 14 September 2021
Abstract
:This article is motivated by uncertainty in experimental determinations of the gravitational constant, G, and numerous anomalies of up to 0.5 percent in Newtonian gravitational force on bodies within the solar system. The analysis sheds new light through six natural experiments within the solar system, which draw on published reports and astrophysical databases, and involve laboratory determinations of G, orbital dynamics of the planets and the moons of Earth and Mars, and non-gravitational acceleration (NGA) of ‘Oumuamua and comets. In each case, values are known for all variables in Newton’s Law , except for the gravitational constant, G. Analyses determine the gravitational constant’s observed value, , which—across the six settings—varies with the mass of the smaller, moving body, m, so that . While further work is required, this examination shows a scale-related Newtonian gravity effect at scales from benchtop to Solar System, which contributes to the understanding of symmetry in gravity and has possible implications for Newton’s Laws, dark matter, and formation of structure in the universe.
1. Introduction
Astronomers rarely have the opportunity to handle or experiment on their subjects and so depend on remote observations, which—when compiled in databases—can offer rich insights. This analysis is motivated by gravitational anomalies that have been observed at the smallest and largest scale [1,2,3,4] and examines them using results from determinations of G and data on the velocity of planets and smaller bodies in the solar system.
One set of small-scale anomalies are seen in experimental determinations of the gravitational constant, G, which use masses of a few kg located within centimetres of each other. These experiments are drawn on by the International Astronomical Union to develop the official value of G, which is 6.6743 × 10⁻¹¹ m3·kg−1·s−2 [5]. Although determinations of G are notoriously complex, its official value has 0.01 percent uncertainty, which is orders of magnitude greater than that for other fundamental constants [6].
At a larger scale, anomalies reflect variation in solar gravitational mass, GM⊙, of up to about 0.5 percent and are described as a missing mass problem and/or occurring at low accelerations [7]. An example involves 1I/2017 U1 ‘Oumuamua, which is the first macroscopic object to be observed that came from outside the solar system and had an unexplained non-Newtonian acceleration of 0.1 percent away from the Sun [8], so that—according to a NASA press release (number 18-056 of 28 June 2018)—it was 40,000 km further away when it disappeared from view than if only gravitational force had been acting.
This paper sheds new light on solar system gravitational anomalies through six natural experiments using data provided by others in published reports and astrophysical databases. These experiments test Newton’s Law , where all variables are known except G, which allows calculation of the observed value of the gravitational constant, . The experiments comprise:
- laboratory determinations of G by 13 teams using target masses up to 5 kg;
- orbital dynamics of the planets and of the moons of Earth and Mars, which assume Keplerian motion;
- non-gravitational acceleration (NGA) of ‘Oumuamua and 70 comets.
The analysis compiles previous research and interprets it to identify a scale-related effect in natural experiments from benchtop to Solar System bodies that help explain gravity’s lack of symmetry [9]. Gravity is the only force that breaks conformal or scale-independent symmetry, which is most obvious in the breakdown of Newtonian gravity as scale increases [10]. Because Newton’s Law was considered reliable in the solar system, the scale effect in galaxies and distant stars was explained by the proposed existence of dark matter and dark energy. Thus evidence that the gravitational constant, G, is scale-dependent within the solar system opens the possibility of universal bias in laws of gravitation.
2. Solar System Gravitational Anomalies
This section draws on materials published by others and calculates an observed value of the gravitational constant, that fits reported data. All data are referenced, but details of their determination are only provided where available.
2.1. Experimental Determinations of G
The value of the gravitational constant, G, is typically determined through benchtop experiments in controlled conditions that measure the interaction between a large mass that serves as the gravitational attractor and a smaller target mass [11,12].
Published estimates of G were identified through review articles [6,11,13,14,15] and a search using keywords. Table 1 provides details from 13 modern experiments that have attractor mass <550 kg, report G to at least four significant figures and provide details of the target mass.
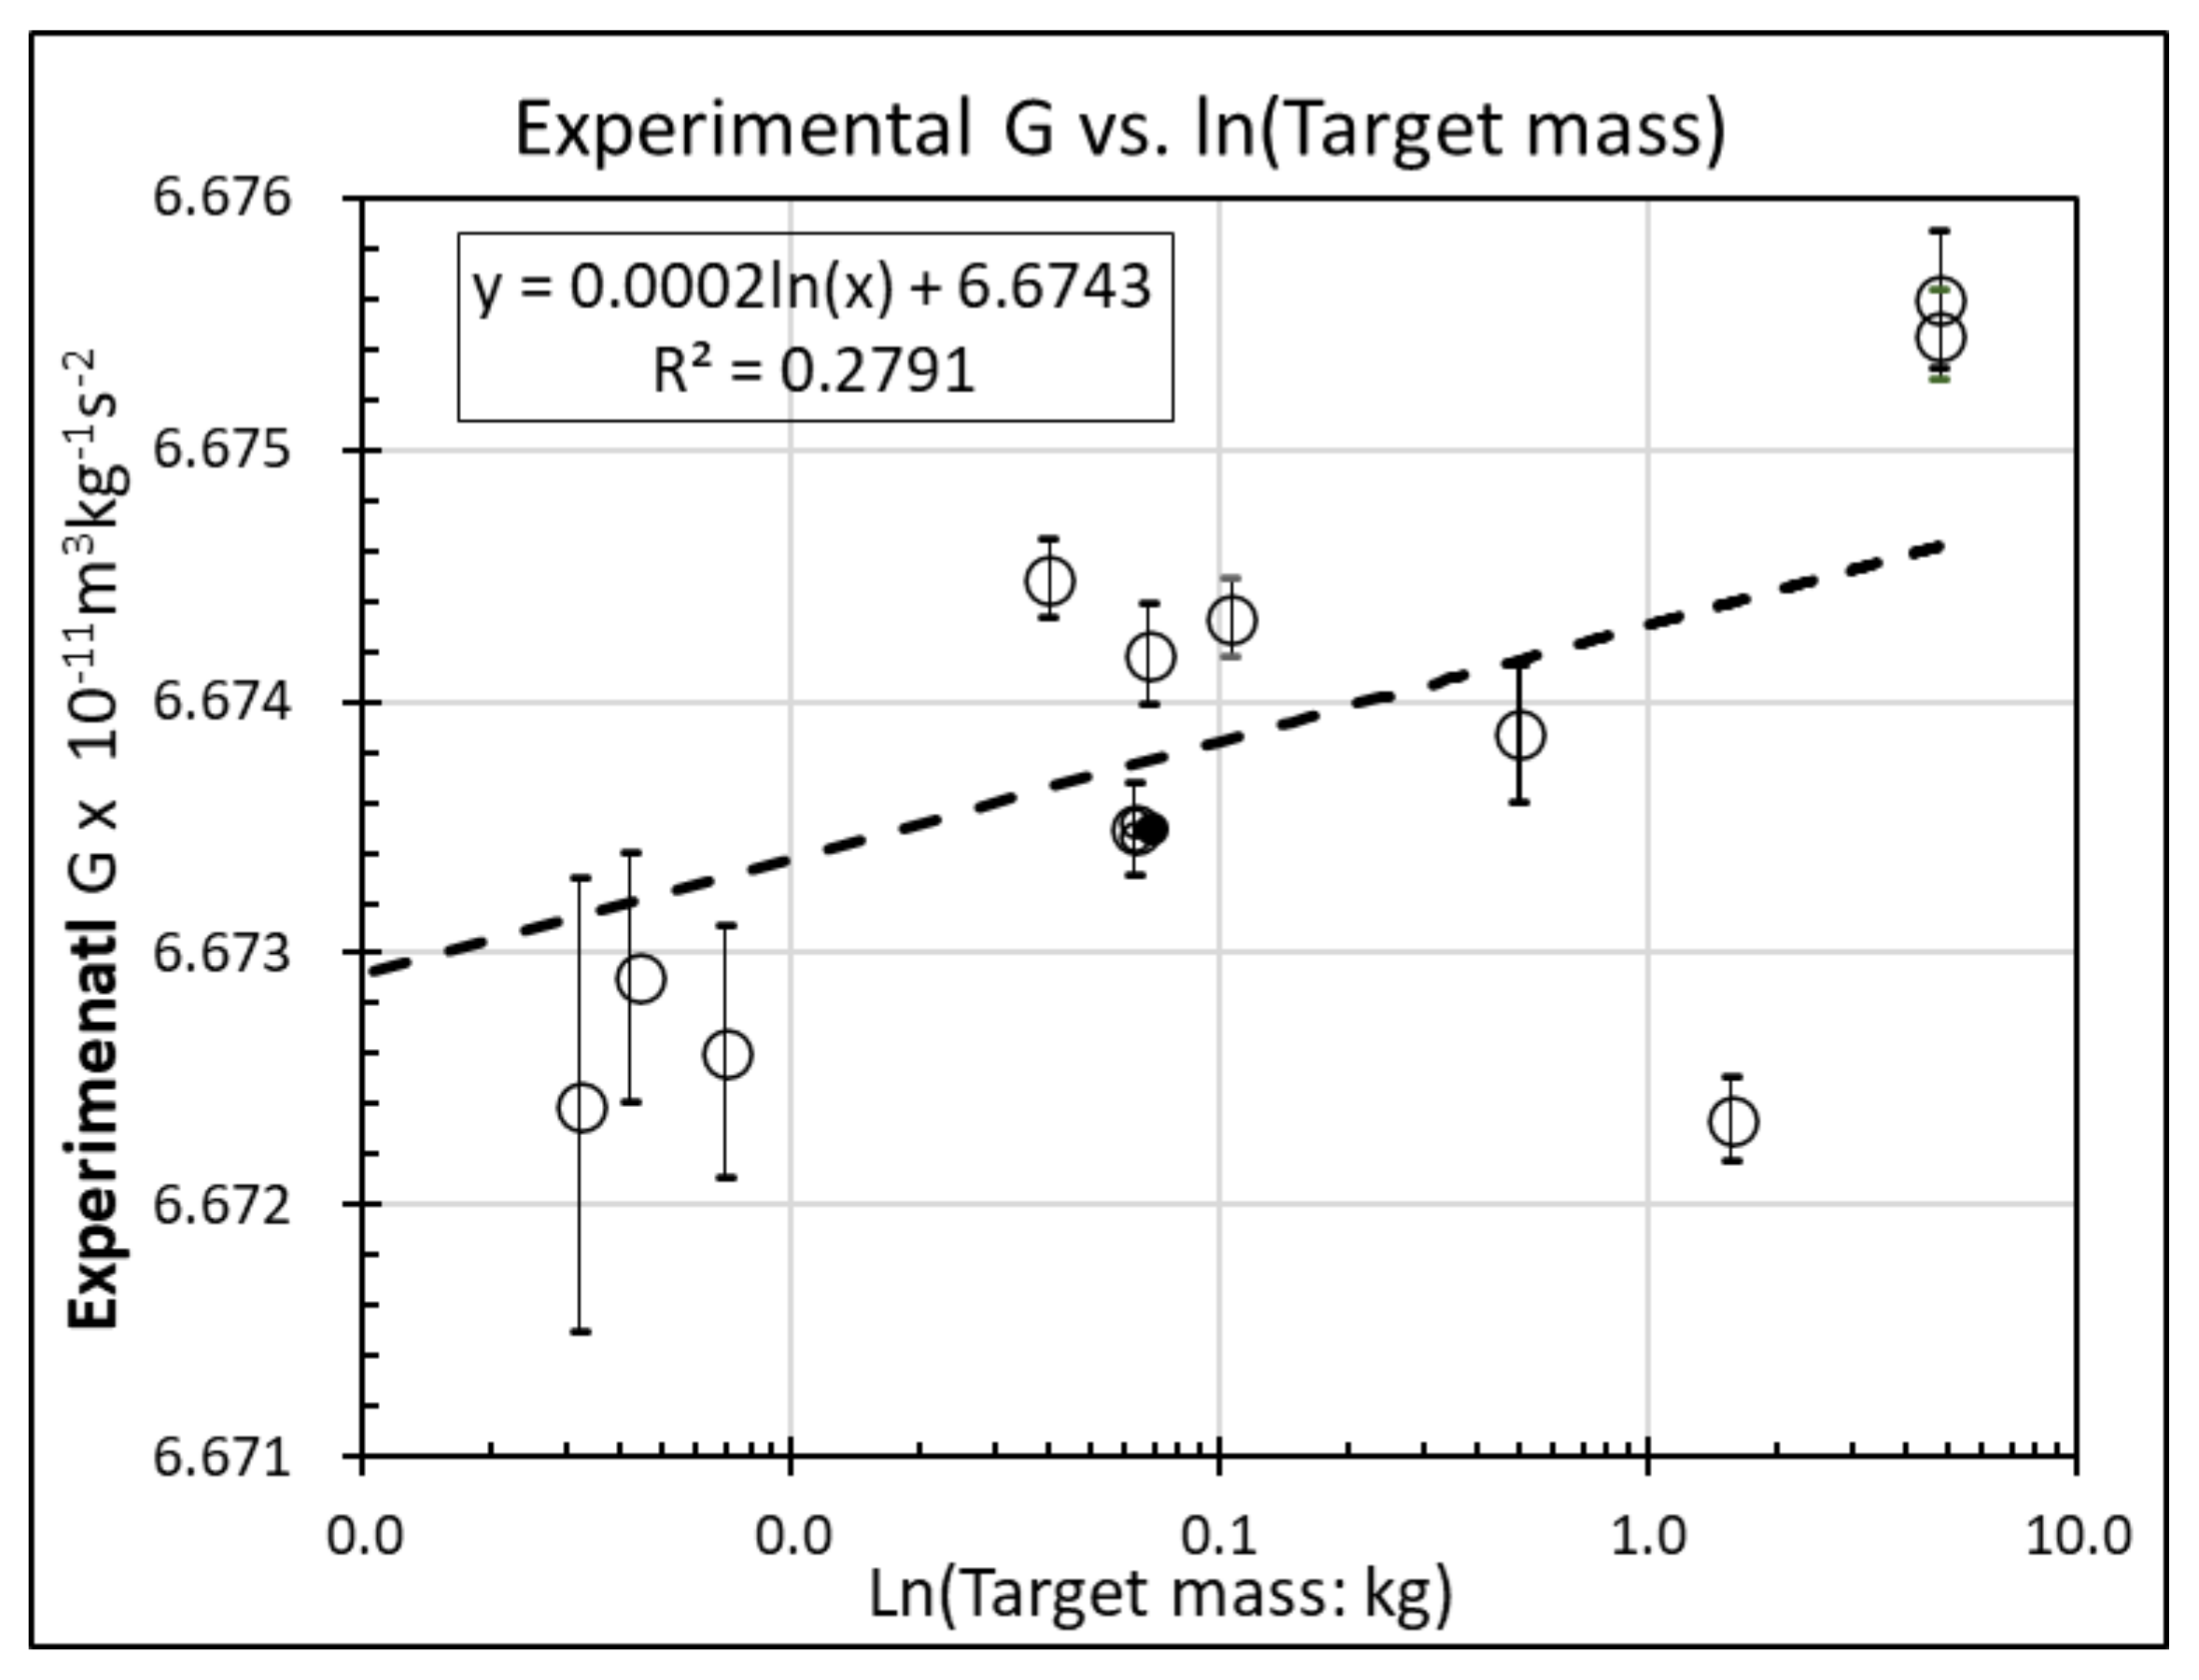
There is a history of plotting experimentally derived values of G [16], and this is repeated in Figure 1. Regression results are reported in panel B of Table 1 and show a statistically significant, positive relationship (p < 0.01; t-statistic equals 2.06) that explains over a quarter of the cross-sectional variation in the observed gravitational constant, (which is in units of m3·kg−1·s−2)
Lines 5 and 7 of Table 1 report derived from twinned experiments by researchers at Huazhong University of Science and Technology (HUST), Wuhan, using a torsion pendulum with the time-of-swing method. Results from experiments by the same team using equipment that is the same except for target mass should minimise systematic and other errors. Researchers confirmed the results above with the finding that rose from 6.67349 to 6.67418 × 10⁻¹¹ m3·kg−1·s−2 when the target mass rose from 63 to 68 g [17].
Benchtop determinations of G also vary the attractor mass and thus are natural experiments that test for a non-linear relationship between gravity and attractor mass, M. Unreported analysis followed a similar procedure to that above using data from experiments reported in Table 1 and a compilation of values of G and M [18]: neither showed any relationship. Nor was there a significant difference in G identified from twinned experiments by a team using 500 L tanks as attractor masses that were filled with water and mercury [19]. Thus there is no evidence of anything other than a linear relationship between force and attractor mass.

Table 1.
Experimental results for benchtop determinations of G.
| Panel A: Details of Published Studies | |||||||
| Reference | Apparatus | G (×10−11 m3⋅kg−1⋅s−2) | Attractor Mass (kg) | Target Mass (kg) | |||
| [20] | Torsion balance | 6.67387 ± 0.00027 | 54.00 | 0.5000 | |||
| [21] | Torsion pendulum, time of swing | 6.67400 ± 0.0007 | 20.98 | 0.0007 | |||
| [22] | Torsion pendulum, time of swing | 6.67239 ± 0.0009 | 12.50 | 0.0032 | |||
| [23] | Torsion balance | 6.6729 ± 0.0005 | 8.00 | 0.0044 | |||
| [24] | Torsion pendulum, time of swing | 6.674184 ± 0.000078 | 1.56 | 0.0680 | |||
| [25] | Angular acceleration feedback | 6.674484 ± 0.0000078 | 34.16 | 0.0400 | |||
| [26] | Torsion pendulum, time of swing | 6.67349 ± 0.000026 | 1.56 | 0.0630 | |||
| [26] | Torsion pendulum, time of swing | 6.6726 ± 0.0005 | 20.98 | 0.0070 | |||
| [27] | Torsion pendulum, time of swing | 6.67433 ± 0.00013 | 117.42 | 0.1060 | |||
| [28] | Laser interferometer | 6.67234 ± 0.00014 | 480.00 | 1.5600 | |||
| [29] | Torsion balance | 6.67545 ± 0.00018 | 44.00 | 4.8000 | |||
| [30] | Torsion balance | 6.67559 ± 0.00027 | 48.00 | 4.8000 | |||
| [31] | Torsion pendulum, time of swing | 6.67349 ± 0.00018 | 1.58 | 0.0700 | |||
| Panel B: Statistics for OLS Regressions Using Target Mass as the Independent Variable | |||||||
| Intercept | Slope | Adj R2 | |||||
| Value | Standard Error | p-Value | Value | Standard Error | p-Value | ||
| OLS Regression | 6.6743 | 0.00027 | <0.0001 | 0.000204 | 0.000137 | 0.016 | 0.279 |
| Bootstrapped standard errors (100,000 repetitions) | 6.6744 | 0.00031 | <0.0001 | 0.000202 | 0.000141 | 0.090 | 0.278 |
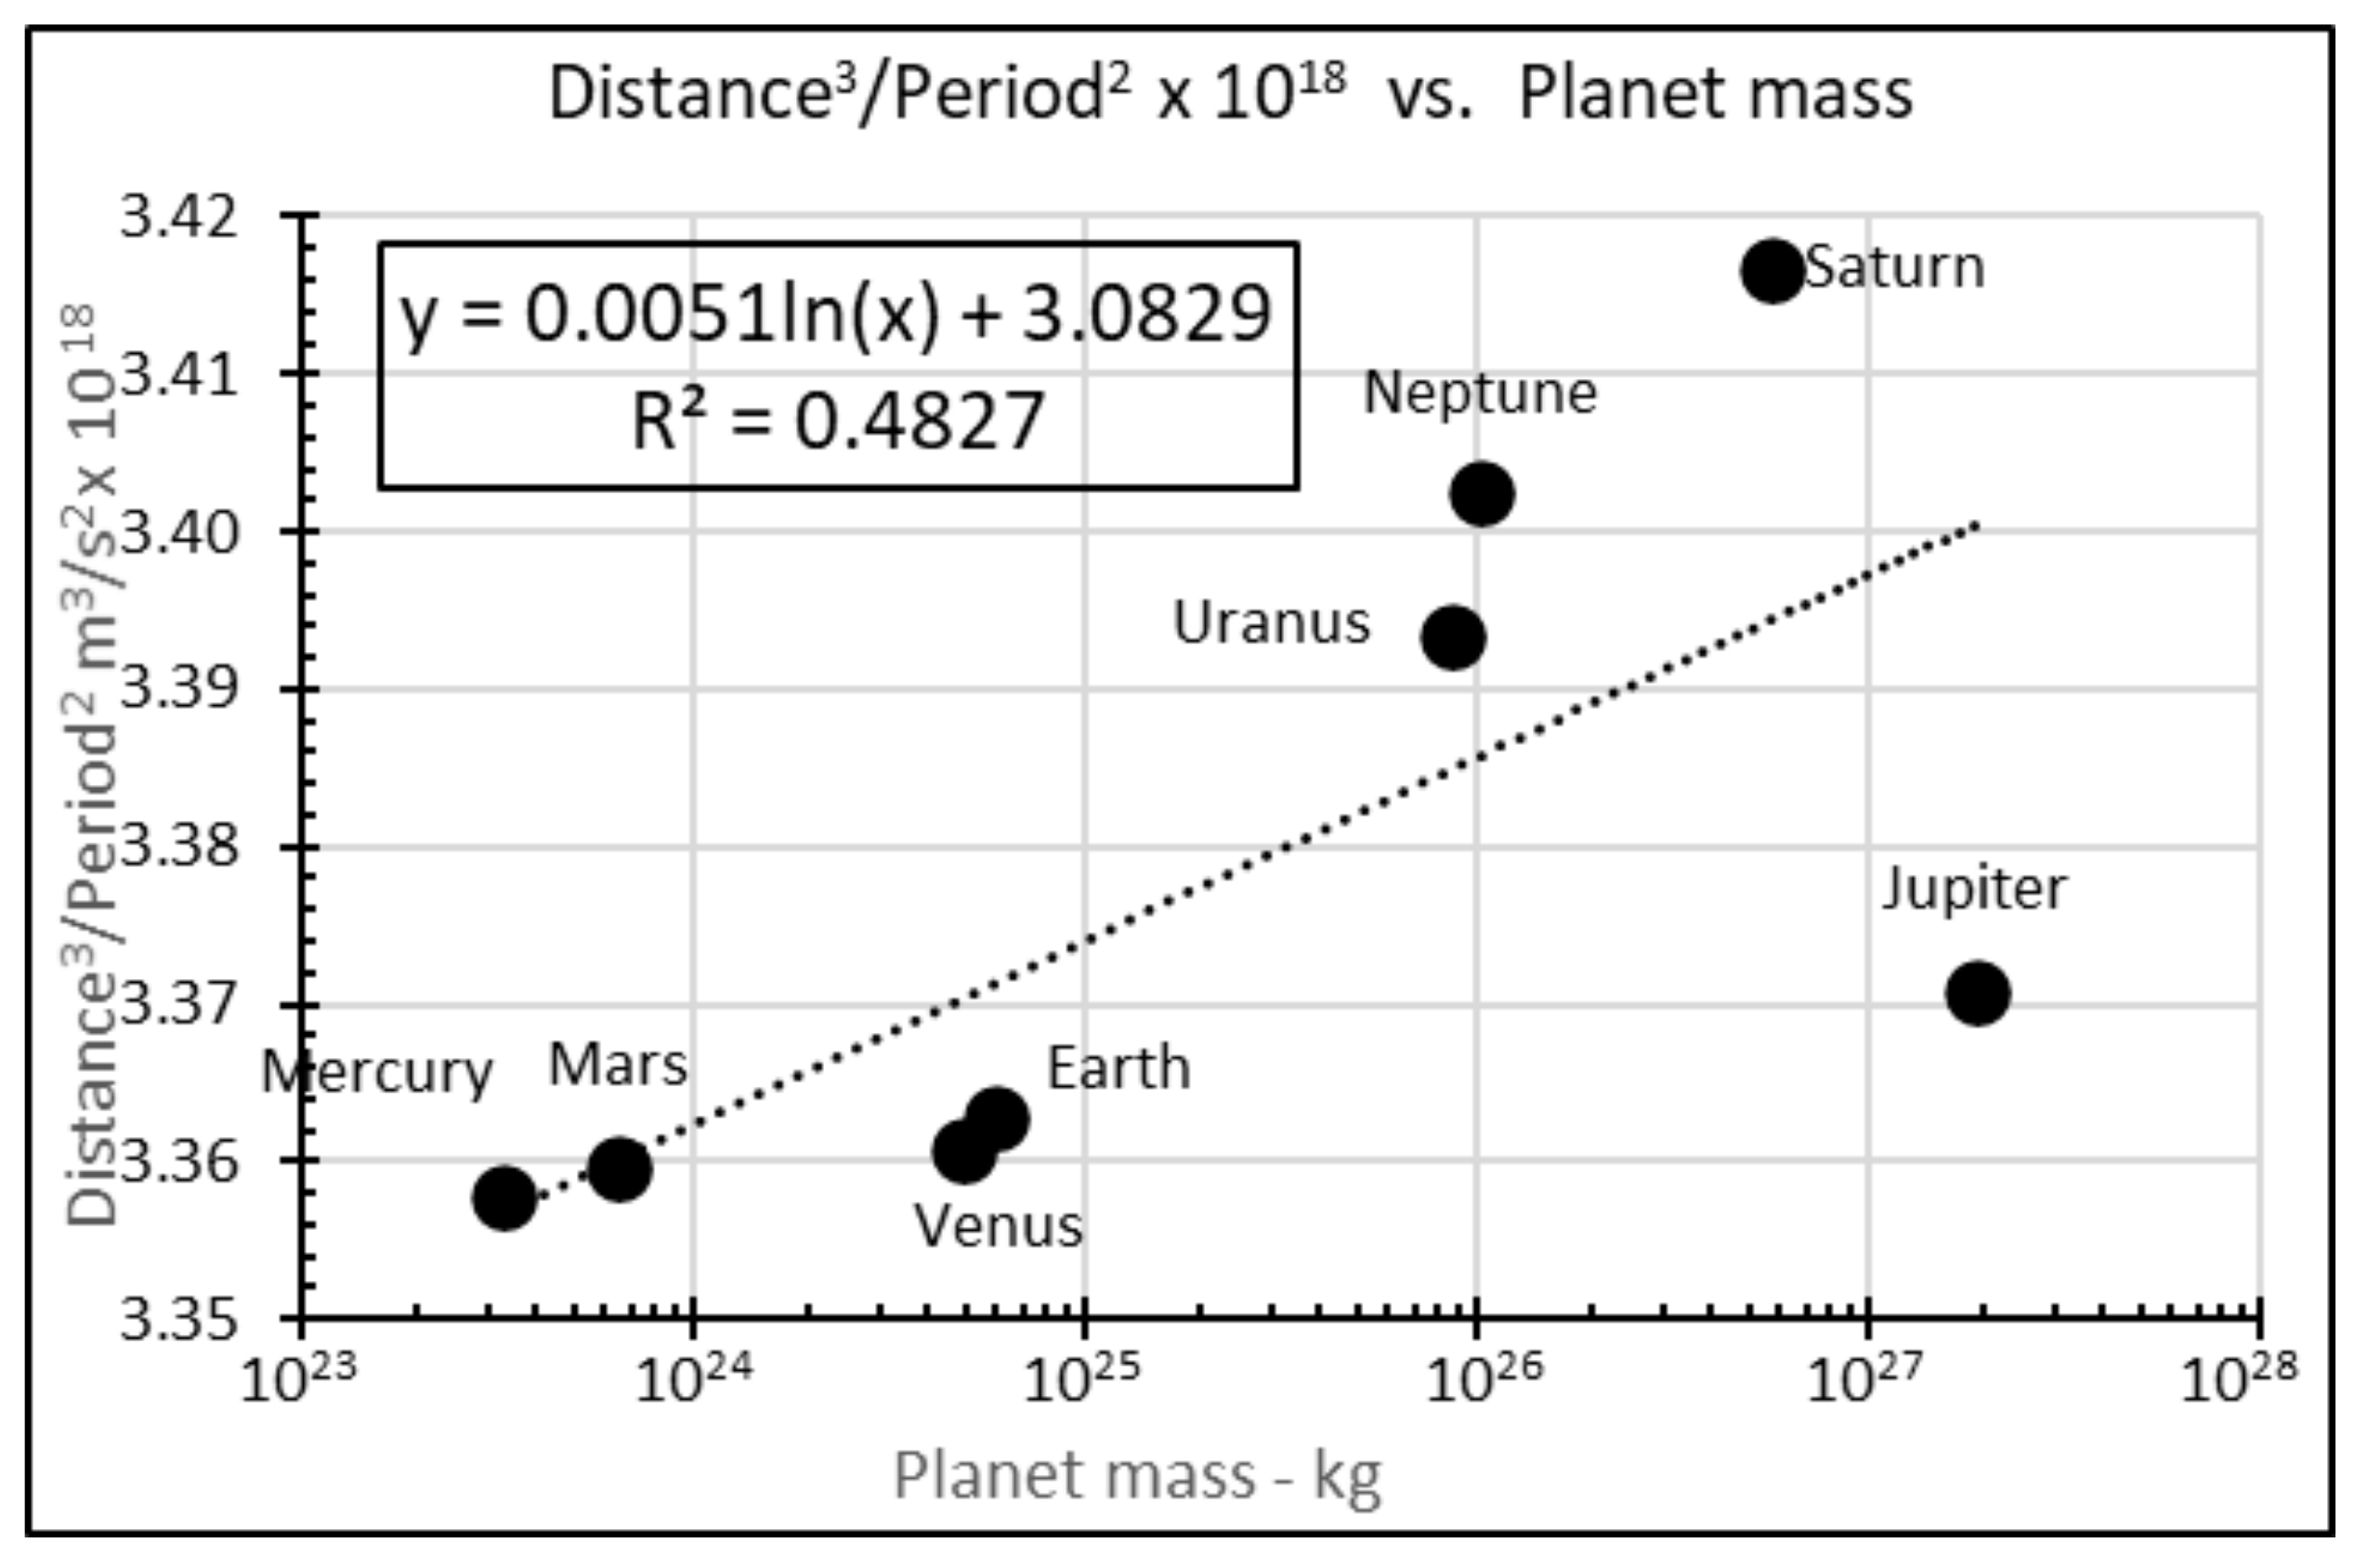
2.2. Planets’ Orbital Dynamics
Consider the solar system with Sun of mass, M⊙, and planets of mass, mP, which are in a stable orbit at a distance of RP, with a period TP (so orbital velocity, VP, equals 2.π.RP/TP). Assume that planets’ orbits are stable, so that centripetal and centrifugal forces are equal. Under Newton’s Law:
This gives Kepler’s Law where will be constant for planets, and—with = 2 × 1030 kg—equal 3.36 × 10¹⁸.
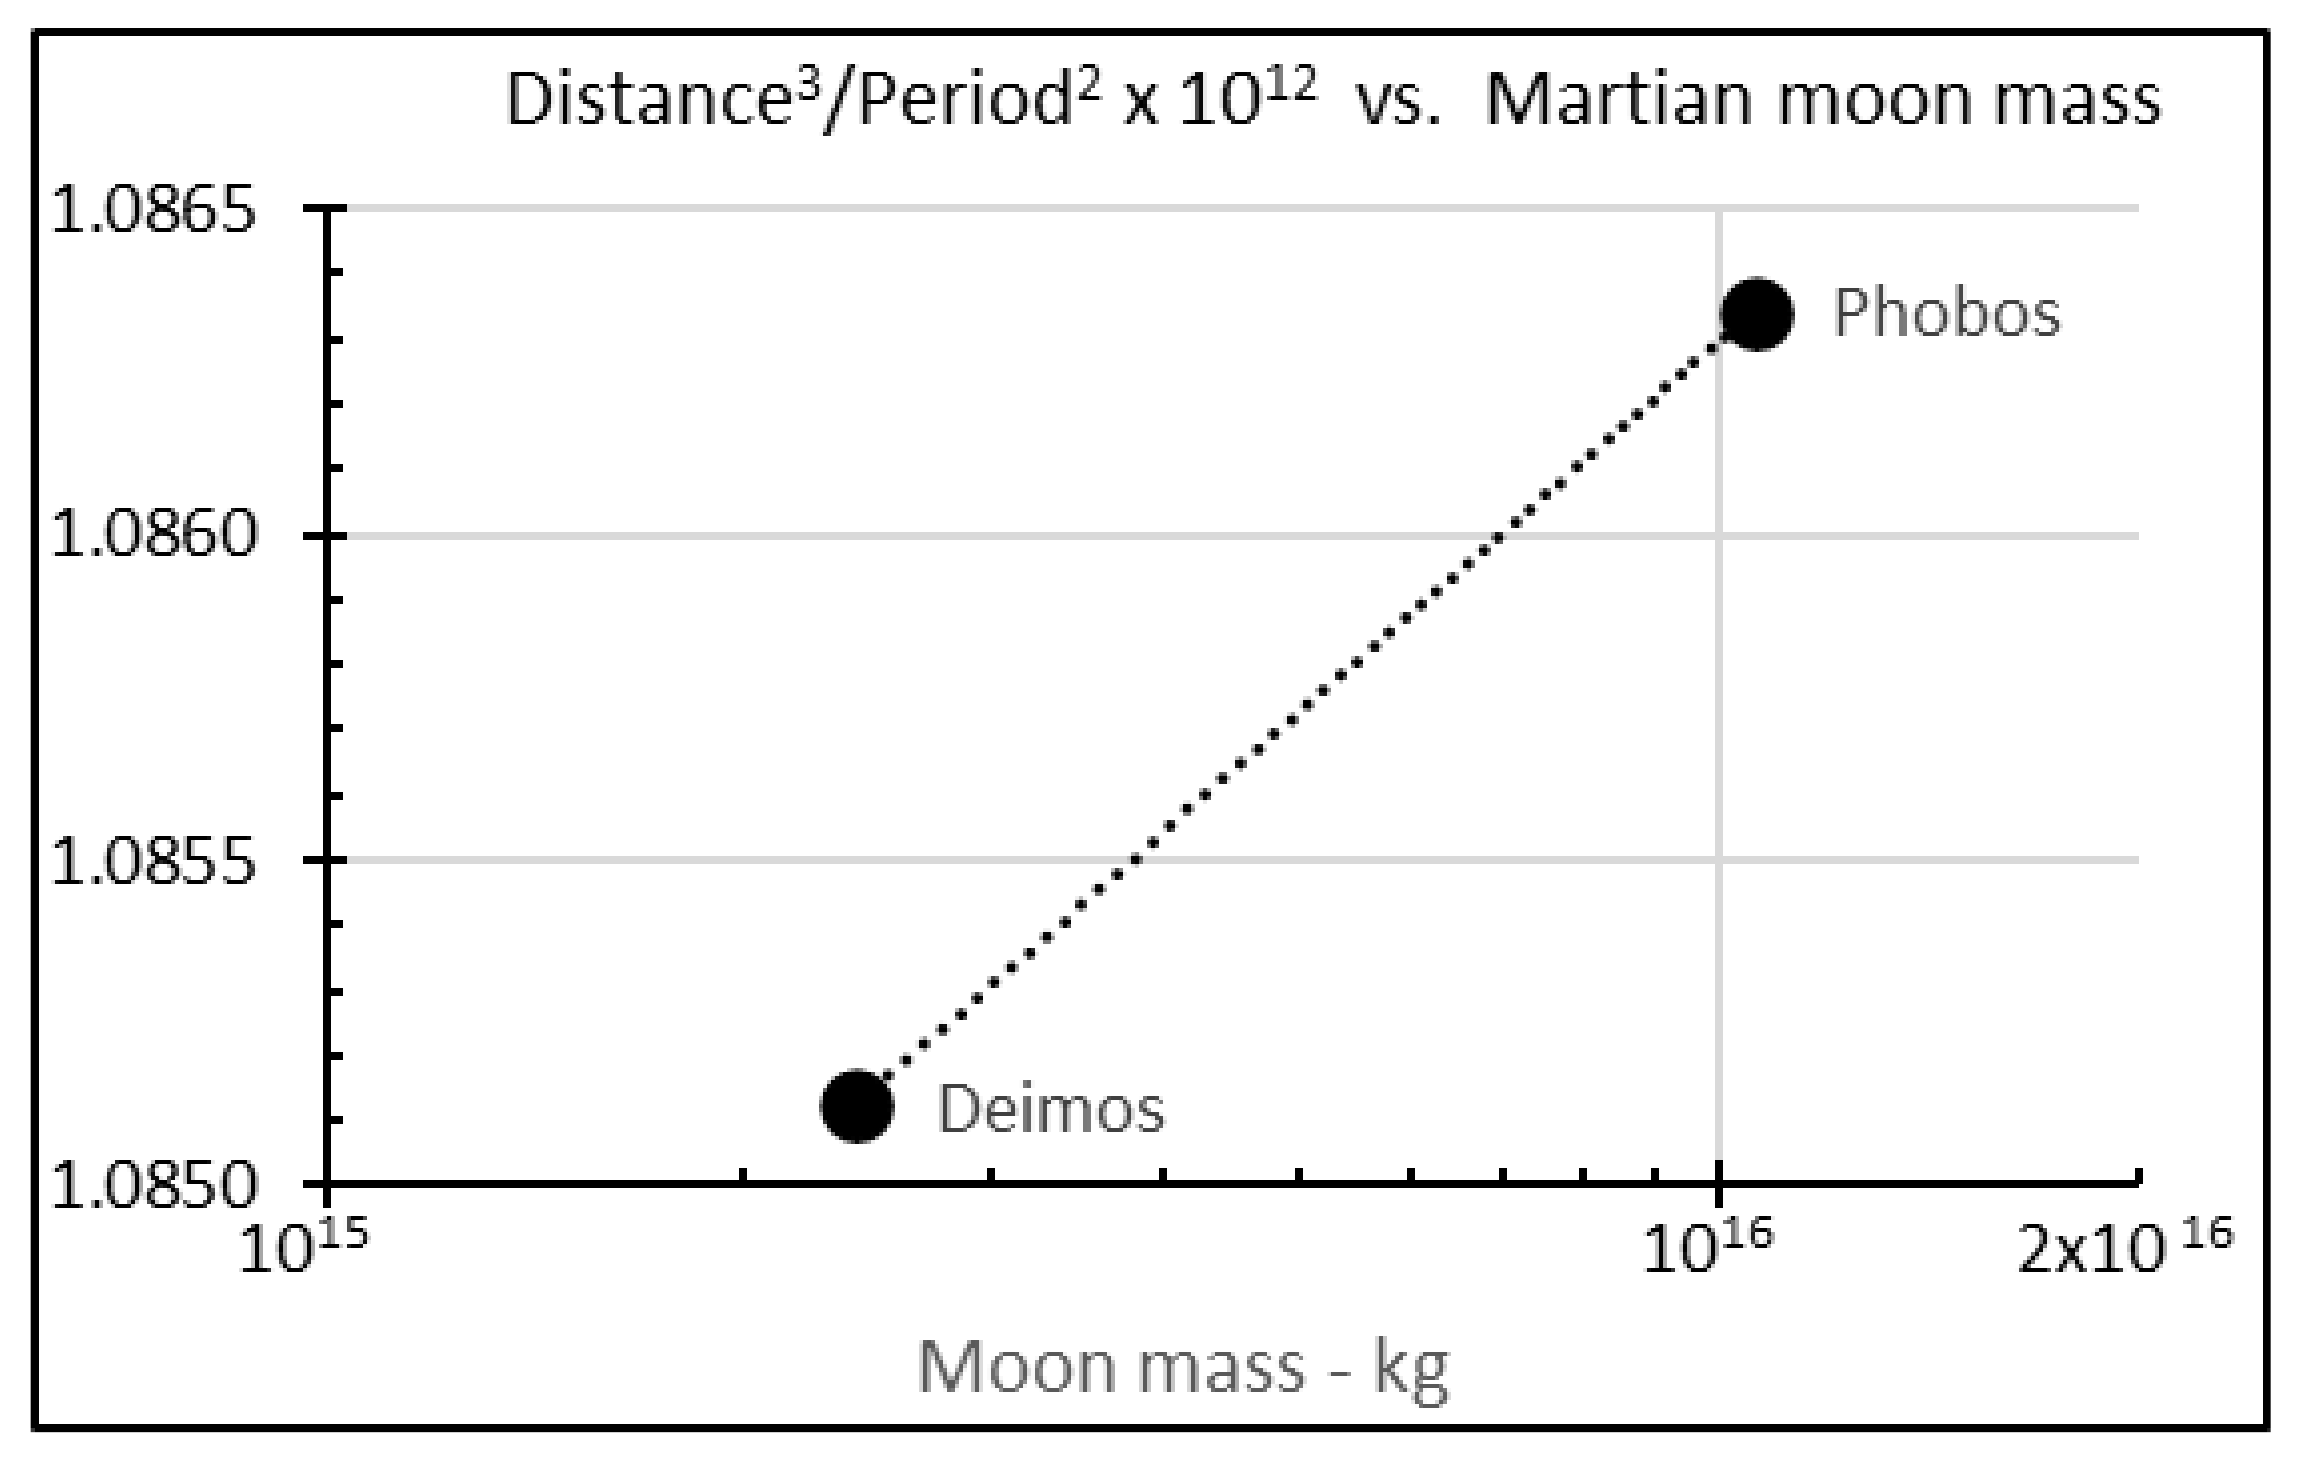
2.3. Moons of Earth and Mars
The analysis above of planet orbital dynamics can be applied to planets’ moons so that:
Starting with the Moon, data give a value of .
2.4. NGA of ‘Oumuamua and Comets
As the first interstellar object identified in the solar system, ‘Oumuamua, was the subject of intense scrutiny by a dozen astronomical teams over several months after late 2017 [33,34]. One of its most prominent features was NGA of 5.01 × 10⁻⁶ m·s−2/R2, which reflects a reduction in solar gravitation of about 0.1 percent [8]. This is at the highest end of the range of NGAs observed in comets and asteroids [35] and triggered an extensive search for emissions that might explain it. However, none were observed, and ‘Oumuamua was inert [36].
Positive NGA is away from the Sun, so that:
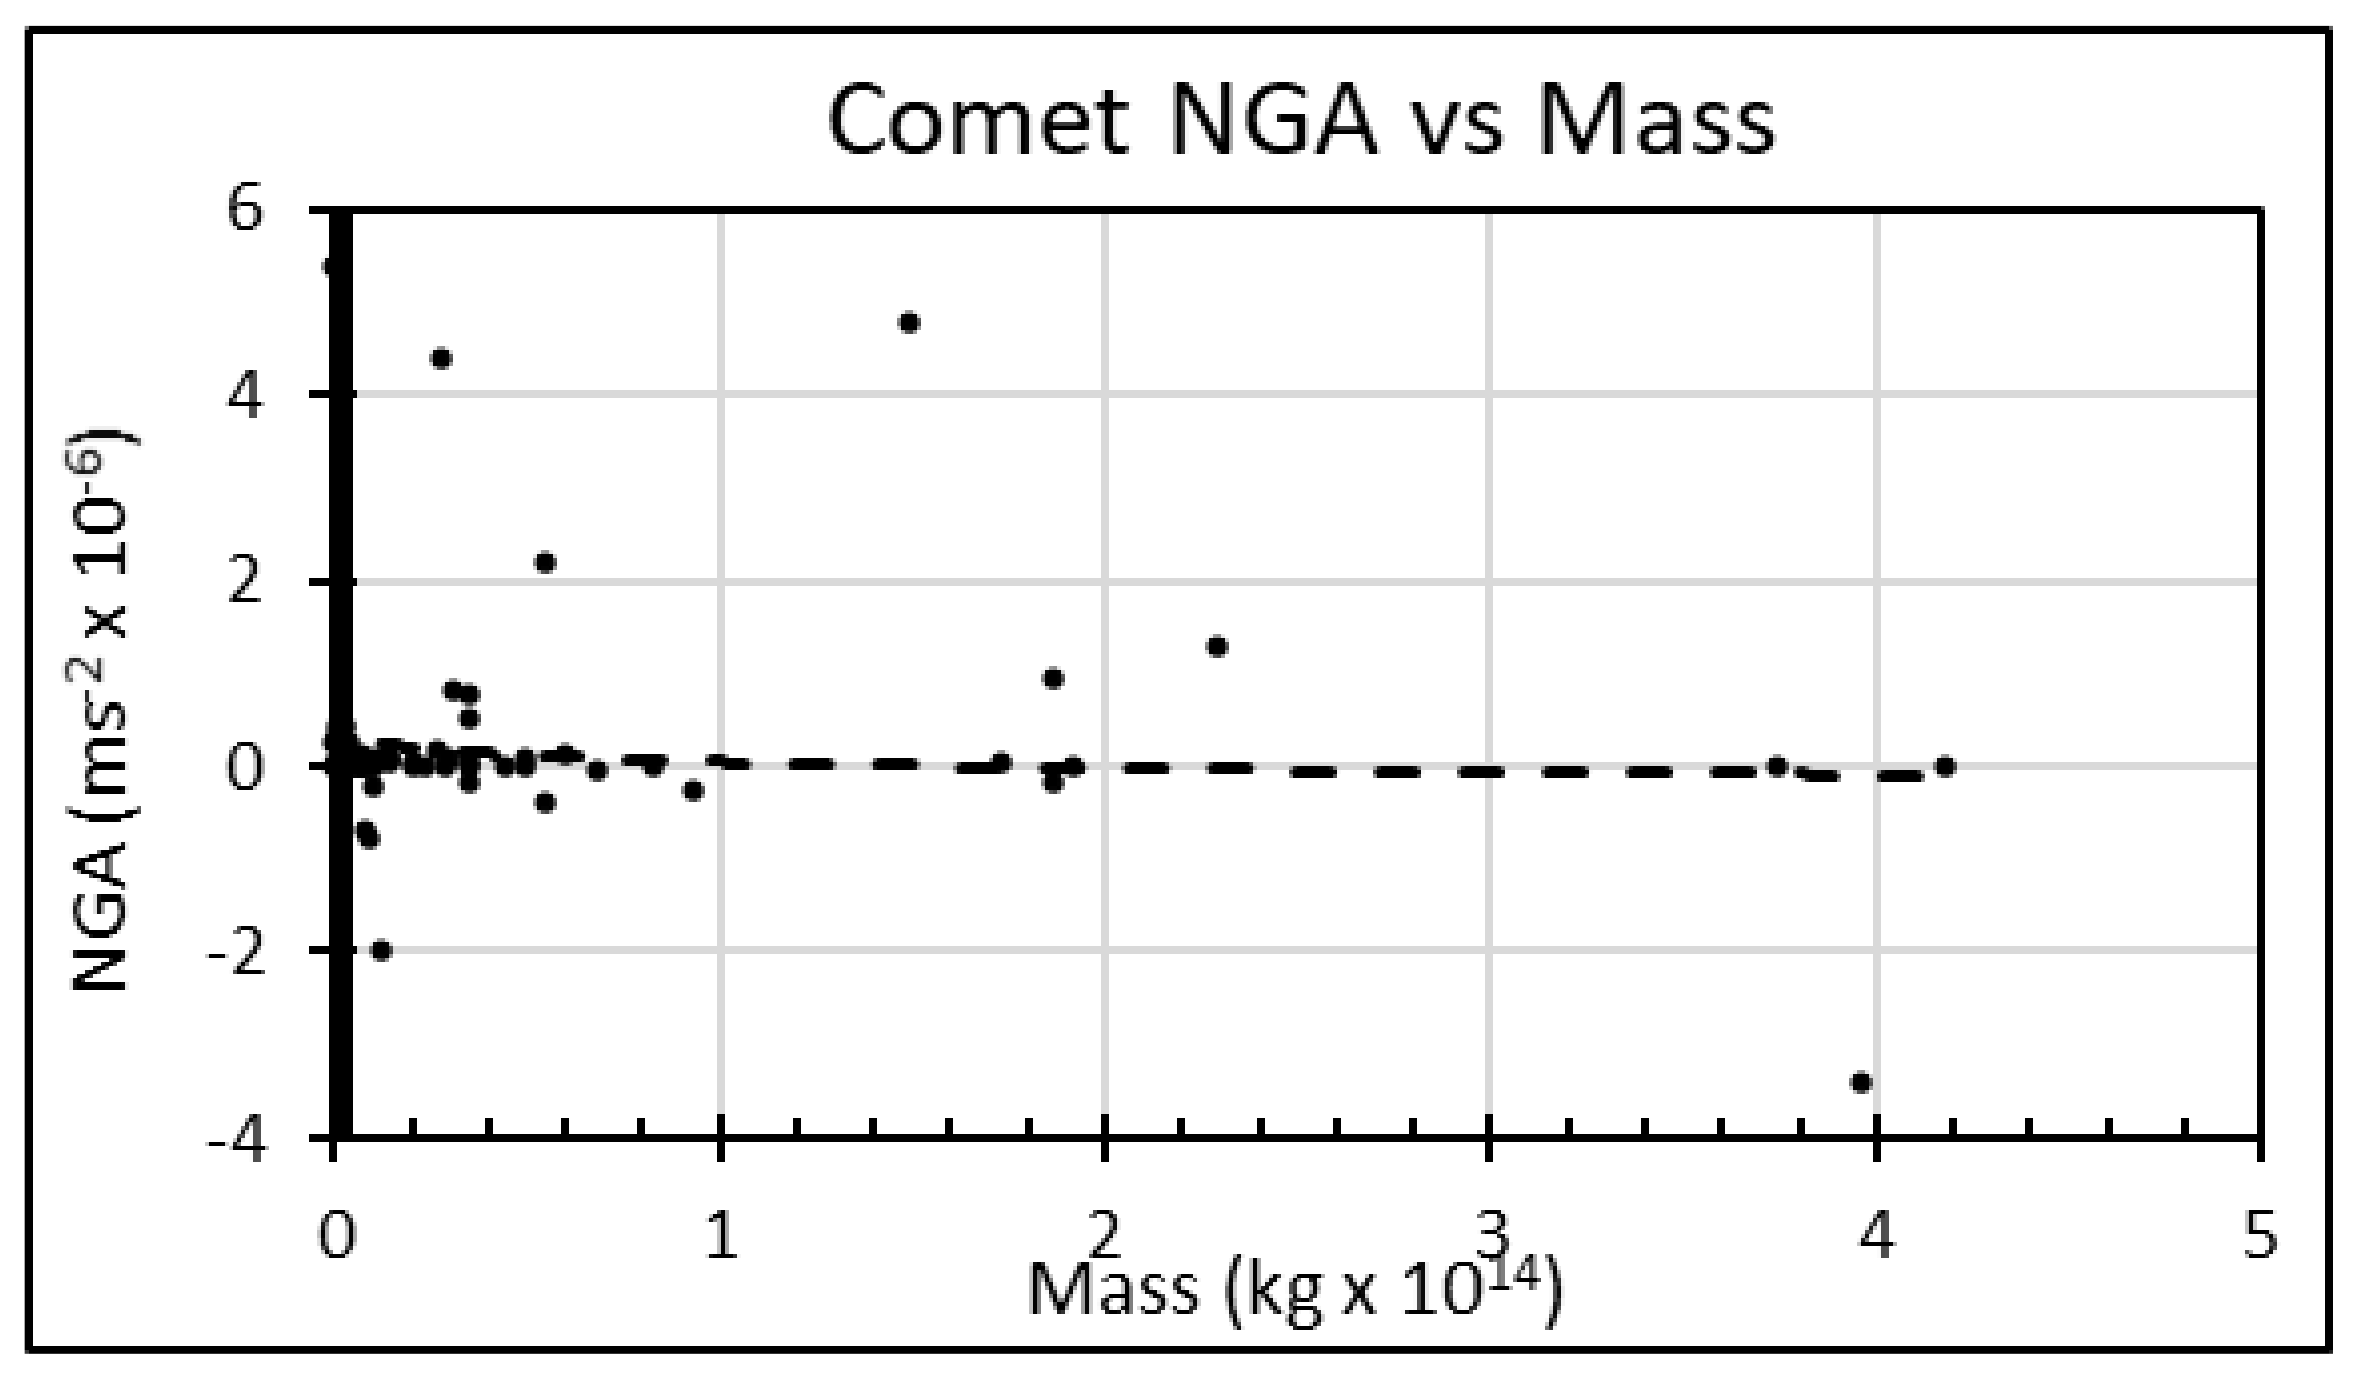
The last natural experiment relates to comets. The JPL Small Body Database maintained by NASA (available at https://ssd.jpl.nasa.gov/sbdb_query.cgi#x, accessed on 1 August 2021) [37] holds orbital dynamics and physical properties of more than 3700 comets and asteroids, with data on NGA and diameter available for 70 comets. This makes comets the numerically largest group with reported mass and orbital data, and thus their behavior informs the analysis of observed gravity.
Assuming density of comets’ nucleus equal to 0.6 g/cm3 [38], Figure 4 plots their NGA against estimated mass. Following the same approach as used with ‘Oumuamua:
Comet NGAs reported by JPL typically have 1σ uncertainty of ±10 percent, thus the relationship between and comet mass is statistically insignificant. This, however, is counter-intuitive under the standard model of comet dynamics where NGA arises from the sublimation of volatiles on the sunward face of the comet, which induces positive (i.e., anti-Solar) NGA [39]. Because outgassing is a function of comet surface area and mass is a function of volume, NGA should be an inverse function of comet diameter and hence of the cube root of the mass. Thus the finding above is supportive of negative NGA related to comet mass and suggests that a portion of comets’ observed NGA is a gravitational anomaly shared with other small bodies in the solar system.
2.5. Other Possible Gravity Anomalies
A number of other settings seemed suited to further natural experiments, but—in unreported results—none proved suitable.
One example is satellites’ Earth flybys. However, data show inconsistent signs in anomalies, and recent values were zero, which suggests multiple effects that require more data to be untangled [40,41]. Moons of the outer planets were also checked for mass-related anomalies, as were flybys of Mars and its moons, but no significant anomaly was detected.
In addition, a number of gravity anomalies were explained, including the Pioneer anomaly and increase in orbital diameters of Earth and Moon [42].
3. Discussion
To summarise, the analysis above draws on six sets of data for planets and small bodies within the solar system, which avoids uncertain, confounding effects. Relying on Newton’s Law of gravitation, data enabled quantification of observed gravitational constant, , and its values in different settings are summarised below:
- Benchtop experiments = {6.674 + 0.000200 × ln(mtarget)} × 10−11
- Planets’ orbits
- Martian moons
- Earth’s Moon
- ‘Oumuamua
- Comets
- Official (IAU) value of G G = 6.6743 × 10⁻¹¹ m3·kg−1·s−2 [5]
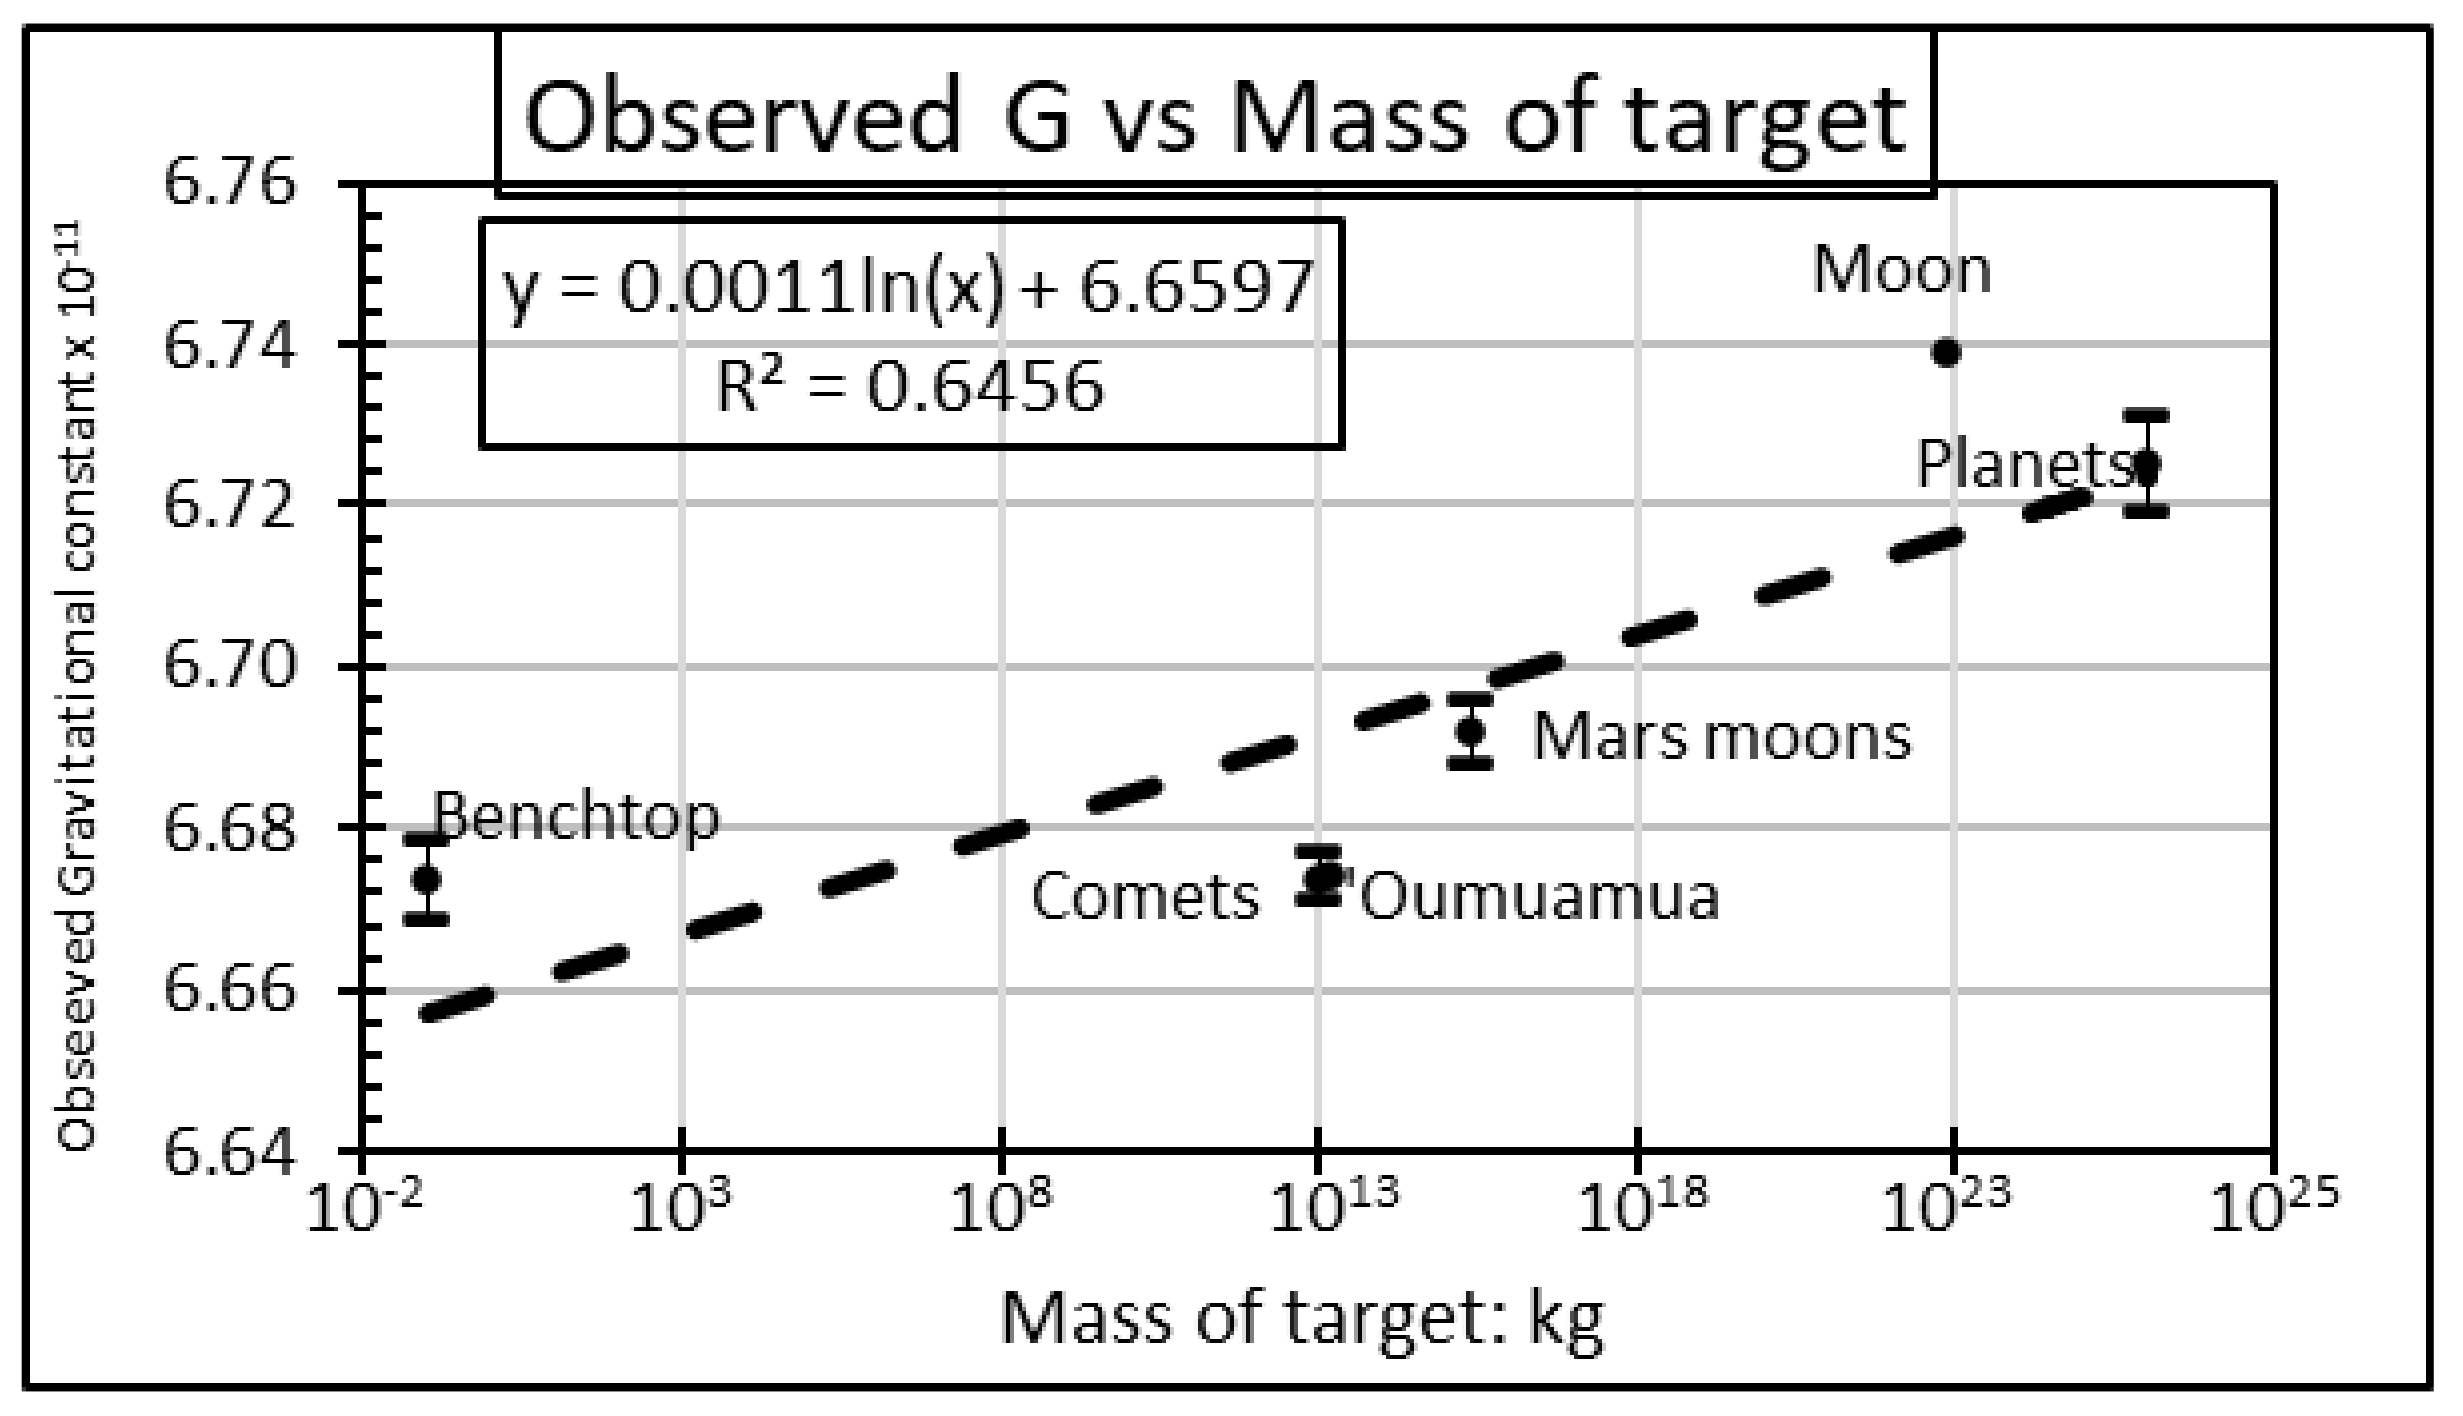
Figure 5 plots a representative value for each of the six lines of best fit above, which—when expressed in terms of G—can be expressed as:
Equation (12) follows interpretation of data involving possible gravitational mass discrepancies in the solar system, and is a working formula because these data were generated for other purposes. In terms of the structure of the equation, in each natural experiment a log formulation had the highest statistical significance. Moreover, the structure of Equation (12) introduces a dimensionless factor that matches evidence whereby force increases disproportionately with a mass of the smaller, target object for masses in the range 0.01 kg to M⊙ and over separation distances ranging from a few cm to 30 AU.
The first implication of Equation (12) is that the official value of G is accurate for m ≈ 106 kg (typical of a 20 m diameter asteroid). For solar system bodies above that size, such as Earth, Equation (12) increases gravity by up to about 0.5 percent. For smaller bodies, it will reduce gravity and result in positive (i.e., anti-Solar) NGA. This scale-dependence has numerous corollaries. For example, when Equation (12) is applied to ‘Oumuamua, which had radially outward NGA of about one-thousandth of solar gravitation, it suggests a mass of less than about 103 kg. While this is many orders of magnitude less than expected by most studies, it approximates the mass of typical manmade spacecraft and would be consistent with a light sail as proposed in reference [43].
Equation (12) also implies that gravitational anomalies within the solar system are consistent with scale-related Newtonian gravity. Newton’s Law of Gravitation had been considered reliable in the solar system, so that—when unexplained gravity was identified at galactic scale and above—it was attributed to a phenomenon unique to those regions, either dark matter or dark energy [10]. The analysis here, though, shows that gravity is also scale-dependent within the solar system, which makes it universal and helps explain missing mass. Another possible implication of Equation (12) for the study of galaxies and beyond is the greater relative attraction of larger target masses which could explain the clumping of matter that leads to the formation of bigger than expected structures in shorter periods [44]. By relating G to m, Equation (12) also has implications for Newton’s Law of gravitation which, for instance, could be revised to , and for Kepler’s and other Newtonian Laws, conservation of energy and momentum. More broadly, variation in determinations of G complements a variety of studies suggesting that it is not constant in all settings, but may vary over time [45], with location and alignment of apparatus [15] and time of day [46].
Without further work, such issues are difficult to evaluate. This points to the analysis’ principal weak point, which is that reliance on published data to establish the nexus between gravitational mass and target mass gives an uncertain link and cannot rule out possible random and systematic errors. Thus, even though Equation (12) reduces cross-sectional variation in values of G in a variety of different settings by up to two-thirds, its limitations mean it is but one conclusion from the data. Further targeted studies are required to validate the findings. In the meantime, although initial findings foreshadow several possible implications, it is important not to over-reach the analysis.
Equation (12) explains part of the breakdown of Newton’s Law but does not describe underlying physical processes, whether dipolar or other, and is probably only an approximation of a more comprehensive theory that requires further data and analysis. Even so, improved understanding of the well-studied behaviour of natural and artificial bodies in the solar system can only help tighten up natural laws.
Funding
This research did not receive any specific grant from funding agencies in the public, commercial, or not-for-profit sectors.
Institutional Review Board Statement
Not applicable.
Informed Consent Statement
Not applicable.
Data Availability Statement
All data used to support the findings of this study are included in the article. Table 1 lists sources of experimental determinations of G, the data on planets and moons are from NASA32, and comet data are from the JPL Small Body Database available at https://ssd.jpl.nasa.gov/sbdb_query.cgi#x (accessed on 1 August 2021).
Acknowledgments
The author thanks the academic editor and three anonymous reviewers for insightful reports that significantly improved the manuscript.
Conflicts of Interest
The author declares that he has no competing financial interests or personal relationships that could have appeared to influence the work reported in this paper. There are no co-authors to the article, and I confirm sole authorship. There is no figure or text in the article that has been taken without attribution.
References
- Acedo, L. Anomalous post-Newtonian terms and the secular increase of the astronomical unit. Adv. Space Res. 2013, 52, 1297–1303. [Google Scholar] [CrossRef] [Green Version]
- Anderson, J.D.; Nieto, M.M. Astrometric solar-system anomalies. Proc. Int. Astron. Union 2009, 5, 189–197. [Google Scholar] [CrossRef] [Green Version]
- Debono, I.; Smoot, G.F. General relativity and cosmology: Unsolved questions and future directions. Universe 2016, 2, 23. [Google Scholar] [CrossRef]
- Iorio, L. Gravitational anomalies in the solar system? Int. J. Mod. Phys. D 2015, 24, 1530015. [Google Scholar] [CrossRef] [Green Version]
- International Astronomical Union. Astronomical Constants. 2018. Available online: http://asa.hmnao.com/static/files/2018/Astronomical_Constants_2018.pdf (accessed on 1 August 2021).
- Mohr, P.J.; Newell, D.B.; Taylor, B.N. CODATA recommended values of the fundamental physical constants: 2014. J. Phys. Chem. Ref. Data 2016, 45, 043102. [Google Scholar] [CrossRef] [Green Version]
- Trippe, S. The ‘missing mass problem’in astronomy and the need for a modified law of gravity. Z. Nat. A 2014, 69, 173–187. [Google Scholar]
- Micheli, M.; Farnocchia, D.; Meech, K.J.; Buie, M.W.; Hainaut, O.R.; Prialnik, D.; Schörghofer, N.; Weaver, H.A.; Chodas, P.W.; Kleyna, J.T.; et al. Non-gravitational acceleration in the trajectory of 1I/2017 U1 (‘Oumuamua). Nature 2018, 559, 223–226. [Google Scholar] [CrossRef]
- Ziaeepour, H. Making a quantum universe: Symmetry and gravity. Universe 2020, 6, 194. [Google Scholar] [CrossRef]
- Mannheim, P.D. Alternatives to dark matter and dark energy. Prog. Part. Nucl. Phys. 2006, 56, 340–445. [Google Scholar] [CrossRef] [Green Version]
- Luo, J.; Hu, Z.-K. Status of measurement of the Newtonian gravitational constant G. Class. Quantum Gravity 2000, 17, 2351. [Google Scholar] [CrossRef]
- Wu, J.; Li, Q.; Liu, J.; Xue, C.; Yang, S.; Shao, C.; Tu, L.; Hu, Z.; Luo, J. Progress in precise measurements of the gravitational constant. Ann. Physik 2019, 531, 1900013. [Google Scholar] [CrossRef]
- Rothleitner, C.; Schlamminger, S. Invited review article: Measurements of the Newtonian constant of gravitation, G. Rev. Sci. Instrum. 2017, 88, 111101. [Google Scholar] [CrossRef] [PubMed] [Green Version]
- Milyukov, V.; Fan, S.-H. The Newtonian gravitational constant: Modern status of measurement and the new CODATA value. Gravit. Cosmol. 2012, 18, 216–224. [Google Scholar] [CrossRef]
- Gillies, G.T. The Newtonian gravitational constant: Recent measurements and related studies. Rep. Prog. Phys. 1997, 60, 151. [Google Scholar] [CrossRef]
- Long, D.R. Why do we believe Newtonian gravitation at laboratory dimensions? Phys. Rev. D 1974, 9, 850. [Google Scholar] [CrossRef]
- Xue, C.; Liu, J.-P.; Li, Q.; Wu, J.-F.; Yang, S.-Q.; Liu, Q.; Shao, C.-G.; Tu, L.-C.; Hu, Z.-K.; Luo, J. Precision measurement of the Newtonian gravitational constant. Natl. Sci. Rev. 2020, 7, 1803–1817. [Google Scholar] [CrossRef]
- Gillies, G.T.; Unnikrishnan, C. The attracting masses in measurements of G: An overview of physical characteristics and performance. Philos. Trans. R. Soc. A Math. Phys. Eng. Sci. 2014, 372, 20140022. [Google Scholar] [CrossRef]
- Nolting, F.; Schurr, J.; Schlamminger, S.; Kündig, W. A value for G from beam-balance experiments. Meas. Sci. Technol. 1999, 10, 487. [Google Scholar] [CrossRef]
- Armstrong, T.; Fitzgerald, M. New measurements of G using the measurement standards laboratory torsion balance. Phys. Rev. Lett. 2003, 91, 201101. [Google Scholar] [CrossRef]
- Bagley, C.H.; Luther, G.G. Preliminary results of a determination of the Newtonian constant of gravitation: A test of the Kuroda hypothesis. Phys. Rev. Lett. 1997, 78, 3047. [Google Scholar] [CrossRef]
- Gundlach, J.H.; Merkowitz, S.M. Measurement of Newton’s constant using a torsion balance with angular acceleration feedback. Phys. Rev. Lett. 2000, 85, 2869. [Google Scholar] [CrossRef] [Green Version]
- Hu, Z.-K.; Guo, J.-Q.; Luo, J. Correction of source mass effects in the HUST-99 measurement of G. Phys. Rev. D 2005, 71, 127505. [Google Scholar] [CrossRef]
- Karagioz, O.; Izmailov, V. Measurement of the gravitational constant with a torsion balance. Meas. Tech. 1996, 39, 979–987. [Google Scholar] [CrossRef]
- Lamporesi, G.; Bertoldi, A.; Cacciapuoti, L.; Prevedelli, M.; Tino, G.M. Determination of the Newtonian gravitational constant using atom interferometry. Phys. Rev. Lett. 2008, 100, 050801. [Google Scholar] [CrossRef] [PubMed] [Green Version]
- Li, Q.; Xue, C.; Liu, J.-P.; Wu, J.-F.; Yang, S.-Q.; Shao, C.-G.; Quan, L.-D.; Tan, W.-H.; Tu, L.-C.; Liu, Q.; et al. Measurements of the gravitational constant using two independent methods. Nature 2018, 560, 582–588. [Google Scholar] [CrossRef]
- Luo, J.; Liu, Q.; Tu, L.-C.; Shao, C.-G.; Liu, L.-X.; Yang, S.-Q.; Li, Q.; Zhang, Y.-T. Determination of the Newtonian gravitational constant G with time-of-swing method. Phys. Rev. Lett. 2009, 102, 240801. [Google Scholar] [CrossRef]
- Luther, G.G.; Towler, W.R. Redetermination of the Newtonian gravitational constant G. Phys. Rev. Lett. 1982, 48, 121. [Google Scholar] [CrossRef]
- Newman, R.; Bantel, M.; Berg, E.; Cross, W. A measurement of G with a cryogenic torsion pendulum. Philos. Trans. R. Soc. A 2014, 372, 20140025. [Google Scholar] [CrossRef] [Green Version]
- Parks, H.V.; Faller, J.E. A simple pendulum laser interferometer for determining the gravitational constant. Philos. Trans. R. Soc. A 2014, 372, 20140024. [Google Scholar] [CrossRef] [PubMed]
- Prevedelli, M.; Cacciapuoti, L.; Rosi, G.; Sorrentino, F.; Tino, G. Measuring the Newtonian constant of gravitation G with an atomic interferometer. Philos. Trans. R. Soc. A 2014, 372, 20140030. [Google Scholar] [CrossRef] [Green Version]
- NASA. Planetary Fact. Sheet—Metric. 2019. Available online: https://nssdc.gsfc.nasa.gov/planetary/factsheet (accessed on 1 August 2021).
- Bannister, M.T.; Bhandare, A.; Dybczyński, P.A.; Fitzsimmons, A.; Guilbert-Lepoutre, A.; Jedicke, R.; Knight, M.M.; Meech, K.J.; McNeill, A.; Pfalzner, S.; et al. The natural history of ‘Oumuamua. Nat. Astron. 2019, 3, 594–602. [Google Scholar] [CrossRef]
- Coleman, L. The ‘Oumuamua encounter: How modern cosmology handled its first black swan. Symmetry 2021, 13, 510. [Google Scholar] [CrossRef]
- Sekanina, Z. Outgassing as trigger of 1I/Oumuamua’s nongravitational acceleration: Could this hypothesis work at all? arXiv 2019, arXiv:1905.00935. [Google Scholar]
- Katz, J. Evidence against non-gravitational acceleration of 1I/2017 U1 ‘Oumuamua. Astrophys. Space Sci. 2019, 364, 51. [Google Scholar] [CrossRef] [Green Version]
- Giorgini, J.D. DASTCOM5: JPL Small-Body Data Browser; ascl: 2009.2023; Astrophysics Source Code Library: Leicester, UK, 2020. [Google Scholar]
- Britt, D.; Consolmagno, G.; Merline, W.J. Small Body Density and Porosity: New Data, New Insights. In Proceedings of the 37th Annual Lunar and Planetary Science Conference, League City, TX, USA, 13–17 March 2006; p. 2214. [Google Scholar]
- Marsden, B.G.; Sekanina, Z.; Yeomans, D. Comets and nongravitational forces. V. Astron. J. 1973, 78, 211. [Google Scholar] [CrossRef]
- Acedo, L. The flyby anomaly: A multivariate analysis approach. Astrophys. Space Sci. 2017, 362, 42. [Google Scholar] [CrossRef] [Green Version]
- Anderson, J.D.; Campbell, J.K.; Ekelund, J.E.; Ellis, J.; Jordan, J.F. Anomalous orbital-energy changes observed during spacecraft flybys of Earth. Phys. Rev. Lett. 2008, 100, 091102. [Google Scholar] [CrossRef] [Green Version]
- Rivera, P.C. Gravitational weakening of seismic origin as a driving mechanism of some astronomical anomalies. Appl. Phys. Res. 2019, 11, 10–29. [Google Scholar] [CrossRef]
- Bialy, S.; Loeb, A. Could solar radiation pressure explain ‘Oumuamua’s peculiar acceleration? Astrophys. J. Lett. 2018, 868, L1. [Google Scholar] [CrossRef] [Green Version]
- Hashimoto, T.; Inoue, A.K.; Mawatari, K.; Tamura, Y.; Matsuo, H.; Farusawa, H.; Harikane, Y.; Shibuya, T.; Knudsen, K.K.; Kohno, K.; et al. Big Three Dragons: A z = 7.15 Lyman-break galaxy detected in [O iii] 88 μm,[C ii] 158 μm, and dust continuum with ALMA. Publ. Astron. Soc. Jpn. 2019, 71, 71. [Google Scholar] [CrossRef]
- Zhao, W.; Wright, B.S.; Li, B. Constraining the time variation of Newton’s constant G with gravitational-wave standard sirens and supernovae. J. Cosmol. Astropart. Phys. 2018, 2018, 052. [Google Scholar] [CrossRef] [Green Version]
- Anderson, J.D.; Schubert, G.; Trimble, V.; Feldman, M.R. Measurements of Newton’s gravitational constant and the length of day. EPL Europhys. Lett. 2015, 110, 10002. [Google Scholar] [CrossRef] [Green Version]
Figure 1.
Relationship between and target mass.

Figure 2.
Planets’ heliocentric distance and orbital period vs. mass (no uncertainties were provided for data).
Figure 2.
Planets’ heliocentric distance and orbital period vs. mass (no uncertainties were provided for data).

Figure 3.
Martian moons’ rotation curve and mass (no uncertainties were provided for data).

Figure 4.
Comet NGA (in m/s2) vs. estimated mass (kg) (1σ uncertainties are about ±10 percent).

Figure 5.
OLS regression parameters fitted to solar system bodies.

Table 2.
Solar system data for natural experiments.
| Panel A: Planet Characteristics | ||||||||
| Mercury | Venus | Earth | Mars | Jupiter | Saturn | Uranus | Neptune | |
| Mass (kg × 1024) | 0.33 | 4.87 | 5.97 | 0.64 | 1.898 | 568 | 86.8 | 102 |
| Distance from Sun (m × 1010) | 5.79 | 10.82 | 14.96 | 22.79 | 77.86 | 143.35 | 287.25 | 449.51 |
| Orbital period (sec × 107) | 0.76 | 1.94 | 3.16 | 5.94 | 37.42 | 92.85 | 264.29 | 516.67 |
| Panel B: Calculated Parameters | ||||||||
| Distance3/Period2 × 1016 | 335.8 | 336.1 | 336.3 | 336.0 | 337.1 | 341.7 | 339.3 | 340.2 |
Table 3.
Data for planet moons.
| Moon | Phobos | Deimos | |
|---|---|---|---|
| Mass (kg) | 7.35 × 10²² | 1.06 × 10¹⁶ | 2.40 × 10¹⁵ |
| Distance from Planet (m) | 3.84 × 10⁸ | 9.38 × 10⁶ | 2.35 × 10⁷ |
| Orbital period (sec) | 2.36 × 10⁶ | 2.76 × 10⁴ | 1.09 × 05 |
| Panel B: Calculated Parameters | |||
| Distance3/Period2 × 1012 | 10.193 | 1.086 | 1.085 |
Publisher’s Note: MDPI stays neutral with regard to jurisdictional claims in published maps and institutional affiliations. |
© 2021 by the author. Licensee MDPI, Basel, Switzerland. This article is an open access article distributed under the terms and conditions of the Creative Commons Attribution (CC BY) license (https://creativecommons.org/licenses/by/4.0/).
Share and Cite
MDPI and ACS Style
Coleman, L. Additional Solar System Gravitational Anomalies. Symmetry 2021, 13, 1696. https://doi.org/10.3390/sym13091696
AMA Style
Coleman L. Additional Solar System Gravitational Anomalies. Symmetry. 2021; 13(9):1696. https://doi.org/10.3390/sym13091696
Chicago/Turabian StyleColeman, Les. 2021. "Additional Solar System Gravitational Anomalies" Symmetry 13, no. 9: 1696. https://doi.org/10.3390/sym13091696
Note that from the first issue of 2016, this journal uses article numbers instead of page numbers. See further details here.