Occurrence of Fungi and Fungal Toxins in Fish Feed during Storage


1
Institute of Natural Resource Sciences (IUNR), Zurich University of Applied Sciences, 8820 Wädenswil, Switzerland
2
Department of Fisheries & Aquaculture, Faculty of Fisheries and Marine Sciences & Technology, University of Ruhuna, 81000 Matara, Sri Lanka
*
Author to whom correspondence should be addressed.
Toxins 2020, 12(3), 171; https://doi.org/10.3390/toxins12030171
Submission received: 16 January 2020
/
Revised: 28 February 2020
/
Accepted: 6 March 2020
/
Published: 10 March 2020
(This article belongs to the Special Issue Mycotoxins in Feed: Harm to Animals)
Abstract
:Periods of unfavorable storing conditions can lead to changes in the quality of fish feeds, as well as the development of relevant mycotoxins. In the present study, a commercial fish feed was stored under defined conditions for four weeks. The main findings indicate that even storing fish feeds under unsuitable conditions for a short duration leads to a deterioration in quality. Mycotoxin and fungal contamination were subsequently analyzed. These investigations confirmed that different storage conditions can influence the presence of fungi and mycotoxins on fish feed. Notably, ochratoxin A (OTA) was found in samples after warm (25 °C) and humid (>60% relative humidity) treatment. This confirms the importance of this compound as a typical contaminant of fish feed and reveals how fast this mycotoxin can be formed in fish feed during storage.
Key Contribution: After storage for one month under conditions that can be realistic for fish farms, a commercial fish feed showed colonization with different fungi and contamination with the mycotoxin ochratoxin.
1. Introduction
Correct and balanced nutrition is an essential requirement for fish welfare in aquaculture. However, even if the optimal nutritional composition of feeds is known, properly selecting feed ingredients is a major challenge. One factor often impairing feed quality is mycotoxin contamination [1,2], which poses a serious risk to animal farming [3]. Mycotoxin contamination is often related to the increased inclusion of plant material in feeds and differences in cereal processing [1]. Furthermore, humidity and temperature levels during the storage of feed ingredients and compounded feeds strongly influence the formation of mycotoxins. Furthermore, it is expected that climate change will intensify this problem in the future [4,5,6]. Besides potential impairment of the feed quality, e.g., due to decreasing vitamin levels and changes in the nutritional composition of the feeds [7,8], bioactive and toxic compounds including mycotoxins can be formed during feed storage [9,10]. The mycotoxins that are more likely to occur during food storage and in feed ingredients and compounded feeds often include aflatoxins and ochratoxins [11,12]. Ochratoxin A (OTA), which is often produced by Aspergillus and Penicillium species [13,14,15,16], is of major concern because it is known to have a detrimental impact on vertebrates, causing teratogenic, carcinogenic, and immune-modulative effects [3,17,18,19,20,21]. However, further fungal species are also known to occur in feed ingredients and animal feeds. These include the Fusarium and Cladosporium species, which produce common mycotoxins such as deoxynivalenol (DON) zearalenone (ZEN), and fumonisins, as well as less understood compounds, such as enniatins (ENNs), beauvericin, and the rarely described Cladosporium-derived toxins [5,22,23,24,25].
Currently, guidelines recommended by the EU as well as other countries with respect to mycotoxin contamination levels in animal feeds [26,27] cannot entirely protect fish from harm [28]. Moreover, it has not yet been determined whether short-term exposure to unfavorable storage conditions can lead to the increased production of mycotoxins in fish feeds. Therefore, the present study investigated how four weeks of storage under different conditions affected the microbial colonization of a commercial fish feed (which is described in detail in Section 5.1.) and the subsequent production of a set of relevant mycotoxins.
2. Results
2.1. Storage Conditions
Containers with a volume of 10 L each were selected for the experiments. The container humidity during the storage period was consistently kept higher than 61% relative humidity (rel H) in the ‘humid & cold’ treatment (samples 1–3) and higher than 62% rel H in the ‘humid & warm’ treatment (samples 7–9). The mean values are shown in Table 1. As a result, the final feed water content of these treatments ranged from 17.9% to 22.9%. In contrast, the humidity levels of the other two treatments were kept between 13.5%–21.7% and 12.0%–38.6% rel H (‘dry & cold’ treatment, samples 4–6, and ‘dry & warm’ treatment, samples 10–12, Table 1), which resulted in a feed water content that ranged from 6.4% to 8.8% following the treatments. The temperature data loggers confirmed that the mean temperatures for the ‘humid & cold’ and ‘dry & cold’ treatments were maintained at 8–9 °C, whereas in the ‘humid & warm’ and ‘dry & warm’ treatments, temperatures ranged at stable high values from approximately 25–27.5 °C.
2.2. Changes in the Nutritional Composition
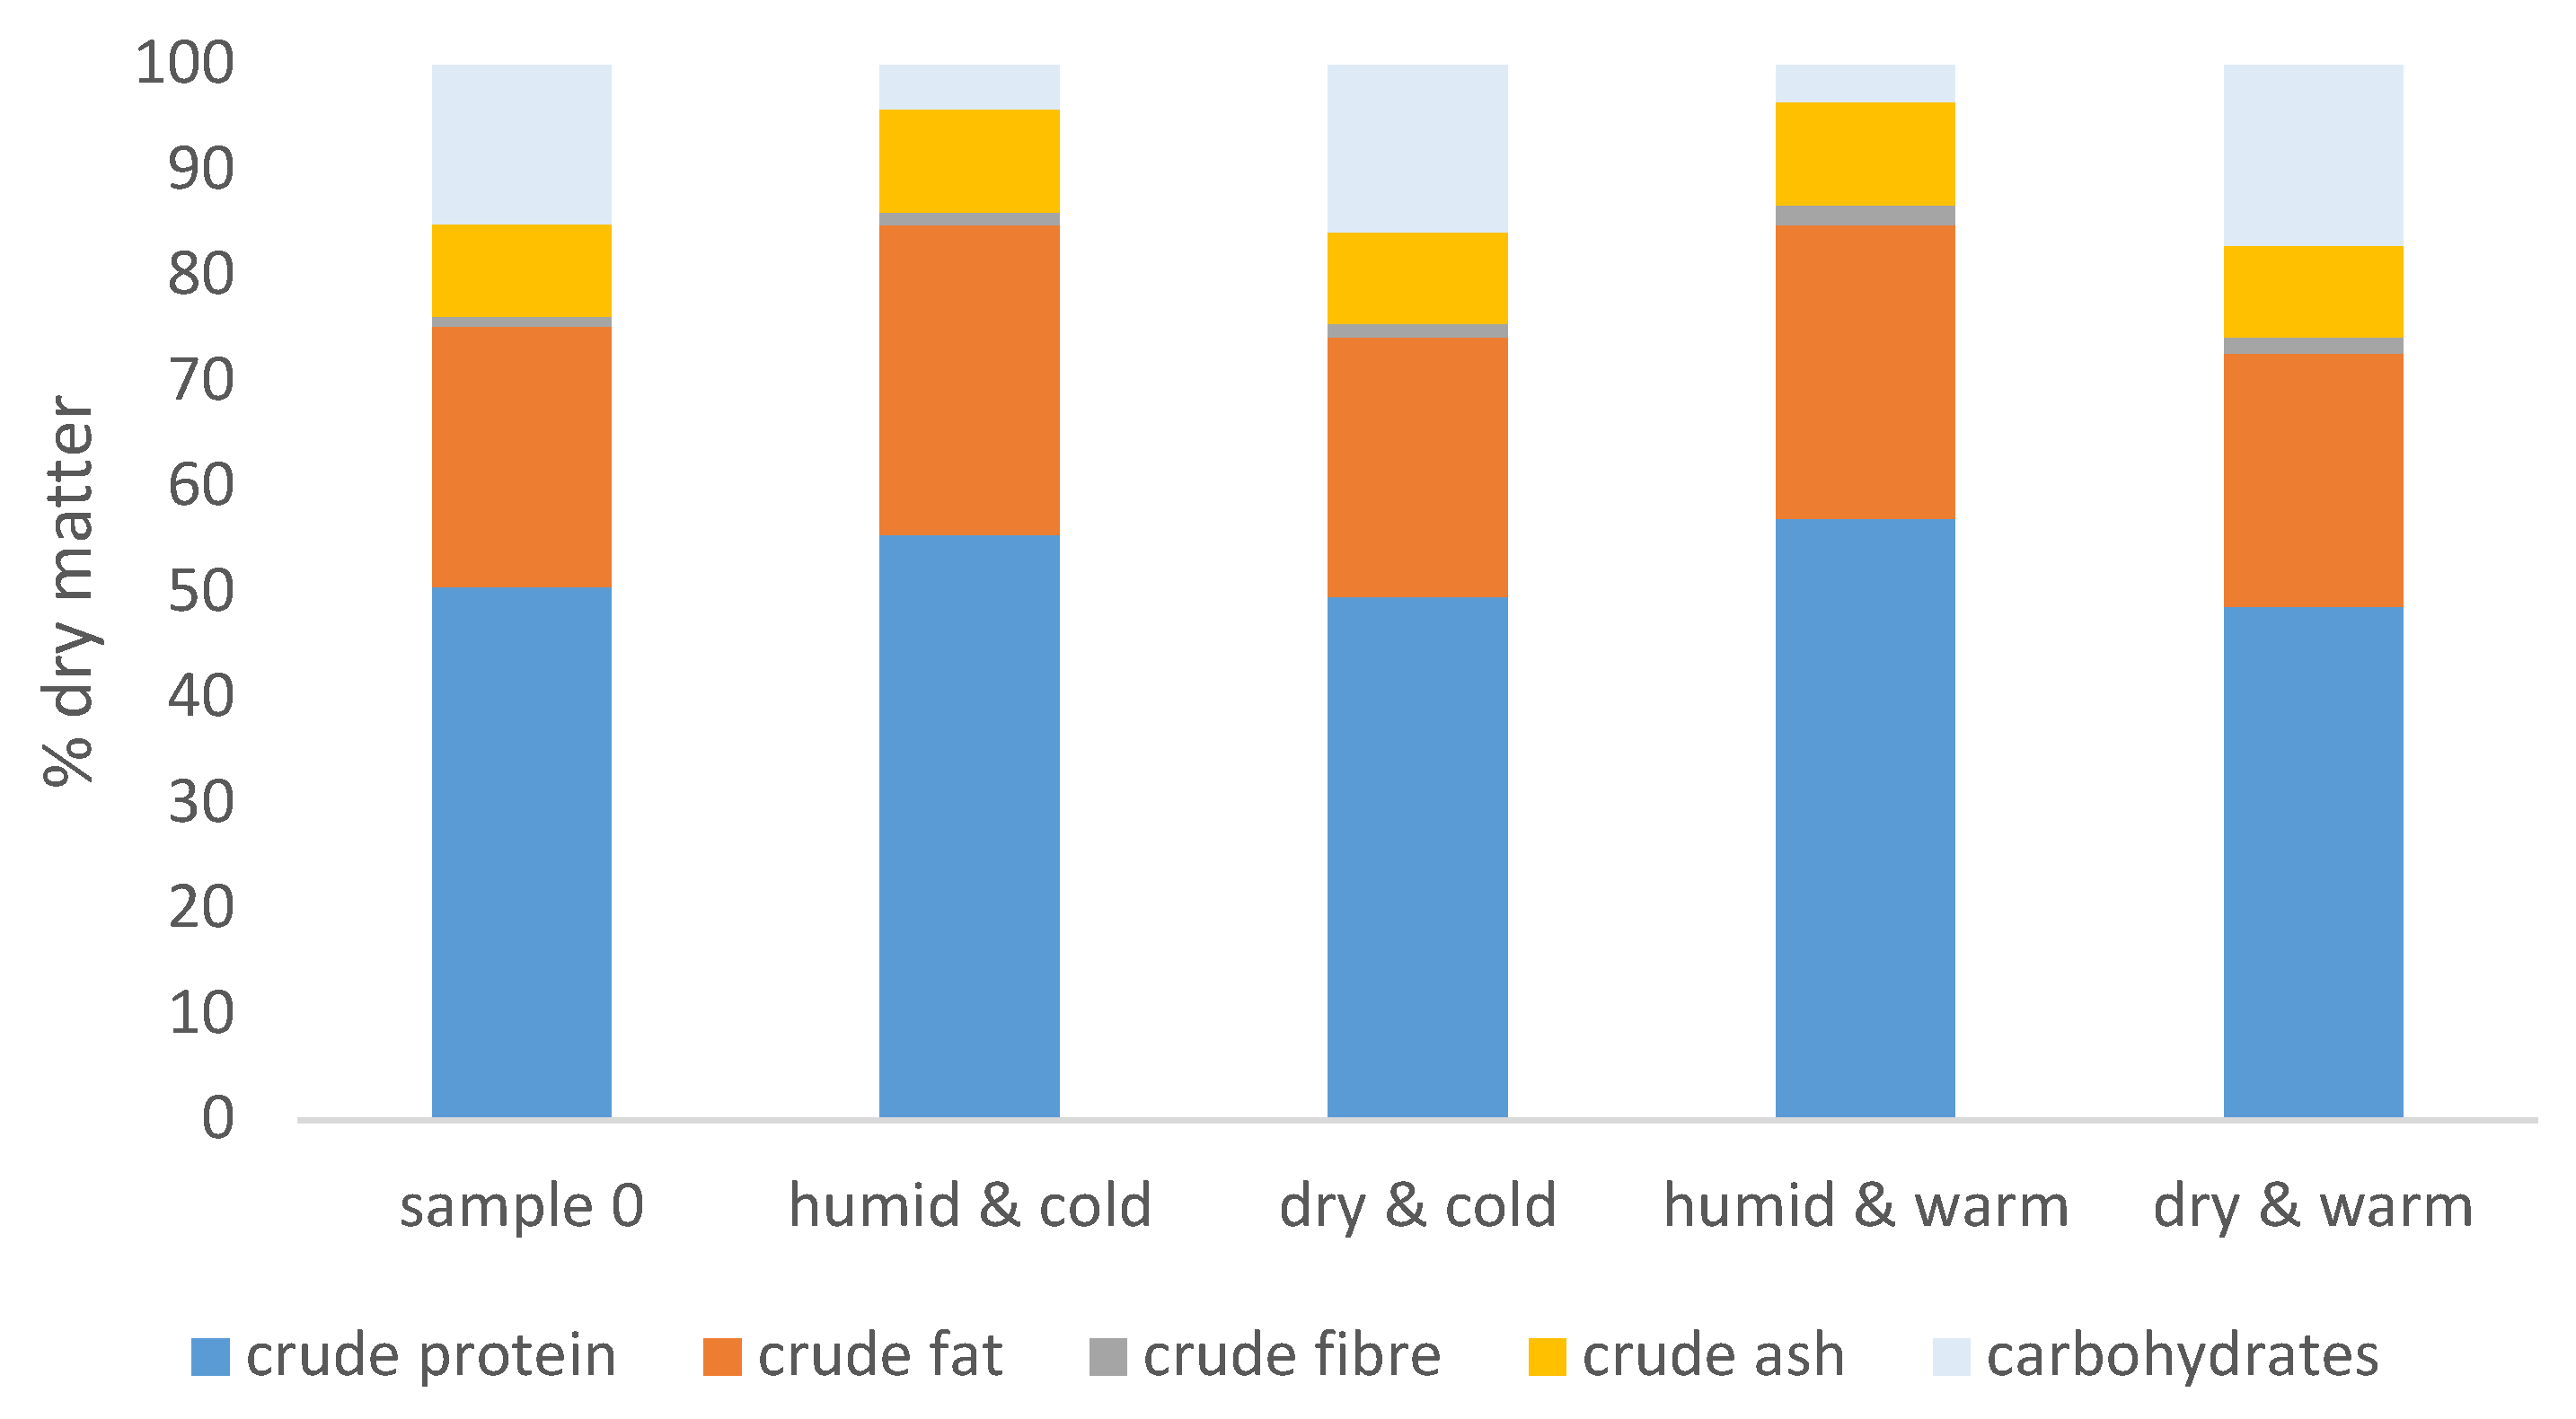
After 30 days of storage, the feeds that had been stored under ‘humid & cold’ (samples 1–3) and ‘humid & warm’ (samples 7–9) conditions resulted in a decrease in the percentage of carbohydrates in the feed compared to the composition of the feed at start of the experiments (sample 0, Figure 1).
The other two treatments (‘dry & cold’, samples 4–6, and ‘dry & warm’, samples 10–12) had no significant effect on the crude composition of the commercial feed.
2.3. Detection of Microorganisms on the Feeds
Different agarose plates yielded different fungal and bacterial colonies (Table 2). For most of the agarose plates that showed fungal growth, the number of colony forming units (cfu) was low (25–50 cfu/g feed).
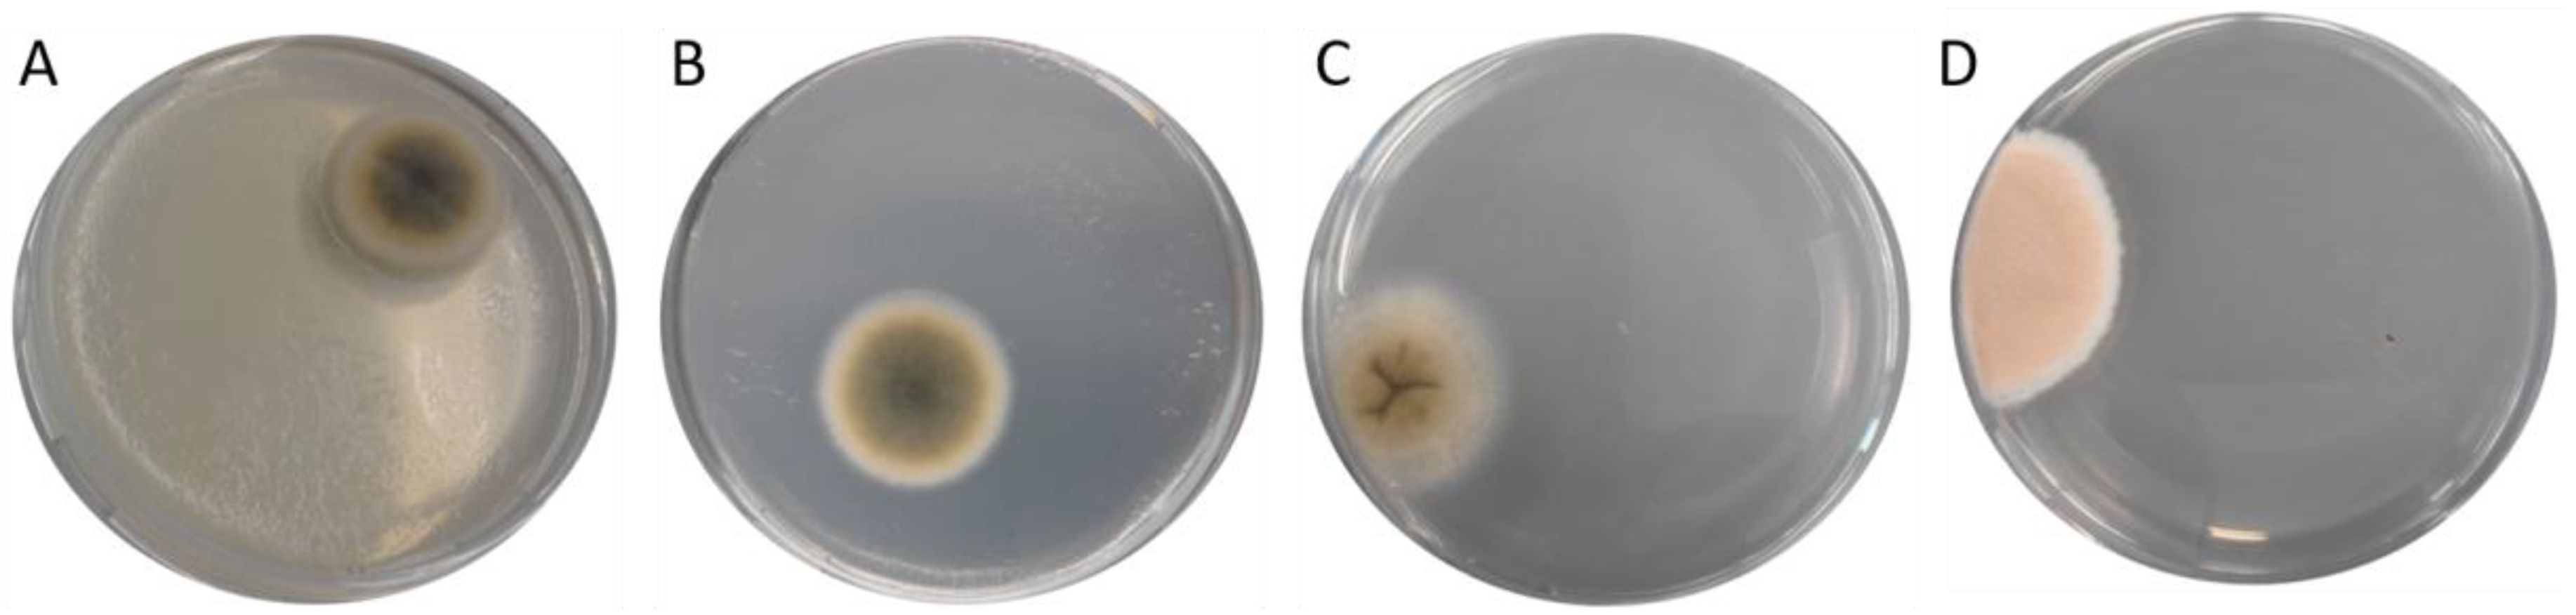
The cultivation of the different fish feed samples mixed with buffered peptone water on DG-18 plates, as described in detail in Section 5.3., favored the growth of colonies with a Cladosporium-like appearance that formed velvety, grey- or olivaceous-green colonies with a whitish edge (Figure 2A,B), as well as different light grey fungal colonies with a folded surface (Figure 2C) and orange-whitish cultures (Figure 2D).
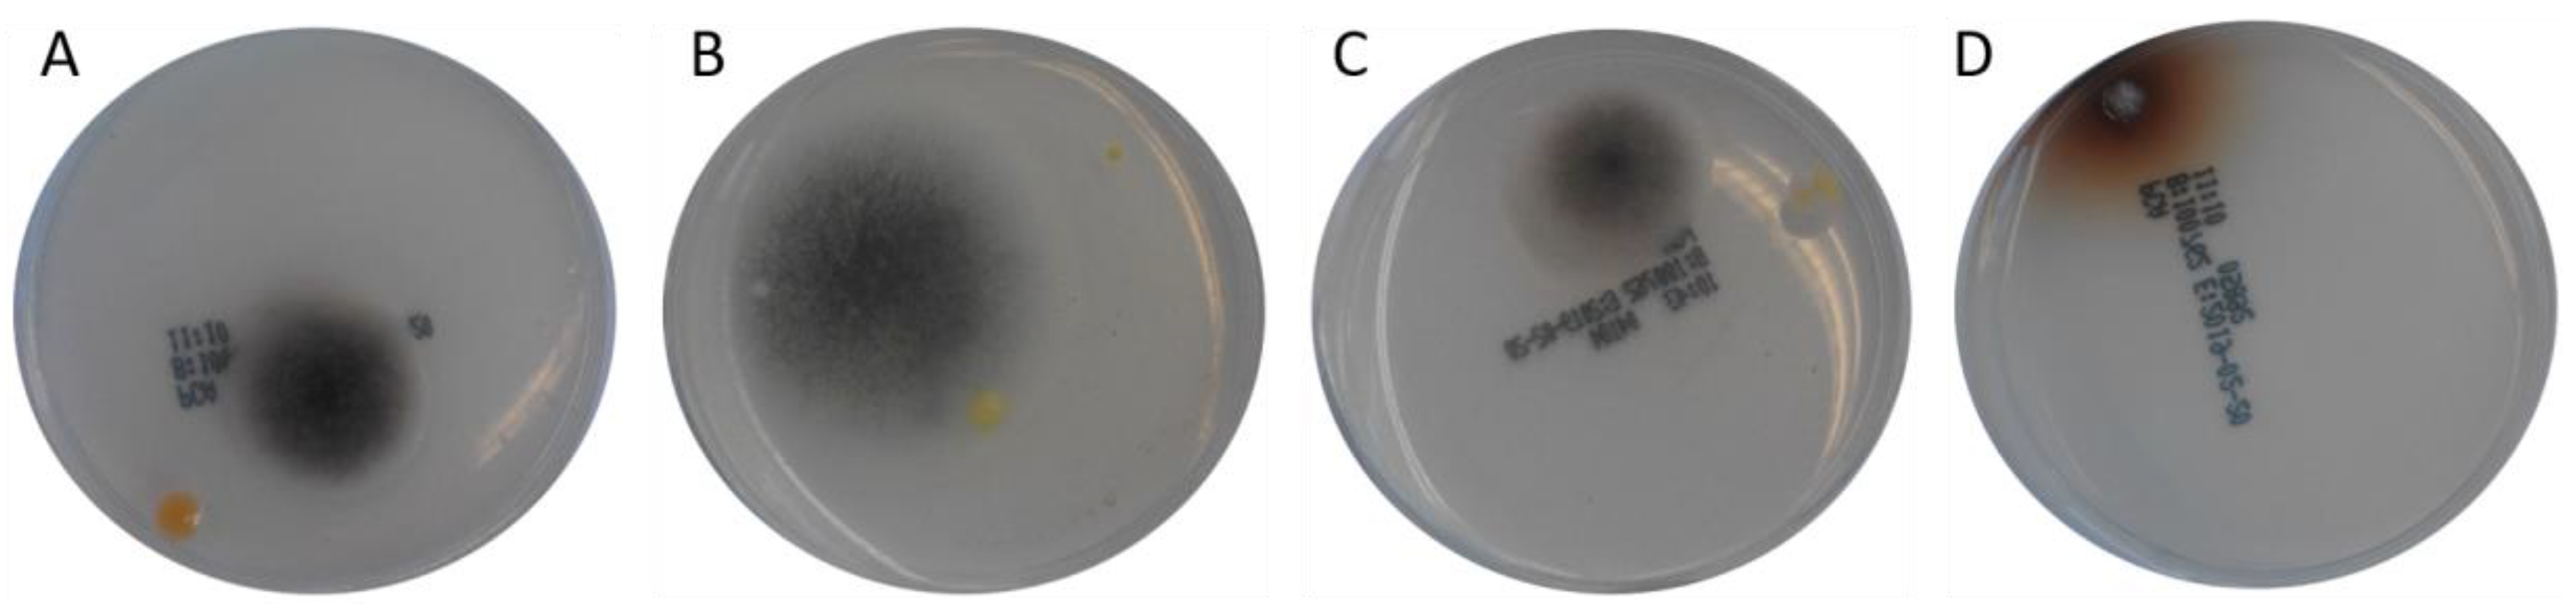
The cultivation of the different fish feed samples on PCA agarose plates resulted in the growth of fungi with a dark grey appearance (Figure 3). In addition, some yellow-colored bacterial colonies were observed on this plate type.
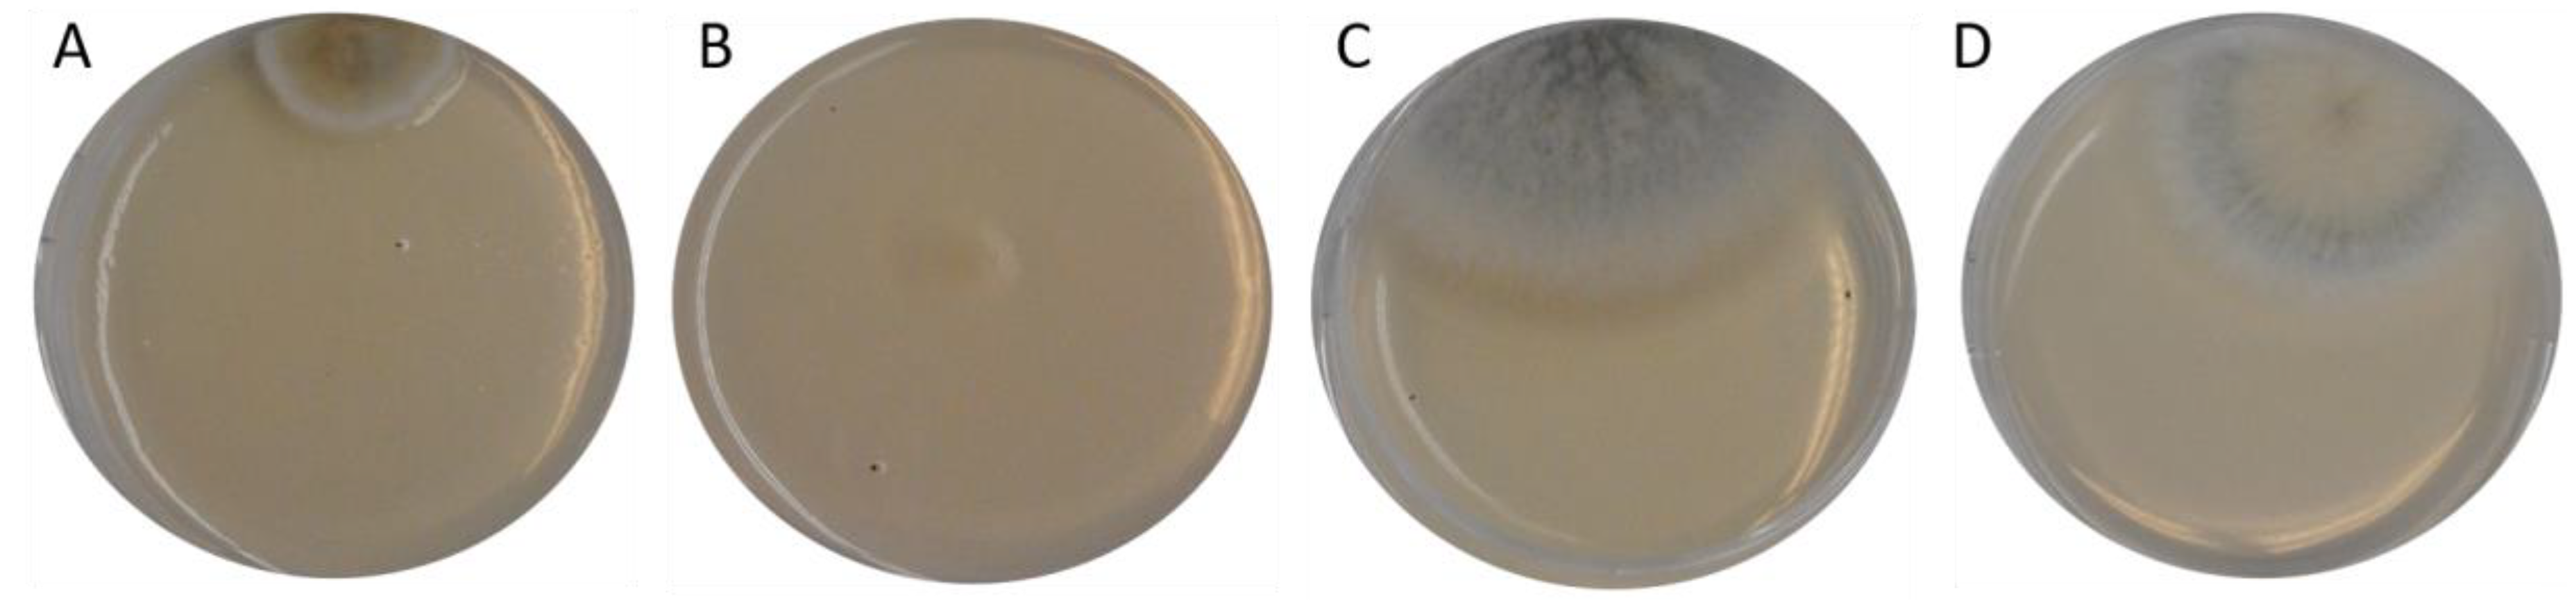
The cultivation of the different fish feed samples on the YGA plates yielded a number of fungal colonies in different treatments with a Fusarium-like or Cladosporium-like appearance (Figure 4).
2.4. Fungal Identification via PCR
The analysis of genomic DNA was successful for almost all fungi that grew on the individual agarose plates and allowed for the identification of different fungal species in the fish feed samples (Table 3, Table 4, Table 5, Table 6 and Table 7).
However, the identification of the species based on beta tubulin sequences was not completely verifiable for some fungal samples. For this reason, the three blast hits with the highest identity of the isolated sequences are listed in Table 3, Table 4, Table 5, Table 6 and Table 7 with the NCBI library entries. The fungal material that was found in the feed before the experiment (sample 0) belonged to the genus Cladosporium and the closely related genus Davidiella (Table 3).
The ‘humid & cold’ treatment (samples 1–3) resulted in the detection of similar Cladosporium/Davidiella species, as well as a fungus from feed sample 1 that showed the highest similarities to Apioplagiostoma aceriferum, a less often detected Cladosporium species (Cladosporium acalyphae), or an Alternaria species (Table 4). In addition, sample 3 showed growth of a fungi that was similar to the beta tubulin sequences of the Sclerotinia species.
The ‘dry & cold’ treatment, samples 4–6, resulted in the growth of rather similar fungal colonies compared to feed samples 1–3, but also an Aspergillus species occurred on feed sample 4 (Table 5).
The ‘humid & warm’ treatment (samples 7–9) resulted in the detection of species in the fish feed samples belonging to the Cladosporium/Davidiella and/or Aspergillus, Fusarium, and Penicillium groups (Table 6). The fungus that grew on feed sample 6 on DG-18 plates looked like a Cladosporium species on the agarose plate, but the DNA content was too low for sequencing of the beta tubulin gene.
The ‘dry & warm’ treatment, samples 11–12, resulted in the detection of the Cladosporium/Davidiella species and an Aspergillus species in the cultured colonies on the respective agarose plates (Table 7). For sample 10, no fungal colonies could be observed on any of the agarose types.
2.5. Mycotoxin Analyses
After grinding, the feed samples were sent to an analytical lab and showed concentrations lower than the quantification limit for most of the assessed mycotoxins (Table 8). In addition, for DON, no relevant difference to the toxin concentration in the feed at the start of the experiment (sample 0) was observed. In contrast, the OTA content in the feed samples was increased in samples 7–9 due to the ‘humid & warm’ treatment in comparison to all the other samples.
The concentrations of ENNs in the feeds were analyzed at the start of the experiment and only in the ‘humid & warm’ samples (samples 7–9). Accordingly, a low amount of ENN B was detectable in sample 0 and a slightly higher value was measured in sample 8, but not in samples 7 and 9.
3. Discussion
3.1. Influence of Storage Conditions on the Nutritional Composition of the Feeds
Long-term storage is known to influence the chemical composition of animal feeds [8,29,30], but sufficient information on effects of shorter storage periods is lacking. Compared with the nutritional composition of the feed at the start of the experiments, storage for four weeks at humid conditions influenced the carbohydrate ratio in the fish feeds. This is typical for fungal growth on cereals, since fungi prefer to digest carbohydrates [31]. Other studies have also shown that fungal colonization influences the nutritional composition of fish feeds and, consequently, the growth performance of fish [32]. This is supported by Piotrowska et al. [33], who stated that Penicillium, Mucor, and Eurotium infestation in feed materials shorten the storage life of the feedstuff.
3.2. Microbiological Colonization of Feed Samples
Generally, the numbers for colony forming units (cfu) for the fungal colonies were low, and the fish feeds would have been suitable for animal feeding according to the VDLUFA guidelines [34]. The fungi that were observed on the agarose plates belonged to categories 4 and 5 of the guidelines, whereby especially the Aspergillus and Penicillium species belonging to category 5 are assumed to have an adverse effect on the quality of feeds. The number of growing microorganisms on the agarose plate type was slightly different for each treatment. Bacterial growth was observed on a number of agarose plates (namely on PCA plates for the ‘dry & cold’ treatment), but PCA plates are unselective plates and a number of different microorganisms can be cultured on them. In addition, the present study showed that mainly dark grey fungi belonging to the Cladosporium/Davidiella complex were obtained from the PCA plates, but their morphological appearance was different from what was observed on DG-18 plates. Therefore, the PCA seem to be unsuitable for broader fungal screening. The TSA-TCC plates yielded a number of fungal colonies, but these agarose plates are more suitable for the selective growth of bacterial colonies. The inclusion of chloramphenicol successfully suppressed bacterial growth on the YGA and Bengal Red agarose plates (Table 2), so these plate types appear to be the most suitable for detecting different fungal colonization on fish feeds.
3.3. Identification of Fungi
The typical fungi found in fish feeds are the Aspergillus, Penicillium, Cladosporium, and Fusarium species [35,36], which was confirmed by the present study. The occurrence of fungi in compounded animal feeds is certainly influenced by the selection of the ingredients and the milling process prior to feed production, since the Alternaria, Cladosporium, and Fusarium species have been reported to be more frequent on grain surfaces [23]. Furthermore, the presence of the Aspergillus, Penicillium, and Cladosporium/Davidiella species in the fish feeds confirmed previous reports [35,36], but the growth of the individual fungal species also varies with the storage conditions of the feed. The Cladosporium/Davidiella species that were identified in the feed at the start of the experiment were also identified in most of the subsequently treated feed samples. Moreover, the samples stored under cold conditions showed similarities in the occurrence of fungal colonies on the agarose plates, despite the detection of Sclerotinia nivalis in sample 3.
Aspergillus fumigatus was detected in 1 sample from the feed stored under colder conditions and in two samples from the treatments stored under warmer conditions. A. fumigatus favors warmer conditions for growth and mycotoxin production [37]. Thus, it was not surprising that a study from Egypt mostly identified the Aspergillus species, as well as Penicillium bervicompactum, P. corylophylum, P. camemberti, P. quercetorum, and P. virdicatum, and rather low aflatoxin levels in 25 feeds for Nile tilapia, Oreochromis niloticus [38]. Moreover, the less typical fungal species strain P. chrysogenum was identified in sample 9, as well as in in fish feed ingredients from East Africa [39]. Generally, Aspergillus, Penicillium, Cladosporium, and some Davidiella species can also occur as fungal contaminants in buildings [40], which may indicate that not all fungal spores that can be found in feed samples originate from the contamination of feed ingredients before harvest. Therefore, a more concise approach for an analytical study should include all feed ingredients and the resulting feed samples in order to describe the origin of the fungal contaminants in more detail.
3.4. Storage Conditions and Mycotoxin Formation
The optimal growth conditions of fungi differ for each species and, even more importantly, the optimal conditions for individual toxin production differ as well [33]. Therefore, the occurrence of fungal material does not necessarily mean that mycotoxin production also takes place [35].
Several mycotoxins may pose a risk to farmed fish [28], the most important of which was also included in the present study. The Fusarium species often occur on cereals [24] and show broad morphological differences and are therefore difficult to identify based on their appearance on agarose plates and their resistance to antimycotics [41]. The Fusarium species often prefer higher water activity (>0.86) and can grow at different temperatures depending on the species [42]. The Fusarium merismoides that were identified in sample 7 are a less common contaminant of food but have been found, for example, in potatoes [43], and have frequently been detected in soil samples [44,45]. In addition, this group appears to be close to the Fusicolla group, which has also been linked to the Fusarium species complex [46]. Surprisingly, the Fusarium species was rarely identified in the experimental feeds in the present study and typical Fusarium-related mycotoxins were therefore not detected at relevant concentrations in any of the feed samples. However, the capacity of the Fusarium species to produce mycotoxins may vary widely, and Fusarium merismoides may not have the biosynthetic genes to produce ZEN or trichothecenes [43,47].
In the present study, only the ‘dry & warm’ treatment resulted in significant formation of the OTA mycotoxin. High water activity and temperatures between 24–31 °C also favored OTA production in coffee [19]. However, the OTA concentrations that were reached in the experimental feeds from the ‘warm & humid’ treatment may be assumed as problematic for farmed fish [28]. Nevertheless, although it has been previously assumed that OTA commonly co-occurs with other mycotoxins in naturally contaminated feeds [28], this was not confirmed by the present study despite some minor occurrence of ENN B and DON. OTA commonly co-occurs with citrinin, but their production also depends on external factors such as light, despite the known regulation of temperature and water activity [48].
In temperate regions, OTA contamination is often linked to the occurrence of the Penicillium verrucosum infections, but it has been shown in warmer regions where the Aspergillus species, e.g., A. carbonarius, could also account for OTA production [3,18,19]. In addition, the ability of other Penicillium species to produce OTA has been reported in some studies or may have been based on possible incorrect identification of the P. cyclopium, P. viridicatum, and P. chrysogenum species [21,49]. However, P. chrysogenum was identified in sample 9 along with a small increase in OTA contamination after four weeks of treatment, which may indicate that some P. chrysogenum strains are capable of OTA formation. The ability of P. chrysogenum to produce OTA is supported by previous work from Zhang et al. [50].
The ingredients that are selected for fish feed production clearly influence the potential mycotoxin contamination of compounded feeds [28,51], and in addition to the results from the present study, it would have been interesting to use different fish feeds containing more plant-based ingredients for a similar study. The feed ingredients that often contain OTA are cereals or soybeans and corn [28]. However, these ingredients were not used at high percentages in the feed used for the present study. Therefore, the OTA concentration in the feed at the start of the experiment was low. Higher OTA concentrations were observed in the feed samples of the ‘warm & humid’ treatment after four weeks, and the formation of OTA in samples 7 to 9 could be related to the detection of the Aspergillus and Penicillium species, which are generally known to be capable of OTA production [18,19,20,21]. However, the ability of the Aspergillus species to produce mycotoxins has been related to the activity of certain genes [52], and Aspergillus fumigatus is known to produce mycotoxins such as gliotoxin and fumagillin [53] with a currently unknown impact on fish.
It is also notable that the toxin concentrations in the same treatment may show considerable differences between the three replicates of the ‘warm & humid’ treatment. The heterogeneous distribution of OTA has already been described in stored grain. The reasons for these differences have been related to the fungal growth that commonly occurs at distinct hot spots. These provide conditions such as high water activity that supports fungal growth and toxin production. This variation causes considerable difficulty in measuring accurate OTA contamination levels in feed ingredients and feeds at the industrial level [18].
Mycotoxins produced by Cladosporium or the closely related the Davidiella species have rarely been described [5,54] and their effects on fish are unknown. Moreover, the fact that the two fungal colonies from samples 1 and 4 grown on DG-18 agarose plates were grouped as a Cladosporium or an Alternaria species is not entirely surprising, since according to more recent studies, at least some fungi previously sorted into the heterogeneous Cladosporium group should have been identified as the genus Alternaria instead [55]. However, the aforementioned fungal colonies from samples 1 and 4 may also belong to the genus Apioplagiostoma aceriferum, a fungal species that occurs on certain tree species [56,57]. Alternaria has been known to colonize on fish feeds [58], but similar reports for Apioplagiostoma are lacking. Moreover, the Sclerotinia species have been found on soybean, beans, canola [59], and linseed [60], which may indicate that the occurrence of this group of fungi in animal feed originates from contaminated feed ingredients. Seeing that this fungal group was only identified in sample 3 from the ‘cold & humid’ treatment, it could be related to the fact that S. sclerotiorum prefers temperatures lower than 20 °C [61].
Taken together, the findings in the present study show that the selection of feed ingredients and the storage conditions of the final feeds have a profound influence on the presence of fungal species on fish feeds. Nevertheless, a wider variety of fish feeds and mycotoxins should be investigated under different storage conditions.
3.5. Potential Effects on Fish
In vertebrates, including fish, OTA mainly affects the kidney and the liver, and OTA was also found to be teratogenic, carcinogenic, and immunotoxic [3,15,16,17,18,62]. Besides, embryotoxicity has been observed in amphibians and rodents, chicken, and fish [13,16,63,64,65,66]. Exposure by injection also had lethal consequences for rainbow trout with a concentration of 4.7 mg OTA per kg body weight being lethal to 50% of the animals [67]. Although not often conducted until now, some feeding experiments with different fish species have also shown detrimental effects of feed-borne OTA. Accordingly, channel catfish (Ictalurus punctatus), Nile tilapia, and sea bass (Dicentrarchus labrax) have shown reduced growth performance and survival at concentrations ranging from 300 to 4800 μg OTA per kg feed [62,68,69], whereas Atlantic salmon (Salmo salar) showed fast OTA elimination [70] and low sensitivity to this toxin [71]. In addition, Nile tilapia has also shown a change in the nutrient composition of the carcass [69].
The fungal species belonging to the Cladosporium group have not been described sufficiently, as this group is rather heterogeneous and polyphyletic, and contains several hundred different species at the moment [72]. Cladosporium are widely distributed in our environment [73]. It has been proposed that Cladosporium species prefer temperatures of less than 25 °C and humid culture conditions for growth and spore formation [74], which probably also applies to mycotoxin production. For the teleomorph Cladosporium species, the separate group Davidiella has been established [55]. Although no toxin production has been reported for the Davidiella species so far, the Cladosporium species are capable of producing a high variety of mycotoxins with mostly unknown consequences for farm animals [5]. The common occurrence of the Cladosporium species on the fish feed samples may, therefore, have more toxic consequences for fish than can be assumed by the confirmed occurrence of DON, ENN B, and OTA.
4. Conclusions
Fish feed storage under warm and humid conditions changes the quality of the feed and leads to the formation of mycotoxins. In the present study, the storage of a fishmeal-based fish feed under these conditions for one month resulted in a relevant amount of the mycotoxin OTA. Since OTA is a highly toxic mycotoxin, and based on current knowledge, which shows that it can even cause toxic effects in fish at an OTA concentration of approximately 20 μg/kg [28], this feed has to be assumed to be unsuitable for feeding to farmed fish. In a future study, a more plant-based fish feed should be selected for similar investigations, since aquaculture feeds increasingly contain plant materials.
5. Methods
5.1. Storage Conditions
For each treatment, 3.5 kg of a commercial trout feed (containing fishmeal, fish oil, wheat, wheat gluten, chicken offal meal, dextrose, wheat germ oil, linseed oil, blood meal, yeast, vitamins, and minerals, resulting in a composition as published by the manufacturer of 45% crude protein, 23% crude fat, and 8.8% water) were added to a 10-L plastic container. Four different storage conditions were chosen, which are shown in Table 9. The temperature in the treatment was maintained by adjusting the ambient temperature in the storage room. The humidity was adjusted by adding 350 g of water or using 500 g of silica gel per container. To prevent water loss from the containers, these were sealed with silicon. The relative humidity as% rel H and temperature values were monitored every 2 h using data loggers (iButton®, Maxim Integrated, San Jose, CA, USA). The values were monitored over the entire duration of the experiment, except for sample 10, which was monitored for only 22 days due to a subsequent loss of electricity that prevented further monitoring.
5.2. Nutritional Composition of the Feeds
The nutritional composition of the experimental diets was determined after drying the feed samples at 60 °C for 48 h followed by grinding. The lipid content of the fish feeds was determined using the Soxhlet method. Furthermore, the fish feeds were analyzed for dry matter (DM) (105 °C, until constant weight), and crude ash (550 °C, 12 h). The crude protein (according to the method VDLUFA 4.1.1. [75]) and crude fiber contents were determined by an external lab (Biolytix AG, Witterswil, CH). The carbohydrate fraction could then be estimated by subtraction of the nutrients mentioned above.
5.3. Detection of Microorganisms on the Feeds
Different agarose plates were used for cultivation of the microorganisms, since the agarose selection can also influence the growth of the bacterial and fungal species that can be achieved. Accordingly, Roti®-Aquatest plate PCA were used directly, whereas yeast-glucose-agarose (YGA) containing chloramphenicol, tryptone-soya-agarose (TSA) supplemented with 2,3,5-triphenyl-tetrazolium chloride (TTC), dichlorane-glycerine-agarose (DG-18), and Bengal Red agarose (containing chloramphenicol) plates were prepared in sterile petri dishes (material: PS, diameter: 5 cm) according to the supplier’s protocols (Carl Roth AG, Arlesheim, Switzerland). After solidification, the feed samples were applied. For this, 5 g of ground feed material was dispersed in 50 mL of buffered 0.1% peptone water. The samples were mixed, incubated at room temperature for 30 min, and centrifuged. A volume of 200 μL of the supernatant was then dispersed on the different agarose plates in duplicate. The plates were incubated in a Multitron Pro incubator (Infors AG, Bottmingen, Switzerland) at 25 °C for a maximum 96 h. After this, microbial colonization, the colony appearance, its structure and color was recorded, and the plates were stores at −20 °C for further analysis.
5.4. Fungal Identification via PCR
Genomic DNA was isolated using the DNeasy Plant Mini Kit (Qiagen AG, Hombrechtikon, Switzerland). The obtained DNA was used for PCR fungal species identification. For this, the kappa poymerase (Kappa Biosystems, Cape Town, South Africa) was used according to the manufacturers manual. As primers, the already published primer pairs Bt1 (5′-TTCCCCCGTCTCCACTTCTTCATG-3′ and 5′-GACGAGATCGTTCATGTTGAACTC-3′) and Bt2 (5′-GGTAACCAAATCGGTGCTGCTTTC-3′ and 5′-ACCCTCAGTGTAGTGACCCTTGGC-3′) [76] were included to analyze the beta tubulin region of ascomycetes. The PCR products were visualized on an 1.5% agarose gel containing GelRedTM (Biotium, obtained from Chemie Brunschwig, Basel, Switzerland) after electrophoresis for 1 h at 80 V (Figure 5).
Prior to sequencing, the PCR products were purified using the NucleoSpin® Gel and PCR Clean-up kits by Macherey-Nagel AG (Oensingen, Switzerland). The Sanger sequencing was performed by the Microsynth AG (Balgach, Switzerland) followed by blasting via the National Center for Biotechnology Information (NCBI, available at https://www.ncbi.nlm.nih.gov).
5.5. Toxin Analyses
At least 100 g of the ground feed samples were dried at 60 °C and sent to an analytical lab (Eurofins Scientific AG, Schönenwerd, Switzerland) for analysis of the different mycotoxins by means of a LC-MS/MS method. All toxin levels were calculated as μg per kg dry matter.
Author Contributions
Conceptualization, C.P.; methodology, C.P.; formal analysis, C.P.; investigation, C.P., G.M., S.C., S.M. and K.B.; resources, C.P.; data curation, C.P.; writing—original draft preparation, C.P.; writing—review and editing, C.P., S.M. and K.B.; visualization, C.P.; supervision, C.P.; project administration, C.P.; funding acquisition, C.P. and K.B. All authors have read and agreed to the published version of the manuscript.
Funding
The stay of K.B. at the Zurich University of Applied Sciences was supported by a mobility grant of the Leading House South Asia and Iran of the ZHAW School of Management and Law, Winterthur, Switzerland mandated by the State Secretariat for Education, Research and Innovation (SERI) in Switzerland.
Acknowledgments
The language check of the entire manuscript by Jason R. Parry (ZHAW, Wädenswil, CH) is highly appreciated.
Conflicts of Interest
The authors declare that there are no conflicts of interest regarding the publication of this paper.
References
- Binder, E.M.; Tan, L.M.; Chin, J.; Handl, J.; Richard, J. Worldwide occurrence of mycotoxins in commodities, feeds and feed ingredients. Anim. Feed Sci. Technol. 2007, 137, 265–282. [Google Scholar] [CrossRef]
- Rodrigues, I.; Naehrer, K. Prevalence of mycotoxins in feedstuffs and feed surveyed worldwide in 2009 and 2010. Phytopathol. Mediterr. 2012, 51, 175–192. [Google Scholar]
- Duarte, S.C.; Lino, C.M.; Pena, A. Ochratoxin A in feed of food-producing animals: An undesirable mycotoxin with health and performance effects. Vet. Microbiol. 2011, 154, 1–13. [Google Scholar] [CrossRef] [PubMed]
- Duarte, S.C.; Pena, A.; Lino, C.M. A review on ochratoxin A occurrence and effects of processing of cereal and cereal derived food products. Food Microbiol. 2010, 27, 187–198. [Google Scholar] [CrossRef] [PubMed]
- Alwatban, M.A.; Hadi, S.; Moslem, M.A. Mycotoxin production in Cladosporium species influenced by temperature regimes. J. Pure Appl. Microbiol. 2014, 8, 4061–4069. [Google Scholar]
- Magan, N.; Medina, A.; Aldred, D. Possible climate-change effects on mycotoxin contamination of food crops pre- and postharvest. Plant Pathol. 2011, 60, 150–163. [Google Scholar] [CrossRef]
- Soliman, A.K.; Jauncey, K.; Roberts, R.J. Stability of L-ascorbic acid (vitamin C) and its forms in fish feeds during processing, storage and leaching. Aquacult 1987, 60, 73–83. [Google Scholar] [CrossRef]
- Alabi, J.O.; Fafiolu, A.O.; Oso, A.O.; Jegede, A.V.; Dada, I.D.; Teniola, A.A.; Oluwatosin, O.O. Physico-chemical and compositional changes in proprietary finished feeds stored under different conditions. Archivos de Zootecnia 2017, 66, 535–541. [Google Scholar] [CrossRef] [Green Version]
- Laohabanjong, R.; Tantikitti, C.; Benjakul, S.; Supamattaya, K.; Boonyaratpalin, M. Lipid oxidation in fish meal stored under different conditions on growth, feed efficiency and hepatopancreatic cells of black tiger shrimp (Penaeus monodon). Aquacult 2009, 286, 283–289. [Google Scholar] [CrossRef]
- Tola, M.; Kebede, B. Occurrence, importance and control of mycotoxins: A review. Cogent Food Agricult. 2016, 2, 1191103. [Google Scholar] [CrossRef]
- Villers, P. Aflatoxins and safe storage. Front. Microbiol. 2014, 5, 158. [Google Scholar] [CrossRef] [PubMed] [Green Version]
- Scudamore, K.A. Prevention of ochratoxin A in commodities and likely effects of processing fractionation and animal feeds. Food Addit. Contam. 2005, 22, 17–25. [Google Scholar] [CrossRef] [PubMed]
- EFSA, Opinion of the scientific panel on contaminants in the food chain on a request from the commission related to ochratoxin A in food. EFSA J. 2004, 101, 1–36.
- Noonim, P.; Mahakarnchanakul, W.; Varga, J.; Samson, R.A. Aspergilli and ochratoxin A in coffee. In Aspergillus in the Genomic Era; Varga, J., Samson, R.A., Eds.; Wageningen Academic Publishers: Wageningen, The Netherlands, 2008; pp. 213–231. [Google Scholar]
- Taniwaki, M.H. An update on ochratoxigenic fungi and ochratoxin A in coffee. In Advances in Experimental Medicine and Biology, 57, 1st ed.; Hocking, A.D., Pitt, J.I., Samson, R.A., Thrane, U., Eds.; Springer Science: New York, NY, USA, 2005; pp. 189–202. [Google Scholar]
- Cabañes, F.J.; Bragulat, M.R.; Castellá, G. Ochratoxin A producing species in the genus Penicillium. Toxins (Basel) 2010, 2, 1111–1120. [Google Scholar] [CrossRef] [PubMed]
- Brown, M.H.; Szczech, G.M.; Purmalis, B.P. Teratogenic and toxic effects of ochratoxin A in rats. Toxicol. Appl. Pharmacol. 1976, 32, 331–338. [Google Scholar] [CrossRef]
- Kőszegi, T.; Poór, M. Ochratoxin a: Molecular interactions, mechanisms of toxicity and prevention at the molecular level. Toxins (Basel) 2016, 8, 111. [Google Scholar] [CrossRef]
- Boorman, G.A. Toxicology and carcinogenic studies of ochratoxin A (CAS No. 303-47-9) in F344/n rats (gavage studies). Natl. Toxicol. Program Tech. Rep. Ser. 1989, 358, 1–142. [Google Scholar]
- Arora, R.G.; Frölén, H.; Fellner-Feldegg, H. Inhibition of ochratoxin a teratogenesis by zearalenone and diethylstilboestrol. Food Chem. Toxicol. 1983, 21, 779–783. [Google Scholar] [CrossRef]
- Zahran, E.; Manning, B.; Seo, J.K.; Noga, E.J. The effect of ochratoxin A on antimicrobial polypeptide expression and resistance to water mold infection in channel catfish (Ictalurus punctatus). Fish Shellfish Immunol. 2016, 57, 60–67. [Google Scholar] [CrossRef] [Green Version]
- Caldwell, R.W.; Tuite, J.; Stob, M.; Baldwin, R. Zearalenone production by Fusarium species. Appl. Microbiol. 1970, 20, 31–34. [Google Scholar] [CrossRef] [Green Version]
- Semaskiene, R.; Mankeviciene, A.; Dabkevicius, Z.; Leistrumaite, A. Toxic fungi infection and mycotoxin level in organic grain. Bot. Lith 2005, 7, 17–25. [Google Scholar]
- Nicolaisen, M.; Suproniene, S.; Nielsen, L.K.; Lazzaro, I.; Spliid, N.H.; Justesen, A.F. Real-time PCR for quantification of eleven individual Fusarium species in cereals. J. Microbiol. Methods 2009, 76, 234–240. [Google Scholar] [CrossRef] [PubMed]
- Tolosa, J.; Font, G.; Mañes, J.; Ferrer, E. Natural occurrence of emerging Fusarium mycotoxins in feed and fish from aquaculture. J. Agric. Food Chem. 2014, 62, 12462–12470. [Google Scholar] [CrossRef] [PubMed]
- European Commission, Commission Recommendation of 17 August 2006 on the presence of deoxynivalenol, zearalenone, ochratoxin A, T-2 and HT-2 and fumonisins in products intended for animal feeding. Off. J. Eur. Union 2006, L229, 7–9. Available online: https://eur-lex.europa.eu/legal-content/EN/TXT/PDF/?uri=CELEX:32006H0576&from=EN (accessed on 10 January 2020).
- Van Egmond, H.P.; Jonker, M.A. Worldwide Regulations for Mycotoxins in Food and Feed in 2003; Food and Agriculture Organization of the United Nation: Rome, Italy, 2004; p. 81. Available online: http://www.fao.org/3/y5499e/y5499e00.htm (accessed on 10 January 2020).
- Pietsch, C. Risk assessment for mycotoxin contamination in fish feeds in Europe. Mycotoxin Res. 2020, 36, 41–62. [Google Scholar] [CrossRef] [PubMed] [Green Version]
- Mongkon, W.; Sugita-Konishi, Y.; Chaisri, W.; Suriyasathaporn, W. Aflatoxin B1 contamination of dairy feeds after storage in farm practice in tropical environment. Biocontr. Sci. 2017, 22, 41–45. [Google Scholar] [CrossRef] [PubMed] [Green Version]
- Milani, J.M. Ecological conditions affecting mycotoxin production in cereals: A review. Vet. Med. 2013, 58, 405–411. [Google Scholar] [CrossRef]
- Bhattacharya, K.; Raha, S. Deteriorative changes of maize, groundnut and soybean seeds by fungi in storage. Mycopathologia 2002, 155, 135–141. [Google Scholar] [CrossRef]
- Zmysłowska; Lewandowska, D. The effect of storage temperatures on the microbiological quality of fish feeds. Polish J. Environ. Stud. 2000, 3, 223–226. [Google Scholar]
- Piotrowska, M.; Slizewska, K.; Biernasiak, J. Mycotoxins in cereal and soybean-based food and feed. In Soybean—Pest Resistance; El-Shemy, H.A., Ed.; Intech: Rijeka, Croatia, 2013; pp. 185–230. Available online: https://www.intechopen.com/books/soybean-pest-resistance/mycotoxins-in-cereal-and-soybean-based-food-and-feed (accessed on 10 January 2020).
- Verband Deutscher Landwirtschaftlicher Untersuchungs-und Forschungsanstalten e.V. VDLUFA. Futtermitteluntersuchung: Verfahrensanweisung Identifizierung. Verfahrensanweisung zur Identifizierung von Bakterien, Hefen, Schimmel- und Schwärzepilzen als produkttypische oder verderbanzeigende Indikatorkeime. Verfahrensanweisung Identifizierung 28.1.3. In Methodenbuch III, 8. Erg; VDLUFA-Verlag: Darmstadt, Germany, 2012; p. 11. Available online: https://www.vdlufa.de/Methodenbuch/ (accessed on 10 January 2020).
- Almeida, I.F.M.; Martins, H.M.L.; Santos, S.M.O.; Freitas, M.S.; da Costa, J.M.G.N.; d’Almeida Bernardo, F.M. Mycobiota and aflatoxin B1 in feed for farmed sea bass (Dicentrarchus labrax). Toxins (Basel) 2011, 3, 163–171. [Google Scholar] [CrossRef] [Green Version]
- Greco, M.; Pardo, A.; Pose, G. Mycotoxigenic fungi and natural co-occurrence of mycotoxins in rainbow trout (Oncorhynchus mykiss) feeds. Toxins (Basel) 2015, 7, 4595–4609. [Google Scholar] [CrossRef] [PubMed]
- Belkacemi, L.; Barton, R.C.; Hopwood, V.; Evans, E.G.V. Determination of optimum growth conditions for gliotoxin production by Aspergillus fumigatus and development of a novel method for gliotoxin detection. Med. Mycol. 1999, 37, 227–233. [Google Scholar] [CrossRef]
- Mohamed, H.M.A.; Emeish, W.F.A.; Braeuning, A.; Hammad, S. Detection of aflatoxin-producing fungi isolated from nile tilapia and fish feed. EXCLI J. 2017, 16, 1308–1318. [Google Scholar] [PubMed]
- Marijani, E.; Wainaina, J.M.; Charo-Karisa, H.; Nzayisenga, L.; Munguti, J.; Gnonlonfin, G.J.B.; Kigadye, E.; Okoth, S. Mycoflora and mycotoxins in finished fish feed and feed from smallholder farms in East Africa. Egypt. J. Aquat. Res. 2017, 3, 169–176. [Google Scholar] [CrossRef]
- Norbäck, D.; Hashim, J.H.; Cai, G.H.; Hashim, Z.; Ali, F.; Bloom, E.; Larsson, L. Rhinitis, ocular, throat and dermal symptoms, headache and tiredness among students in schools from johor bahru, Malaysia: Associations with fungal DNA and mycotoxins in classroom dust. PLoS ONE 2016, 11, e0147996. [Google Scholar] [CrossRef] [PubMed]
- Alastruey-Izquierdo, A.; Cuenca-Estrella, M.; Monzón, A.; Mellado, E.; Rodríguez-Tudela, J.L. Antifungal susceptibility profile of clinical Fusarium spp. isolates identified by molecular methods. J. Antimicrob. Chemother 2008, 61, 805–809. [Google Scholar] [CrossRef] [Green Version]
- Ferrigo, D.; Raiola, A.; Causin, R. Fusarium toxins in cereals: Occurrence, legislation, factors promoting the appearance and their management. Molecules 2016, 21, 627. [Google Scholar] [CrossRef] [Green Version]
- Stefańczyk, E.; Sobkowiak, S.; Brylińska, M.; Śliwka, J. Diversity of Fusarium spp. associated with dry rot of potato tubers in Poland. Eur. J. Plant Pathol. 2016, 145, 871–884. [Google Scholar] [CrossRef] [Green Version]
- Gherbawy, Y.A.M.H.; Maghraby, T.A.; Shebany, Y.M. Seasonal variations of Fusarium species in wheat fields in Upper Egypt. Arch. Phytopathol. Plant Prot. 2006, 39, 365–377. [Google Scholar] [CrossRef]
- Silvestro, L.B.; Stenglein, S.A.; Forjan, H.; Dinolfo, M.I.; Arambarri, A.M.; Manso, L.; Moreno, M.V. Occurrence and distribution of soil Fusarium species under wheat crop in zero tillage. Spanish J. Agric. Res. 2013, 11, 72–79. [Google Scholar] [CrossRef] [Green Version]
- Gräfenhan, T.; Schroers, H.J.; Nirenberg, H.I.; Seifert, K.A. An overview of the taxonomy, phylogeny, and typification of nectriaceous fungi in Cosmospora, Acremonium, Fusarium, Stilbella, and Volutella. Stud. Mycol. 2011, 68, 79–113. [Google Scholar] [CrossRef] [PubMed] [Green Version]
- Bakker, M.G.; Brown, D.W.; Kelly, A.C.; Kim, H.-S.; Kurtzman, C.P.; Mccormick, S.P.; O’Donnell, K.L.; Proctor, R.H.; Vaughan, M.M.; Ward, T.J.; et al. Fusarium mycotoxins: A trans-disciplinary overview. Can. J. Plant Pathol. 2018, 40, 161–171. [Google Scholar] [CrossRef]
- Stoll, D.A.; Link, S.; Kulling, S.; Geisen, R.; Schmidt-Heydt, M. Comparative proteome analysis of Penicillium verrucosum grown under light of short wavelength shows an induction of stress-related proteins associated with modified mycotoxin biosynthesis. Int. J. Food Microbiol. 2014, 175, 20–29. [Google Scholar] [CrossRef] [PubMed]
- Frisvad, J.C.; Nielsen, K.F.; Samson, R.A. Recommendations concerning the chronic problem of misidentification of mycotoxigenic fungi associated with foods and feeds. Adv. Food Mycol. 2006, 571, 33–46. [Google Scholar] [CrossRef]
- Zhang, X.; Li, Y.; Wang, H.; Gu, X.; Zheng, X.; Wang, Y.; Diao, J.; Peng, Y.; Zhang, H. Screening and identification of novel ochratoxin A-producing fungi from grapes. Toxins (Basel) 2016, 8, 333. [Google Scholar] [CrossRef]
- Pietsch, C.; Kersten, S.; Burkhardt-Holm, P.; Valenta, H.; Dänicke, S. Occurrence of deoxynivalenol and zearalenone in commercial fish feed: An initial study. Toxins (Basel) 2013, 5, 184–192. [Google Scholar] [CrossRef] [Green Version]
- Kamei, K.; Watanabe, A. Aspergillus mycotoxins and their effect on the host. Med. Mycol. 2005, 43, S95–S99. [Google Scholar] [CrossRef] [Green Version]
- Paulussen, C.; Hallsworth, J.E.; Álvarez-Pérez, S.; Nierman, W.C.; Hamill, P.G.; Blain, D.; Rediers, H.; Lievens, B. Ecology of aspergillosis: Insights into the pathogenic potency of Aspergillus fumigatus and some other Aspergillus species. Microb. Biotechnol. 2017, 10, 296–322. [Google Scholar] [CrossRef] [Green Version]
- Soliman, S.; Li, X.-Z.; Shao, S.; Behar, M.; Svircev, A.M.; Tsao, R.; Zhou, T. Potential mycotoxin contamination risks of apple products associated with fungal flora of apple core. Food Control 2015, 47, 585–591. [Google Scholar] [CrossRef]
- Braun, U.; Crous, P.W.; Dugan, F.; Groenewald, J.Z.; Sybren De Hoog, G. Phylogeny and taxonomy of Cladosporium-like hyphomycetes, including Davidiella gen. nov., the teleomorph of Cladosporium s. str. Mycol. Prog. 2003, 2, 3–18. [Google Scholar] [CrossRef]
- Zhang, N.; Blackwell, M. Molecular phylogeny of dogwood anthracnose fungus (Discula destructiva) and the Diaporthales. Mycologia 2001, 93, 355–365. [Google Scholar] [CrossRef]
- Smith, J.A.; Blanchette, R.A.; Ostry, M.E.; Anderson, N.A. Etiology of bronze leaf disease of Populus. Plant Dis. 2002, 86, 462–469. [Google Scholar] [CrossRef] [PubMed]
- Embaby, E.M.; Ayaat, N.M.; Abd El-Galil, M.M.; Allah Abdel-Hameid, N.; Gouda, M.M. Mycoflora and mycotoxin contaminated chicken and fish feeds. Middle East J. Appl. Sci. 2015, 5, 1044–1054. [Google Scholar]
- McDonald, M.R.; Boland, G.J. Forecasting diseases caused by Sclerotinia spp. in eastern Canada: Fact or fiction? Can. J. Plant Pathol. 2004, 26, 480–488. [Google Scholar] [CrossRef]
- Mitchell, S.J.; Jellis, G.J.; Cox, T.W. Sclerotinia sclerotiorum on linseed. Plant Pathol. 1986, 35, 403–405. [Google Scholar] [CrossRef]
- Prova, A.; Akanda, A.M.; Islam, S.; Hossain, M.M. Characterization of Sclerotinia sclerotiorum, an emerging fungal pathogen causing blight in hyacinth bean (Lablab purpureus). Plant Pathol. J. 2018, 34, 367–380. [Google Scholar] [PubMed]
- Manning, B.B.; Ulloa, R.M.; Li, M.H.; Robinson, E.H.; Rottinghaus, G.E. Ochratoxin A fed to channel catfish (Ictalurus punctatus) causes reduced growth and lesions of hepatopancreatic tissue. Aquaculture 2003, 219, 739–750. [Google Scholar] [CrossRef]
- Tschirren, L.; Siebenmann, S.; Pietsch, C. Toxicity of ochratoxin to early life stages of zebrafish (Danio rerio). Toxins (Basel) 2018, 10, 264. [Google Scholar] [CrossRef] [Green Version]
- Wiger, R.; Stormer, F.C. Effects of ochratoxins A and B on prechondrogenic mesenchymal cells from chick embryo limb buds. Toxicol. Lett. 1990, 54, 129–134. [Google Scholar] [CrossRef]
- Hood, R.D.; Naughton, M.J.; Hayes, A.W. Prenatal effects of ochratoxin a in hamsters. Teratology 1976, 13, 11–14. [Google Scholar] [CrossRef]
- O’Brien, E.; Prietz, A.; Dietrich, D.R. Investigation of the teratogenic potential of ochratoxin A and B using the FETAX system. Birth Defects Res. Part B Dev. Reprod. Toxicol. 2005, 74, 417–423. [Google Scholar] [CrossRef] [PubMed] [Green Version]
- Doster, R.C.; Sinnhuber, R.O.; Pawlowski, N.E. Acute intraperitoneal toxicity of ochratoxin a and B derivatives in rainbow trout (Salmo gairdneri). Food Cosmet. Toxicol. 1974, 12, 499–505. [Google Scholar] [CrossRef]
- El-Sayed, Y.S.; Khalil, R.H.; Saad, T.T. Acute toxicity of ochratoxin-A in marine water-reared sea bass (Dicentrarchus labrax L.). Chemosphere 2009, 75, 878–882. [Google Scholar] [CrossRef] [PubMed]
- Srour, T.M. Effect of ochratoxin-A with or without Biogen® on growth performance, feed utilization and carcass composition of Nile tilapia (Oreochromis niloticus) fingerlings. J. Agr. Sci. Mansoura Univ. 2004, 29, 51–61. [Google Scholar]
- Bernhoft, A.; Høgåsen, H.R.; Rosenlund, G.; Ivanova, L.; Berntssen, M.H.G.; Alexander, J.; Eriksen, G.S.; Fæste, C.K. Tissue distribution and elimination of deoxynivalenol and ochratoxin A in dietary-exposed Atlantic salmon (Salmo salar). Food Addit. Contam. Part A Chem. Anal. Control. Expo. Risk Assess. 2017, 34, 1211–1224. [Google Scholar] [CrossRef]
- Bernhoft, A.; Høgåsen, H.R.; Rosenlund, G.; Moldal, T.; Grove, S.; Berntssen, M.H.G.; Thoresen, S.I.; Alexander, J. Effects of dietary deoxynivalenol or ochratoxin A on performance and selected health indices in Atlantic salmon (Salmo salar). Food Chem. Toxicol. 2018, 121, 374–386. [Google Scholar] [CrossRef]
- Bensch, K.; Braun, U.; Groenewald, J.Z.; Crous, P.W. The genus Cladosporium. Stud. Mycol. 2012, 72, 1–401. [Google Scholar] [CrossRef] [Green Version]
- Ogórek, R.; Lejman, A.; Pusz, W.; Miłuch, A.; Miodyńska, P. Characteristics and taxonomy of Cladosporium fungi, Charakterystyka i taksonomia grzybów z rodzaju Cladosporium. Mikol. Lek. 2012, 9, 80–85. [Google Scholar]
- Briceño, E.X.; Latorre, B.A. Characterization of Cladosporium rot in grapevines, a problem of growing importance in Chile. Plant Dis. 2008, 92, 1635–1642. [Google Scholar] [CrossRef]
- Verband Deutscher Landwirtschaftlicher Untersuchungs-und Forschungsanstalten e.V. VDLUFA. Die chemische Untersuchung von Futtermitteln. Bestimmung von Rohprotein. In Methodenbuch III, 3. Ergänzung; VDLUFA-Verlag: Darmstadt, Germany, 1993; p. 218. Available online: https://www.vdlufa.de/Methodenbuch/ (accessed on 10 January 2020).
- Glass, N.L.; Donaldson, G.C. Development of primer sets designed for use with the PCR to amplify conserved genes from filamentous ascomycetes. Appl. Environ. Microbiol. 1995, 61, 1323–1330. [Google Scholar] [CrossRef] [Green Version]
Figure 1.
Nutritional composition of the experimental feed before and after storage for four weeks under different conditions described in Table 1, n = 3 for each storage condition.
Figure 1.
Nutritional composition of the experimental feed before and after storage for four weeks under different conditions described in Table 1, n = 3 for each storage condition.

Figure 2.
DG-18 agarose plates with different fungal colonies derived from different feed samples. Pictures taken after 96 h of plate incubation, A = sample 1, B = sample 6, C = sample 8, D = sample 9 as described in Table 1.
Figure 2.
DG-18 agarose plates with different fungal colonies derived from different feed samples. Pictures taken after 96 h of plate incubation, A = sample 1, B = sample 6, C = sample 8, D = sample 9 as described in Table 1.

Figure 3.
Fungal growth originating from inoculation of PCA agarose plates with different feed samples and subsequent examination after 96 h of incubation, A = sample 0, B = sample 4, C = sample 5, D = sample 12 as described in Table 1.
Figure 3.
Fungal growth originating from inoculation of PCA agarose plates with different feed samples and subsequent examination after 96 h of incubation, A = sample 0, B = sample 4, C = sample 5, D = sample 12 as described in Table 1.

Figure 4.
Fungal colonies grown on YGA agarose plates after 96 h of incubation of the plates inoculated with different feed samples, A = sample 5, B = sample 7 agarose replicate No. 1, C = sample 7 agarose replicate No. 2, D = sample 11 as described in Table 1.
Figure 4.
Fungal colonies grown on YGA agarose plates after 96 h of incubation of the plates inoculated with different feed samples, A = sample 5, B = sample 7 agarose replicate No. 1, C = sample 7 agarose replicate No. 2, D = sample 11 as described in Table 1.

Figure 5.
Agarose gel (1.5%) after gel electrophoresis at 80 V for 1 h containing the samples 1 and 4 in lane 01 and 02 analysed with the Bt1 primer set, and sample 9 in lane 03 analysed with the Bt2 primer set.
Figure 5.
Agarose gel (1.5%) after gel electrophoresis at 80 V for 1 h containing the samples 1 and 4 in lane 01 and 02 analysed with the Bt1 primer set, and sample 9 in lane 03 analysed with the Bt2 primer set.


Table 1.
Summary of the mean temperature and humidity values (± SEM) maintained for each sample belonging to the different storage treatments for four weeks (except for the values of sample 10, which were monitored for only 22 days).
Table 1.
Summary of the mean temperature and humidity values (± SEM) maintained for each sample belonging to the different storage treatments for four weeks (except for the values of sample 10, which were monitored for only 22 days).
| Treatment | Sample | Temperature (°C) | Humidity (% rel H) |
|---|---|---|---|
| 1 | 8.94 ± 0.03 | 76.2 ± 0.1 | |
| humid & cold | 2 | 8.42 ± 0.02 | 79.1 ± 0.1 |
| 3 | 8.39 ± 0.04 | 79.1 ± 0.1 | |
| 4 | 8.60 ± 0.02 | 18.4 ± 0.1 | |
| dry & cold | 5 | 8.29 ± 0.04 | 26.5 ± 0.2 |
| 6 | 8.55 ± 0.03 | 21.1 ± 0.2 | |
| 7 | 27.24 ± 0.20 | 70.1 ± 0.2 | |
| humid & warm | 8 | 25.23 ± 0.14 | 73.9 ± 0.2 |
| 9 | 26.34 ± 0.12 | 69.7 ± 0.1 | |
| 10 | 28.29 ± 0.17 | 30.3 ± 0.3 | |
| dry & warm | 11 | 29.41 ± 0.22 | 20.5 ± 0.2 |
| 12 | 25.75 ± 0.13 | 24.5 ± 0.2 |
Table 2.
Summary of the fungal and bacterial colonization intensity of the different agarose plate types (± SEM) inoculated with the feed samples before and after storage under the conditions shown in Table 1. The agarose plates were maintained for 96 h at 25 °C before examination whereby the following scores were applied: -: no colony present, +: fungal or bacterial growth (i.e., usually 1–2 colonies on each plate) present on one of the replicate plates, ++: fungal or bacterial growth present on both of the replicate plates.
| Sample | Bengal Red | DG18 | PCA | TSA-TCC | YGA |
|---|---|---|---|---|---|
| Fungi/Bacteria | Fungi/Bacteria | Fungi/Bacteria | Fungi/Bacteria | Fungi/Bacteria | |
| 0 | -/- | -/- | +/+ | +/- | -/- |
| 1 | +/- | +/- | -/- | -/+ | +/- |
| 2 | +/+ | -/- | -/+ | -/+ | -/- |
| 3 | -/+ | +/- | -/+ | -/- | -/- |
| 4 | +/- | +/- | +/++ | -/+ | -/- |
| 5 | -/- | -/- | +/++ | -/- | +/- |
| 6 | -/- | -/- | +/- | +/- | -/- |
| 7 | ++/- | -/- | -/+ | -/+ | ++/- |
| 8 | -/- | -/- | -/+ | -/- | -/- |
| 9 | +/- | ++/- | -/+ | -/+ | -/- |
| 10 | -/- | -/- | -/+ | -/+ | -/- |
| 11 | -/- | -/- | +/- | -/- | -/- |
| 12 | -/- | -/- | +/+ | +/- | -/- |
Table 3.
Summary of the identified fungal species from sample 0 taken at the start of the experiment and grown on the individual agarose types (Bengal Red, DG-18, PCA, TSA, YGA) and the sequence length and the results from the NCBI blast N of the fungi with the highest similarity (>95%) to the isolated sequence.
| Sample | Agarose Type | Sequence Length | Related Fungal Species (NCBI Accession No.) |
|---|---|---|---|
| 0 | PCA | 338 bp2 | Cladosporium sp. strain CMW49962 (MH327787.1) Davidiella tassiana strain ATCC 66670 (EF101452.1) Cladosporium allicinum culture-collection CBS:177.71 (EF101451.1) (picture of the colony on the agarose plate shown in Figure 3A) |
| TSA | 348 bp2 | Davidiella tassiana strain ATCC 66670 (EF101452.1) Cladosporium sp. strain CMW49962 (MH327787.1) Cladosporium allicinum culture-collection CBS:177.71 (EF101451.1) |
2 PCR performed with the Bt2 primer set.
Table 4.
Summary of the identified fungal species from samples 1 to 3 taken from the ‘humid & cold’ treatment and grown on the individual agarose types (Bengal Red, DG-18, PCA, TSA, YGA), and the sequence length and results from the NCBI blast N of the fungi with the highest similarity (>95%) to the isolated sequence.
| Sample | Agarose Type | Sequence Length | Related Fungal Species (NCBI Accession No.) |
|---|---|---|---|
| 1 | DG-18 | 432 bp1 | Apioplagiostoma aceriferum (AK110204.1) Cladosporium acalyphae strain SL-16 (KU574814.1) Alternaria alternata isolate CAU8331 (MH475293.1) |
| 350 bp2 | Cladosporium sp. strain CMW49962 (MH327787.1) Davidiella tassiana strain ATCC 66670 (EF101452.1) Cladosporium herbarum strain BEOFB1812m (MH780976.1) | ||
| (picture of the colony on the agarose plate shown in Figure 2A) | |||
| YGA | 358 bp2 | Davidiella tassiana strain ATCC 66670 (EF101452.1) Cladosporium sp. strain CMW49962 (MH327787.1) Cladosporium allicinum culture-collection CBS:177.71 (EF101451.1) | |
| 2 | Bengal Red | 504 bp2 | Davidiella tassiana strain ATCC 66670 (EF101452.1) Cladosporium allicinum culture-collection CBS:177.71 (EF101451.1) Cladosporium sp. strain CMW49962 (MH327787.1) |
| 3 | DG-18 | 395 bp2 | Sclerotinia nivalis strain KGC-S0601 (JX296007.1) Sclerotinia nivalis isolate ZJ14 (KT023311.1) Sclerotinia nivalis isolate ZJ11 (KT023308.1) |
1 PCR performed with the Bt1 primer set, 2 PCR performed with the Bt2 primer set.
Table 5.
Summary of the identified fungal species from samples 4 to 6 taken from the ‘dry & cold’ treatment and grown on the individual agarose types (Bengal Red, DG-18, PCA, TSA, YGA), and the sequence length and results from the NCBI blast N of the fungi with the highest similarity (>95%) to the isolated sequence.
| Sample | Agarose Type | Sequence Length | Related Fungal Species (NCBI Accession No.) |
|---|---|---|---|
| 4 | DG-18 | 425 bp1 | Apioplagiostoma aceriferum (AK110204.1) Cladosporium acalyphae strain SL-16 (KU574814.1) Alternaria alternata isolate CAU8331 (MH475293.1) |
| 355 bp2 | Davidiella tassiana strain ATCC 66670 (EF101452.1) Cladosporium sp. strain CMW49962 (MH327787.1) Cladosporium allicinum culture-collection CBS:177.71 (EF101451.1) | ||
| PCA | 139 bp2 | Aspergillus fumigatus isolate 3 (MH536090.1) Aspergillus fumigatus strain m135 (MH208809.1) Aspergillus fumigatus strain m86 (MH208772.1) (picture of the colony on the agarose plate shown in Figure 3B) | |
| 340 bp2 | Cladosporium sp. strain CMW49962 (MH327787.1) Davidiella tassiana strain ATCC 66670 (EF101452.1) Cladosporium allicinum culture-collection CBS:177.71 (EF101451.1) | ||
| 5 | PCA | 347 bp2 | Davidiella tassiana strain ATCC 66670 (EF101452.1) Cladosporium sp. strain CMW49962 (MH327787.1) Cladosporium allicinum culture-collection CBS:177.71 (EF101451.1) (picture of the colony on the agarose plate shown in Figure 3C) |
| YGA | 367 bp2 | Davidiella tassiana strain ATCC 66670 (EF101452.1) Cladosporium allicinum culture-collection CBS:177.71 (EF101451.1) Cladosporium sp. strain CMW49962 (MH327787.1) (picture of the colony on the agarose plate shown in Figure 4A) | |
| 6 | DG-18 | unknown (picture of the colony on the agarose plate shown in Figure 2B) | |
| TSA | 341 bp2 | Cladosporium sp. strain CMW49962 (MH327787.1) Davidiella tassiana strain ATCC 66670 (EF101452.1) Cladosporium allicinum culture-collection CBS:177.71 (EF101451.1) |
1 PCR performed with the Bt1 primer set, 2 PCR performed with the Bt2 primer set.
Table 6.
Summary of the identified fungal species from samples 7 to 9, taken from the ‘humid & warm’ treatment and grown on the individual agarose types (Bengal Red, DG-18, PCA, TSA, YGA), and the sequence length and results from the NCBI blast N of the fungi with the highest similarity (>95%) to the isolated sequence.
| Sample | Agarose Type | Sequence Length | Related Fungal Species (NCBI Accession No.) |
|---|---|---|---|
| 7 | YGA | 497 bp2 | Aspergillus fumigatus isolate Z1201.1018 (KJ175518.1) Aspergillus fumigatus isolate M 169 (KJ175506.1) Aspergillus fumigatus (MF189897.1) (picture of the colony on the agarose plate shown in Figure 4C) |
| 353 bp2 | Davidiella tassiana strain ATCC 66670 (EF101452.1) Cladosporium sp. strain CMW49962 (MH327787.1) Cladosporium allicinum culture-collection CBS:177.71 (EF101451.1) (picture of the colony on the agarose plate shown in Figure 4B) | ||
| Bengal Red | 360 bp2 | Cladosporium oxysporum isolate 015 (MF175217.1) Cladosporium oxysporum isolate 056 (MF175222.1) Cladosporium oxysporum isolate 028 (MF175220.1) | |
| 337 bp2 | Fusarium merismoides var. merismoides strain F-266,788 (EU860027.1) Fusarium merismoides isolate N271A (KP710663.1) Fusicolla septimanifiniscientiae strain CBS 144935 (MK069408.1) | ||
| 471 bp2 | Davidiella tassiana strain ATCC 66670 (EF101452.1) Cladosporium allicinum culture-collection CBS:177.71 (EF101451.1) Cladosporium sp. strain CMW49962 (MH327787.1) | ||
| 341 bp2 | Cladosporium sp. strain CMW49962 (MH327787.1) Davidiella tassiana strain ATCC 66670 (EF101452.1) Cladosporium allicinum culture-collection CBS:177.71 (EF101451.1) | ||
| 8 | DG-18 | 333 bp2 | Cladosporium sp. strain CMW49962 (MH327787.1) Davidiella tassiana strain ATCC 66670 (EF101452.1) Cladosporium allicinum culture-collection CBS:177.71(EF101451.1) (picture of the colony on the agarose plate shown in Figure 2C) |
| 9 | DG-18 | 401 bp2 | Penicillium chrysogenum strain BEOFB11120m (MH780066.1) Penicillium chrysogenum isolate 186 (MH018233.1) Penicillium chrysogenum culture MUT<ITA>:2255 (MG832189.1) (picture of the colony on the agarose plate shown in Figure 2D) |
2—PCR performed with the Bt2 primer set.
Table 7.
Summary of the identified fungal species from samples 10 to 12 taken from the ‘dry & warm’ treatment and grown on the individual agarose types (Bengal Red, DG-18, PCA, TSA, YGA), and the sequence length and results from the NCBI blast N of the fungi with the highest similarity (>95%) to the isolated sequence.
| Sample | Agarose Type | Sequence Length | Related Fungal Species (NCBI Accession No.) |
|---|---|---|---|
| 10 | - | - | - |
| 11 | YGA | 481 bp2 | Aspergillus fumigatus isolate Z1201.1018 (KJ175518.1) Aspergillus fumigatus isolate M 169 (KJ175506.1) Aspergillus fumigatus isolate 3 (MH536090.1) (picture of the colony on the agarose plate shown in Figure 4D) |
| 12 | PCA | 501 bp2 | Davidiella tassiana strain ATCC 66670 (EF101452.1) Cladosporium allicinum culture-collection CBS:177.71 (EF101451.1) Cladosporium sp. strain CMW49962 (MH327787.1) (picture of the colony on the agarose plate shown in Figure 3D) |
2 PCR performed with the Bt2 primer set.—means that no fungal species could be detected.
Table 8.
Summary of the produced mycotoxins (μg/kg) in the samples from the different treatments (as described in Table 1), DON = deoxynivalenol, ZEN = zearalenone, OTA = ochratoxin A, ENN = enniatin, FB = fumonisin, T2 = T2 toxin, HT2 = HT2 toxin. The LOQ values for each mycotoxin are included in brackets.
| Mycotoxin (LOQ) | Aflatoxins 1 (2.5) | DON (12.5) | ZEN (12.5) | OTA (1.2) | ENN B 2 (12.7) | BEA (12.7) | FB1 + FB2 (50) | T2 + HT2 (25) |
|---|---|---|---|---|---|---|---|---|
| sample 0 | <2.5 | 34.1 | <12.5 | <1.2 | 17.7 | <13 | <50 | <25 |
| sample 1 | <2.5 | 39.8 | <12.5 | <1.2 | n.d. | n.d. | <50 | <25 |
| sample 2 | <2.5 | 27.0 | <12.5 | <1.2 | n.d. | n.d. | <50 | <25 |
| sample 3 | <2.5 | 37.0 | <12.5 | <1.2 | n.d. | n.d. | <50 | <25 |
| sample 4 | <2.5 | 34.9 | <12.5 | <1.2 | n.d. | n.d. | <50 | <25 |
| sample 5 | <2.5 | 28.4 | <12.5 | <1.2 | n.d. | n.d. | <50 | <25 |
| sample 6 | <2.5 | 33.8 | <12.5 | <1.2 | n.d. | n.d. | <50 | <25 |
| sample 7 | <2.5 | 30.0 | <12.5 | 501.7 | <12.7 | <12.7 | <50 | <25 |
| sample 8 | <2.5 | 37.4 | <12.5 | 7.1 | 18.5 | <12.7 | <50 | <25 |
| sample 9 | <2.5 | 25.1 | <12.5 | 5.7 | <12.7 | <12.7 | <50 | <25 |
| sample 10 | <2.5 | 33.4 | <12.5 | <1.2 | n.d. | n.d. | <50 | <25 |
| sample 11 | <2.5 | 43.0 | <12.5 | <1.2 | n.d. | n.d. | <50 | <25 |
| sample 12 | <2.5 | 28.1 | <12.5 | <1.2 | n.d. | n.d. | <50 | <25 |
1 including aflatoxin B1, B2, G1 and G2, 2 ENN A, ENN A1, and ENN B1 were also analyzed, but showed values <LOQ.
Table 9.
Treatment of the samples.
| Sample | Treatment | Duration of Exposure (Days) |
|---|---|---|
| 0 | none | none |
| 1 | 32 | |
| 2 | humid & cold | 32 |
| 3 | 32 | |
| 4 | 32 | |
| 5 | dry & cold | 32 |
| 6 | 32 | |
| 7 | 30 | |
| 8 | humid & warm | 30 |
| 9 | 30 | |
| 10 | 30 | |
| 11 | dry & warm | 30 |
| 12 | 30 |
© 2020 by the authors. Licensee MDPI, Basel, Switzerland. This article is an open access article distributed under the terms and conditions of the Creative Commons Attribution (CC BY) license (http://creativecommons.org/licenses/by/4.0/).
Share and Cite
MDPI and ACS Style
Pietsch, C.; Müller, G.; Mourabit, S.; Carnal, S.; Bandara, K. Occurrence of Fungi and Fungal Toxins in Fish Feed during Storage. Toxins 2020, 12, 171. https://doi.org/10.3390/toxins12030171
AMA Style
Pietsch C, Müller G, Mourabit S, Carnal S, Bandara K. Occurrence of Fungi and Fungal Toxins in Fish Feed during Storage. Toxins. 2020; 12(3):171. https://doi.org/10.3390/toxins12030171
Chicago/Turabian StylePietsch, Constanze, Georg Müller, Sulayman Mourabit, Simon Carnal, and Kasun Bandara. 2020. "Occurrence of Fungi and Fungal Toxins in Fish Feed during Storage" Toxins 12, no. 3: 171. https://doi.org/10.3390/toxins12030171
Note that from the first issue of 2016, this journal uses article numbers instead of page numbers. See further details here.