Article

The Human Influence Experiment (Part 2): Guidelines for Improved Mapping of Local Climate Zones Using a Supervised Classification

1
Department of Environment, Faculty of Bioscience Engineering, Ghent University, 9000 Gent, Belgium
2
Center for Earth System Research and Sustainability, University of Hamburg, 20146 Hamburg, Germany
3
Institute of Geography, University of Augsburg, 86159 Augsburg, Germany
4
Department of Earth and Environmental Sciences, KU Leuven, 3001 Leuven, Belgium
5
Meteorology and Air Quality Section, Wageningen University, 6708 Wageningen, The Netherlands
6
Institute of Ecology, Technische Universität Berlin, 12165 Berlin, Germany
7
Université de Lorraine, LERMaB, 88000 Epinal, France
*
Author to whom correspondence should be addressed.
Urban Sci. 2019, 3(1), 27; https://doi.org/10.3390/urbansci3010027
Submission received: 18 December 2018 / Revised: 15 February 2019 / Accepted: 19 February 2019 / Published: 28 February 2019

Abstract

:
Since 2012, Local Climate Zones (LCZ) have been used for numerous studies related to urban environment. In 2015, this use amplified because a method to map urban areas in LCZs was introduced by the World Urban Database and Access Portal Tools (WUDAPT). However in 2017, the first HUMan INfluence EXperiment showed that these maps often have poor or low quality. Since the maps are used in different applications such as urban modelling and land use/land cover change studies, it is of the utmost importance to improve mapping accuracies and a second experiment was launched. In HUMINEX 2.0, the focus lies on providing guidelines on the use of the mapping protocol based on the results of both HUMINEX 1.0 and 2.0. The results showed that: (1) it is important to follow the mapping protocol as strictly as possible, (2) a reasonable amount of time should be spent on the mapping procedure, (3) all users should perform a driving test, and (4) training area sets should be stored in the WUDAPT database for other users.

1. Introduction

Mapping of urban areas in relation to their urban climate is gaining interest in the global research community [1]. Even though most urban climate models require a detailed description of the urban environment, until today, no global urban classification scheme useful for urban climate exists. In 2012, the Local Climate Zone (LCZ) scheme was introduced by Stewart and Oke [2]. This scheme consist of 17 zones, divided into ten built and seven natural land cover types (Figure 1). These zones portray a unique air temperature regime at screen height, under similar atmospheric conditions [3] and could thus serve as a global urban classification scheme. Before 2015, the LCZ scheme was mainly used as a conceptual framework to evaluate in-situ measurement sites related to urban heat island research [2]. In 2015, a method [4,5] was presented within the World Urban Database and Access Portal Tools (WUDAPT) initiative, to classify major urban areas into spatially explicit LCZ maps and gather information on the internal structure and texture of cities [4,6,7]. The data gathering process is organized into a hierarchy based on the level of detail. The default WUDAPT level-0 fundamentally relies on supervised classification of Landsat satellite scenes into LCZ types based on training areas (TAs) that are created by urban experts who identify parts of the urban landscape that exemplify each type present in a city [4]. Thus, WUDAPT is an example of crowd-sourcing geographic information, also referred to as volunteered geographic information [8] and citizen science, among other terms related to user-generated content [9].
At the 10th International Conference on Urban Climate in 2018, it became clear that LCZ maps are now regarded as a global reference for urban land cover descriptions [10]. Since LCZ maps are intended for and already used in a range of different applications, such as climate models at various scales [11,12,13,14,15,16,17,18,19,20], land use change investigations [6], or the characterization of several hundreds of crowd-sourced citizen-weather stations in terms of their local-scale surroundings [21], there is a clear need for highly accurate classification results [22]. However, it is unclear what determines the final quality of a LCZ map derived with the WUDAPT level-0 methodology. Hence in 2017, the Human Influence Experiment (HUMINEX) was introduced to investigate the variability of the quality of LCZ maps, produced by different individuals using the WUDAPT methodology [23]. It aimed at identifying how large discrepancies between individual LCZ maps can be for a given city or region. In HUMINEX 1.0, about 120 students from six universities classified a total of twelve cities. The experiment provided several interesting and relevant insights, namely that some specific LCZ classes can be easily identified, or that the iterative scheme set up in the WUDAPT methodology is justified [23]. However, the results of HUMINEX 1.0 also clearly highlighted that LCZ maps are often of overall poor to moderate quality. Best quality of LCZ maps for different cities was observed when multiple training sets from different participants were combined, thus indicating a certain “wisdom of the crowd” [23]. Beside these findings in HUMINEX 1.0, some deficiencies with the original setup caused problems for meta data analysis and a number of questions remained unanswered. HUMINEX was thus continued in a second phase, called HUMINEX 2.0.
While during HUMINEX 1.0, the participating institutions carried out their own introduction to the topic for their individual courses, HUMINEX 2.0 included a standardized introduction to the topic across participating institutions, along with improved course materials distributed to the participants (http://www.wudapt.org/huminex-2-0/ Moreover, in HUMINEX 1.0 most participants lived in the city that they classified and hence, multiple cities were classified. HUMINEX 2.0 focused only on one city: Berlin, Germany. This city and surrounding area was selected for this case study due to the variety of LCZ classes present, ranging from natural landscapes to densely built-up urban areas. Additionally, many participants in HUMINEX 1.0 had never carried out a supervised classification before and were unfamiliar with the LCZ scheme, possibly contributing to the poor or moderate quality of LCZ maps [23]. To investigate if such a deficiency could be overcome, a `driving test’ for LCZ classification with aerial imagery was developed and introduced to half of the participants in HUMINEX 2.0. Finally, Van Coillie et al. [24] found that for remote sensing image interpretation, operator performance is mainly determined by demographic, non-cognitive and cognitive personality factors, and less by external and technical factors. Hence, for HUMINEX 2.0 we aimed at identifying similar results and to see if individuals’ psychological structures might influence the assumption and the classification of the landscape.
The present study aims at presenting results of the second phase of HUMINEX, which mainly aimed at overcoming the limitations of HUMINEX 1.0. Moreover, based on the results of both phases, this study aims at providing guidelines for operators of the WUDAPT level-0 methodology to obtain LCZ maps of high quality. Specifically, we focus on the following research questions:
  • Can the quality of LCZ training areas be assessed from operator self-assessment or from the training areas themselves?
  • Does previous knowledge on LCZ given by the driving test help to correctly classify LCZs?
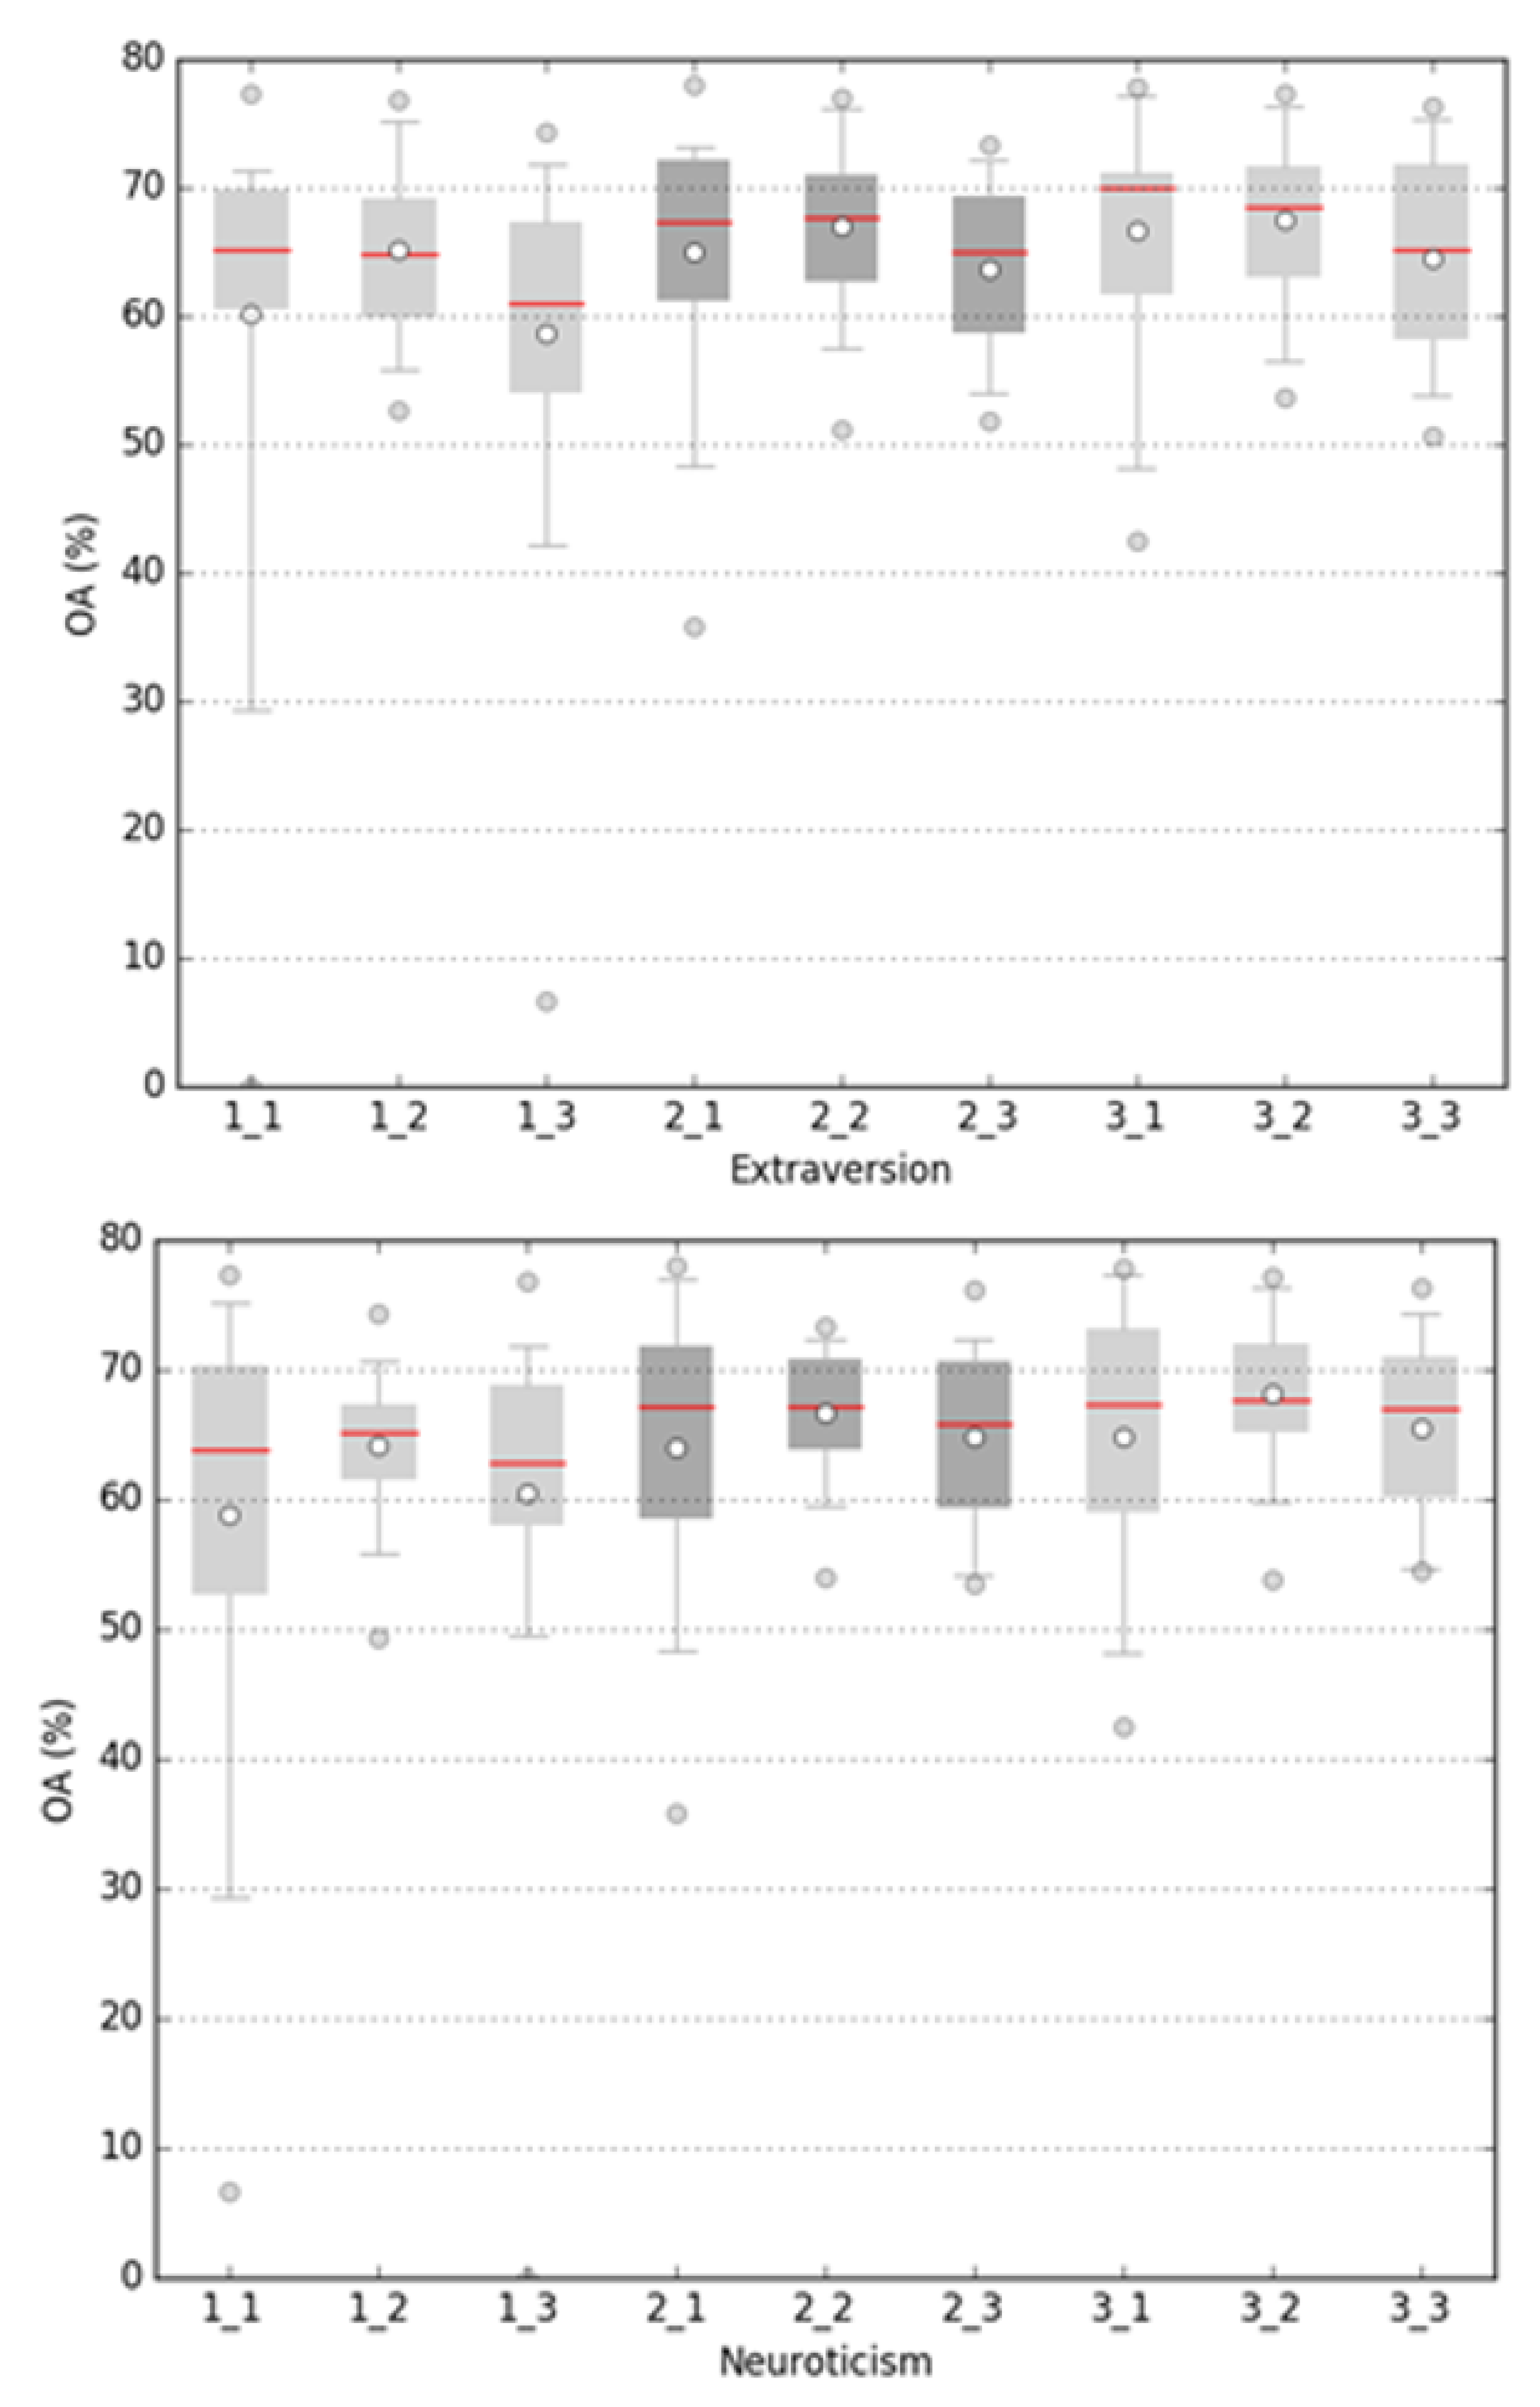
  • How much does the personality of the operator influence the classification quality?

2. Materials and Methods

2.1. Layout of the Experiment

The LCZ workflow [2,4,23] was provided online and consisted of a set of training materials that were used in guided student exercises. First, the students (in the remainder of the paper also referred to as participants) were introduced to the LCZ scheme and the WUDAPT framework [4]. Subsequently, they were provided with the software and the workflow of the exercise.
Each participant defined a TA set for Berlin according to the protocol developed by WUDAPT, i.e., “to be of a size of approximately 1 km 2 ; to be as homogeneous as possible; to be compact in shape; and to have sufficient space along the borders with neighbouring LCZ areas” [4]. Next to that, in the first round, the TA sets of each LCZ class had to include at least five to ten TA polygons in order to cover the internal variation within the different zones (e.g., for an urban LCZ class the internal variation due to different roof colours/materials). The experiment was set up as a joint effort of several universities who offered the online exercises to their students as part of a geographic information course. All participants were provided with the same training materials (Saga GIS software, website, and papers), which included the LCZ mapping workflow as described in [23], and were asked to perform a LCZ classification with at least three iterations.
Next to the TA sets and LCZ maps, elaborate metadata was collected from each participant in the second phase of the experiment using an online questionnaire. Table 1 provides an overview of the collected metadata, ranging from basic information (e.g., age and gender) to questions relating to human behaviour and personality. Besides, LCZ- and city-specific knowledge was enquired as well as details on TA collection and LCZ classification.
The five principal factors of human personality are often referred to as the Big Five: agreeableness (two questions), conscientiousness (12 questions), emotional stability (neuroticism) (12 questions), extraversion (12 questions) and openness (two questions). The participants were asked to indicate how much they relate to the personality questions using the Likert scale [24].
  • Agreeableness is the willingness to help other people, act in accordance to other people’s interests and the degree of co-operative, warm and agreeable traits in an individual.
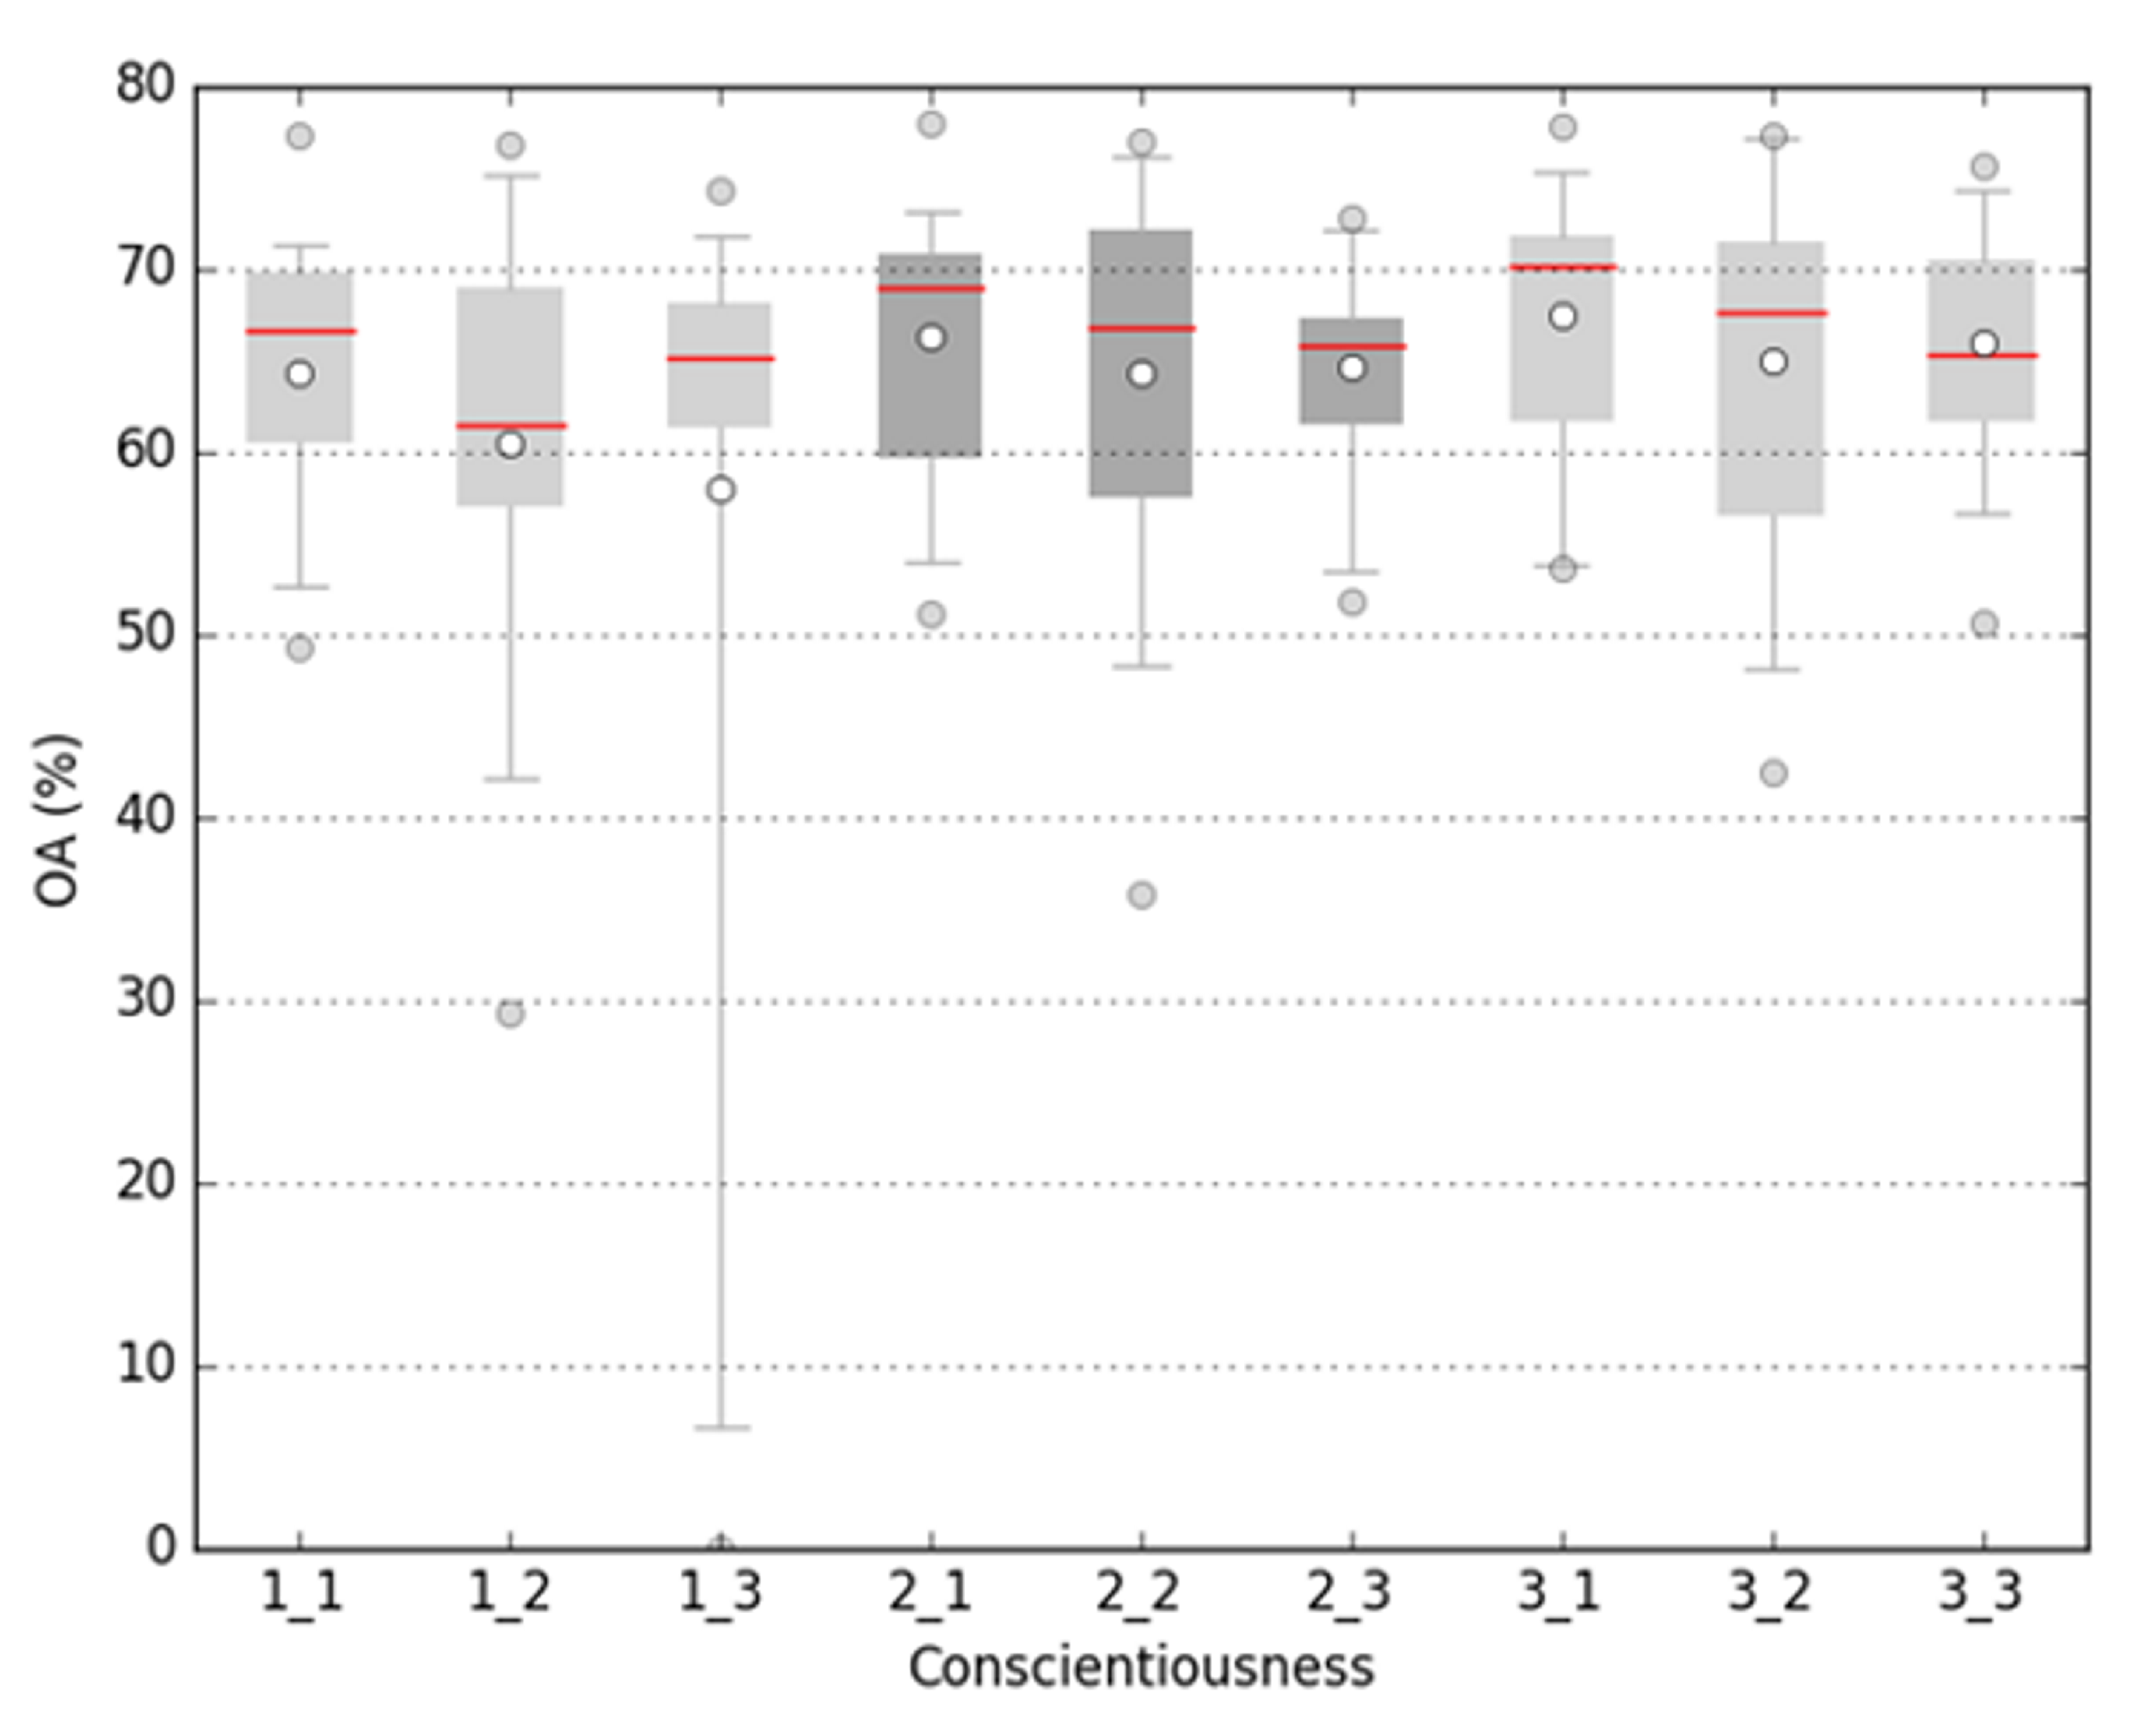
  • Conscientiousness can be described as the preference to follow rules and schedules, keep engagements, work hard and organize.
  • Participants, which are emotional stable, are characterized by being relaxed and independent, calm, self-confident and self-restrained.
  • Extraversion defines the need for human contact, empathy, assertiveness and the wish to inspire people.
  • Openness measures the degree to which a participant needs intellectual stimulation, change and variety.
In addition, in HUMINEX 2.0, some self-assessment questions were asked, including their assessment of the final LCZ map, their knowledge of the city being mapped, and their image classification experience. A so called “driving test”—performed by 50% of the participants—was introduced. This is a freely available only tool, which can be consulted at http://77.69.20.19/dev/driver/training.php, that provides a dynamic interface to an operator to get familiar with the LCZ scheme before digitizing. After the exercise, a self-reflection questionnaire is presented to each participant to evaluate the dedication of the participants in the experiment. Dedication can be divided into motivation and comparative anxiety. Motivation is defined as: internal and external factors that stimulate desire and energy in people to be continually interested and committed to a job, role or subject, or to make an effort to attain a goal. Comparative anxiety on the other refers to the confidence the participant has in his/her own abilities and performance, and how much concern he/she puts in the performance of others.

2.2. Participants and Study Sites

In total 141 students from six universities and one independent contributor participated in HUMINEX 2.0, but only 81 managed to provide images in the correct format. Only 59 performed three or more iterations and filled out the questionnaire (Table 3).
Analysis was thus performed on this selection of participants. From the remaining 59 participants, six did not provide their years of study, how they rate their own competence and their gender. The other 53, saw themselves as competent, advanced beginner or novice participants (respectively, 2, 19 and 31). Most of the participants are thus inexperienced in image classifications. Only 5 of the participants lived in Berlin, and 43 of the participants felt less than 26% familiar with the city. 88% of the participants had never done a LCZ classification before and 32 of the participants felt they had less than 25% knowledge of the LCZ scheme at time of the classification. 17 felt familiar for 25–50%, nine for 50–75% and only one felt 80% knowledgeable on the LCZ scheme. For all the above, 100% equals perfect familiarity/knowledge, 0% equals no familiarity/knowledge.

2.3. Analysis and Accuracy Assessment

For all research questions the accuracy of the resulting LCZ maps was assessed using a sample of reference areas previously identified by a LCZ expert familiar with the methodology and the city under study [21,23]. For each map, the following two standard accuracy measures were derived (see also Verdonck et al. [22], Bechtel et al. [23]: overall accuracy (OA = percentage of correctly classified pixels); and the F1-score, which represents the arithmetic mean of the class-wise F1 values, which are calculated as the weighted harmonic mean of the user’s (UA) and producer’s accuracy (PA). The class-wise F1-score (Equation (1)) for class i is calculated as [25] and results in a value between 0 and 1:
F 1 i = 2 U A i · P A i U A i + P A i
A statistical t-test was performed to evaluate whether a significant difference could be found between the different iterations, the different groups of each personality trait, the participants who did or did not do the driving test and the different groups regarding time investment. The significance threshold was set at 0.05.

3. Results

3.1. Self-Assessment

This experiment investigated the ability of the participants to correctly assess the quality of their maps based on visual interpretation. Figure 2a shows that on average, participants have the tendency to underestimate the accuracy of their LCZ map in the first two iterations and, to overestimate their final mapping result.
Figure 2b portrays the average difference between self-estimation and OA for each iteration and the number of participants who respectively over- or underestimated their mapping results. Similar to Figure 2a, the results show that for the first two iterations, most participants underestimated the results, whereas for the last iteration 56% of the participants overestimated the final mapping result.

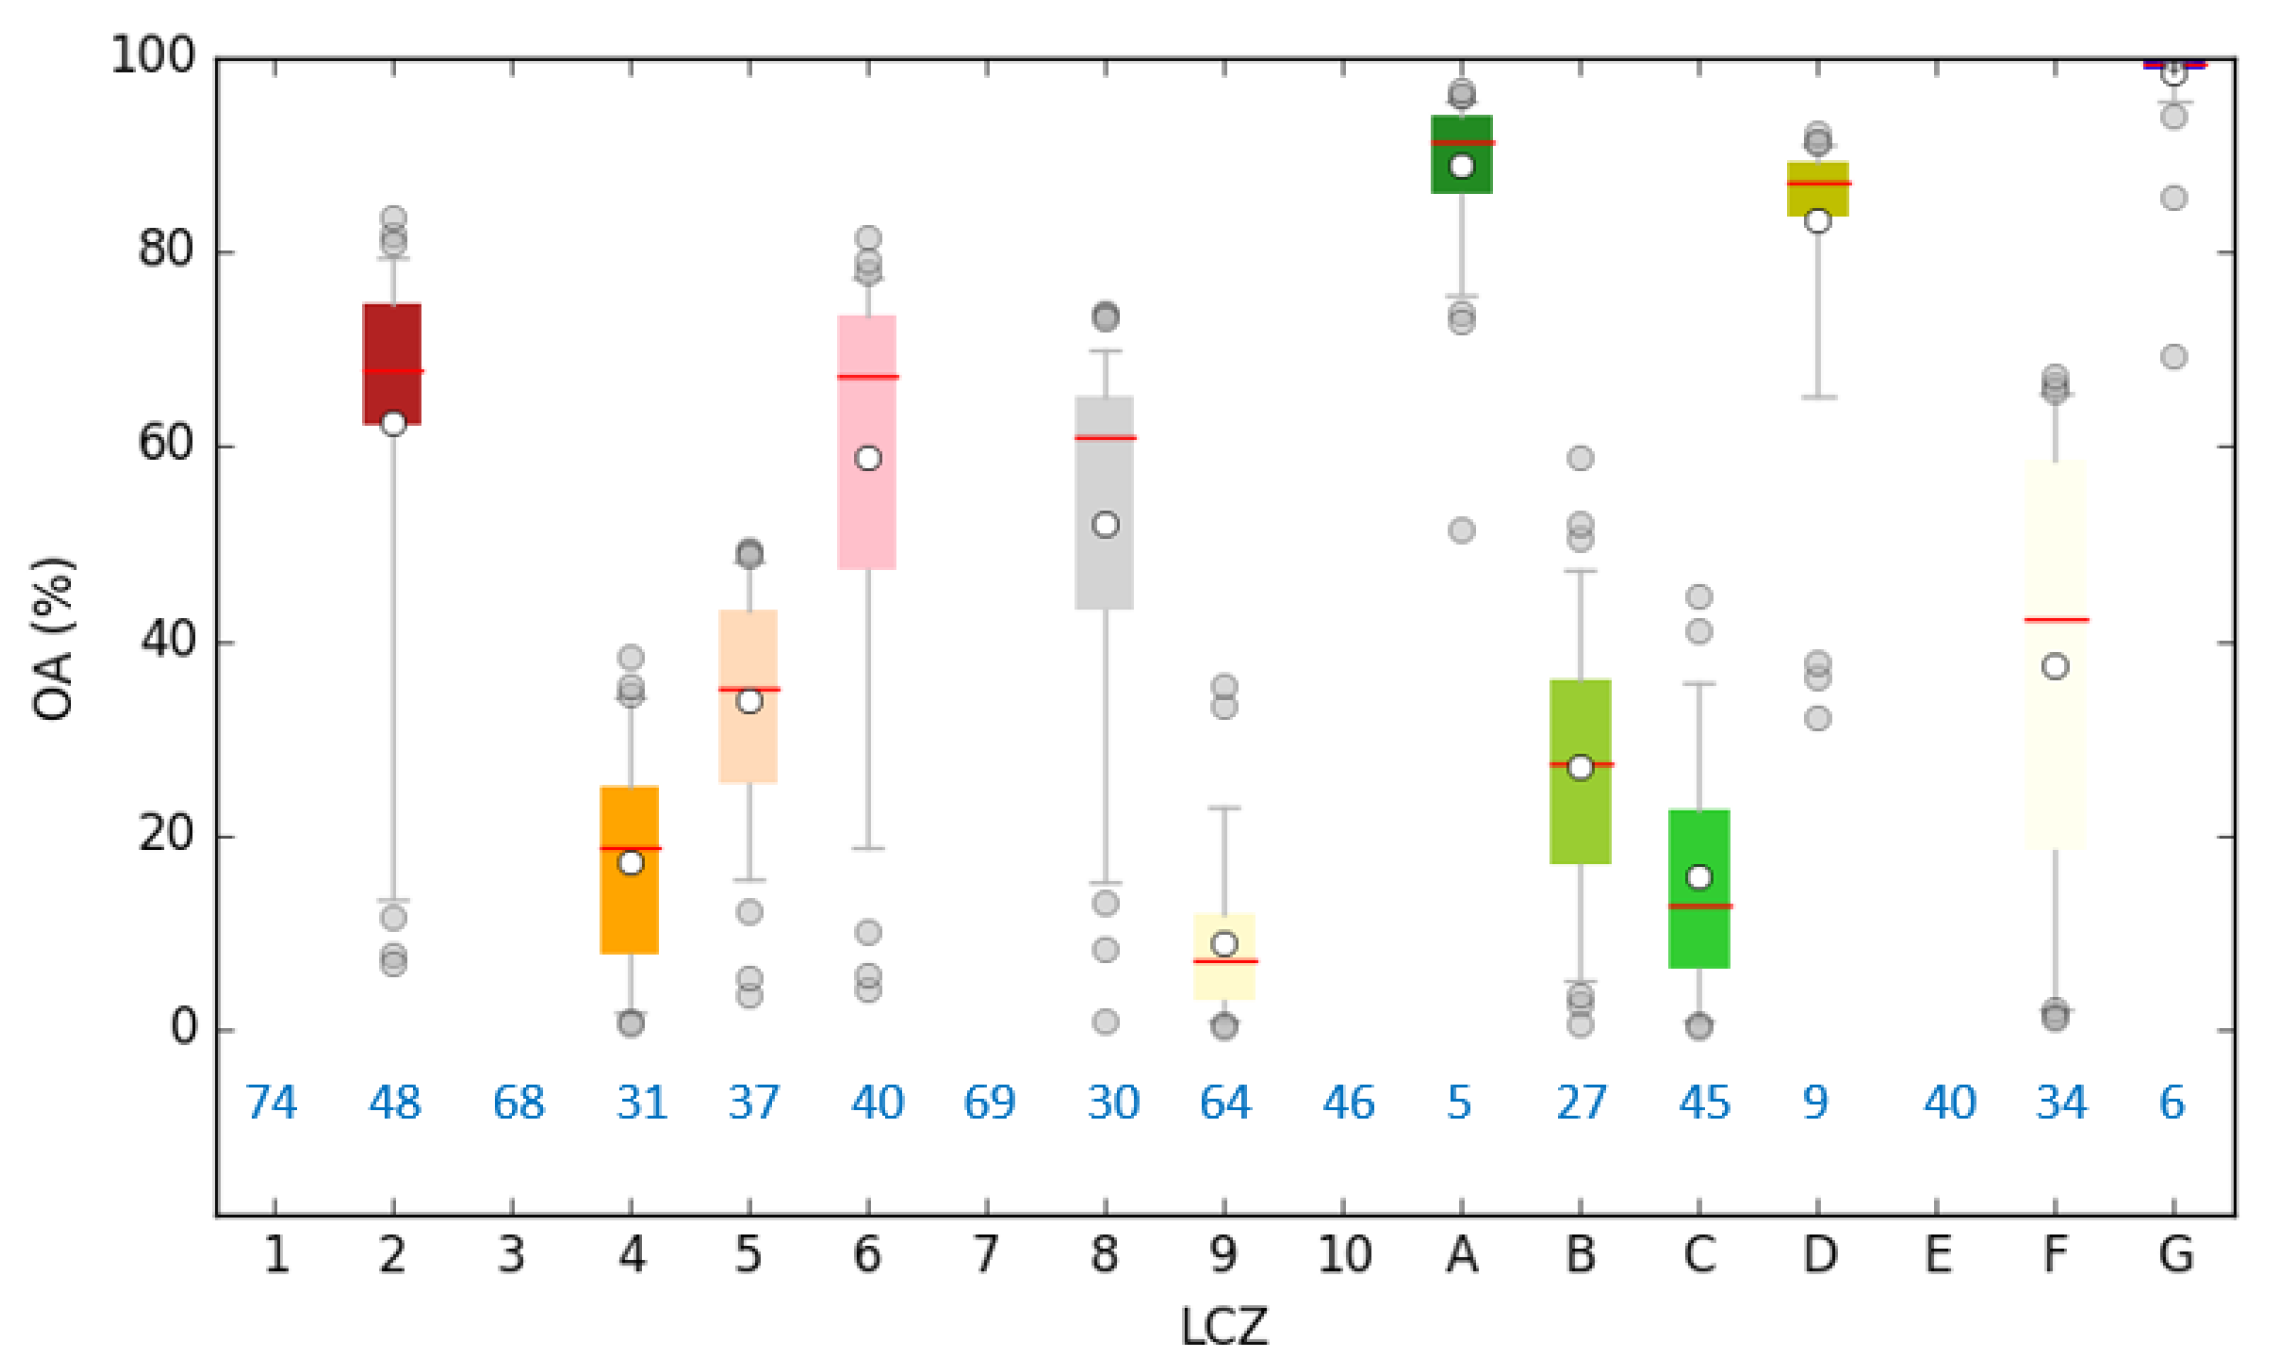
3.2. Information from the Training Areas

Built zones have on average smaller TA surface areas compared to natural zones (Figure 3), since the latter are characterized by a higher degree of homogeneity.
What we can learn from the information on surface areas of the TAs is related to the occurrence of representative zones for a class. When zones are underrepresented in a city, it is possible to find some small training areas, but it is likely that the classifier does not pick up on the zone, due to the limited amount of information about this zone. The final LCZ map will contain these zones but the accuracy will be low. Since LCZ maps provide information on the local climate it is important that a local climate can be established in the zones and they should thus be of a certain size (>1 km 2 ). When zones are smaller and embedded in other zones, it is often better to remove the zone from the TA set. The size of the average area of the TA for each zone can be an indication for underrepresented or non-existing LCZs in a city.
In addition to the surface area of TAs, the number of TAs selected for each zone can be an indicator for zones which are hard to classify. In Table 4, mean, min and max number of TAs for each zone are listed. The number of times a zone was not selected (NS) by a participant is also listed. From this table and Figure 3, it becomes clear that when the number of TAs for a specific zone is low, the representativeness of this TA might be low, inducing lower accuracies. As a user this can be of importance. In fact, inexperienced participants often spent a lot of time searching for representative TAs for all the LCZs even when some of the zones are not even large enough or occur too sparsely in the city to become a LCZ.
In addition, the WUDAPT method suggests to digitize compact and simple TA sets. This would translate into TA sets which are characterized by a shape ratio close to one and a low number of vertices. The shape ratio is calculated based on the ratio between surface area and perimeter (Equation (2)), considering a circle (shape = 1) is the most compact shape:
s h a p e = p e r i m e t e r 2 4 p i a r e a
From Table 4, it is shown that on average the built zones have more compact TAs compared to the natural zones.

3.3. Driving Test

HUMINEX 2.0 also focused on the influence of the driving test: do participants perform better after classifying a number of test images? From the resulting participants, 31 performed the driving test. All participants were free to choose the amount of test images to classify. The range of the classification images was quite large: 20–147, with a median/mean of 50/58 images classified. The results on Figure 4 indicate that participants who did the driving test perform better than those who did not, it also shows that improvement with iterations is smaller if the driving test is carried out, but people who carried out the driving test always have higher quality. Overall, it shows that for all participants overall accuracy increased over the iterations regardless of the test. Most importantly the t-test showed a significant difference in the OA after the first iteration for participant who carried out the driving test.
In Figure 5 scatter plots are shown for the number of test images classified compared to the OA. From these figures it is clear that the number of test images does not influence the OA and the participants should thus be free to choose the amount of test images.

3.4. Dedication

Based on all the answers in Table 2, a weighted score is given for each dedication trait, three equally large groups for the two traits are defined based on the scores of all participants. Since some of the scores were present in two different groups, the groups were reclassified and thresholds are set [24]. Group 1 portrays the participants who shows a low agreement with a certain trait, group 3 shows high agreement with the respective dedication trait (Table 5).
From Figure 6a it seems like motivation did not have an important influence in the mapping process. Participants who had low motivation perform best after three iterations. Participants who did not suffer from comparative anxiety performed better compared to participant who felt pressure to perform well for all three iterations (Figure 6b). This suggests that participants which suffer from high levels of comparative anxiety achieve the lowest map accuracies. It should be noted that no significant differences were found between groups and iterations. However, due to the small resulting sample of participants (59) it is not clear whether dedication had no influence or whether more data is necessary to find statistically significant results.

3.5. Personality

The participants were also questioned (Table 2) about their personality. Again all participants were divided into three groups according to their answers (Table 5). The results related to personality are, similarly to the results on dedication, not significantly different, again probably due to the small sample size.
In Figure 7, results are shown for the personality analysis. The trends clearly show that with each iteration overall accuracy rose. For neuroticism it is shown that participants showing medium characteristics on this personality trait had maps with the highest overall accuracies. Both for conscientiousness and extraversion the trends show that participants scoring low for these traits had the highest overall accuracies.

3.6. Difficulties According to the Participants

After each iteration participants were asked to indicate which classes were difficult to recognize on the Google Earth images. In Figure 8, F1 scores are shown in boxplots for all present LCZs in Berlin for the last iteration.
Below the boxplots in blue, the number of times participants indicated that a zone was difficult to recognize over all iterations is shown. Especially for the natural zones, the results show a clear relation between the difficulty in recognition and the classification accuracy, e.g., zones A, D and G always resulted in high accuracies. For the built zones this link is not as pronounced. The best classified zones are LCZ 2, 6 and 8. It is however clear that zones which are not present in large enough areas, were recognized as difficult e.g., LCZ 1, 3 and 7. LCZ 9 was one of the most difficult zones to classify. In addition, Table 4 shows that zones that had low F1 scores according to Figure 8 (LCZs 1, 3, 7 and 10) are characterized by small TAs on average.

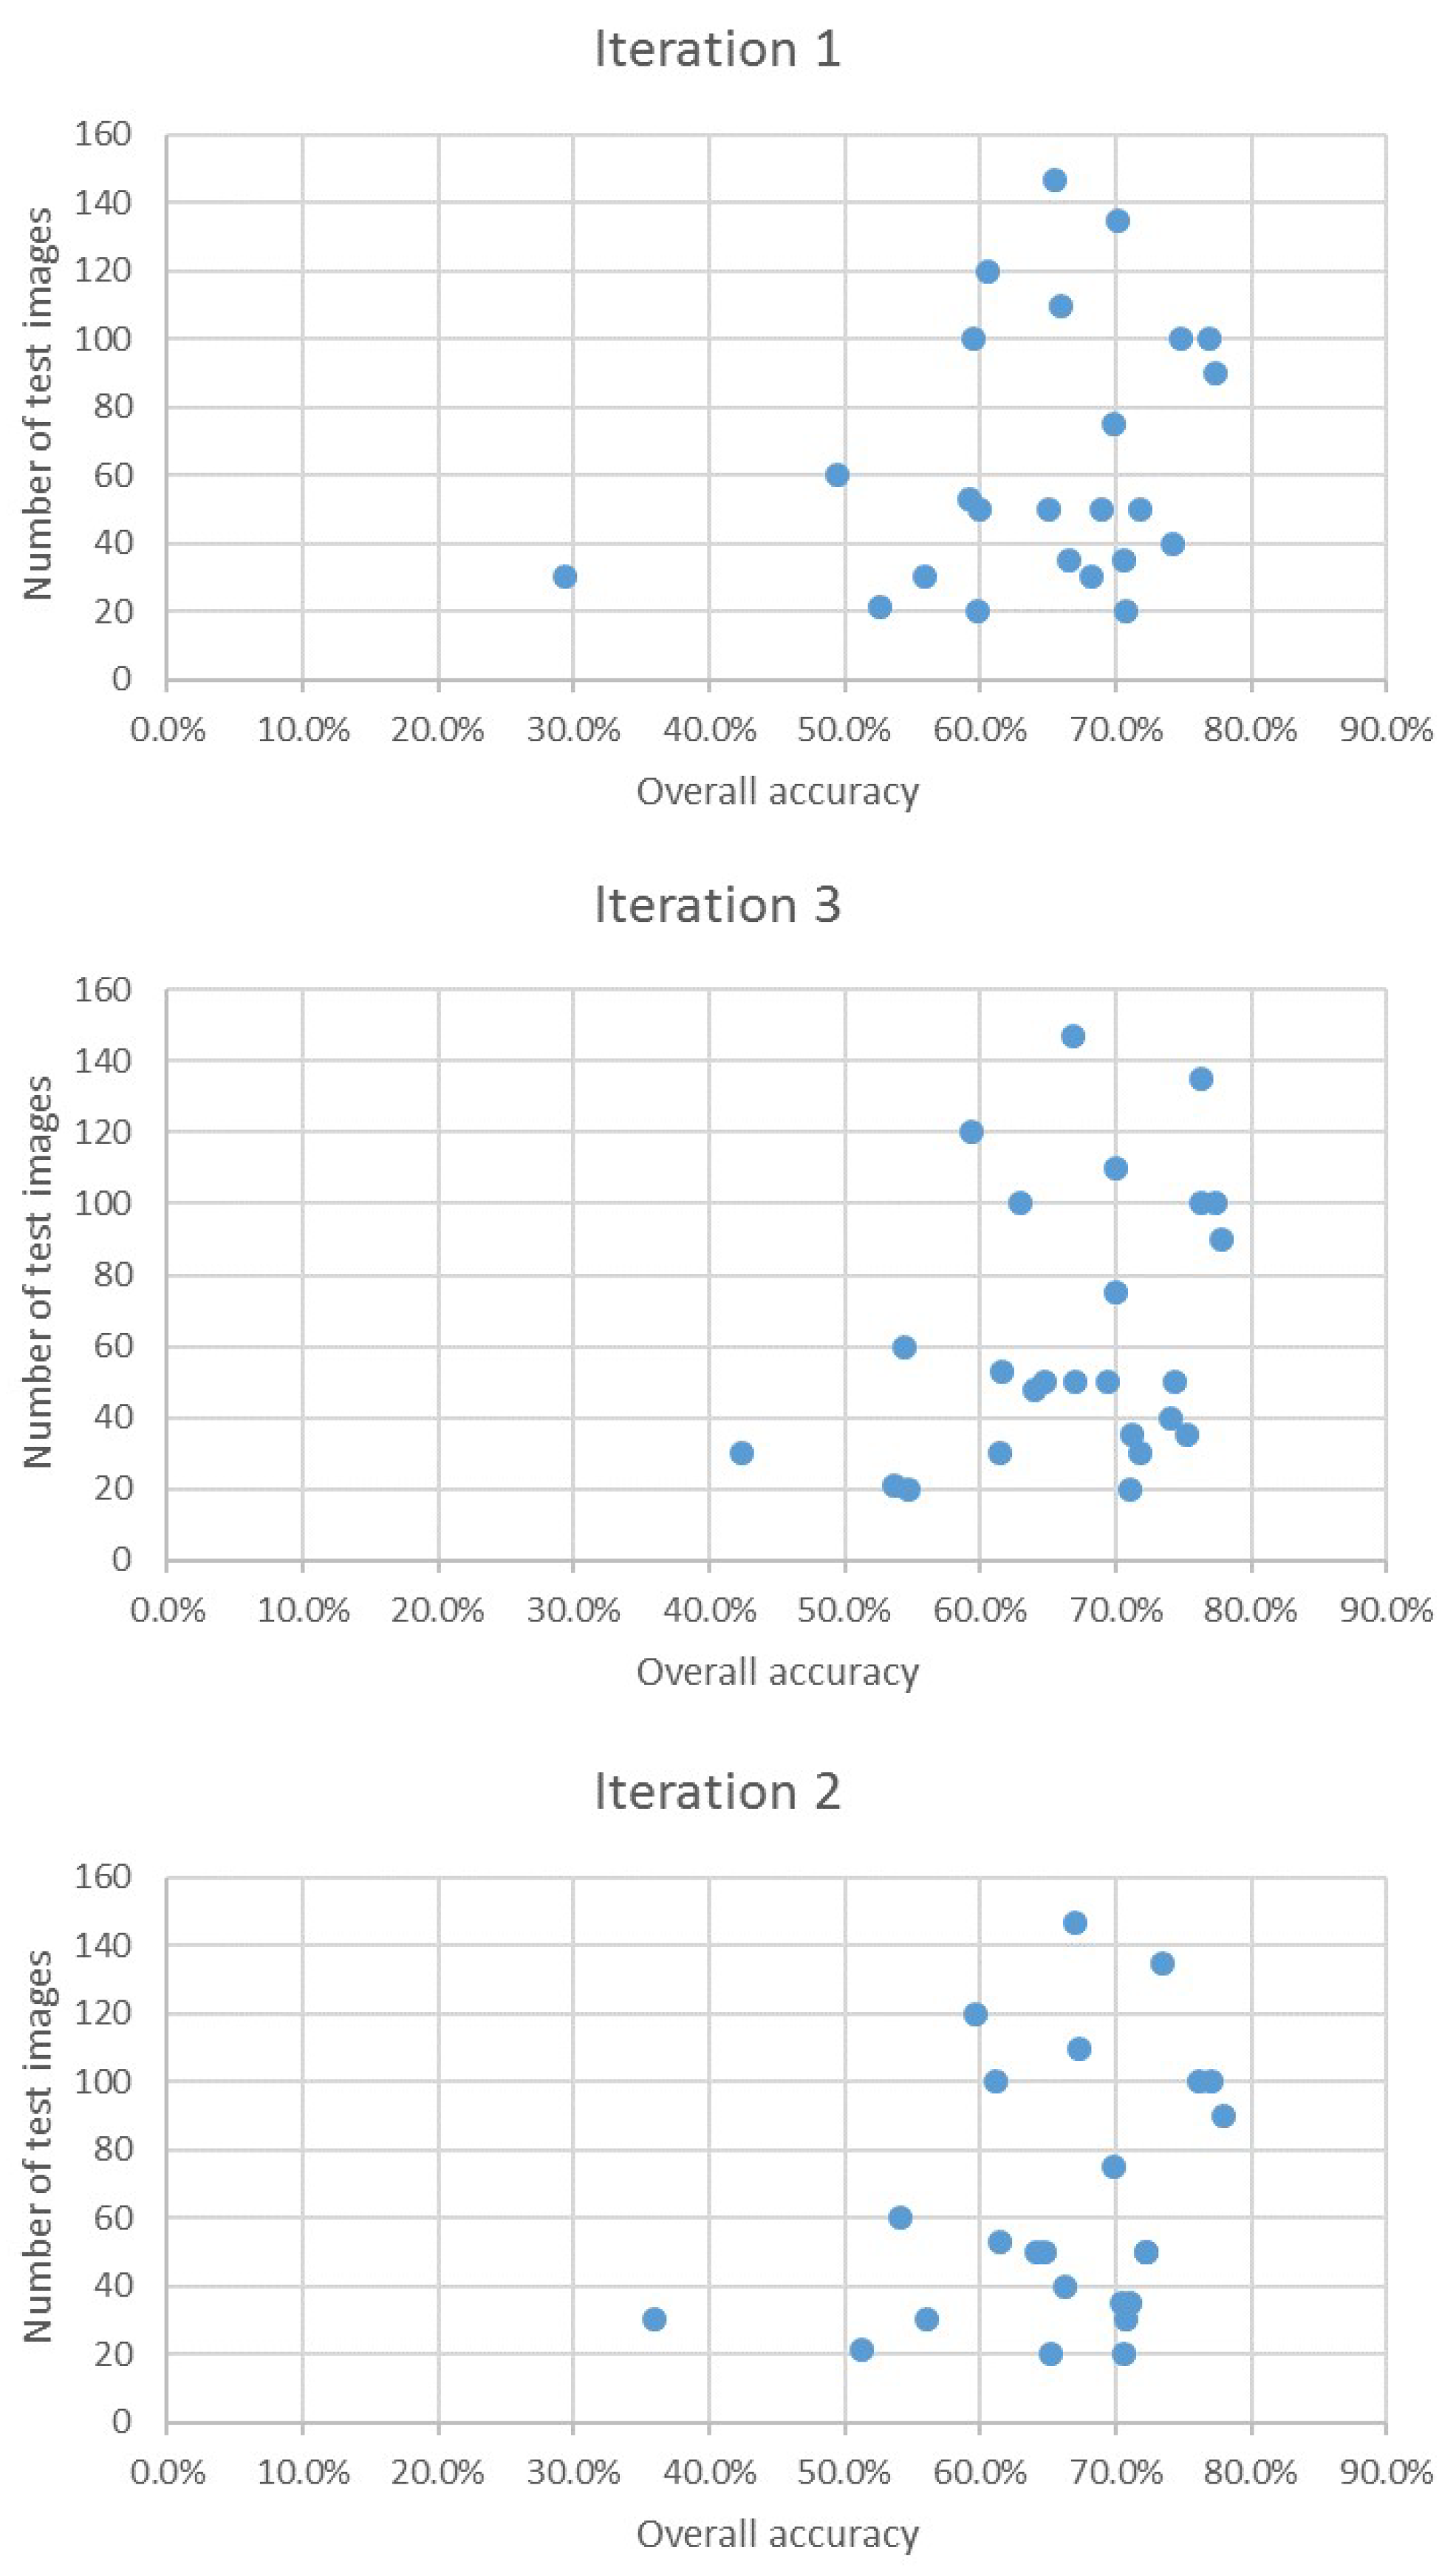
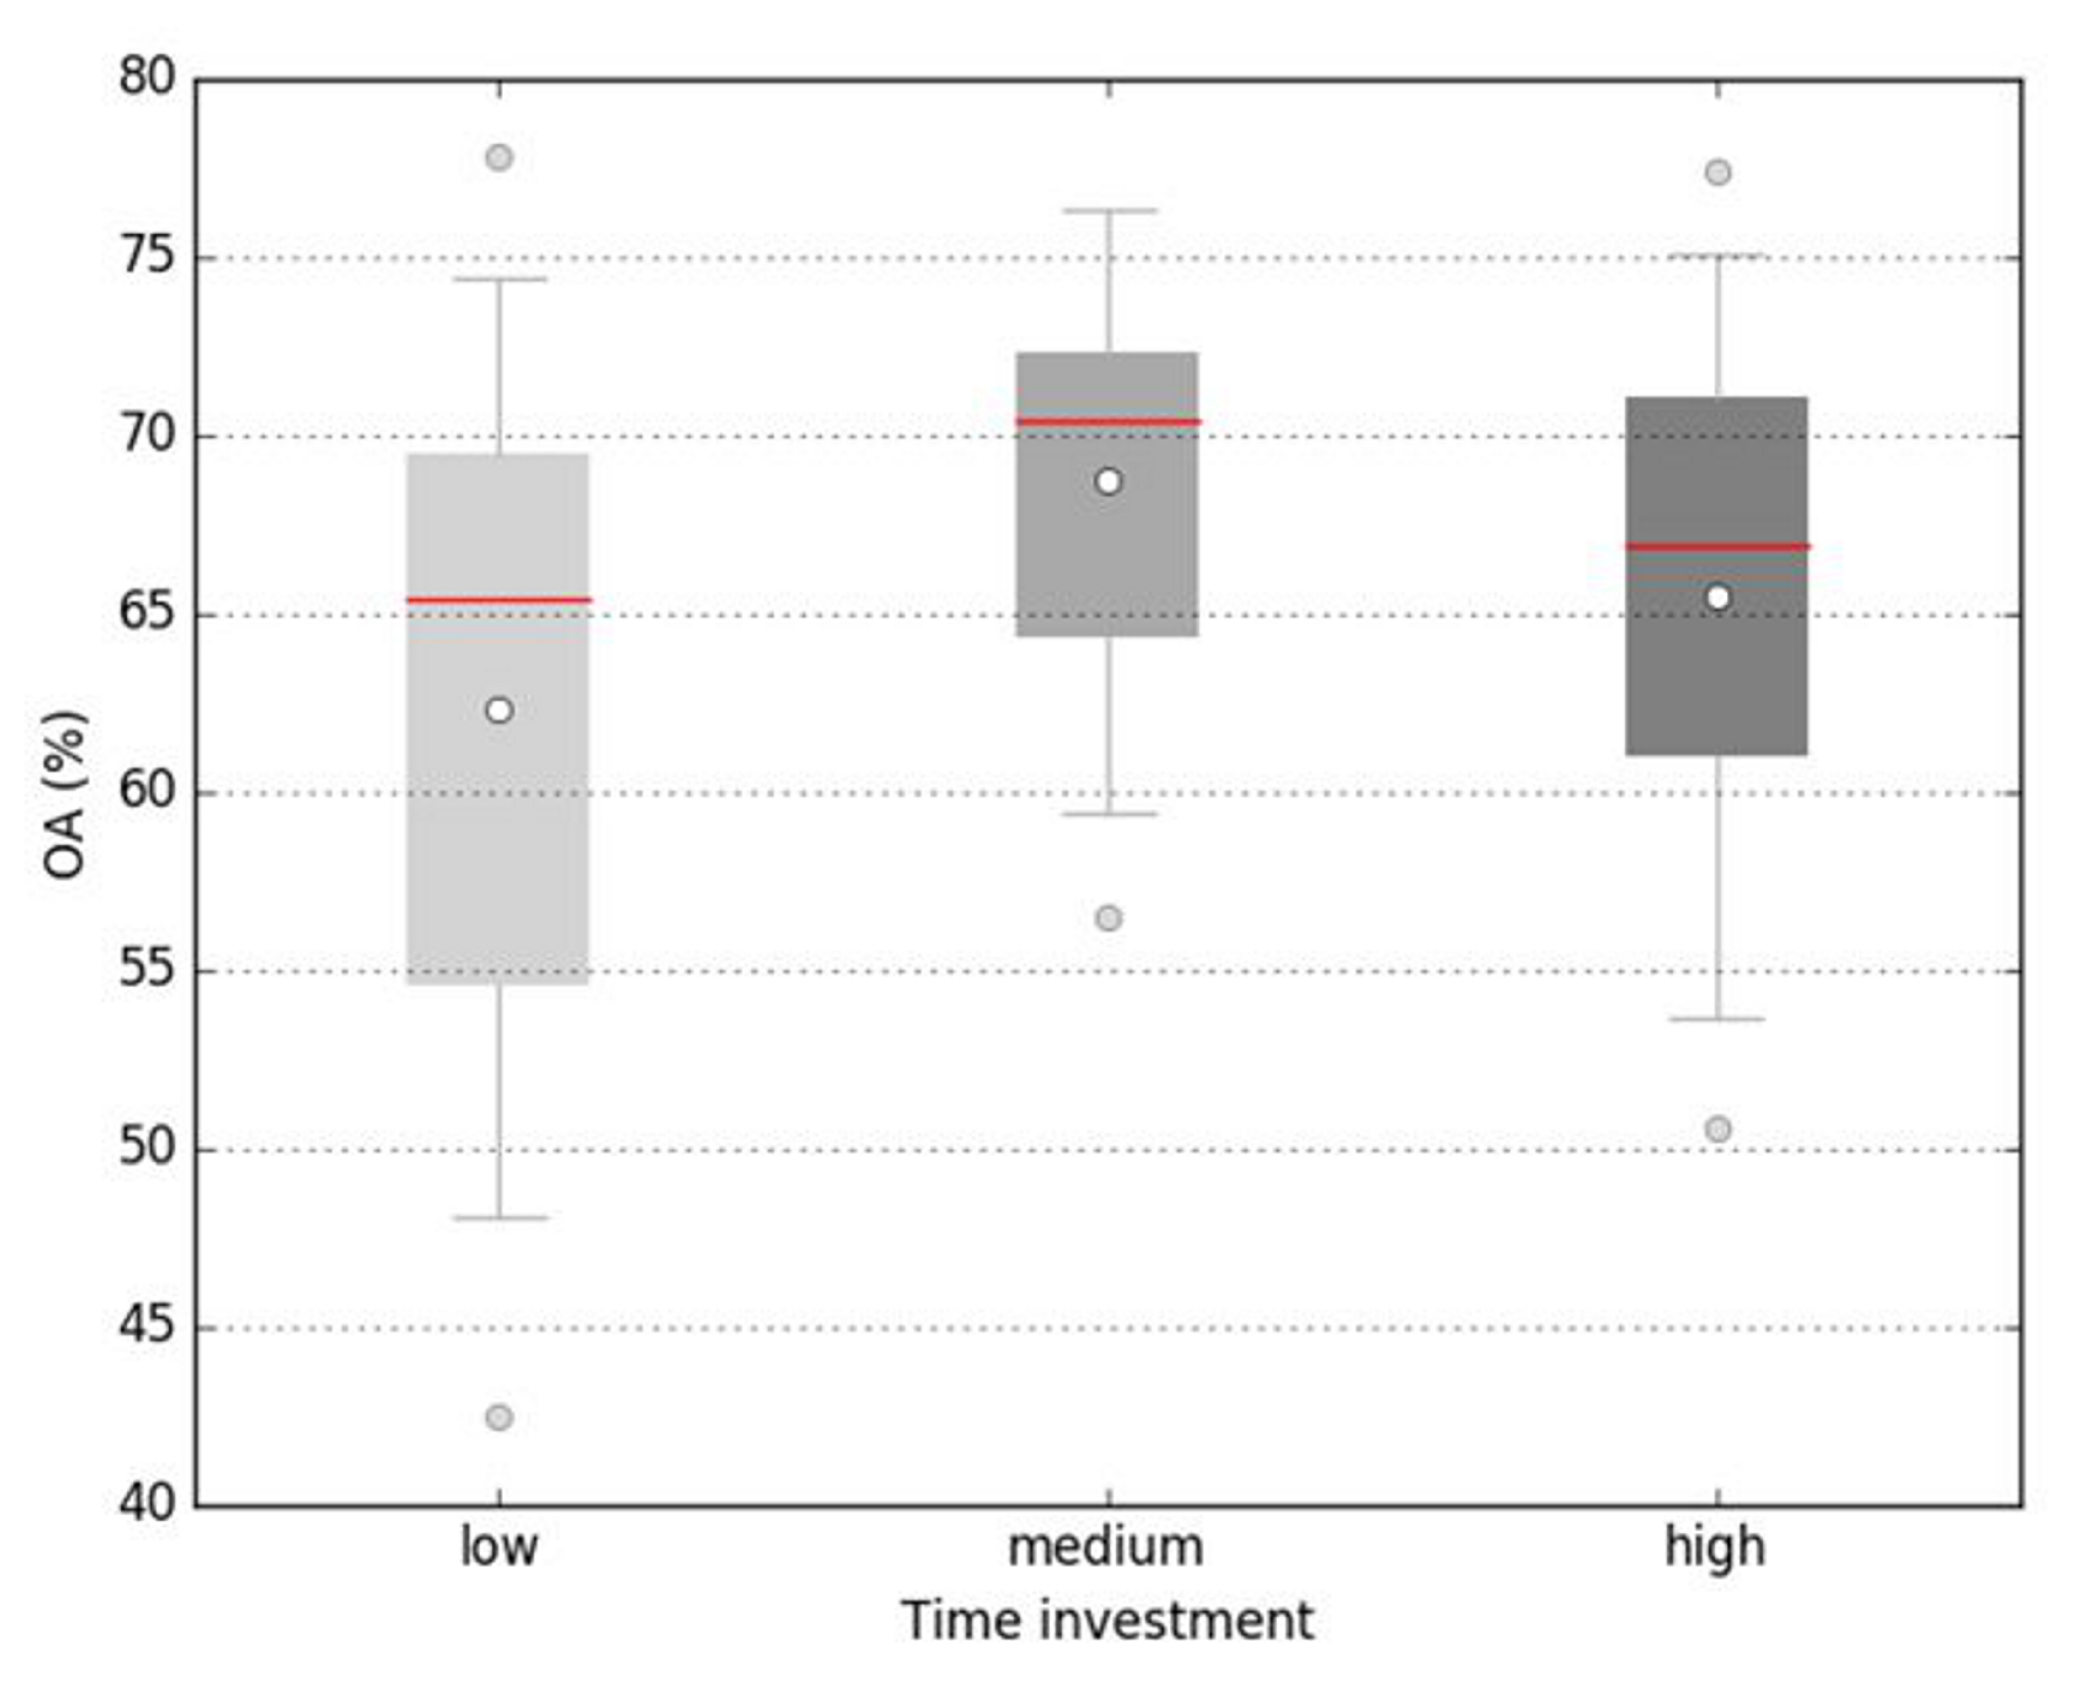
3.7. Time Investment

In a final step, all participants were asked to report the time they spent on each iteration. The results (summed time investment for all iterations) are evaluated and presented in Figure 9. Figure 9 shows that a medium time investment is the most beneficial for the accuracy results. For our study medium time investment is defined between 240 (4 h) and 330 (5 h and 10 min) minutes in total.

4. Discussion

The second experiment showed that it is not straightforward to deduce improved guidelines from the metadata and the training areas. As was shown in the results, no significant relation could be found between personality and dedication traits. This could mean that any individual, independently of their background could properly map Local Climate Zones after some training (e.g., through multiple iterations or by using a `driving test’ previous to the mapping). However, the small size of the HUMINEX 2.0 sample does not allow for drawing such conclusions. Experiments with more participants should be performed to get convincing results. Still, results indicate that pressuring participants decreases their ability to produce accurate maps. Encouragingly, the driving test results support that all WUDAPT contributors shall take the test in order to improve their capacity to locate and recognize representative TAs, and hence their mapping accuracies. Self-assessment of the intermediate and final mapping results indicated that participants became better in assessing the quality of their maps after multiple iterations, even though the overall accuracy for all maps remained rather low. The most interesting results from the second experiment are related to the input of the participants on difficult classes and the information embedded within the training areas. If a LCZ is not present or not sufficiently large, participants often indicated this correctly. A similar conclusion can be made for the surface area and the number of TAs, indicating that when LCZs are not present in sufficient large surface areas, it is generally harder for participants to find TAs in large numbers or with an adequate surface area. This will become clear after the first iteration.
For future research it is of importance to include the limitations of this experiment. First, as discussed in the methods, less than 50% of the participants delivered useful data for HUMINEX 2.0. In this respect, it is of utmost importance to improve communication in this type of experiments, otherwise significant result are difficult to come by. Second, due to the fact that less then 10% of the participants lived in Berlin or were familiar with the city, it was not possible to investigate the influence of local knowledge on the classification results. Even though, currently research is done investigating the potential of continental-scale LCZ maps [26,27,28], the question on local knowledge remains important. In this respect, it might be better to include more cities. But instead of focusing on western/ European cities, as was done in HUMINEX 1.0, it might be important to include cities but also participants from other geographical backgrounds.

5. Conclusions

The second phase of the HUMan INfluence EXperiment (HUMINEX 2.0) focused on a single city (Berlin, Germany) and provided a standardized introduction to the topic as part of the student courses within participating institutions. The experiment’s main aim was to provide users with better guidelines to produce more accurate LCZ maps.
Participants who did the driving test achieved better results and were able to assess the importance of the different zones in their study area. Moreover, results indicated that stressful conditions are likely to reduce the mapping accuracies. It hence means that education of the participants and proper working conditions are indispensable for achieving good results. Unfortunately, the relatively small sample size (as a result of the small amount of valid submissions) did not allow us to draw robust conclusions on the influence of personality factors or the role of local knowledge on the quality of the LCZ maps. Yet despite these deficiencies (present in both phases of HUMINEX), the following guidelines for improved mapping using the WUDAPT methodology can be derived:
  • Follow the rules of the WUDAPT protocol concerning the size and form of training areas;
  • Spend at least 4 hours (for a city similar to Berlin) on the classification without being stressed;
  • Carry out the driving test before doing the actual classification;
  • The more iterations (at least three) the better the accuracy;
  • Submit your LCZ map and training areas to the WUDAPT portal [29], even if your city is already present: combining training areas typically results in an overall better classification.

Author Contributions

B.B., M.-l.V., M.D. and F.V.C. came up with the idea to run HUMINEX 2.0. O.B., D.F., M.-l.V., B.B., C.B., A.D., and F.L. ran the HUMINEX 2.0 experiment with their students. M.-l.V. mostly analysed the data, supported by M.D. and F.V.C. M.-l.V. wrote the original draft and all of the authors contributed to the reviewing and editing of the paper.

Funding

This research was funded by the Belgian Federal Science Policy Office, as part of the UrbanEARS project (SR/00/307); by the Remote sensing for Epidemiology in African CiTies (REACT: http://react.ulb.be/) project, funded by the STEREO-III program of the Belgian Science Policy (BELSPO, SR/00/337); by the NWO project number 864.14.007; and by the German Research Foundation (Grant No. SCHE 750/15-1).

Acknowledgments

The authors would like to thank the involved teaching assistants as well as all participants.

Conflicts of Interest

The authors declare no conflict of interest. The funders had no role in the design of the study; in the collection, analyses, or interpretation of data; in the writing of the manuscript, and in the decision to publish the results.

References

  1. WOS. Web of Science. 2018. Available online: http://apps.webofknowledge.com (accessed on 3 October 2018).
  2. Stewart, I.D.; Oke, T.R. Local climate zones for urban temperature studies. Bull. Am. Meteorol. Soc. 2012, 93, 1879–1900. [Google Scholar] [CrossRef]
  3. Stewart, I.D.; Oke, T.R.; Krayenhoff, E.S. Evaluation of the ’local climate zone’ scheme using temperature observations and model simulations. Int. J. Climatol. 2014, 34, 1062–1080. [Google Scholar] [CrossRef]
  4. Bechtel, B.; Alexander, P.; Böhner, J.; Ching, J.; Conrad, O.; Feddema, J.; Mills, G.; See, L.; Stewart, I. Mapping Local Climate Zones for a Worldwide Database of the form and Function of Cities. ISPRS Int. J. Geo-Inf. 2015, 4, 199–219. [Google Scholar] [CrossRef]
  5. Bechtel, B.; Daneke, C. Classification of local climate zones based on multiple earth observation data. IEEE J. Sel. Top. Appl. Earth Obs. Remote Sens. 2012, 5, 1191–1202. [Google Scholar] [CrossRef]
  6. Cai, M.; Ren, C.; Xu, Y.; Lau, K.K.L.; Wang, R. Investigating the relationship between local climate zone and land surface temperature using an improved WUDAPT methodology—A case study of Yangtze River Delta, China. Urban Clim. 2017. [Google Scholar] [CrossRef]
  7. Ching, J.; Mills, G.; Bechtel, B.; See, L.; Feddema, J.; Wang, X.; Ren, C.; Brousse, O.; Martilli, A.; Neophytou, M.; et al. World Urban Database and Access Portal Tools (WUDAPT), an urban weather, climate and environmental modeling infrastructure for the Anthropocene. Bull. Am. Meteorol. Soc. 2018. [Google Scholar] [CrossRef]
  8. Goodchild, M.F. Citizens as sensors: The world of volunteered geography. GeoJournal 2007, 69, 211–221. [Google Scholar] [CrossRef]
  9. See, L.; Mooney, P.; Foody, G.; Bastin, L.; Comber, A.; Estima, J.; Fritz, S.; Kerle, N.; Jiang, B.; Laakso, M.; et al. Crowdsourcing, Citizen Science or Volunteered Geographic Information? The Current State of Crowdsourced Geographic Information. ISPRS Int. J. Geo-Inf. 2016, 5, 55. [Google Scholar] [CrossRef]
  10. ICUC. 10th International Conference on Urban Climate/14th Symposium on the Urban Environment. 2018. Available online: https://www.urban-climate.org/icuc/ (accessed on 5 October 2018).
  11. Alexander, P.J.; Fealy, R.; Mills, G.M. Simulating the impact of urban development pathways on the local climate: A scenario-based analysis in the greater Dublin region, Ireland. Landsc. Urban Plan. 2016, 152, 72–89. [Google Scholar] [CrossRef]
  12. Alexander, P.J.; Mills, G.; Fealy, R. Using LCZ data to run an urban energy balance model. Urban Clim. 2015, 13, 14–37. [Google Scholar] [CrossRef]
  13. Brousse, O.; Martilli, A.; Foley, M.; Mills, G.; Bechtel, B. WUDAPT, an efficient land use producing data tool for mesoscale models? Integration of urban LCZ in WRF over Madrid. Urban Clim. 2016, 17, 116–134. [Google Scholar] [CrossRef]
  14. Brousse, O.; Georganos, S.; Demuzere, M.; Vanhuysse, S.; Wouters, H.; Wolff, E.; Linard, C.; Lipzig, N.P.V. Urban Climate Using Local Climate Zones in Sub-Saharan Africa to tackle urban health issues. Urban Clim. 2019, 27, 227–242. [Google Scholar] [CrossRef]
  15. Leconte, F.; Bouyer, J.; Claverie, R.; Pétrissans, M. Using Local Climate Zone scheme for UHI assessment: Evaluation of the method using mobile measurements. Build. Environ. 2015, 83, 39–49. [Google Scholar] [CrossRef]
  16. Hammerberg, K.; Brousse, O.; Martilli, A.; Mahdavi, A. Implications of employing detailed urban canopy parameters for mesoscale climate modelling: A comparison between WUDAPT and GIS databases over Vienna, Austria. Int. J. Climatol. 2018, 38, 1241–1257. [Google Scholar] [CrossRef]
  17. Ching, J. A perspective on urban canopy layer modeling for weather, climate and air quality applications. Urban Clim. 2013, 3, 13–39. [Google Scholar] [CrossRef]
  18. Siu, L.W.; Hart, M.A. Quantifying urban heat island intensity in Hong Kong SAR, China. Environ. Monit. Assess. 2013, 185, 4383–4398. [Google Scholar] [CrossRef] [PubMed]
  19. Verdonck, M.; Demuzere, M.; Hooyberghs, H.; Beck, C.; Cyrys, J.; Schneider, A.; Dewulf, R.; Van Coillie, F. The potential of local climate zones maps as a heat stress assessment tool, supported by simulated air temperature data. Landsc. Urban Plan. 2018, 178, 183–197. [Google Scholar] [CrossRef]
  20. Wouters, H.; Demuzere, M.; Blahak, U.; Fortuniak, K.; Maiheu, B.; Camps, J.; Tielemans, D.; van Lipzig, N.P. Efficient urban canopy parametrization for atmospheric modelling: Description and application with the COSMO-CLM model (version 5.0_clm6) for a Belgian Summer. Geosci. Model Dev. 2016, 9, 3027–3054. [Google Scholar] [CrossRef]
  21. Fenner, D.; Meier, F.; Bechtel, B.; Otto, M.; Scherer, D. Intra and inter ‘local climate zone’ variability of air temperature as observed by crowdsourced citizen weather stations in Berlin, Germany. Meteorol. Z. 2017, 26, 525–547. [Google Scholar] [CrossRef]
  22. Verdonck, M.; Okujeni, A.; van der Linden, S.; Demuzere, M.; De Wulf, R.; Van Coillie, F. Influence of neighbourhood information on ‘ Local Climate Zone ’ mapping in heterogeneous cities. Int. J. Appl. Earth Obs. Geoinf. 2017, 62, 102–113. [Google Scholar] [CrossRef]
  23. Bechtel, B.; Demuzere, M.; Sismanidis, P.; Fenner, D.; Brousse, O.; Beck, C.; Van Coillie, F.; Conrad, O.; Keramitsoglou, I.; Middel, A.; et al. Quality of Crowdsourced Data on Urban Morphology—The Human Influence Experiment (HUMINEX). Urban Sci. 2017, 10, 15. [Google Scholar] [CrossRef]
  24. Van Coillie, F.M.; Gardin, S.; Anseel, F.; Duyck, W.; Verbeke, L.P.L.; Wulf, R.; De Wulf, R. Variability of operator performance in remote-sensing image interpretation: The importance of human and external factors. Int. J. Remote Sens. 2014, 35, 754–778. [Google Scholar] [CrossRef]
  25. Sokolova, M.; Lapalme, G. A systematic analysis of performance measures for classification tasks. Inf. Process. Manag. 2009, 45, 427–437. [Google Scholar] [CrossRef]
  26. Hu, J.; Ghamisi, P.; Zhu, X. Feature Extraction and Selection of Sentinel-1 Dual-Pol Data for Global-Scale Local Climate Zone Classification. Int. J. Geo-Inf. Artic. 2018, 7, 379. [Google Scholar] [CrossRef]
  27. Demuzere, M.; Bechtel, B.; Mills, G. Global transferability of Local Climate Zone models. Urban Clim. 2019, 27, 46–63. [Google Scholar] [CrossRef]
  28. Demuzere, M.; Bechtel, B.; Middel, A.; Mills, G. Mapping Europe into Local Climate Zones. PLoS ONE 2019. under review. [Google Scholar]
  29. Bechtel, B.; Alexander, P.J.; Beck, C.; Brousse, O.; Ching, J.; Demuzere, M.; Gal, T.; Hidalgo, J.; Hoffman, P.; Middel, A.; et al. Generating WUDAPT Level 0 data—Current status of production and evaluation. Urban Clim. 2019, 27, 24–45. [Google Scholar] [CrossRef]
Figure 1. Urban (110) and natural (AG) LCZ types and their characteristics (adapted from Table 2 in Stewart and Oke [2], text shortened, icons reworked) B: Buildings; C: cover; M: materials; F: function; Tall: >10 stories, Mid-rise: 3–9 stories, Low: 1–3 stories.
Urbansci 03 00027 g001
Figure 2. (a) Boxplots of self-estimated (SE) and actual (OA) overall accuracy for each iteration. Median OA: red stripe; average OA: white dot; boxplot ends: first and third quantile; whiskers: + / - the 1.5 fold interquartile range on OA values and outliers: grey dots. (b) Difference between self-estimated and actual overall accuracy. Numbers beneath the bars indicate the number of participants who respectively under- or overestimated the mapping accuracy.
Urbansci 03 00027 g002
Figure 3. Number of TA sets according to surface area (km 2 ).
Urbansci 03 00027 g003
Figure 4. Boxplots of overall accuracies for each iteration depending on driving test. Median OA: red stripe; average OA: white dot; boxplot ends: first and third quantile; whiskers: + / - the 1.5-fold interquartile range on OA values and outliers: grey dots.
Urbansci 03 00027 g004
Figure 5. Number of test images versus overall accuracy.
Urbansci 03 00027 g005
Figure 6. Boxplots of overall accuracies depending on iteration and group (a) motivation and (b) comparative anxiety. The x-axis ticks are formatted as X _ Y with X the iteration number and Y group number. Median OA: red stripe; average OA: white dot; boxplot ends: first and third quantile; whiskers: + / - the 1.5-fold interquartile range on OA values and outliers: grey dots.
Urbansci 03 00027 g006
Figure 7. Boxplots of overall accuracies depending on iteration and group for extraversion, neuroticism and conscientiousness. The x-axis ticks are formatted as X _ Y with X the iteration number and Y group number. Median OA: red stripe; average OA: white dot; boxplot ends: first and third quantile; whiskers: + / - the 1.5-fold interquartile range on OA values and outliers: grey dots.
Urbansci 03 00027 g007aUrbansci 03 00027 g007b
Figure 8. Boxplots for the F1 score for each LCZ after the last iteration, blue values = number of times a participant indicated this zone as difficult to classify over all iterations. Median OA: red stripe; average OA: white dot; boxplot ends: first and third quantile; whiskers: + / - the 1.5-fold interquartile range on OA values and outliers: grey dots. The colour of the boxplots are the LCZ colours when the zones are mapped.
Urbansci 03 00027 g008
Figure 9. Overall accuracy based on overall time investment. Median OA: red stripe; average OA: white dot; boxplot ends: first and third quantile; whiskers: + / - the 1.5-fold interquartile range on OA values and outliers: grey dots.
Urbansci 03 00027 g009
Table 1. Metadata collected from the participants. The allowed answers are provided in brackets (After Bechtel et al. [23]).
CategoryMetadata Collected
GeneralID; City name
participantNumber of participants per training area set; highest degree (B.Sc./M.Sc./Ph.D.); total years of study (Number of years); University course; Experience with Image Classification (Self-Estimation ); Age; Gender; City of origin
LCZ knowledgeIntroduction in seminar/course (Yes/No); WUDAPT website visit (Yes/No); study of Stewart and Oke 2012 paper (Yes/No); study of LCZ fact sheets (Yes/No); completion of LCZ Driving test (Yes/No); Numbers of cities classified before (Number of cities); LCZ knowledge self-estimation (0–100%)
City knowledgeHow long have you lived in the city of interest (Number of years); how long have you lived in similar (climate, morphology) cities (Number of years); Familiarity with city of interest self-estimation (0–100%)
ClassificationTime invested for training area collection (Number of hours); Number of iterations (Number of iterations); Used online manuals? (Yes/No); Which LCZ did you find difficult to distinguish? (LCZ type)
OverallSelf-Rating (0–100%) of final classification [map] quality
PersonalityAll 40 personality related questions can be found in Table 2
DedicationAll 20 dedication related questions can be found in Table 2
Table 2. Dedication and Personality related questions in the HUMINEX questionaire.
Dedication TraitQuestion
MotivationDoing well in this classification exercise is important to me;
I wanted to do well in this exercise;
I tried my best in this exercise;
I tried to do the very best I could in this exercise;
While taking this test, I concentrated and tried to do well;
I want to be among the top scorers in this exercise;
I pushed myself to work hard on this exercise;
I was extremely motivated to do well in this exercise;
I just did not care how I did in this exercise;
I did not put much effort in this exercise;
Comparative anxietyI probably did not do as well as most of the other people who participated in this exercise;
I am not good at exercises;
During the exercise, I often thought about how poor I was doing;
I usually get very anxious about doing exercises;
I usually perform well on exercises;
I expect to be among the people who score really well in this exercise;
My scores usually do not reflect my true abilities;
I very much dislike doing exercises of this type;
During the exercise, I found myself thinking of the consequence of failing;
During the exercise, I got so nervous I couldn’t do as well as I should have.
Personality TraitQuestion
ExtraversionMake friends easily;
Feel comfortable around people;
Start conversations;
Know how to captivate people;
Don’t mind being the left of attention;
Don’t talk a lot;
Keep in the background;
Have little to say;
Don’t like to draw attention to myself;
Am quit around strangers;
I see myself as extroverted, enthusiastic;
I see myself as reserved, quiet;
NeuroticismI’m relaxed most of the time;
Seldom feel blue;
Get stressed out easily;
Worry about things;
Am easily disturbed;
Get upset easily;
Change my mood a lot;
Have frequent mood swings;
Get irritated easily;
Often feel blue;
I see myself as anxious, easily upset;
I see myself as emotionally stable, calm;
ConscientiousnessAm always prepared;
Pay attention to details;
Get chores done right away;
Follow a schedule;
Like order;
Am exacting/demanding in my work;
Leave my belongings around;
Make a mess of things;
Often forget to put things back in their proper place;
Shirk my duties;
I see myself as dependable, self-disciplined;
I see myself as disorganized, careless;
AgreeablenessI see myself a critical, quarrelsome;
I see myself as sympathetic, warm;
OpennessI see myself as open to new experience, complex;
I see myself as conventional, uncreative.
Table 3. Participants and cities in the HUMan INfluence EXperiment.
Name of InstituteNumber of Students# TA Sets Used in Evaluation
University of Augsburg2516
NO institute11
Yncréa HEI196
University of Leuven (2017/2018)35/289/11
Technical university of Berlin155
Ghent University63
Wageningen University138
Table 4. TA characteristics for area, number, shape and node count of TAs, NS = not selected by a participant.
LCZ 1LCZ 2LCZ 3LCZ 4LCZ 5LCZ 6LCZ 7LCZ 8LCZ 9LCZ 10
Area (km 2 )
mean0.11.00.30.30.50.50.20.40.30.3
max0.87.92.71.22.13.51.01.56.71.3
Number
mean3.69.75.76.710.714.76.129.997.36.2
min1212351411
max112616195011523281719
NS1511640035179
Shape (mean)1.521.511.491.331.461.471.631.451.591.80
Vertices (mean)6.027.778.587.887.547.767.268.337.417.99
LCZ ALCZ BLCZ CLCZ DLCZ ELCZ FLCZ G
Area (km 2 )
mean5.90.80.52.70.30.31.1
max28.48.55.712.82.51.73.5
Number
mean13.19.66.312.47.58.513.9
min7118116
max40241538262140
NS0010000
Shape (mean)1.991.621.661.832.102.812.22
Vertices (mean)10.708.448.638.987.809.3412.10
Table 5. Different group sizes and thresholds for each personality and dedication trait.
ExtraversionNeuroticismConscientiousnessMotivationComparative Anxiety
Group SizeThresholdGroup SizeThresholdGroup SizeThresholdGroup SizeThresholdGroup SizeThreshold
Group 122<2.720<3.121<3.319<318<2.3
Group 2172.7–3.1203.1–3.6213.3–3.8193–3.4192.3–2.6
Group 320>3.119>3.617>3.818>3.418>2.6

