
Genomic Epidemiology of the First Wave of SARS-CoV-2 in Italy

 , , , , , , , and
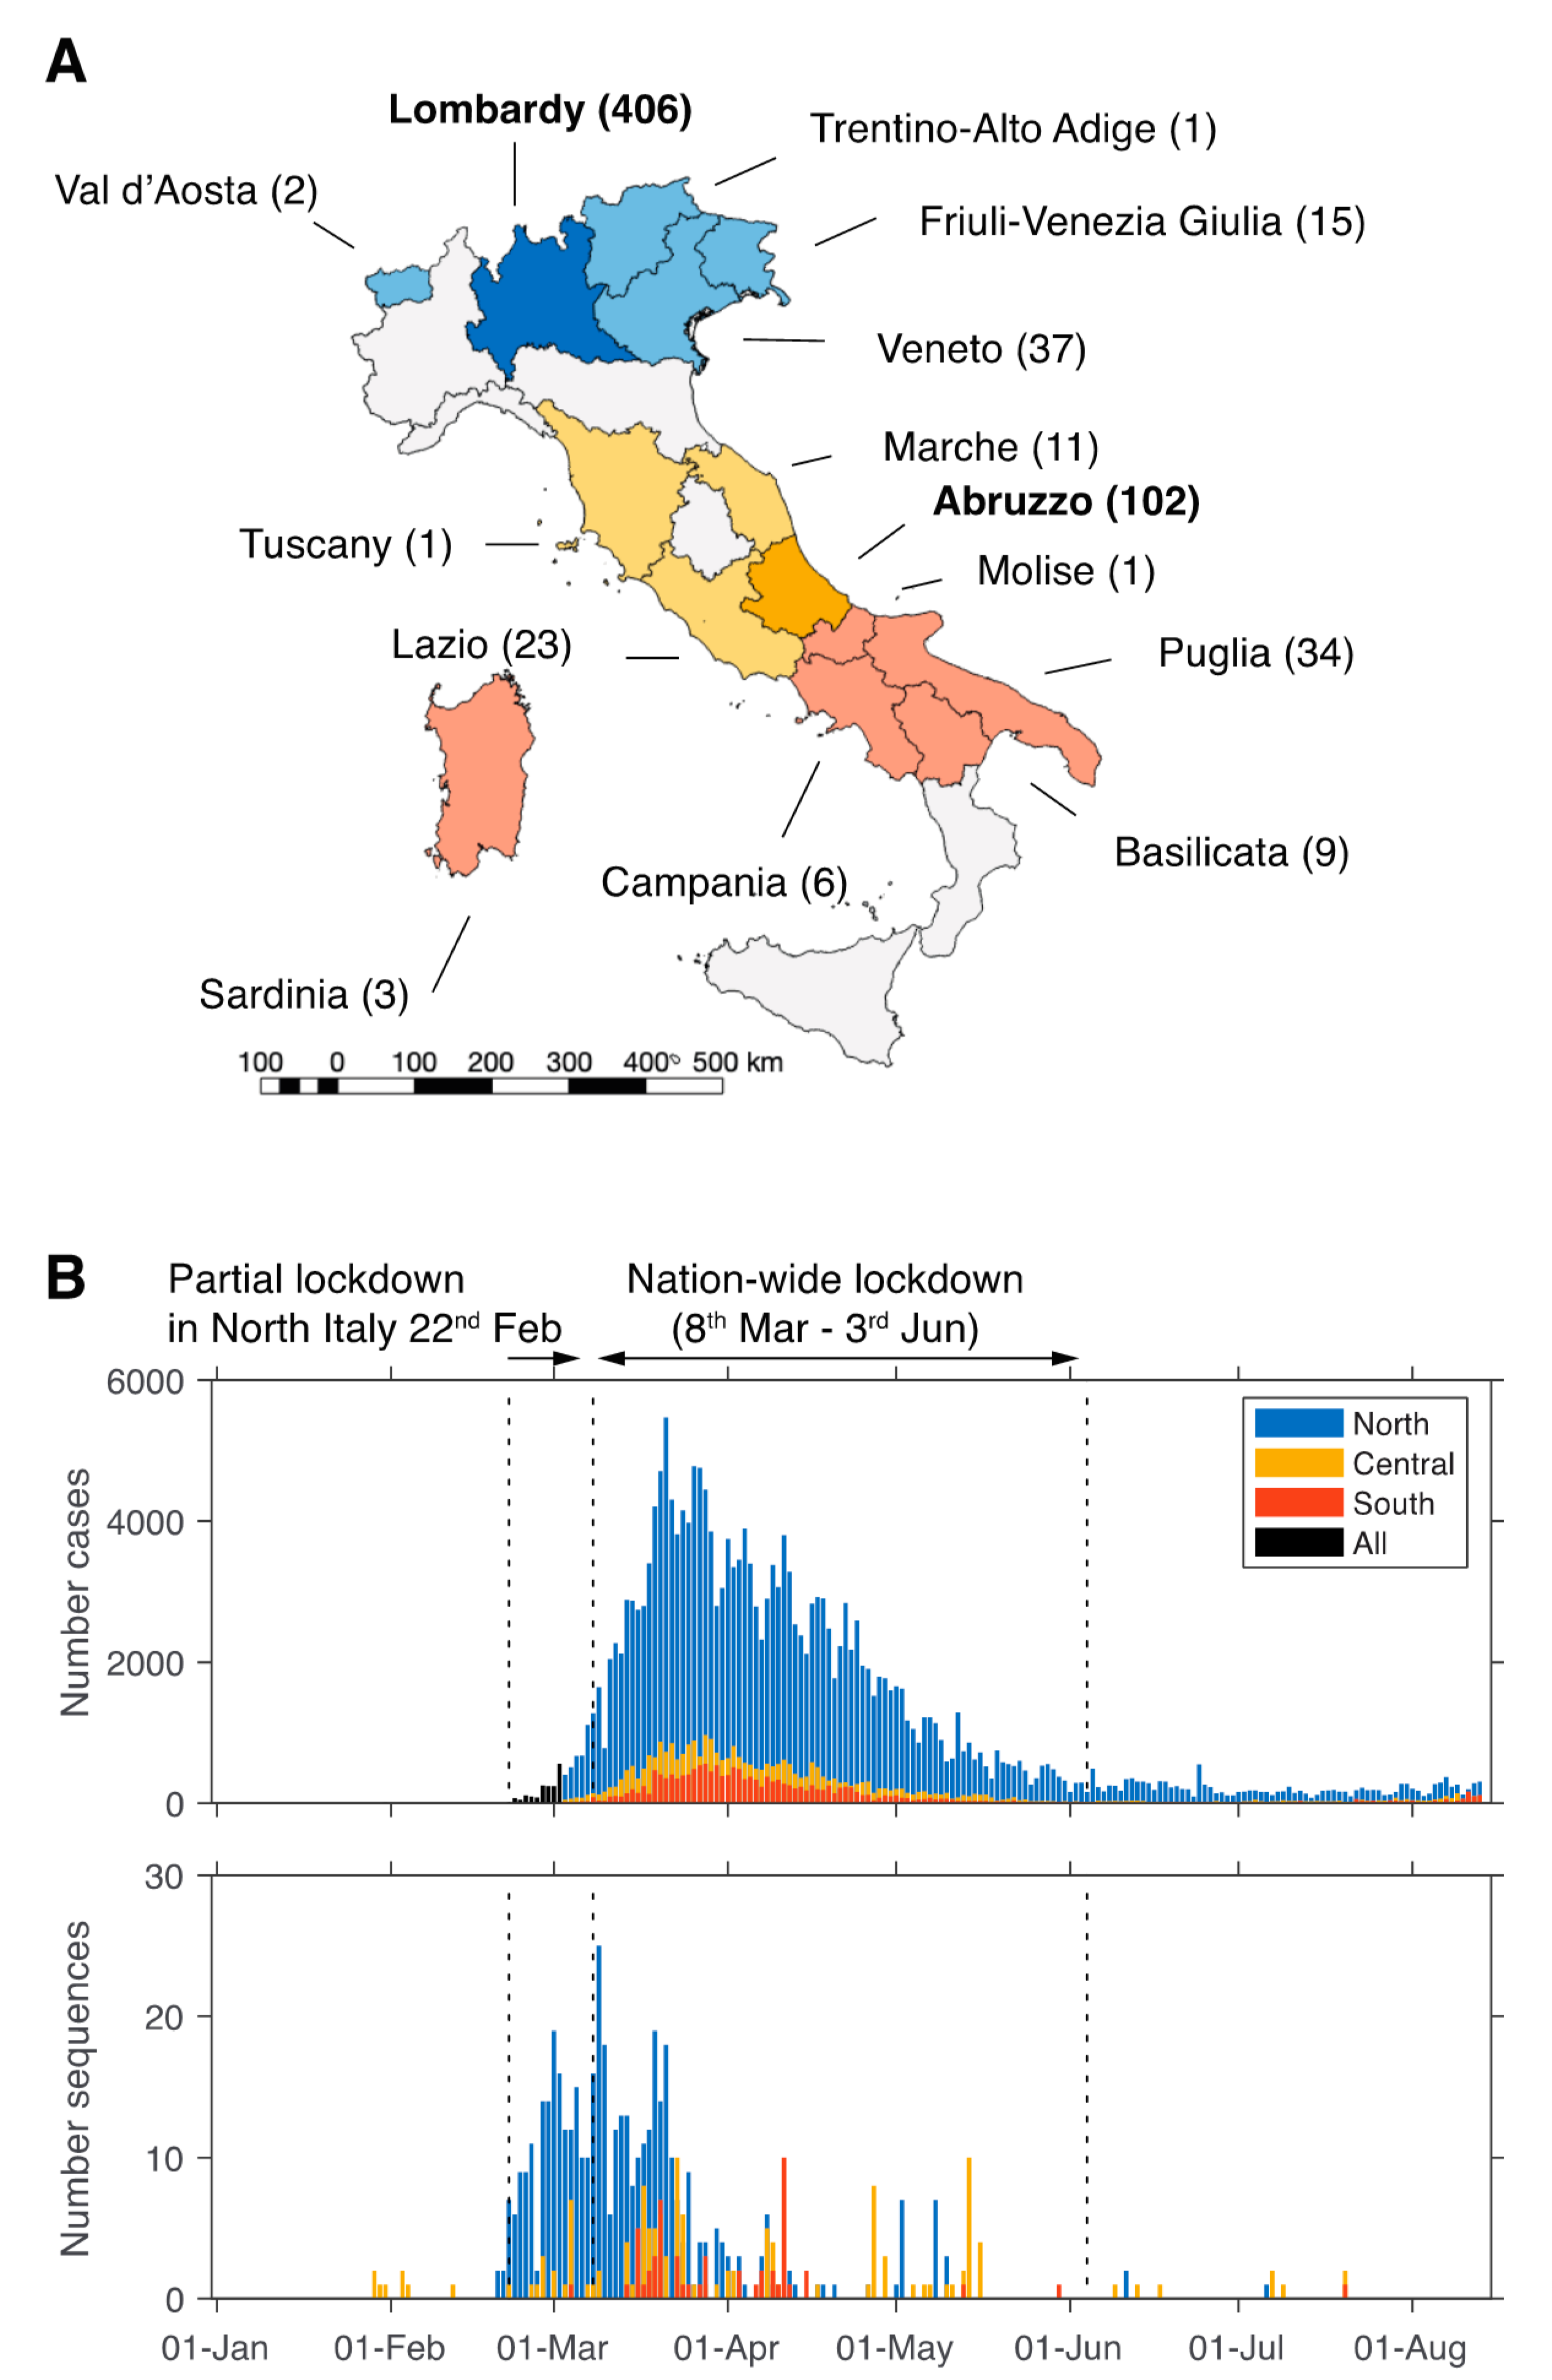
Abstract
:1. Introduction
2. Materials and Methods
2.1. Ethics
2.2. Specimen Collection
2.3. Virus Genome Sequencing
2.4. Global SARS-CoV-2 Data Set
2.5. Phylogenetic Analysis
2.6. Data Availability
3. Results
3.1. Limited Availability of SARS-CoV-2 from Italy
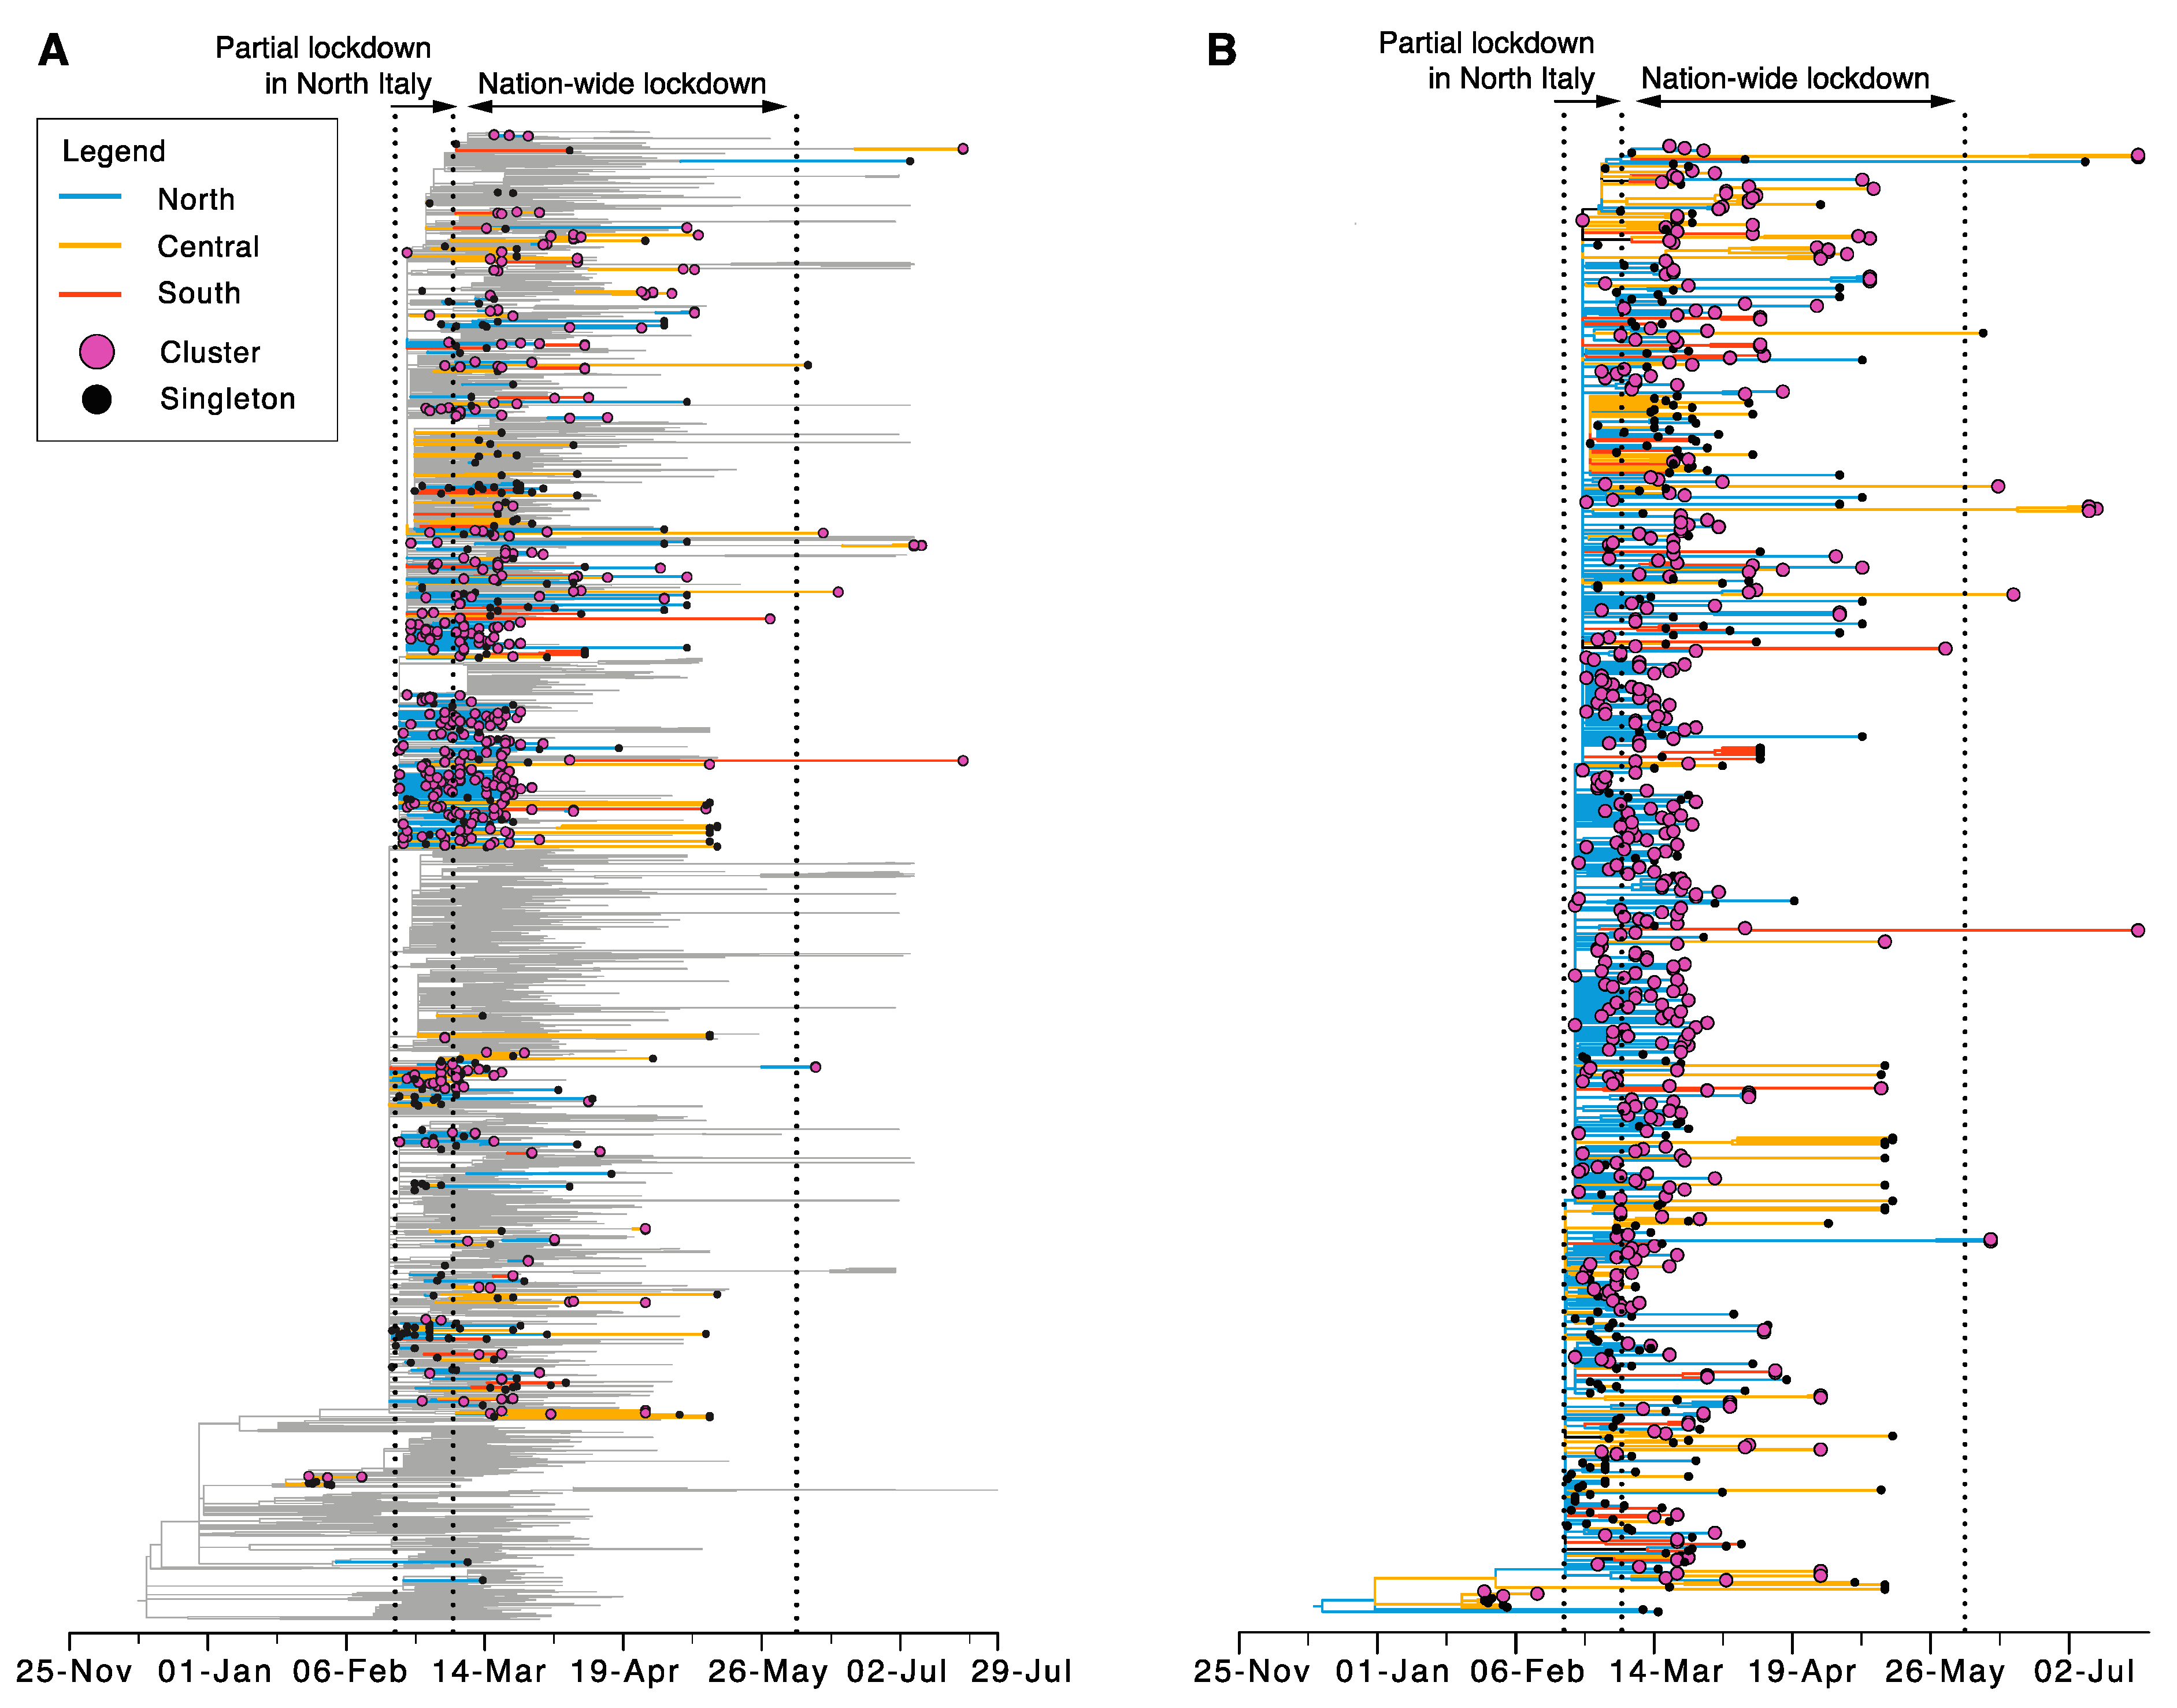
3.2. Origin and Spread of SARS-CoV-2 in Italy
3.3. Sustained Local Transmission during Lockdown Period
3.4. Limited Genetic Diversity
4. Discussion
5. Conclusions
Supplementary Materials
Author Contributions
Funding
Acknowledgments
Conflicts of Interest
References
- De Wit, E.; van Doremalen, N.; Falzarano, D.; Munster, V.J. SARS and MERS: Recent insights into emerging coronaviruses. Nat. Rev. Microbiol. 2016, 14, 523–534. [Google Scholar] [CrossRef]
- Andersen, K.G.; Rambaut, A.; Lipkin, W.I.; Holmes, E.C.; Garry, R.F. The proximal origin of SARS-CoV-2. Nat. Med. 2020, 26, 450–452. [Google Scholar] [CrossRef] [Green Version]
- Decaro, N.; Lorusso, A. Novel human coronavirus (SARS-CoV-2): A lesson from animal coronaviruses. Vet. Microbiol. 2020, 244, 108693. [Google Scholar] [CrossRef] [PubMed]
- Lorusso, A.; Calistri, P.; Petrini, A.; Savini, G.; Decaro, N. Novel coronavirus (SARS-CoV-2) epidemic: A veterinary perspective. Vet. Ital. 2020, 56, 5–10. [Google Scholar] [CrossRef] [PubMed]
- Coronaviridae Study Group of the International Committee on Taxonomy of Viruses. The species Severe acute respiratory syndrome-related coronavirus: Classifying 2019-nCoV and naming it SARS-CoV-2. Nat. Microbiol. 2020, 5, 536–544. [Google Scholar] [CrossRef] [Green Version]
- Wu, F.; Zhao, S.; Yu, B.; Chen, Y.M.; Wang, W.; Song, Z.G.; Hu, Y.; Tao, Z.W.; Tian, J.H.; Pei, Y.Y.; et al. A new coronavirus associated with human respiratory disease in China. Nature 2020, 579, 265–269. [Google Scholar] [CrossRef] [PubMed] [Green Version]
- WHO. Weekly Epidemiological Update—8 December 2020; WHO: Geneva, Switzerland, 2020. [Google Scholar]
- WHO. Coronavirus Disease 2019 (COVID-19) Situation Report—33; WHO: Geneva, Switzerland, 2020. [Google Scholar]
- WHO. Coronavirus Disease 2019 (COVID-19) Situation Report—34; WHO: Geneva, Switzerland, 2020. [Google Scholar]
- Lai, A.; Bergna, A.; Caucci, S.; Clementi, N.; Vicenti, I.; Dragoni, F.; Cattelan, A.M.; Menzo, S.; Pan, A.; Callegaro, A.; et al. Molecular tracing of SARS-CoV-2 in Italy in the first three months of the epidemic. Viruses 2020, 12, 798. [Google Scholar] [CrossRef]
- Mauro, T. Statistiche Coronaviurs in Italia. Available online: https://statistichecoronavirus.it/coronavirus-italia/ (accessed on 3 November 2020).
- Zehender, G.; Lai, A.; Bergna, A.; Meroni, L.; Riva, A.; Balotta, C.; Tarkowski, M.; Gabrieli, A.; Bernacchia, D.; Rusconi, S.; et al. Genomic characterization and phylogenetic analysis of SARS-COV-2 in Italy. J. Med. Virol. 2020, 92. [Google Scholar] [CrossRef] [Green Version]
- Rambaut, A.; Holmes, E.C.; O’Toole, A.; Hill, V.; McCrone, J.T.; Ruis, C.; du Plessis, L.; Pybus, O.G. A dynamic nomenclature proposal for SARS-CoV-2 lineages to assist genomic epidemiology. Nat. Microbiol. 2020, 5, 1403–1407. [Google Scholar] [CrossRef]
- Korber, B.; Fischer, W.M.; Gnanakaran, S.; Yoon, H.; Theiler, J.; Abfalterer, W.; Hengartner, N.; Giorgi, E.E.; Bhattacharya, T.; Foley, B.; et al. Tracking changes in SARS-CoV-2 spike: Evidence that D614G increases infectivity of the COVID-19 virus. Cell 2020, 182, 812–827.e19. [Google Scholar] [CrossRef]
- Plante, J.A.; Liu, Y.; Liu, J.; Xia, H.; Johnson, B.A.; Lokugamage, K.G.; Zhang, X.; Muruato, A.E.; Zou, J.; Fontes-Garfias, C.R.; et al. Spike mutation D614G alters SARS-CoV-2 fitness. Nature 2020. [Google Scholar] [CrossRef] [PubMed]
- Korber, B.; Fischer, W.M.; Gnanakaran, S.; Yoon, H.; Theiler, J.; Abfalterer, W.; Foley, B.; Giorgi, E.E.; Bhattacharya, T.; Parker, M.D.; et al. Spike mutation pipeline reveals the emergence of a more transmissible form of SARS-CoV-2. bioRxiv 2020. [Google Scholar] [CrossRef]
- Torresi, M. Statistiche Coronavirus Abruzzo. Available online: https://statistichecoronavirus.it/coronavirus-italia/coronavirus-abruzzo/ (accessed on 10 December 2020).
- Lorusso, A.; Calistri, P.; Mercante, M.T.; Monaco, F.; Portanti, O.; Marcacci, M.; Camma, C.; Rinaldi, A.; Mangone, I.; Di Pasquale, A.; et al. A “One-Health” approach for diagnosis and molecular characterization of SARS-CoV-2 in Italy. One Health 2020, 10, 100135. [Google Scholar] [CrossRef]
- Itokawa, K.; Sekizuka, T.; Hashino, M.; Tanaka, R.; Kuroda, M. Disentangling primer interactions improves SARS-CoV-2 genome sequencing by multiplex tiling PCR. PLoS ONE 2020, 15, e0239403. [Google Scholar] [CrossRef]
- Nguyen, L.T.; Schmidt, H.A.; von Haeseler, A.; Minh, B.Q. IQ-TREE: A fast and effective stochastic algorithm for estimating maximum-likelihood phylogenies. Mol. Biol. Evol. 2015, 32, 268–274. [Google Scholar] [CrossRef]
- Geoghegan, J.L.; Ren, X.; Storey, M.; Hadfield, J.; Jelley, L.; Jefferies, S.; Sherwood, J.; Paine, S.; Huang, S.; Douglas, J.; et al. Genomic epidemiology reveals transmission patterns and dynamics of SARS-CoV-2 in Aotearoa New Zealand. Nat. Commun. 2020, 11. [Google Scholar] [CrossRef]
- Hasegawa, M.; Kishino, H.; Yano, T. Dating of the human-ape splitting by a molecular clock of mitochondrial DNA. J. Mol. Evol. 1985, 22, 160–174. [Google Scholar] [CrossRef] [PubMed]
- To, T.H.; Jung, M.; Lycett, S.; Gascuel, O. Fast dating using least-squares criteria and algorithms. Syst. Biol. 2015, 65, 82–97. [Google Scholar] [CrossRef] [PubMed]
- Duchene, S.; Featherstone, L.; Haritopoulou-Sinanidou, M.; Rambaut, A.; Lemey, P.; Baele, G. Temporal signal and the phylodynamic threshold of SARS-CoV-2. Virus Evol. 2020, veaa061. [Google Scholar] [CrossRef] [PubMed]
- Lemey, P.; Hong, S.; Hill, V.; Baele, G.; Poletto, C.; Colizza, V.; O’Toole, A.; McCrone, J.T.; Andersen, K.G.; Worobey, M.; et al. Accommodating individual travel history, global mobility, and unsampled diversity in phylogeography: A SARS-CoV-2 case study. bioRxiv 2020. [Google Scholar] [CrossRef]
- Guindon, S.; Dufayard, J.F.; Lefort, V.; Anisimova, M.; Hordijk, W.; Gascuel, O. New algorithms and methods to estimate maximum-likelihood phylogenies: Assessing the performance of PhyML 3.0. Syst. Biol. 2010, 59, 307–321. [Google Scholar] [CrossRef] [PubMed] [Green Version]
- Suchard, M.A.; Lemey, P.; Baele, G.; Ayres, D.L.; Drummond, A.J.; Rambaut, A. Bayesian phylogenetic and phylodynamic data integration using BEAST 1.10. Virus Evol. 2018, 4, vey016. [Google Scholar] [CrossRef] [PubMed] [Green Version]
- Giovanetti, M.; Angeletti, S.; Benvenuto, D.; Ciccozzi, M. A doubt of multiple introduction of SARS-CoV-2 in Italy: A preliminary overview. J. Med. Virol. 2020, 92. [Google Scholar] [CrossRef] [PubMed]
- Bartolini, B.; Rueca, M.; Gruber, C.E.M.; Messina, F.; Carletti, F.; Giombini, E.; Lalle, E.; Bordi, L.; Matusali, G.; Colavita, F.; et al. SARS-CoV-2 Phylogenetic Analysis, Lazio Region, Italy, February-March 2020. Emerg. Infect. Dis. 2020, 26, 1842–1845. [Google Scholar] [CrossRef] [PubMed]
- Gudbjartsson, D.F.; Helgason, A.; Jonsson, H.; Magnusson, O.T.; Melsted, P.; Norddahl, G.L.; Saemundsdottir, J.; Sigurdsson, A.; Sulem, P.; Agustsdottir, A.B.; et al. Spread of SARS-CoV-2 in the Icelandic population. N. Engl. J. Med. 2020, 382, 2302–2315. [Google Scholar] [CrossRef]


Publisher’s Note: MDPI stays neutral with regard to jurisdictional claims in published maps and institutional affiliations. |
© 2020 by the authors. Licensee MDPI, Basel, Switzerland. This article is an open access article distributed under the terms and conditions of the Creative Commons Attribution (CC BY) license (http://creativecommons.org/licenses/by/4.0/).
Share and Cite
Di Giallonardo, F.; Duchene, S.; Puglia, I.; Curini, V.; Profeta, F.; Cammà, C.; Marcacci, M.; Calistri, P.; Holmes, E.C.; Lorusso, A. Genomic Epidemiology of the First Wave of SARS-CoV-2 in Italy. Viruses 2020, 12, 1438. https://doi.org/10.3390/v12121438
Di Giallonardo F, Duchene S, Puglia I, Curini V, Profeta F, Cammà C, Marcacci M, Calistri P, Holmes EC, Lorusso A. Genomic Epidemiology of the First Wave of SARS-CoV-2 in Italy. Viruses. 2020; 12(12):1438. https://doi.org/10.3390/v12121438
Chicago/Turabian StyleDi Giallonardo, Francesca, Sebastian Duchene, Ilaria Puglia, Valentina Curini, Francesca Profeta, Cesare Cammà, Maurilia Marcacci, Paolo Calistri, Edward C. Holmes, and Alessio Lorusso. 2020. "Genomic Epidemiology of the First Wave of SARS-CoV-2 in Italy" Viruses 12, no. 12: 1438. https://doi.org/10.3390/v12121438