
Global mRNA and miRNA Analysis Reveal Key Processes in the Initial Response to Infection with WSSV in the Pacific Whiteleg Shrimp

 , , and
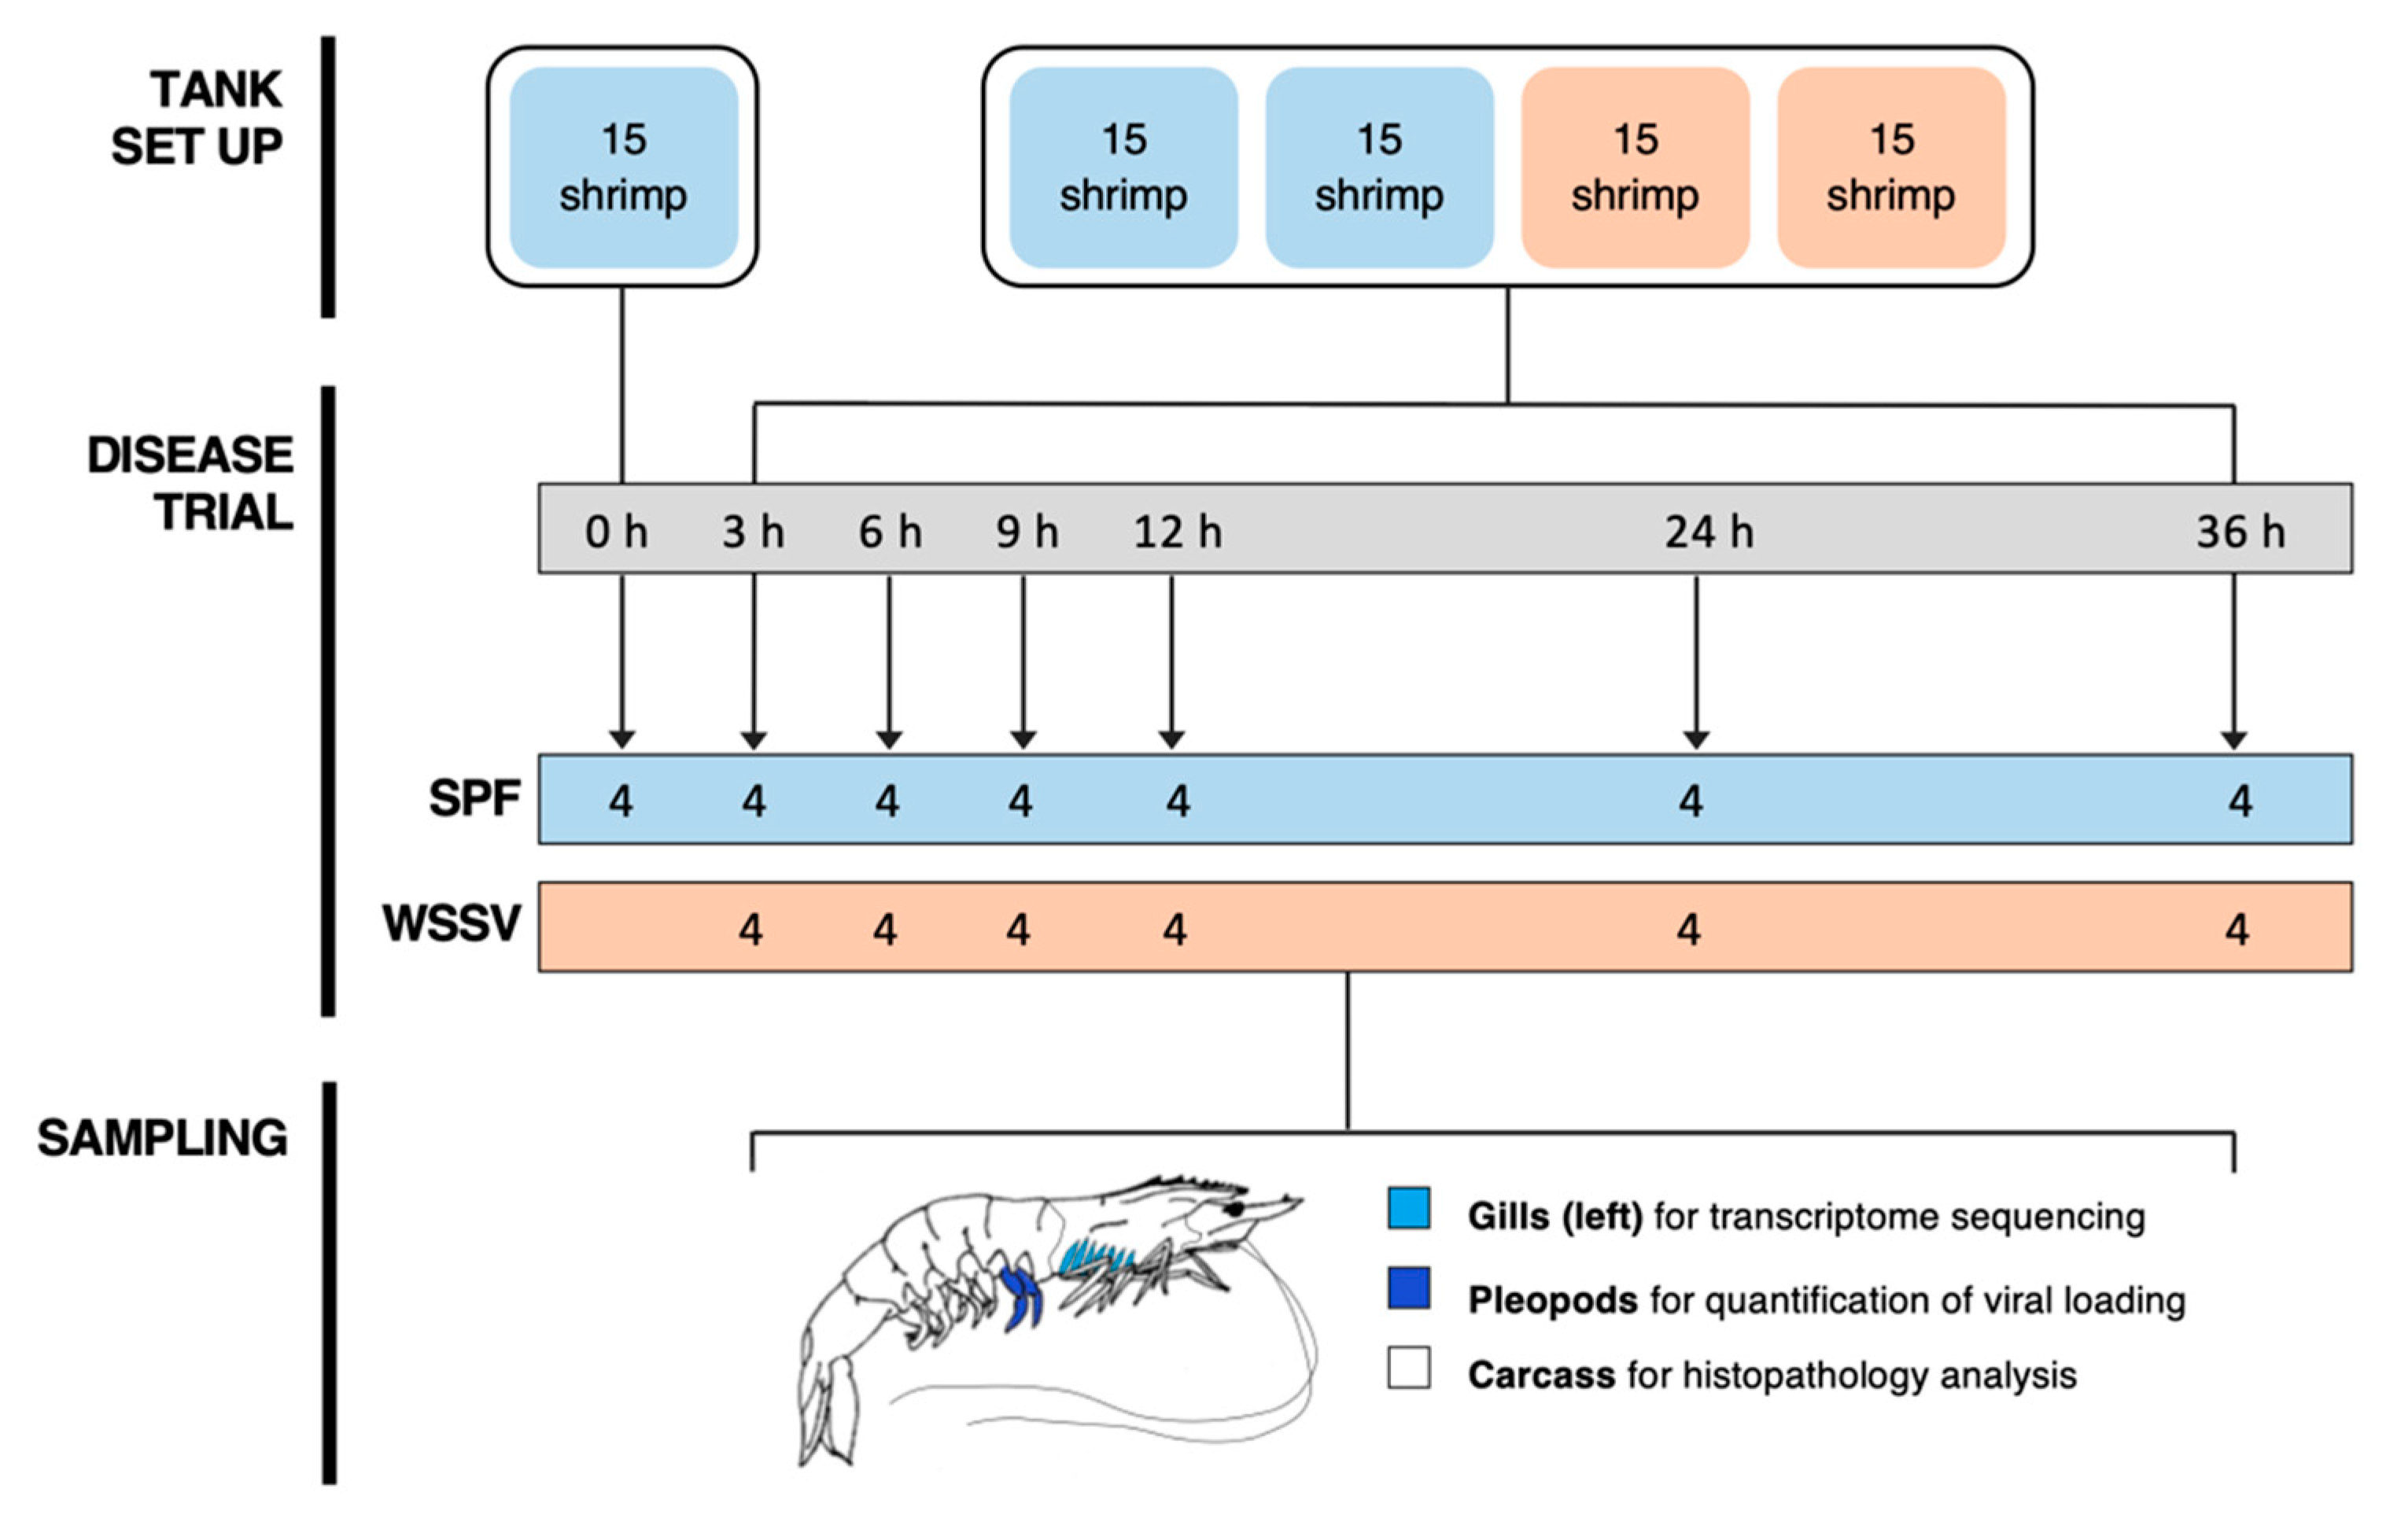
Abstract
:1. Introduction
2. Materials and Methods
2.1. Virus Inoculum Preparation
2.2. Disease Trial
2.3. Infection Confirmation and Viral Load Quantification
2.4. RNA Extraction, Library Preparation, and Sequencing
2.5. Transcriptome Analysis
2.6. miRNA Analysis
2.7. Integrated Analysis of RNA-Seq and miRNA-Seq
3. Results
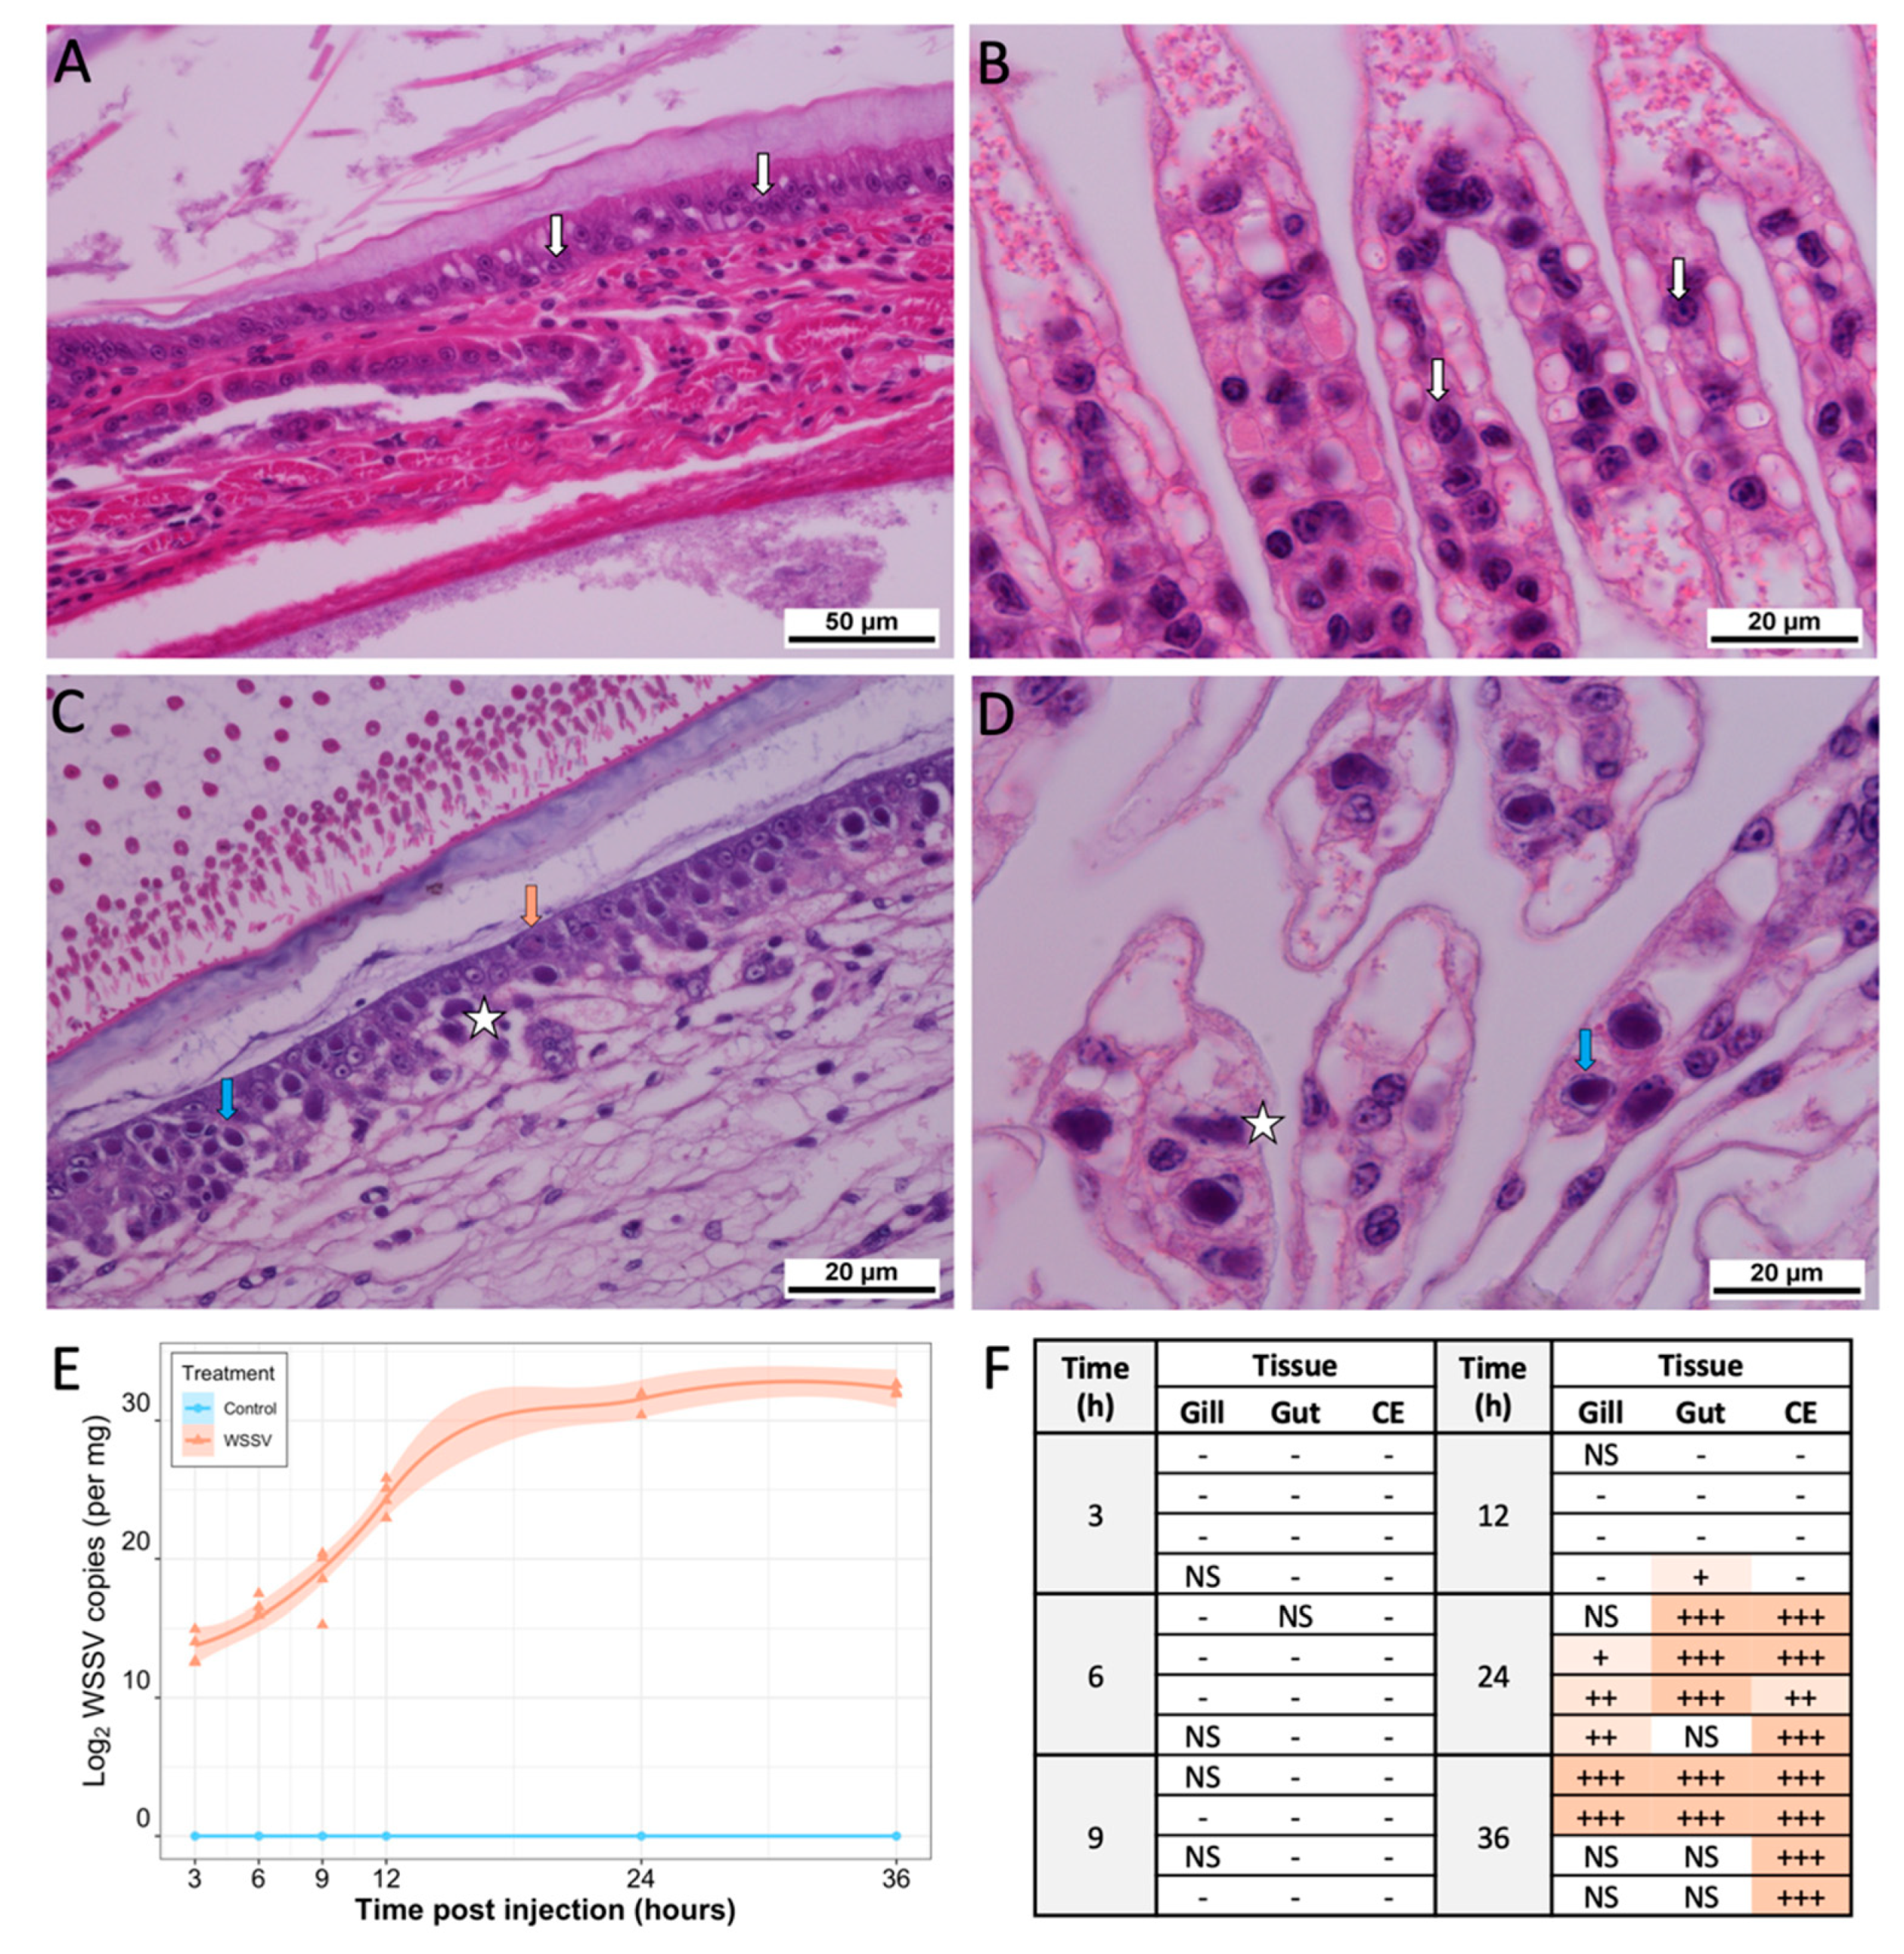
3.1. Disease Presentation
3.2. Sequencing and Transcriptome Assembly
3.3. Transcript Expression Analysis
3.4. miRNA Sequencing, Prediction and Analysis
3.5. Functional Analysis of Transcriptome and miRNA Data
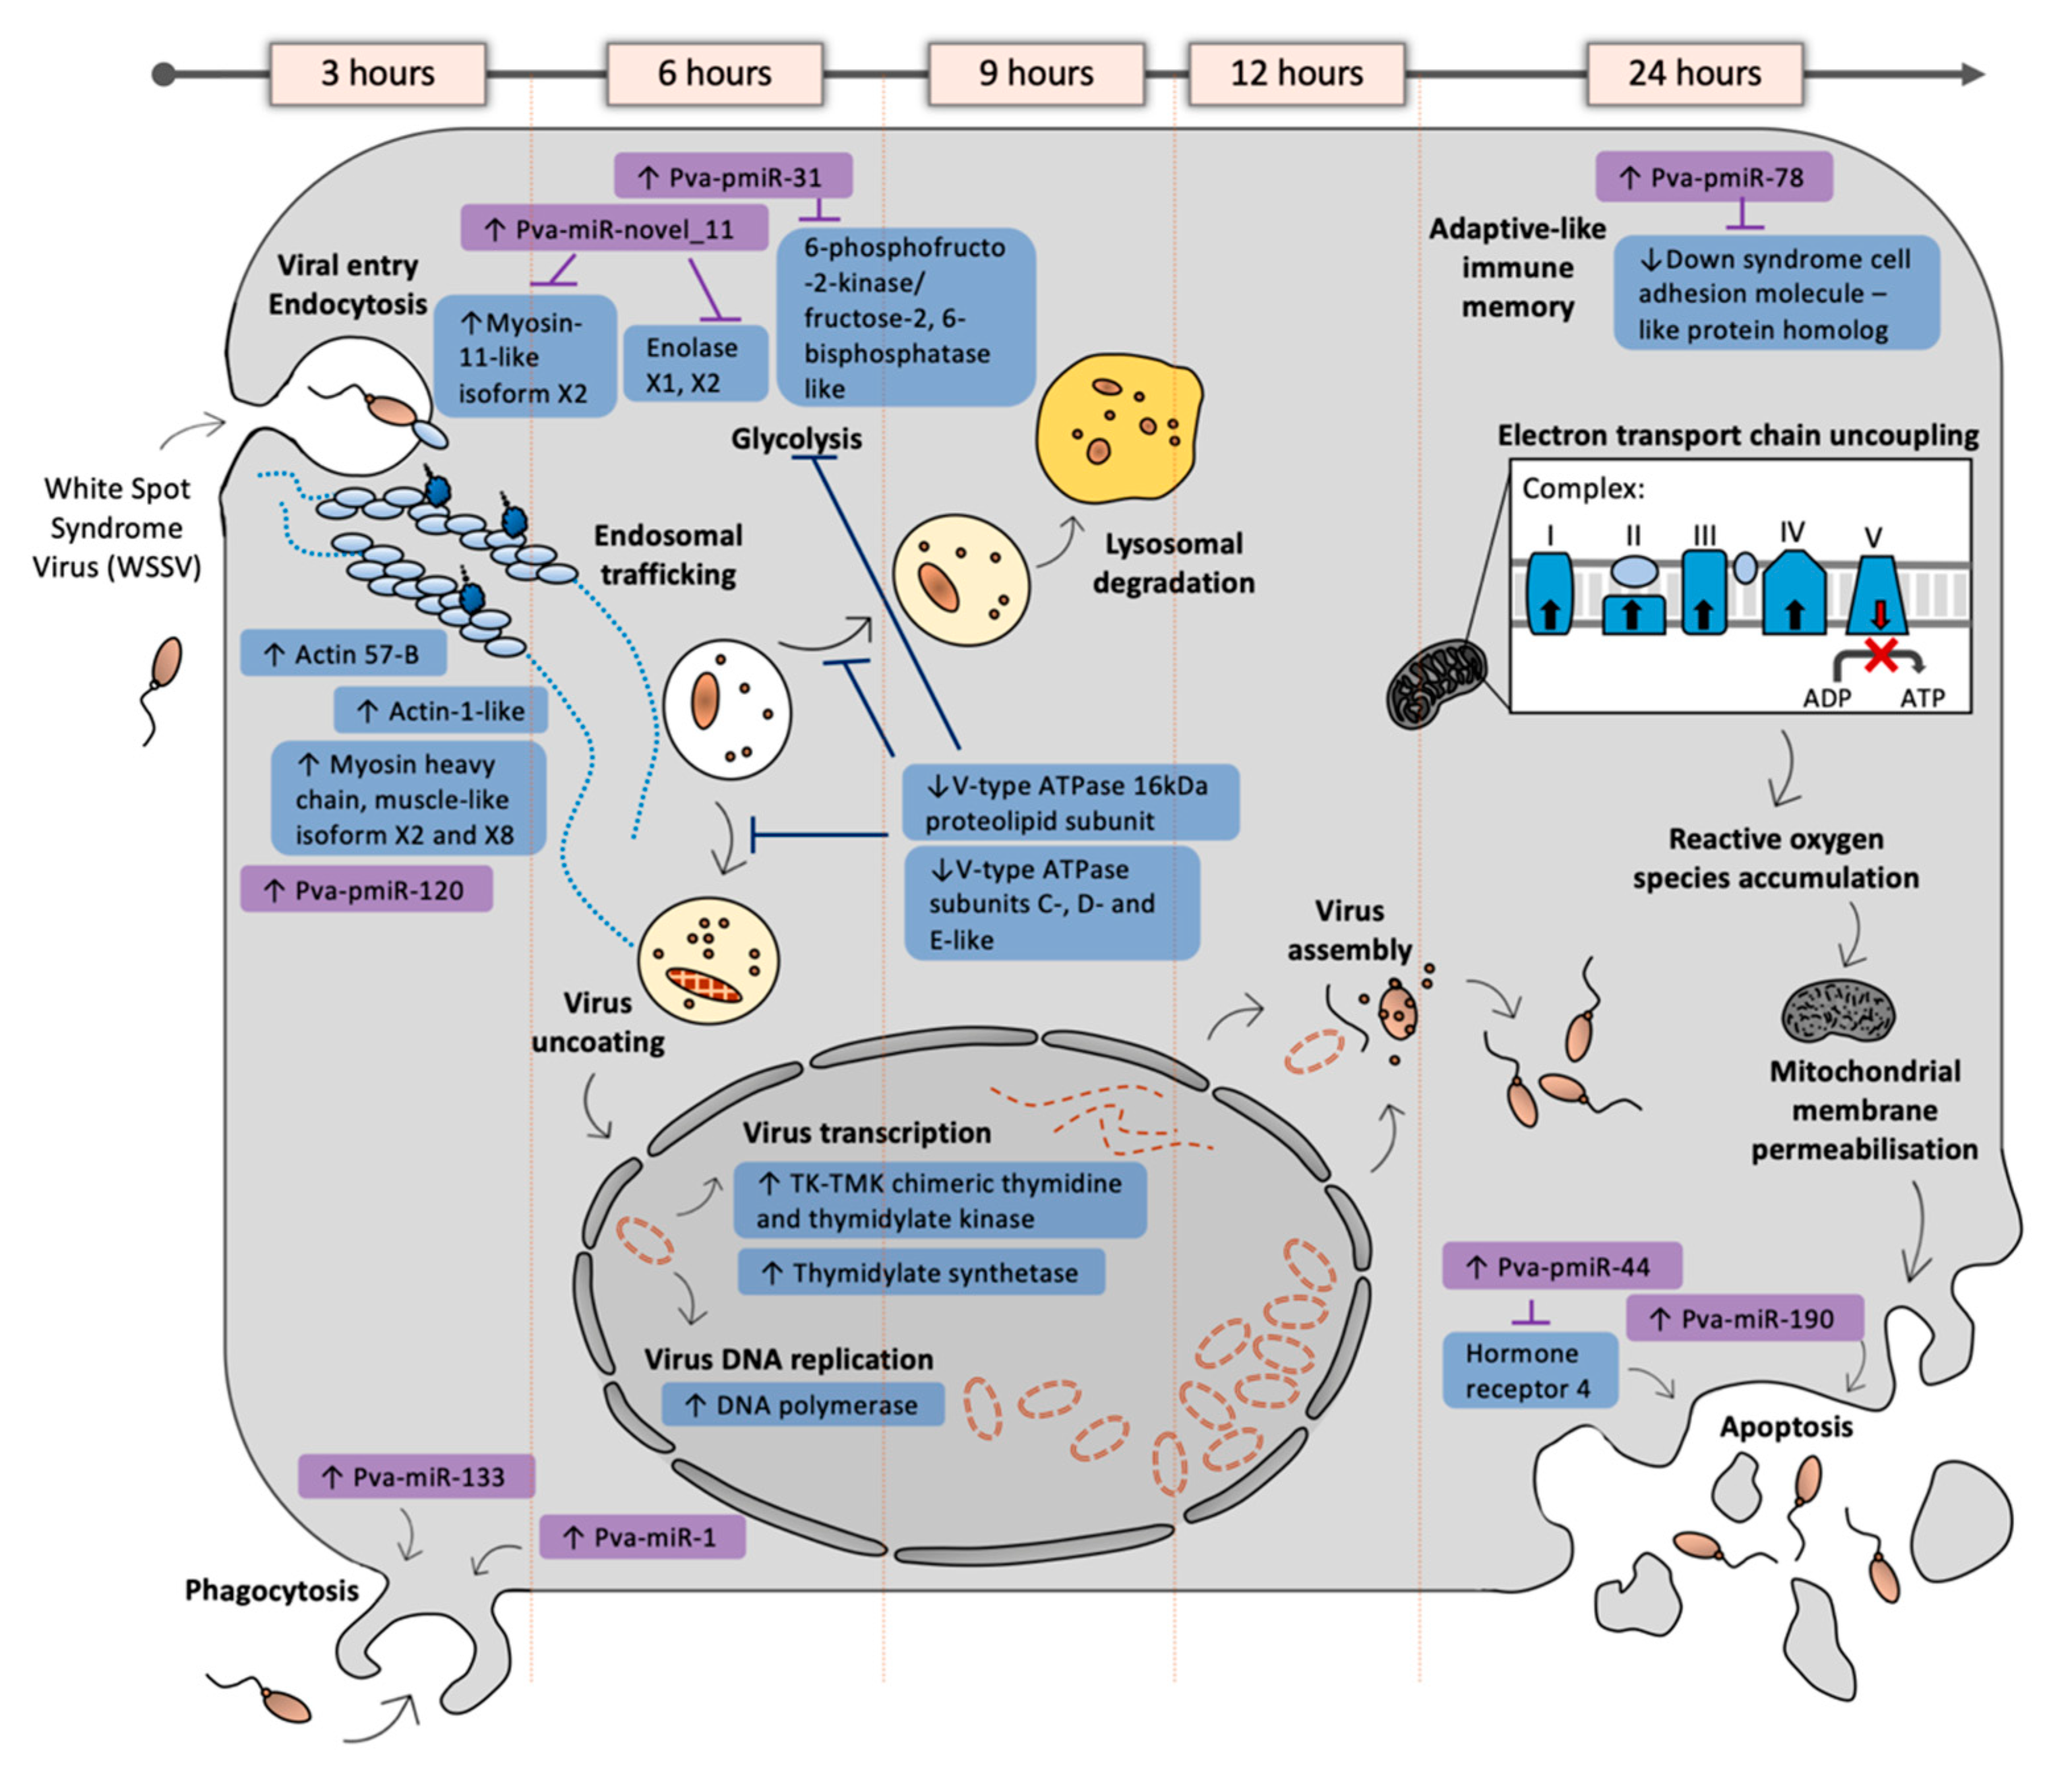
3.5.1. Cytoskeleton Remodelling Assists Early WSSV Entry and Movement
3.5.2. Pathogen-Associated Phagocytic Activity Is Altered during Early Infection
3.5.3. WSSV Replication First Detected at 6 hpi
3.5.4. Metabolic Shifts Associated with a White Spot-Induced Warburg Effect Are Likely Driven by Novel WSSV-Responsive miRNAs
3.5.5. ATP-Dependent Proton Transporter Downregulation May Disrupt Lysosome Formation at 9 hpi
3.5.6. Oxidoreductase Activity Was Strongly Perturbed at 24 hpi in WSSV-Infected Shrimp
3.5.7. Late Infection Highlights Novel WSSV-Induced Transcript and miRNA Alterations
4. Discussion
4.1. Temporal Dynamics in Transcriptional Responses to WSSV Infection Illustrate Mechanisms of Viral Entry and Replication during Early Infection, and Host Responses during the Late Infection Stages
4.2. miRNA Responses to WSSV Infection Suggest Dysregulation of Phagocytosis, Cellular Respiration and Host Immunity
4.3. Limitations
5. Conclusions
Supplementary Materials
Author Contributions
Funding
Institutional Review Board Statement
Informed Consent Statement
Data Availability Statement
Acknowledgments
Conflicts of Interest
Appendix A
Appendix A.1. WSSV miRNA Analysis and Results
Appendix A.1.1. WSSV miRNA Analysis
Appendix A.1.2. WSSV miRNA Results
References
- Food and Agriculture Organization (FAO). FAO Yearbook—Fishery and Aquaculture Statistics 2018/FAO Annuaire: Statistiques des Pêches et de L’aquaculture 2018/FAO Anuario. EstadÍ Sticas de Pesca y Acuicultura 2018; Food and Agriculture Organization: Rome, Italy, 2020. [Google Scholar]
- Stentiford, G.; Neil, D.; Peeler, E.; Shields, J.; Small, H.; Flegel, T.; Vlak, J.; Jones, B.; Morado, F.; Moss, S.; et al. Disease will limit future food supply from the global crustacean fishery and aquaculture sectors. J. Invertebr. Pathol. 2012, 110, 141–157. [Google Scholar] [CrossRef] [PubMed] [Green Version]
- Anderson, J.L.; Valderrama, D.; Jory, D.E. GOAL 2017: Global Shrimp Production Review and Forecast. Available online: https://www.aquaculturealliance.org/advocate/goal-2017-shrimp-production-survey/ (accessed on 28 April 2021).
- Flegel, T.W. Historic emergence, impact and current status of shrimp pathogens in Asia. J. Invertebr. Pathol. 2012, 110, 166–173. [Google Scholar] [CrossRef] [PubMed]
- Lightner, D.V. A Handbook of Pathology and Diagnostic Procedures for Diseases of Penaeid Shrimp; World Aquaculture Society: Baton Rouge, LA, USA, 1996. [Google Scholar]
- Chai, C.Y.; Yoon, J.; Lee, Y.S.; Kim, Y.B.; Choi, T.-J. Analysis of the complete nucleotide sequence of a white spot syndrome virus isolated from pacific white shrimp. J. Microbiol. 2013, 51, 695–699. [Google Scholar] [CrossRef] [PubMed]
- Kumar, K.V.; Shekhar, M.S.; Otta, S.K.; Karthic, K.; Kumar, J.A.; Gopikrishna, G.; Vijayan, K.K. First Report of a Complete Genome Sequence of White spot syndrome virus from India. Genome Announc. 2018, 6, 1–2. [Google Scholar] [CrossRef] [Green Version]
- Rodriguez-Anaya, L.Z.; Gonzalez-Galaviz, J.R.; Casillas-Hernandez, R.; Lares-Villa, F.; Estrada, K.; Ibarra-Gamez, J.C.; Sanchez-Flores, A. Draft Genome Sequence of White Spot Syndrome Virus Isolated from Cultured Litopenaeus vannamei in Mexico. Genome Announc. 2016, 4, 01674-15. [Google Scholar] [CrossRef] [PubMed] [Green Version]
- Restrepo, L.; Reyes, A.; Bajaña, L.; Betancourt, I.; Bayot, B. Draft Genome Sequence of a White Spot Syndrome Virus Isolate Obtained in Ecuador. Genome Announc. 2018, 6, 1–2. [Google Scholar] [CrossRef] [Green Version]
- Oakey, H.J.; Smith, C.S. Complete genome sequence of a white spot syndrome virus associated with a disease incursion in Australia. Aquaculture 2018, 484, 152–159. [Google Scholar] [CrossRef]
- Li, F.; Gao, M.; Xu, L.; Yang, F. Comparative genomic analysis of three white spot syndrome virus isolates of different virulence. Virus Genes 2016, 53, 249–258. [Google Scholar] [CrossRef]
- Jiang, L.; Xiao, J.; Liu, L.; Pan, Y.; Yan, S.; Wang, Y. Characterization and prevalence of a novel white spot syndrome viral genotype in naturally infected wild crayfish, Procambarus clarkii, in Shanghai, China. VirusDisease 2017, 28, 250–261. [Google Scholar] [CrossRef] [PubMed]
- Han, Y.; Li, F.; Xu, L.; Yang, F. A VP24-truncated isolate of white spot syndrome virus is inefficient in per os infection. Vet. Res. 2017, 48, 87. [Google Scholar] [CrossRef] [Green Version]
- Muir, P.; Li, S.; Lou, S.; Wang, D.; Spakowicz, D.J.; Salichos, L.; Zhang, J.; Weinstock, G.M.; Isaacs, F.; Rozowsky, J.; et al. The real cost of sequencing: Scaling computation to keep pace with data generation. Genome Biol. 2016, 17, 53. [Google Scholar] [CrossRef] [PubMed] [Green Version]
- Chen, X.; Zeng, D.; Chen, X.; Xie, D.; Zhao, Y.; Yang, C.; Li, Y.; Ma, N.; Li, M.; Yang, Q.; et al. Transcriptome Analysis of Litopenaeus vannamei in Response to White Spot Syndrome Virus Infection. PLoS ONE 2013, 8, e73218. [Google Scholar] [CrossRef] [Green Version]
- Gonçalves, P.; Guertler, C.; Bachère, E.; De Souza, C.R.; Rosa, R.D.; Perazzolo, L.M. Molecular signatures at imminent death: Hemocyte gene expression profiling of shrimp succumbing to viral and fungal infections. Dev. Comp. Immunol. 2014, 42, 294–301. [Google Scholar] [CrossRef] [Green Version]
- Peruzza, L.; Shekhar, M.S.; Kumar, K.V.; Swathi, A.; Karthic, K.; Hauton, C.; Vijayan, K.K. Temporal changes in transcriptome profile provide insights of White Spot Syndrome Virus infection in Litopenaeus vannamei. Sci. Rep. 2019, 9, 13509. [Google Scholar] [CrossRef]
- Santos, C.A.; Andrade, S.; Teixeira, A.K.; Farias, F.; Kurkjian, K.; Guerrelhas, A.C.; Rocha, J.L.; Galetti, P.M.J.; Freitas, P.D. Litopenaeus vannamei Transcriptome Profile of Populations Evaluated for Growth Performance and Exposed to White Spot Syndrome Virus (WSSV). Front. Genet. 2018, 9, 120. [Google Scholar] [CrossRef] [Green Version]
- Xue, S.; Liu, Y.; Zhang, Y.; Sun, Y.; Geng, X.; Sun, J. Sequencing and De Novo Analysis of the Hemocytes Transcriptome in Litopenaeus vannamei Response to White Spot Syndrome Virus Infection. PLoS ONE 2013, 8, e76718. [Google Scholar] [CrossRef] [PubMed]
- Zhong, S.; Mao, Y.; Wang, J.; Liu, M.; Zhang, M.; Su, Y. Transcriptome analysis of Kuruma shrimp (Marsupenaeus japonicus) hepatopancreas in response to white spot syndrome virus (WSSV) under experimental infection. Fish Shellfish Immunol. 2017, 70, 710–719. [Google Scholar] [CrossRef] [PubMed]
- Li, S.; Zhang, X.; Sun, Z.; Li, F.; Xiang, J. Transcriptome Analysis on Chinese Shrimp Fenneropenaeus chinensis during WSSV Acute Infection. PLoS ONE 2013, 8, e58627. [Google Scholar] [CrossRef] [Green Version]
- Shi, X.; Meng, X.; Kong, J.; Luan, S.; Luo, K.; Cao, B.; Lu, X.; Li, X.; Chen, B.; Cao, J. Transcriptome analysis of ‘Huanghai No. 2′ Fenneropenaeus chinensis response to WSSV using RNA-seq. Fish Shellfish Immunol. 2018, 75, 132–138. [Google Scholar] [CrossRef] [PubMed]
- Chang, P.; Lo, C.-F.; Wang, Y.; Kou, G. Identification of white spot syndrome associated baculovirus (WSBV) target organs in the shrimp Penaeus monodon by in situ hybridization. Dis. Aquat. Org. 1996, 27, 131–139. [Google Scholar] [CrossRef]
- Yang, G.; Yang, L.; Zhao, Z.; Wang, J.; Zhang, X. Signature miRNAs Involved in the Innate Immunity of Invertebrates. PLoS ONE 2012, 7, e39015. [Google Scholar] [CrossRef]
- Iorio, M.V.; Ferracin, M.; Liu, C.-G.; Veronese, A.; Spizzo, R.; Sabbioni, S.; Magri, E.; Pedriali, M.; Fabbri, M.; Campiglio, M.; et al. MicroRNA Gene Expression Deregulation in Human Breast Cancer. Cancer Res. 2005, 65, 7065–7070. [Google Scholar] [CrossRef] [Green Version]
- Löfgren, S.; Frostegard, J.; Truedsson, L.; Pons-Estel, B.; D’Alfonso, S.; Witte, T.; Lauwerys, B.R.; Endreffy, E.; Kovács, L.; Vasconcelos, C.; et al. Genetic association of miRNA-146a with systemic lupus erythematosus in Europeans through decreased expression of the gene. Genes Immun. 2012, 13, 268–274. [Google Scholar] [CrossRef] [Green Version]
- Martins, M.; Rosa, A.; Guedes, L.C.; Fonseca, B.V.; Gotovac, K.; Violante, S.; Mestre, T.; Coelho, M.; Rosa, M.M.; Martin, E.R.; et al. Convergence of miRNA Expression Profiling, α-Synuclein Interacton and GWAS in Parkinson’s Disease. PLoS ONE 2011, 6, e25443. [Google Scholar] [CrossRef] [PubMed]
- Yanaihara, N.; Caplen, N.; Bowman, E.; Seike, M.; Kumamoto, K.; Yi, M.; Stephens, R.M.; Okamoto, A.; Yokota, J.; Tanaka, T.; et al. Unique microRNA molecular profiles in lung cancer diagnosis and prognosis. Cancer Cell 2006, 9, 189–198. [Google Scholar] [CrossRef] [Green Version]
- Bai, X.T.; Nicot, C. miR-28-3p Is a Cellular Restriction Factor That Inhibits Human T Cell Leukemia Virus, Type 1 (HTLV-1) Replication and Virus Infection. J. Biol. Chem. 2015, 290, 5381–5390. [Google Scholar] [CrossRef] [PubMed] [Green Version]
- Huang, J.; Wang, F.; Argyris, E.; Chen, K.; Liang, Z.; Tian, H.; Huang, W.; Squires, K.; Verlinghieri, G.; Zhang, H. Cellular microRNAs contribute to HIV-1 latency in resting primary CD4+ T lymphocytes. Nat. Med. 2007, 13, 1241–1247. [Google Scholar] [CrossRef] [PubMed]
- Lecellier, C.-H.; Dunoyer, P.; Arar, K.; Lehmann-Che, J.; Eyquem, S.; Himber, C.; Saïb, A.; Voinnet, O. A Cellular MicroRNA Mediates Antiviral Defense in Human Cells. Science 2005, 308, 557–560. [Google Scholar] [CrossRef] [PubMed] [Green Version]
- Trobaugh, D.; Gardner, C.L.; Sun, C.; Haddow, A.D.; Wang, E.; Chapnik, E.; Mildner, A.; Weaver, S.C.; Ryman, K.D.; Klimstra, W.B. RNA viruses can hijack vertebrate microRNAs to suppress innate immunity. Nat. Cell Biol. 2014, 506, 245–248. [Google Scholar] [CrossRef] [Green Version]
- Wang, Y.-Q.; Ouyang, W.; Pan, Q.-X.; Wang, X.-M.; Xia, X.-X.; Bi, Z.-W. Overexpression of microRNA gga-miR-21 in chicken fibroblasts suppresses replication of infectious bursal disease virus through inhibiting VP1 translation. Antivir. Res. 2013, 100, 196–201. [Google Scholar] [CrossRef]
- Zheng, J.; Cao, J.; Mao, Y.; Su, Y.; Wang, J. Identification of microRNAs with heat stress responsive and immune properties in Marsupenaeus japonicus based on next-generation sequencing and bioinformatics analysis: Essential regulators in the heat stress-host interactions. Fish Shellfish Immunol. 2018, 81, 390–398. [Google Scholar] [CrossRef] [PubMed]
- Li, X.; Meng, X.; Luo, K.; Luan, S.; Shi, X.; Cao, B.; Kong, J. The identification of microRNAs involved in the response of Chinese shrimp Fenneropenaeus chinensis to white spot syndrome virus infection. Fish Shellfish Immunol. 2017, 68, 220–231. [Google Scholar] [CrossRef] [PubMed]
- Kaewkascholkul, N.; Somboonviwat, K.; Asakawa, S.; Hirono, I.; Tassanakajon, A.; Somboonwiwat, K. Shrimp miRNAs regulate innate immune response against white spot syndrome virus infection. Dev. Comp. Immunol. 2016, 60, 191–201. [Google Scholar] [CrossRef] [PubMed]
- Shekhar, M.; Karthic, K.; Kumar, K.V.; Kumar, J.A.; Swathi, A.; Hauton, C.; Peruzza, L.; Vijayan, K. Comparative analysis of shrimp (Penaeus vannamei) miRNAs expression profiles during WSSV infection under experimental conditions and in pond culture. Fish Shellfish Immunol. 2019, 93, 288–295. [Google Scholar] [CrossRef]
- Sun, X.; Liu, Q.-H.; Yang, B.; Huang, J. Differential expression of microRNAs of Litopenaeus vannamei in response to different virulence WSSV infection. Fish Shellfish Immunol. 2016, 58, 18–23. [Google Scholar] [CrossRef]
- Wu, W.; Dai, C.; Duan, X.; Wang, C.; Lin, X.; Ke, J.; Wang, Y.; Zhang, X.; Liu, H. miRNAs induced by white spot syndrome virus involve in immunity pathways in shrimp Litopenaeus vannamei. Fish Shellfish Immunol. 2019, 93, 743–751. [Google Scholar] [CrossRef]
- Zhao, M.-R.; Meng, C.; Xie, X.-L.; Li, C.-H.; Liu, H.-P. Characterization of microRNAs by deep sequencing in red claw crayfish Cherax quadricarinatus haematopoietic tissue cells after white spot syndrome virus infection. Fish Shellfish Immunol. 2016, 59, 469–483. [Google Scholar] [CrossRef]
- Yang, H.; Li, X.; Ji, J.; Yuan, C.; Gao, X.; Zhang, Y.; Lu, C.; Li, F.; Zhang, X. Changes of microRNAs expression profiles from red swamp crayfish (Procambarus clarkia) hemolymph exosomes in response to WSSV infection. Fish Shellfish Immunol. 2019, 84, 169–177. [Google Scholar] [CrossRef]
- Ching, T.; Huang, S.; Garmire, L.X. Power analysis and sample size estimation for RNA-Seq differential expression. RNA 2014, 20, 1684–1696. [Google Scholar] [CrossRef] [Green Version]
- Bateman, K.; Munro, J.; Uglow, B.; Small, H.; Stentiford, G. Susceptibility of juvenile European lobster Homarus gammarus to shrimp products infected with high and low doses of white spot syndrome virus. Dis. Aquat. Org. 2012, 100, 169–184. [Google Scholar] [CrossRef] [Green Version]
- Durand, S.V.; Lightner, D.V. Quantitative real time PCR for the measurement of white spot syndrome virus in shrimp. J. Fish Dis. 2002, 25, 381–389. [Google Scholar] [CrossRef]
- Bolger, A.M.; Lohse, M.; Usadel, B. Trimmomatic: A flexible trimmer for Illumina sequence data. Bioinformatics 2014, 30, 2114–2120. [Google Scholar] [CrossRef] [Green Version]
- Grabherr, M.G.; Haas, B.J.; Yassour, M.; Levin, J.Z.; Thompson, D.; Amit, I.; Adiconis, X.; Fan, L.; Raychowdhury, R.; Zeng, Q.; et al. Full-length transcriptome assembly from RNA-Seq data without a reference genome. Nat. Biotechnol. 2011, 29, 644–652. [Google Scholar] [CrossRef] [Green Version]
- Fu, L.; Niu, B.; Zhu, Z.; Wu, S.; Li, W. CD-HIT: Accelerated for clustering the next-generation sequencing data. Bioinformatics 2012, 28, 3150–3152. [Google Scholar] [CrossRef]
- Simão, F.A.; Waterhouse, R.M.; Ioannidis, P.; Kriventseva, E.V.; Zdobnov, E.M. BUSCO: Assessing genome assembly and annotation completeness with single-copy orthologs. Bioinformatics 2015, 31, 3210–3212. [Google Scholar] [CrossRef] [Green Version]
- Buchfink, B.; Xie, C.; Huson, D.H. Fast and sensitive protein alignment using DIAMOND. Nat. Methods 2015, 12, 59–60. [Google Scholar] [CrossRef] [PubMed]
- Huson, D.H.; Beier, S.; Flade, I.; Górska, A.; El-Hadidi, M.; Mitra, S.; Ruscheweyh, H.-J.; Tappu, R. MEGAN Community Edition—Interactive Exploration and Analysis of Large-Scale Microbiome Sequencing Data. PLoS Comput. Biol. 2016, 12, e1004957. [Google Scholar] [CrossRef] [PubMed] [Green Version]
- Langmead, B.; Trapnell, C.; Pop, M.; Salzberg, S.L. Ultrafast and memory-efficient alignment of short DNA sequences to the human genome. Genome Biol. 2009, 10, R25. [Google Scholar] [CrossRef] [Green Version]
- Li, B.; Dewey, C.N. RSEM: Accurate transcript quantification from RNA-Seq data with or without a reference genome. BMC Bioinform. 2011, 12, 323. [Google Scholar] [CrossRef] [PubMed] [Green Version]
- Robinson, M.D.; McCarthy, D.J.; Smyth, G.K. edgeR: A Bioconductor package for differential expression analysis of digital gene expression data. Bioinformatics 2010, 26, 139–140. [Google Scholar] [CrossRef] [Green Version]
- Benjamini, Y.; Hochberg, Y. Controlling the false discovery rate: A practical and powerful approach to multiple testing. J. R. Stat. Soc. Ser. B 1995, 57, 289–300. [Google Scholar] [CrossRef]
- Conesa, A.; Götz, S.; García-Gómez, J.M.; Terol, J.; Talón, M.; Robles, M. Blast2GO: A universal tool for annotation, visualization and analysis in functional genomics research. Bioinformatics 2005, 21, 3674–3676. [Google Scholar] [CrossRef] [PubMed] [Green Version]
- Subramanian, A.; Tamayo, P.; Mootha, V.K.; Mukherjee, S.; Ebert, B.L.; Gillette, M.A.; Paulovich, A.; Pomeroy, S.L.; Golub, T.R.; Lander, E.S.; et al. Gene set enrichment analysis: A knowledge-based approach for interpreting genome-wide expression profiles. Proc. Natl. Acad. Sci. USA 2005, 102, 15545–15550. [Google Scholar] [CrossRef] [PubMed] [Green Version]
- Moriya, Y.; Itoh, M.; Okuda, S.; Yoshizawa, A.C.; Kanehisa, M. KAAS: An automatic genome annotation and pathway reconstruction server. Nucleic Acids Res. 2007, 35, W182–W185. [Google Scholar] [CrossRef] [PubMed] [Green Version]
- Luo, W.; Friedman, M.S.; Shedden, K.; Hankenson, K.D.; Woolf, P.J. GAGE: Generally applicable gene set enrichment for pathway analysis. BMC Bioinform. 2009, 10, 161. [Google Scholar] [CrossRef] [PubMed] [Green Version]
- R Core Team. R: A Language and Environment for Statistical Computing. Available online: http//www.R-project.org/ (accessed on 28 April 2021).
- Luo, W.; Brouwer, C. Pathview: An R/Bioconductor package for pathway-based data integration and visualization. Bioinformatics 2013, 29, 1830–1831. [Google Scholar] [CrossRef] [Green Version]
- Yang, F.; He, J.; Lin, X.; Li, Q.; Pan, D.; Zhang, X.; Xu, X. Complete Genome Sequence of the Shrimp White Spot Bacilliform Virus. J. Virol. 2001, 75, 11811–11820. [Google Scholar] [CrossRef] [Green Version]
- Langmead, B.; Salzberg, S.L. Fast gapped-read alignment with Bowtie 2. Nat. Methods 2012, 9, 357–359. [Google Scholar] [CrossRef] [Green Version]
- Martin, M. Cutadapt removes adapter sequences from high-throughput sequencing reads. EMBnet. J. 2011, 17, 10–12. [Google Scholar] [CrossRef]
- Li, H.; Handsaker, B.; Wysoker, A.; Fennell, T.; Ruan, J.; Homer, N.; Marth, G.; Abecasis, G.; Durbin, R. The Sequence Alignment/Map format and SAMtools. Bioinformatics 2009, 25, 2078–2079. [Google Scholar] [CrossRef] [Green Version]
- Seqtk: Toolkit for Processing Sequences in FASTA/Q Formats. Available online: https://github.com/lh3/seqtk (accessed on 25 October 2020).
- Pertea, G. gpertea/fqtrim: Fqtrim Release (Version v0.9.7). Zenodo. Available online: https://doi.org/10.5281/zenodo.1185412 (accessed on 28 April 2021).
- Friedlander, M.; Mackowiak, S.; Li, N.; Chen, W.; Rajewsky, N. miRDeep2 accurately identifies known and hundreds of novel microRNA genes in seven animal clades. Nucleic Acids Res. 2011, 40, 37–52. [Google Scholar] [CrossRef]
- Zhang, X.; Yuan, J.; Sun, Y.; Li, S.; Gao, Y.; Yu, Y.; Liu, C.; Wang, Q.; Lv, X.; Zhang, X.; et al. Penaeid shrimp genome provides insights into benthic adaptation and frequent molting. Nat. Commun. 2019, 10, 356. [Google Scholar] [CrossRef] [PubMed] [Green Version]
- Fromm, B.; Domanska, D.; Høye, E.; Ovchinnikov, V.; Kang, W.; Aparicio-Puerta, E.; Johansen, M.; Flatmark, K.; Mathelier, A.; Hovig, E.; et al. MirGeneDB 2.0: The metazoan microRNA complement. Nucleic Acids Res. 2020, 48, D132–D141. [Google Scholar] [CrossRef] [PubMed] [Green Version]
- Huang, T.; Xu, D.; Zhang, X. Characterization of host microRNAs that respond to DNA virus infection in a crustacean. BMC Genom. 2012, 13, 159. [Google Scholar] [CrossRef] [PubMed] [Green Version]
- Camacho, C.; Coulouris, G.; Avagyan, V.; Ma, N.; Papadopoulos, J.S.; Bealer, K.; Madden, T.L. BLAST+: Architecture and applications. BMC Bioinform. 2009, 10, 421. [Google Scholar] [CrossRef] [Green Version]
- He, P.; Wei, P.; Zhang, B.; Zhao, Y.; Li, Q.; Chen, X.; Zeng, D.; Peng, M.; Yang, C.; Peng, J.; et al. Identification of microRNAs involved in cold adaptation of Litopenaeus vannamei by high-throughput sequencing. Gene 2018, 677, 24–31. [Google Scholar] [CrossRef]
- Love, M.I.; Huber, W.; Anders, S. Moderated estimation of fold change and dispersion for RNA-seq data with DESeq2. Genome Biol. 2014, 15, 550. [Google Scholar] [CrossRef] [Green Version]
- Hofacker, I.L. Vienna RNA secondary structure server. Nucleic Acids Res. 2003, 31, 3429–3431. [Google Scholar] [CrossRef] [PubMed] [Green Version]
- Bonnet, E.; Wuyts, J.; Rouzé, P.; Van De Peer, Y. Evidence that microRNA precursors, unlike other non-coding RNAs, have lower folding free energies than random sequences. Bioinformatics 2004, 20, 2911–2917. [Google Scholar] [CrossRef] [PubMed]
- Enright, A.J.; John, B.; Gaul, U.; Tuschl, T.; Sander, C.; Marks, D.S. MicroRNA targets in Drosophila. Genome Biol. 2003, 5, R1. [Google Scholar] [CrossRef] [PubMed] [Green Version]
- Miranda, K.C.; Huynh, T.; Tay, Y.; Ang, Y.-S.; Tam, W.L.; Thomson, A.M.; Lim, B.; Rigoutsos, I. A Pattern-Based Method for the Identification of MicroRNA Binding Sites and Their Corresponding Heteroduplexes. Cell 2006, 126, 1203–1217. [Google Scholar] [CrossRef] [PubMed] [Green Version]
- Oliveira, A.C.; Bovolenta, L.A.; Nachtigall, P.G.; Herkenhoff, M.; Lemke, N.; Pinhal, D. Combining Results from Distinct MicroRNA Target Prediction Tools Enhances the Performance of Analyses. Front. Genet. 2017, 8, 59. [Google Scholar] [CrossRef] [PubMed] [Green Version]
- Wickham, H. ggplot2: Elegant Graphics for Data Analysis; Springer: New York, NY, USA, 2016. [Google Scholar]
- Farrants, A.-K.Ö. Chromatin remodelling and actin organisation. FEBS Lett. 2008, 582, 2041–2050. [Google Scholar] [CrossRef] [Green Version]
- Tang, L.; Nogales, E.; Ciferri, C. Structure and function of SWI/SNF chromatin remodeling complexes and mechanistic implications for transcription. Prog. Biophys. Mol. Biol. 2010, 102, 122–128. [Google Scholar] [CrossRef] [PubMed] [Green Version]
- Chen, I.-T.; Aoki, T.; Huang, Y.-T.; Hirono, I.; Chen, T.-C.; Huang, J.-Y.; Chang, G.-D.; Lo, C.-F.; Wang, H.-C. White Spot Syndrome Virus Induces Metabolic Changes Resembling the Warburg Effect in Shrimp Hemocytes in the Early Stage of Infection. J. Virol. 2011, 85, 12919–12928. [Google Scholar] [CrossRef] [Green Version]
- Suhyuen, L.; Huang, Y.-T.; Chen, I.-T.; Lee, D.-Y.; Hsieh, Y.-C.; Li, C.-Y.; Geendong, C.; Liang, S.-Y.; Lin, S.-Y.; Huang, S.-W.; et al. An Invertebrate Warburg Effect: A Shrimp Virus Achieves Successful Replication by Altering the Host Metabolome via the PI3K-Akt-mTOR Pathway. PLOS Pathog. 2014, 10, e1004196. [Google Scholar] [CrossRef] [Green Version]
- Brand, M. Uncoupling to survive? The role of mitochondrial inefficiency in ageing. Exp. Gerontol. 2000, 35, 811–820. [Google Scholar] [CrossRef]
- McCallum, K.C.; Garsin, D.A. The Role of Reactive Oxygen Species in Modulating the Caenorhabditis elegans Immune Response. PLOS Pathog. 2016, 12, e1005923. [Google Scholar] [CrossRef]
- Wang, Z.; Sun, B.; Zhu, F. The shrimp hormone receptor acts as an anti-apoptosis and anti-inflammatory factor in innate immunity. Fish Shellfish Immunol. 2018, 72, 581–592. [Google Scholar] [CrossRef]
- Apitanyasai, K.; Huang, S.-W.; Ng, T.H.; He, S.-T.; Huang, Y.-H.; Chiu, S.-P.; Tseng, K.-C.; Lin, S.-S.; Chang, W.-C.; Baldwin-Brown, J.G.; et al. The gene structure and hypervariability of the complete Penaeus monodon Dscam gene. Sci. Rep. 2019, 9, 16595. [Google Scholar] [CrossRef] [Green Version]
- Fu, L.-L.; Li, T.-P.; Wang, Y. Potential role of LvDscam in specific immune response of Litopenaeus vannamei against white spot syndrome virus by oral delivery of VP28 using Bacillus subtilis. Aquac. Res. 2014, 47, 2068–2079. [Google Scholar] [CrossRef]
- Chen, R.-Y.; Shen, K.-L.; Chen, Z.; Fan, W.-W.; Xie, X.-L.; Meng, C.; Chang, X.-J.; Zheng, L.-B.; Jeswin, J.; Li, C.-H.; et al. White spot syndrome virus entry is dependent on multiple endocytic routes and strongly facilitated by Cq-GABARAP in a CME-dependent manner. Sci. Rep. 2016, 6, 28694. [Google Scholar] [CrossRef]
- Huang, J.; Li, F.; Wu, J.; Yang, F. White spot syndrome virus enters crayfish hematopoietic tissue cells via clathrin-mediated endocytosis. Virology 2015, 486, 35–43. [Google Scholar] [CrossRef] [PubMed]
- Huang, Z.-J.; Kang, S.-T.; Leu, J.-H.; Chen, L.-L. Endocytic pathway is indicated for white spot syndrome virus (WSSV) entry in shrimp. Fish Shellfish Immunol. 2013, 35, 707–715. [Google Scholar] [CrossRef] [PubMed]
- Liu, B.; Tang, X.; Zhan, W. Interaction between white spot syndrome virus VP26 and hemocyte membrane of shrimp, Fenneropenaeus chinensis. Aquaculture 2011, 314, 13–17. [Google Scholar] [CrossRef]
- Schudt, G.; Dolnik, O.; Kolesnikova, L.; Biedenkopf, N.; Herwig, A.; Becker, S. Transport of Ebolavirus Nucleocapsids Is Dependent on Actin Polymerization: Live-Cell Imaging Analysis of Ebolavirus-Infected Cells. J. Infect. Dis. 2015, 212, S160–S166. [Google Scholar] [CrossRef]
- Li, S.; Li, F.; Sun, Z.; Zhang, X.; Xiang, J. Differentially proteomic analysis of the Chinese shrimp at WSSV latent and acute infection stages by iTRAQ approach. Fish Shellfish Immunol. 2016, 54, 629–638. [Google Scholar] [CrossRef]
- Sun, B.; Wang, Z.; Wang, Z.; Ma, X.; Zhu, F. A Proteomic Study of Hemocyte Proteins from Mud Crab (Scylla paramamosain) Infected with White Spot Syndrome Virus or Vibrio alginolyticus. Front. Immunol. 2017, 8, 468. [Google Scholar] [CrossRef]
- Syamaladevi, D.P.; Spudich, J.A.; Sowdhamini, R. Structural and Functional Insights on the Myosin Superfamily. Bioinform. Biol. Insights 2012, 6, 11–21. [Google Scholar] [CrossRef] [PubMed] [Green Version]
- Han, F.; Wang, Z.; Wang, X. Characterization of myosin light chain in shrimp hemocytic phagocytosis. Fish Shellfish Immunol. 2010, 29, 875–883. [Google Scholar] [CrossRef]
- Wang, Z.; Zhu, F. Different roles of a novel shrimp microRNA in white spot syndrome virus (WSSV) and Vibrio alginolyticus infection. Dev. Comp. Immunol. 2018, 79, 21–30. [Google Scholar] [CrossRef]
- Argue, B.J.; Arce, S.M.; Lotz, J.M.; Moss, S.M. Selective breeding of Pacific white shrimp (Litopenaeus vannamei) for growth and resistance to Taura Syndrome Virus. Aquaculture 2002, 204, 447–460. [Google Scholar] [CrossRef]
- Meng, X.; Shi, X.; Kong, J.; Luan, S.; Luo, K.; Cao, B.; Liu, N.; Lu, X.; Li, X.; Deng, K.; et al. Influence of white spot syndrome virus infection on hepatopancreas gene expression of ‘Huanghai No. 2′ shrimp (Fenneropenaeus chinensis). J. Ocean Univ. China 2017, 16, 863–872. [Google Scholar] [CrossRef]
- Li, W.; Desmarets, L.M.B.; De Gryse, G.M.A.; Theuns, S.; Van Tuan, V.; Van Thuong, K.; Bossier, P.; Nauwynck, H.J. Virus replication cycle of white spot syndrome virus in secondary cell cultures from the lymphoid organ of Litopenaeus vannamei. J. Gen. Virol. 2015, 96, 2844–2854. [Google Scholar] [CrossRef]
- Pavelin, J.; Mccormick, D.; Chiweshe, S.; Ramachandran, S.; Lin, Y.-T.; Grey, F. Cellular v-ATPase is required for virion assembly compartment formation in human cytomegalovirus infection. Open Biol. 2017, 7. [Google Scholar] [CrossRef] [Green Version]
- Kohio, H.P.; Adamson, A.L. Glycolytic control of vacuolar-type ATPase activity: A mechanism to regulate influenza viral infection. Virology 2013, 444, 301–309. [Google Scholar] [CrossRef] [PubMed] [Green Version]
- Chen, I.-T.; Lee, D.-Y.; Huang, Y.-T.; Kou, G.-H.; Wang, H.-C.; Chang, G.-D.; Lo, C.-F. Six Hours after Infection, the Metabolic Changes Induced by WSSV Neutralize the Host’s Oxidative Stress Defenses. Sci. Rep. 2016, 6, 27732. [Google Scholar] [CrossRef]
- Leu, J.-H.; Lin, S.-J.; Huang, J.-Y.; Chen, T.-C.; Lo, C.-F. A model for apoptotic interaction between white spot syndrome virus and shrimp. Fish Shellfish Immunol. 2013, 34, 1011–1017. [Google Scholar] [CrossRef]
- El-Bacha, T.; Da Poian, A. Virus-induced changes in mitochondrial bioenergetics as potential targets for therapy. Int. J. Biochem. Cell Biol. 2013, 45, 41–46. [Google Scholar] [CrossRef] [Green Version]
- Zuo, D.; Wu, D.-L.; Ma, C.-A.; Li, H.-X.; Huang, Y.-H.; Wang, D.-L.; Zhao, Y.-L. Effects of white spot syndrome virus infection and role of immune polysaccharides of juvenile Cherax quadricarinatus. Aquaculture 2015, 437, 235–242. [Google Scholar] [CrossRef]
- O’Brien, J.; Hayder, H.; Zayed, Y.; Peng, C. Overview of MicroRNA Biogenesis, Mechanisms of Actions, and Circulation. Front. Endocrinol. 2018, 9, 402. [Google Scholar] [CrossRef] [Green Version]
- Lu, M.; Zhang, P.-J.; Li, C.-H.; Lv, Z.-M.; Zhang, W.-W.; Jin, C.-H. miRNA-133 augments coelomocyte phagocytosis in bacteria-challenged Apostichopus japonicus via targeting the TLR component of IRAK-1 in vitro and in vivo. Sci. Rep. 2015, 5, 12608. [Google Scholar] [CrossRef] [PubMed] [Green Version]
- Liu, C.; Wang, J.; Zhang, X. The Involvement of MiR-1-Clathrin Pathway in the Regulation of Phagocytosis. PLoS ONE 2014, 9, e98747. [Google Scholar] [CrossRef]
- Ng, T.H.; Chiang, Y.-A.; Yeh, Y.-C.; Wang, H.-C. Review of Dscam-mediated immunity in shrimp and other arthropods. Dev. Comp. Immunol. 2014, 46, 129–138. [Google Scholar] [CrossRef]
- Chou, P.-H.; Chang, H.-S.; Chen, I.-T.; Lin, H.-Y.; Chen, Y.-M.; Yang, H.-L.; Wang, K.H.-C. The putative invertebrate adaptive immune protein Litopenaeus vannamei Dscam (LvDscam) is the first reported Dscam to lack a transmembrane domain and cytoplasmic tail. Dev. Comp. Immunol. 2009, 33, 1258–1267. [Google Scholar] [CrossRef]
- Ng, T.H.; Kumar, R.; Apitanyasai, K.; He, S.-T.; Chiu, S.-P.; Wang, H.-C. Selective expression of a “correct cloud” of Dscam in crayfish survivors after second exposure to the same pathogen. Fish Shellfish Immunol. 2019, 92, 430–437. [Google Scholar] [CrossRef]
- Riffo-Campos, Á.L.; Riquelme, I.; Brebi-Mieville, P. Tools for Sequence-Based miRNA Target Prediction: What to Choose? Int. J. Mol. Sci. 2016, 17, 1987. [Google Scholar] [CrossRef] [Green Version]
- Wightman, B.; Ha, I.; Ruvkun, G. Posttranscriptional regulation of the heterochronic gene lin-14 by lin-4 mediates temporal pattern formation in C. elegans. Cell 1993, 75, 855–862. [Google Scholar] [CrossRef]
- Qureshi, A.; Thakur, N.; Monga, I.; Thakur, A.; Kumar, M. VIRmiRNA: A comprehensive resource for experimentally validated viral miRNAs and their targets. Database 2014, 2014. [Google Scholar] [CrossRef]
- Robinson, J.T.; Thorvaldsdóttir, H.; Winckler, W.; Guttman, M.; Lander, E.S.; Getz, G.; Mesirov, J.P. Integrative genomics viewer. Nat. Biotechnol. 2011, 29, 24–26. [Google Scholar] [CrossRef] [Green Version]
- He, Y.; Zhang, X. Comprehensive characterization of viral miRNAs involved in white spot syndrome virus (WSSV) infection. RNA Biol. 2012, 9, 1019–1029. [Google Scholar] [CrossRef] [PubMed]
- Huang, T.; Cui, Y.; Zhang, X.; Ross, S.R. Involvement of Viral MicroRNA in the Regulation of Antiviral Apoptosis in Shrimp. J. Virol. 2013, 88, 2544–2554. [Google Scholar] [CrossRef] [Green Version]
- Liu, C.; Li, F.; Sun, Y.; Zhang, X.; Yuan, J.; Yang, H.; Xiang, J. Virus-derived small RNAs in the penaeid shrimp Fenneropenaeus chinensis during acute infection of the DNA virus WSSV. Sci. Rep. 2016, 6, 28678. [Google Scholar] [CrossRef] [Green Version]
- Bakre, A.A.; Maleki, A.; Tripp, R.A. MicroRNA and Nonsense Transcripts as Putative Viral Evasion Mechanisms. Front. Cell. Infect. Microbiol. 2019, 9, 152. [Google Scholar] [CrossRef]
- Contrant, M.; Fender, A.; Chane-Woon-Ming, B.; Randrianjafy, R.; Vivet-Boudou, V.; Richer, D.; Pfeffer, S. Importance of the RNA secondary structure for the relative accumulation of clustered viral microRNAs. Nucleic Acids Res. 2014, 42, 7981–7996. [Google Scholar] [CrossRef] [Green Version]
- Kincaid, R.P.; Sullivan, C.S. Virus-Encoded microRNAs: An Overview and a Look to the Future. PLOS Pathog. 2012, 8, e1003018. [Google Scholar] [CrossRef] [Green Version]
- Chirayil, R.; Kincaid, R.P.; Dahlke, C.; Kuny, C.V.; Dälken, N.; Spohn, M.; Lawson, B.; Grundhoff, A.; Sullivan, C.S. Identification of virus-encoded microRNAs in divergent Papillomaviruses. PLOS Pathog. 2018, 14, e1007156. [Google Scholar] [CrossRef] [Green Version]
- Lamkiewicz, K.; Barth, E.; Barth, E.; Ibrahim, B. Identification of potential microRNAs associated with Herpesvirus family based on bioinformatic analysis. bioRxiv 2018. [Google Scholar] [CrossRef] [Green Version]
- Umbach, J.L.; Cullen, B.R. In-Depth Analysis of Kaposi’s Sarcoma-Associated Herpesvirus MicroRNA Expression Provides Insights into the Mammalian MicroRNA-Processing Machinery. J. Virol. 2010, 84, 695–703. [Google Scholar] [CrossRef] [PubMed] [Green Version]
- Balasubramaniam, M.; Pandhare, J.; Dash, C. Are microRNAs Important Players in HIV-1 Infection? An Update. Viruses 2018, 10, 110. [Google Scholar] [CrossRef] [Green Version]


Publisher’s Note: MDPI stays neutral with regard to jurisdictional claims in published maps and institutional affiliations. |
© 2021 by the authors. Licensee MDPI, Basel, Switzerland. This article is an open access article distributed under the terms and conditions of the Creative Commons Attribution (CC BY) license (https://creativecommons.org/licenses/by/4.0/).
Share and Cite
Millard, R.S.; Bickley, L.K.; Bateman, K.S.; Farbos, A.; Minardi, D.; Moore, K.; Ross, S.H.; Stentiford, G.D.; Tyler, C.R.; van Aerle, R.; et al. Global mRNA and miRNA Analysis Reveal Key Processes in the Initial Response to Infection with WSSV in the Pacific Whiteleg Shrimp. Viruses 2021, 13, 1140. https://doi.org/10.3390/v13061140
Millard RS, Bickley LK, Bateman KS, Farbos A, Minardi D, Moore K, Ross SH, Stentiford GD, Tyler CR, van Aerle R, et al. Global mRNA and miRNA Analysis Reveal Key Processes in the Initial Response to Infection with WSSV in the Pacific Whiteleg Shrimp. Viruses. 2021; 13(6):1140. https://doi.org/10.3390/v13061140
Chicago/Turabian StyleMillard, Rebecca S., Lisa K. Bickley, Kelly S. Bateman, Audrey Farbos, Diana Minardi, Karen Moore, Stuart H. Ross, Grant D. Stentiford, Charles R. Tyler, Ronny van Aerle, and et al. 2021. "Global mRNA and miRNA Analysis Reveal Key Processes in the Initial Response to Infection with WSSV in the Pacific Whiteleg Shrimp" Viruses 13, no. 6: 1140. https://doi.org/10.3390/v13061140