
Improved Subtyping of Avian Influenza Viruses Using an RT-qPCR-Based Low Density Array: ‘Riems Influenza a Typing Array’, Version 2 (RITA-2)

 ,
,  , ,
, ,
Abstract
:1. Introduction
2. Materials and Methods
2.1. Viruses
2.2. Clinical Material
2.3. Primers and Probes

| Subtype | Designation | Sequence 5’⇒3’ | Amount 1 | Reference |
|---|---|---|---|---|
| Pan AI assay | M1-F | AGA TGA GYC TTC TAA CCG AGG TCG | 20.0 µL | [4,15] |
| M1-FAM | FAM-TCA GGC CCC CTC AAA GCC GA-BHQ1 | 2.5 µL | ||
| M1-R1 | TGC AAA AAC ATC TTC AAG TYT CTG | 15.0 µL | ||
| M1-R2 | TGC AAA GAC ACT TTC CAG TCT CTG | 15.0 µL | ||
| M1-R3 | TGC AAA I(Inosine)AC ATC YTC AAG TYT CTG | 7 µL | ||
| H1 assay | H1-F1 | CCA TCT GTA TAG GCT AYC AT | 20 µL | This study 2 |
| H1-F2 | AAA CAT YCC TTC CRT TCA ATC | 20 µL | ||
| H1-FAM1 | FAM-TAC AGA CAC TGT YGA CAC DGT GCT-BHQ1 | 5 µL | ||
| H1-FAM2 | FAM-TTC ATT GAA GGR GGR TGG ACA GGA AT-BHQ1 | 5 µL | ||
| H1-R1 | GTG AGT CAC RGT YAC ATT CTT | 20 µL | ||
| H1-R2 | GAG CAA GGI TCY GGT TAT G | 20 µL | ||
| H2 assay | H2-F | CTA AST GTR CCW GAA TGG TC | 40 µL | This study 2 |
| H2-R | GAG GTG TTT CAR TTC YTC RTA | 40 µL | ||
| H2-FAM | FAM-TGT GCT ACC CAG GYA GTT TCA ATG A -BHQ1 | 8 µL | ||
| H3 assay | H3-F1 | CCT CGR GGC TAY TTC AAR AT | 15 µL | This study 2 |
| H3-F2 | AGA CTG GAT CYT RTG GAT TTC | 15 µL | ||
| H3-F3 | CTG GGR CAC CAT GCA GT | 15 µL | ||
| H3-FAM1 | FAM-TGC ATC TGA YCT CAT TAT YGA RCT TTT-BHQ1 | 4 µL | ||
| H3-FAM2 | FAM-ACR CAA AGC AAA AAG CAT GAT ATG GC-BHQ1 | 4 µL | ||
| H3-FAM3 | FAM-ACA GGG AAA ATA TGC ARC AAT CCY CA-BHQ1 | 4 µL | ||
| H3-R1 | ATT TGG RGT GAT RCA TTC AGA | 15 µL | ||
| H3-R2 | CTC AAA TGC AAA TGK TGC AYC | 15 µL | ||
| H3-R3 | TGT GCA GTC YCT TCC ATC | 15 µL | ||
| H4 assay | H4-F1 | ACYCAGGGRTACAAGGACA | 20 µL | This study 2 |
| H4-F2 | GGA CAT CAT YCT YTG GAT TTC | 20 µL | ||
| H4-FAM | FAM-TCC ATA TCA TGC TTY TTG CTY GTA GC-BHQ1 | 4 µL | ||
| H4-R | CAA GCC CAC AAA AYR AAG G | 40 µL | ||
| H5 assay | H5-HA1-F | GAT TYT AAA RGA TTG TAG YGT AGC | 20 µL | This study 2 |
| H5-FAM3-RC | FAM-CGC ACA TTG GRT TYC CRA GGA GCC-BHQ1 | 6 µL | ||
| H5-HA1-R1 | CTC TCY ACC ATG TAR GAC CA | 15 µL | ||
| H5-HA1-R2 | CTC TCY ACT ATG TAR GAC CA | 15 µL | ||
| H5-F2 | GTT CCC TAG YAY TGG CAA TCA T | 20 µL | ||
| H5-FAM2 | FAM-CTG GTC TAT YYT TRT GGA TGT GCT CC-BHQ1 | 6 µL | ||
| H5-R2 | AAT TCT ARA TGC AAA TTC TGC AYT G | 15 µL | ||
| H6 assay | H6-F1 | TTG GYG TGT ATC AAA TYC TTK C | 20 µL | This study 2 |
| H6-F2 | TTG RCG TGT ATC AAA TAC TTG C | 20 µL | ||
| H6-FAM | FAM-AGR CTG CTC GAY ACC GTA CTA TAA A-BHQ1 | 10 µL | ||
| H6-R | TTGA RCY ATT TGA ACA CAT CCA | 40 µL | ||
| H7 assay | H7-F | CAA CTG AAA CRG TRG ARC G | 45 µL | This study 2 |
| H7-FAM | FAM-CCC AGG ATY TGC TCA ARA GGR AAA A-BHQ1 | 10 µL | ||
| H7-R1 | CAG GAG YCC ACA TTG ACC | 15 µL | ||
| H7-R2 | CAG WAG YCC ACA TTG ACC | 15 µL | ||
| H7-R3 | TTC TAG GAA TTG GTC ACA TTG | 15 µL | ||
| H8 assay | H8-F | CCA CCT AYA AAA TTC TCA GCA | 40 µL | This study 2 |
| H8-FAM | FAM-TGC CAA GCA RAG ACT GGC CGC CA-BHQ1 | 4 µL | [16] | |
| H8-R | ARA CCT CCA GCA AYC AGG A | 40 µL | This study 2 | |
| H9 assay | H9-F1 | CAA TGG GGT TYG CTG CCT | 20 µL | [23] |
| H9-F2 | CAA TGG GRK TTG CTG CCT | 20 µL | ||
| H9-FAM | FAM-TTY TGG GCC ATG TCI AAT GGR TC-BHQ1 | 6 µL | ||
| H9-R | TTA TAT ACA RAT GTT GCA YCT G | 40 µL | ||
| H10 assay | H10-F | CAA CTC AGR CAG AAT GCW GA | 40 µL | This study 2 |
| H10-FAM | FAM-TGC ATG GAG AGY ATA AGR AAC AAC AC-BHQ1 | 6 µL | ||
| H10-R | CTT CYT CTC TGT AYT GTG AAT G | 40 µL | ||
| H11 assay | H11-F | GGA CAT ATG AYC ACA ARG AAT T | 40 µL | This study 2 |
| H11-FAM | FAM-ACT GTC RAT TTA CAG CTG CAT YGC A-BHQ1 | 8 µL | ||
| H11-R | ATG CAA ATG GTA CAT CTA CAT G | 40 µL | ||
| H12 assay | H12-F | CAT CTA CAG CAG YGT YGC | 40 µL | This study 2 |
| H12-FAM | FAM-ACT GCT CAT GAT TAT TGG GGG TTT CA-BHQ1 | 12 µL | ||
| H12-R | GAA AGT ACA ACG AAC ATT TCC A | 40 µL | ||
| H13 assay | H13-F1 | CTT AAG CAC AAA CTC ATC AGA A | 15 µL | This study 2 |
| H13-F2 | CTG AGC ACC AAT TCA TCA GA | 15 µL | ||
| H13-F3 | CTT AAG CAC AAA CTC ATC AGA A | 15 µL | ||
| H13-FAM1 | FAM-CKA ACC ACA CRG GAA CAT AYT GTT C-BHQ1 | 5 µL | ||
| H13-FAM2 | FAM-CAC ACI GGA ACA TWC TGT TCA ATC A-BHQ1 | 5 µL | ||
| H13-R1 | CTG GCA CAG GCA GGG TT | 20 µL | ||
| H13-R2 | CCY ACA ATC CAT CCT TCA AA | 20 µL | ||
| H14 assay | H14-F | CCC AAT ATA GGA AGT AGA CC | 40 µL | This study 2 |
| H14-HEX | HEX-AAG CAT CTA CTG GAC YCT AGT AAA CC-BHQ1 | 6 µL | ||
| H14-R | CTT CTT GTC ACT TYT AAG CAC | 40 µL | ||
| H15 assay | H15-F | CAS CTT TCT CCG CTC TAA TG | 40 µL | This study 2 |
| H15-FAM | FAM-CAC TGG GAA TAC AGA GTG ATG CAC AA-BHQ1 | 3 µL | ||
| H15-R | AAR CAT TCC CCT TCA CAT GA | 40 µL | ||
| H16 assay | H16-F | ARY TGA AGA CTG AAG ACA ATG T | 40 µL | This study 2 |
| H16-HEX | HEX-CTG GTA GGW CTC ATA CTY GCA TTT AT-BHQ1 | 6 µL | ||
| H16-R | CCA CTG CTG CAT GCC CA | 40 µL | ||
| N1 assay | N1-F | GRC CTT GYT TCT GGG TKG A | 40 µL | This study 2 |
| N1-FAM | FAM-CAA TYT GGA CYA GTG GRA GYA GCA T-BHQ1 | 6 µL | ||
| N1-R | ACC GTC TGG CCA AGA CCA | 40 µL | [16] | |
| N2 assay | N2-F1 | AGTC TGG TGG ACY TCA AAY AG | 20 µL | [16] |
| N2-F2 | CAG AGT RTG GTG GAC ITC | 20 µL | [23] | |
| N2-FAM | FAM-CAT CAG GCC ATG AGC CTG TYC CAT-BHQ1 | 4 µL | ||
| N2-R | TTG CGA AAG CTT AYA TNG VCA T | 40 µL | ||
| N3 assay | N3-F | GCA AYA GTA TAG TTA CYT TCT G | 40 µL | This study 2 |
| N3-FAM | FAM-AGA CAA TGA ACC TGG ATC GGG VAA-BHQ1 | 3 µL | ||
| N3-R1 | TTA CTT GGG CAT RAA CCC AAT | 20 µL | ||
| N3-R2 | GTT GGM ACC RTC WGG CCA | 20 µL | ||
| N4 assay | N4-F1 | GAC TAG YGG TAG TAG YAT TGC | 20 µL | This study 2 |
| N4-F2 | AGT AGY ATT GCR TTY TGT GGT GTT | 20 µL | [16] | |
| N4-HEX | HEX-TGG TCR TGG CCY GAT GGC GCT CT-BHQ1 | 6 µL | ||
| N4-R | CGA AAA ATY ACT TGT CTA TGT CAA | 40 µL | This study 2 | |
| N5 assay | N5-F1 | CCT TCA GAA TGC AGR ACY TT | 20 µL | This study 2 |
| N5-F2 | CAA ATA ATA CAG TAA ARG ACA GAA G | 20 µL | ||
| N5-HEX | HEX-TAA TGA GCG TRC CAT TGG GAT CCT C-BHQ1 | 6 µL | ||
| N5-RR | TAG CAG ACC AYC CRA CGG A | 40 µL | ||
| N6 assay | N6-F1 | GGT GAM AAT GAA YCC AAA YCA | 15 µL | [16] |
| N6-F2 | AAT GAA YCC AAA YCA RAA GAT AA | 15 µL | ||
| N6-F3 | GAA AAT GAA TCC AAA TCA RAA GRT A | 15 µL | This study 2 | |
| N6-FAM | FAM-CAT YTC AGC IAG GAR TRA CAC TAT C-BHQ1 | 12 µL | ||
| N6-R1 | CTT RTA RTG RAG TCC GAT GTT | 15 µL | ||
| N6-R2 | GAT TCC TAT YAG SAG GCT TAC | 15 µL | ||
| N6-R3 | GAT TCC TAT YAG SAI ICT TAC | 15 µL | ||
| N7 assay | N7-F1 | GTT GAA TTA ATW AGA GGA AGR CC | 20 µL | [16] |
| N7-F2 | AGA GGC YAA ATA YGT RTG GTG | 20 µL | This study 2 | |
| N7-FAM | FAM-CCT ATG TGG RAG CCC ATT CCC AGT-BHQ1 | 3 µL | ||
| N7-R | GA TYT GTG CCC CAT CRG GGA | 40 µL | [16] | |
| N8 assay | N8-F1 | TCC ATG YTT TTG GGT TGA RAT GAT | 15 µL | [16] |
| N8-F2 | CTG ATC TCT CTT ACA GGG TTG | 15 µL | This study 2 | |
| N8-F3 | TCC ATG YTT TTG GGT IGA AAY GAT | 15 µL | [16] | |
| N8-FAM1 | FAM-TCH AGY AGC TCC ATT GTR ATG TGT GGA GT-BHQ1 | 6 µL | [16] | |
| N8-FAM2 | FAM-TGC CCA GTG ACA CTC CAA GAG GGG AA-BHQ1 | 6 µL | This study 2 | |
| N8-R1 | GCT CCA TCR TGC CAY GAC CA | 20 µL | [16] | |
| N8-R2 | GTG CAT GAA CCG ACA AAT TGA G | 20 µL | This study 2 | |
| N9 assay | N9-F | AGY ATA GTA TCR ATG TGT TCC AG | 40 µL | [14] |
| N9-FAM | FAM-TTC CTR GGA CAA TGG RAC TGG CC-BHQ1 | 3 µL | [16] | |
| N9-R | GTA CTC TAT TYT AGC CCC RTC | 40 µL | This study 2 | |
| NDV assay | NDF | GAG CTA ATG AAC ATT CTT TC | 12.5 µL | [23] |
| NDR | AAT AGG CGG ACC ACA TCT G | 12.5 µL | ||
| ND-FAM1 | FAM-TCA TTC TTT ATA GAG GTA TCT TCA TCA TA-BHQ1 | 4 µL | ||
| ND-FAM2 | FAM-TCA TAC ACT ATT ATG GCG TCA TTC TT-BHQ1 | 4 µL | ||
| IBV assay | IBV-F1 | CAG TCC CDG ATG CNT GGT A | 25 µL | [24] |
| IBV-F2 | CAG TCC CDG ACG CGT GGT A | 25 µL | ||
| IBV-F3 | GCT TTT GAG CCT AGC GTT | 5 µL | ||
| IBV-FAM1 | FAM-ACT GGA ACA GGA CCD GCC GCT GAC CT-BHQ1 | 6 µL | ||
| IBV-FAM2 | FAM-CAC CAC CAG AAC CTG TCA CCT C-BHQ1 | 2 µL | ||
| IBV-R1 | CCT TWS CAG MAA CMC ACA CT | 25 µL | ||
| IBV-R2 | GCC ATG TTG TCA CTG TCT ATT G | 5 µL | ||
| IC-2 | EGFP-1-F | GAC CAC TAC CAG CAG AAC AC | 5 µL | [25] |
| EGFP-10-R | CTT GTA CAG CTC GTC CAT GC | 5 µL | ||
| EGFP-HEX | HEX-AGC ACC CAG TCC GCC CTG AGC A-BHQ1 | 3.75 µL |
2.4. RNA Extraction
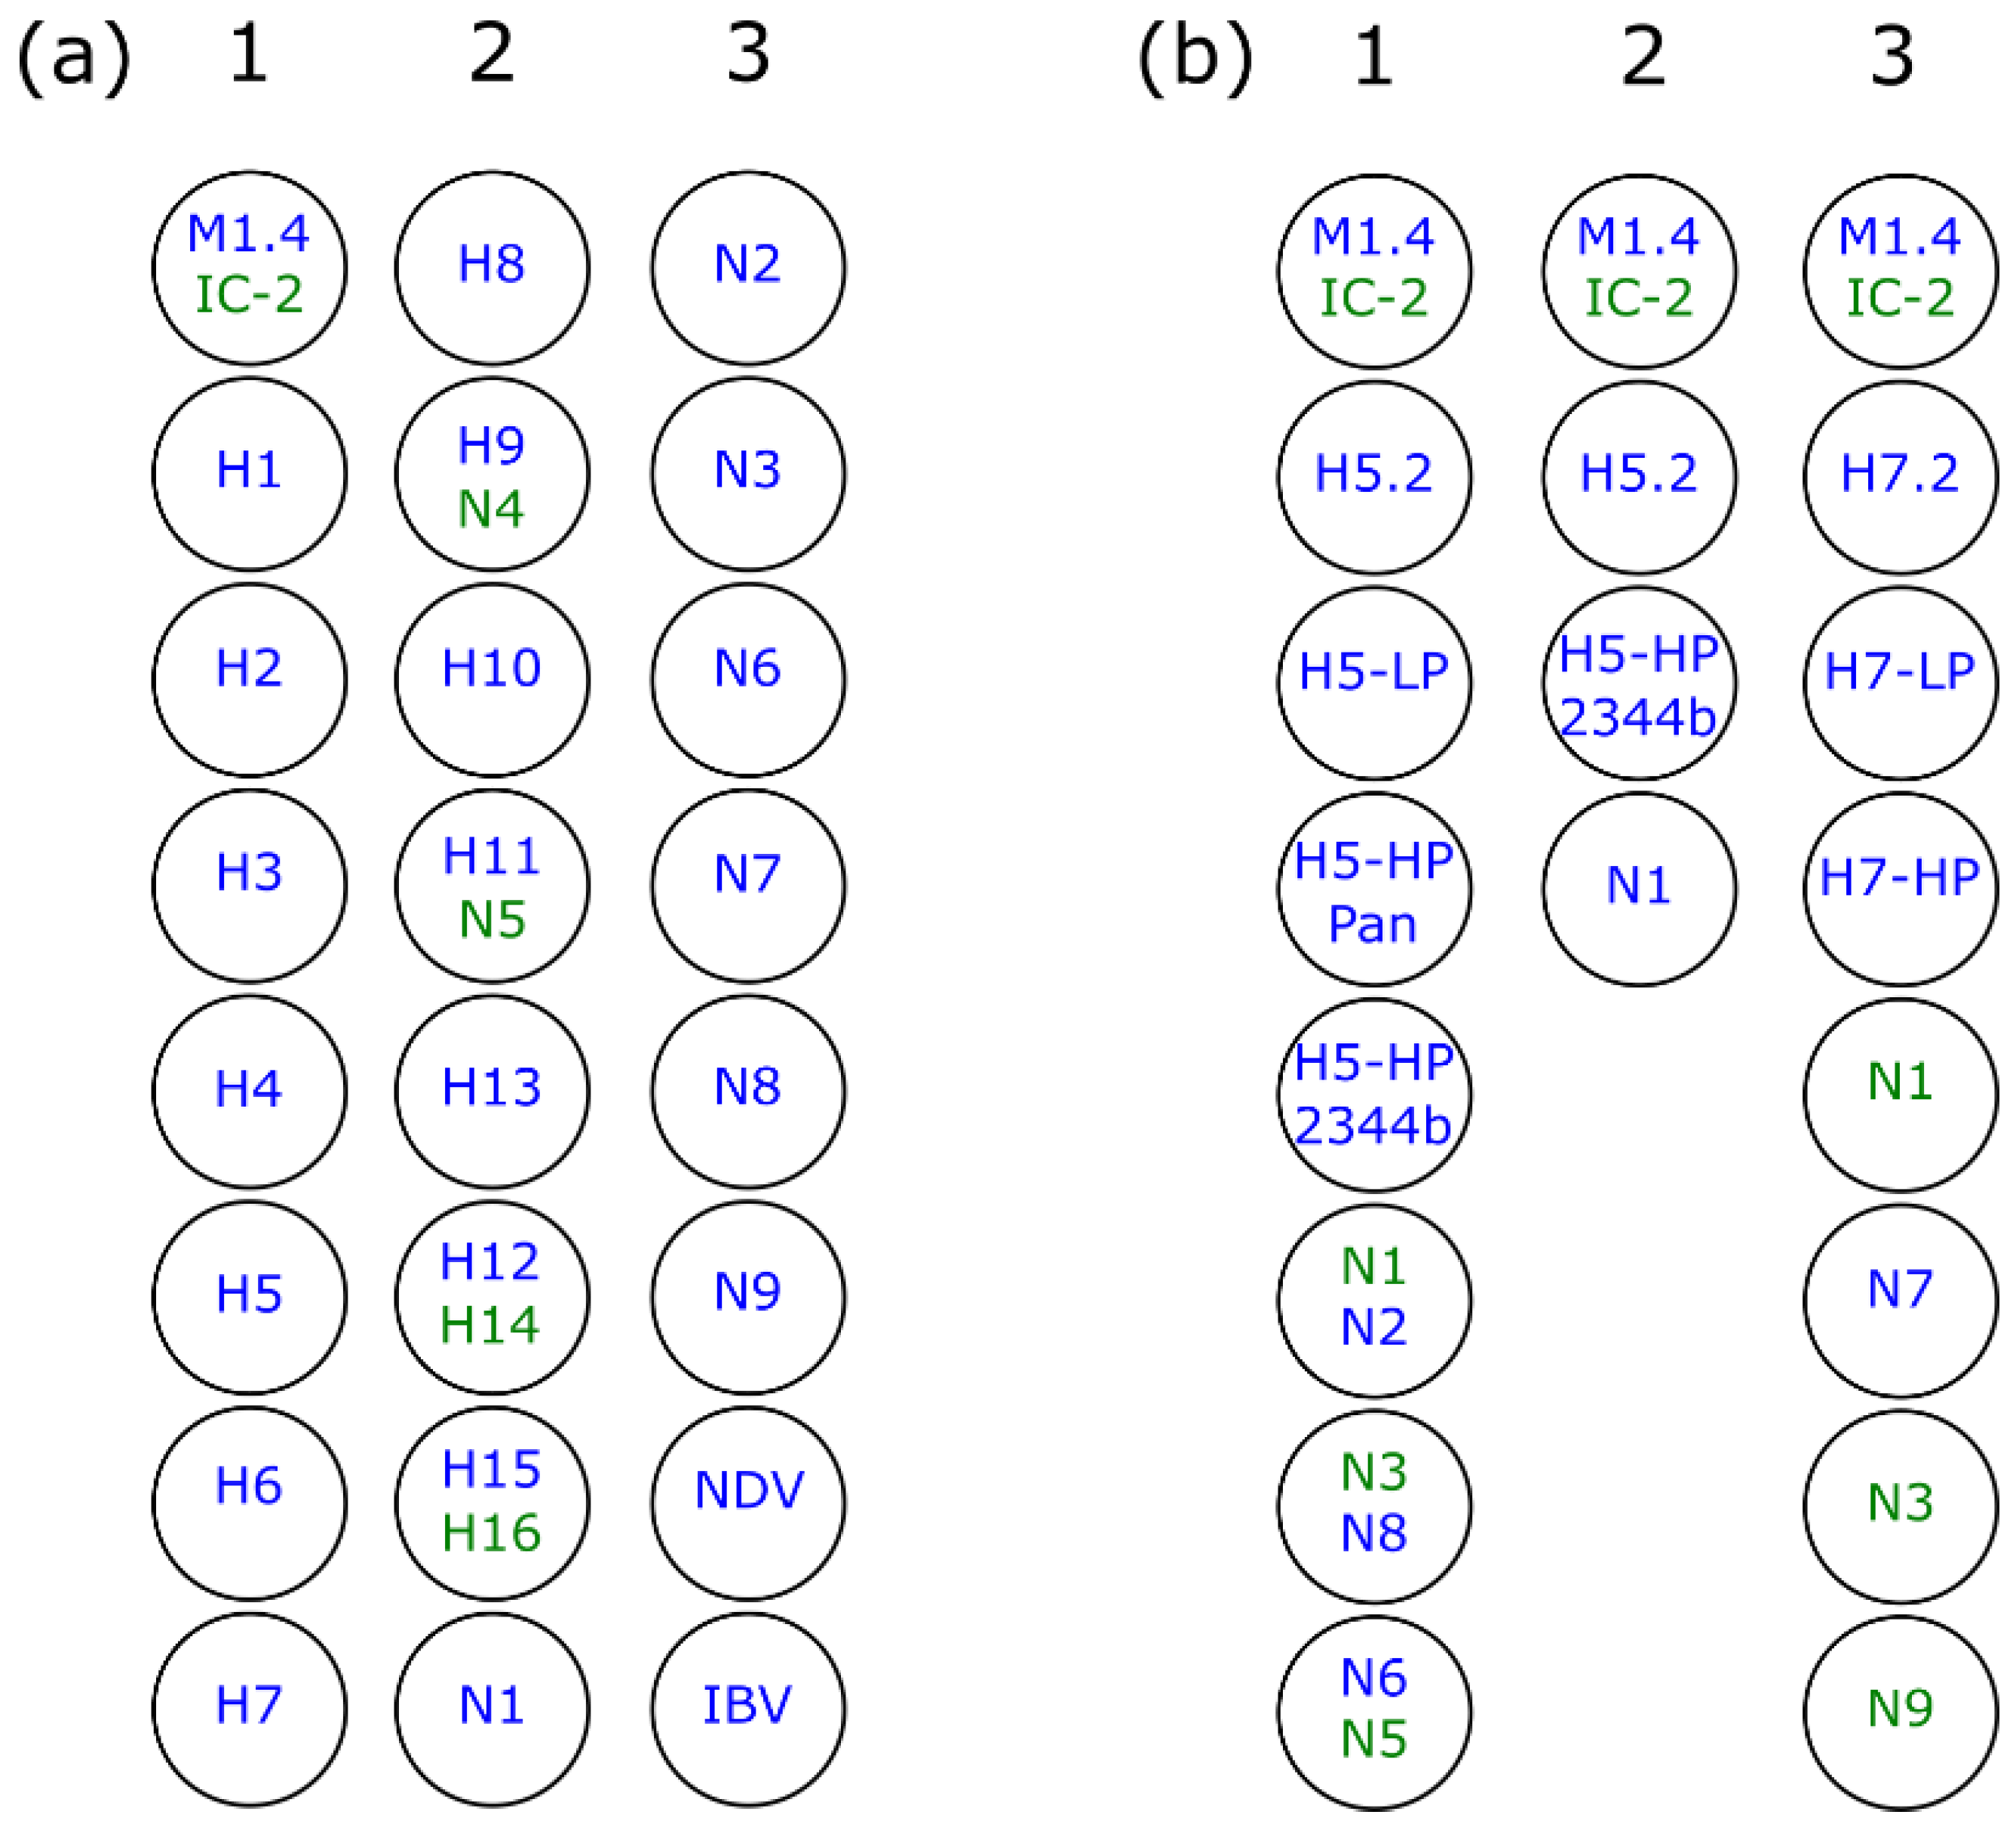
2.5. Plate Design
2.6. Set-Up of RT-qPCR Reactions
2.7. Preparation of Positive Controls
2.8. Statistical Analyses
3. Results
3.1. Evaluation and Selection of Oligonucleotide Sets
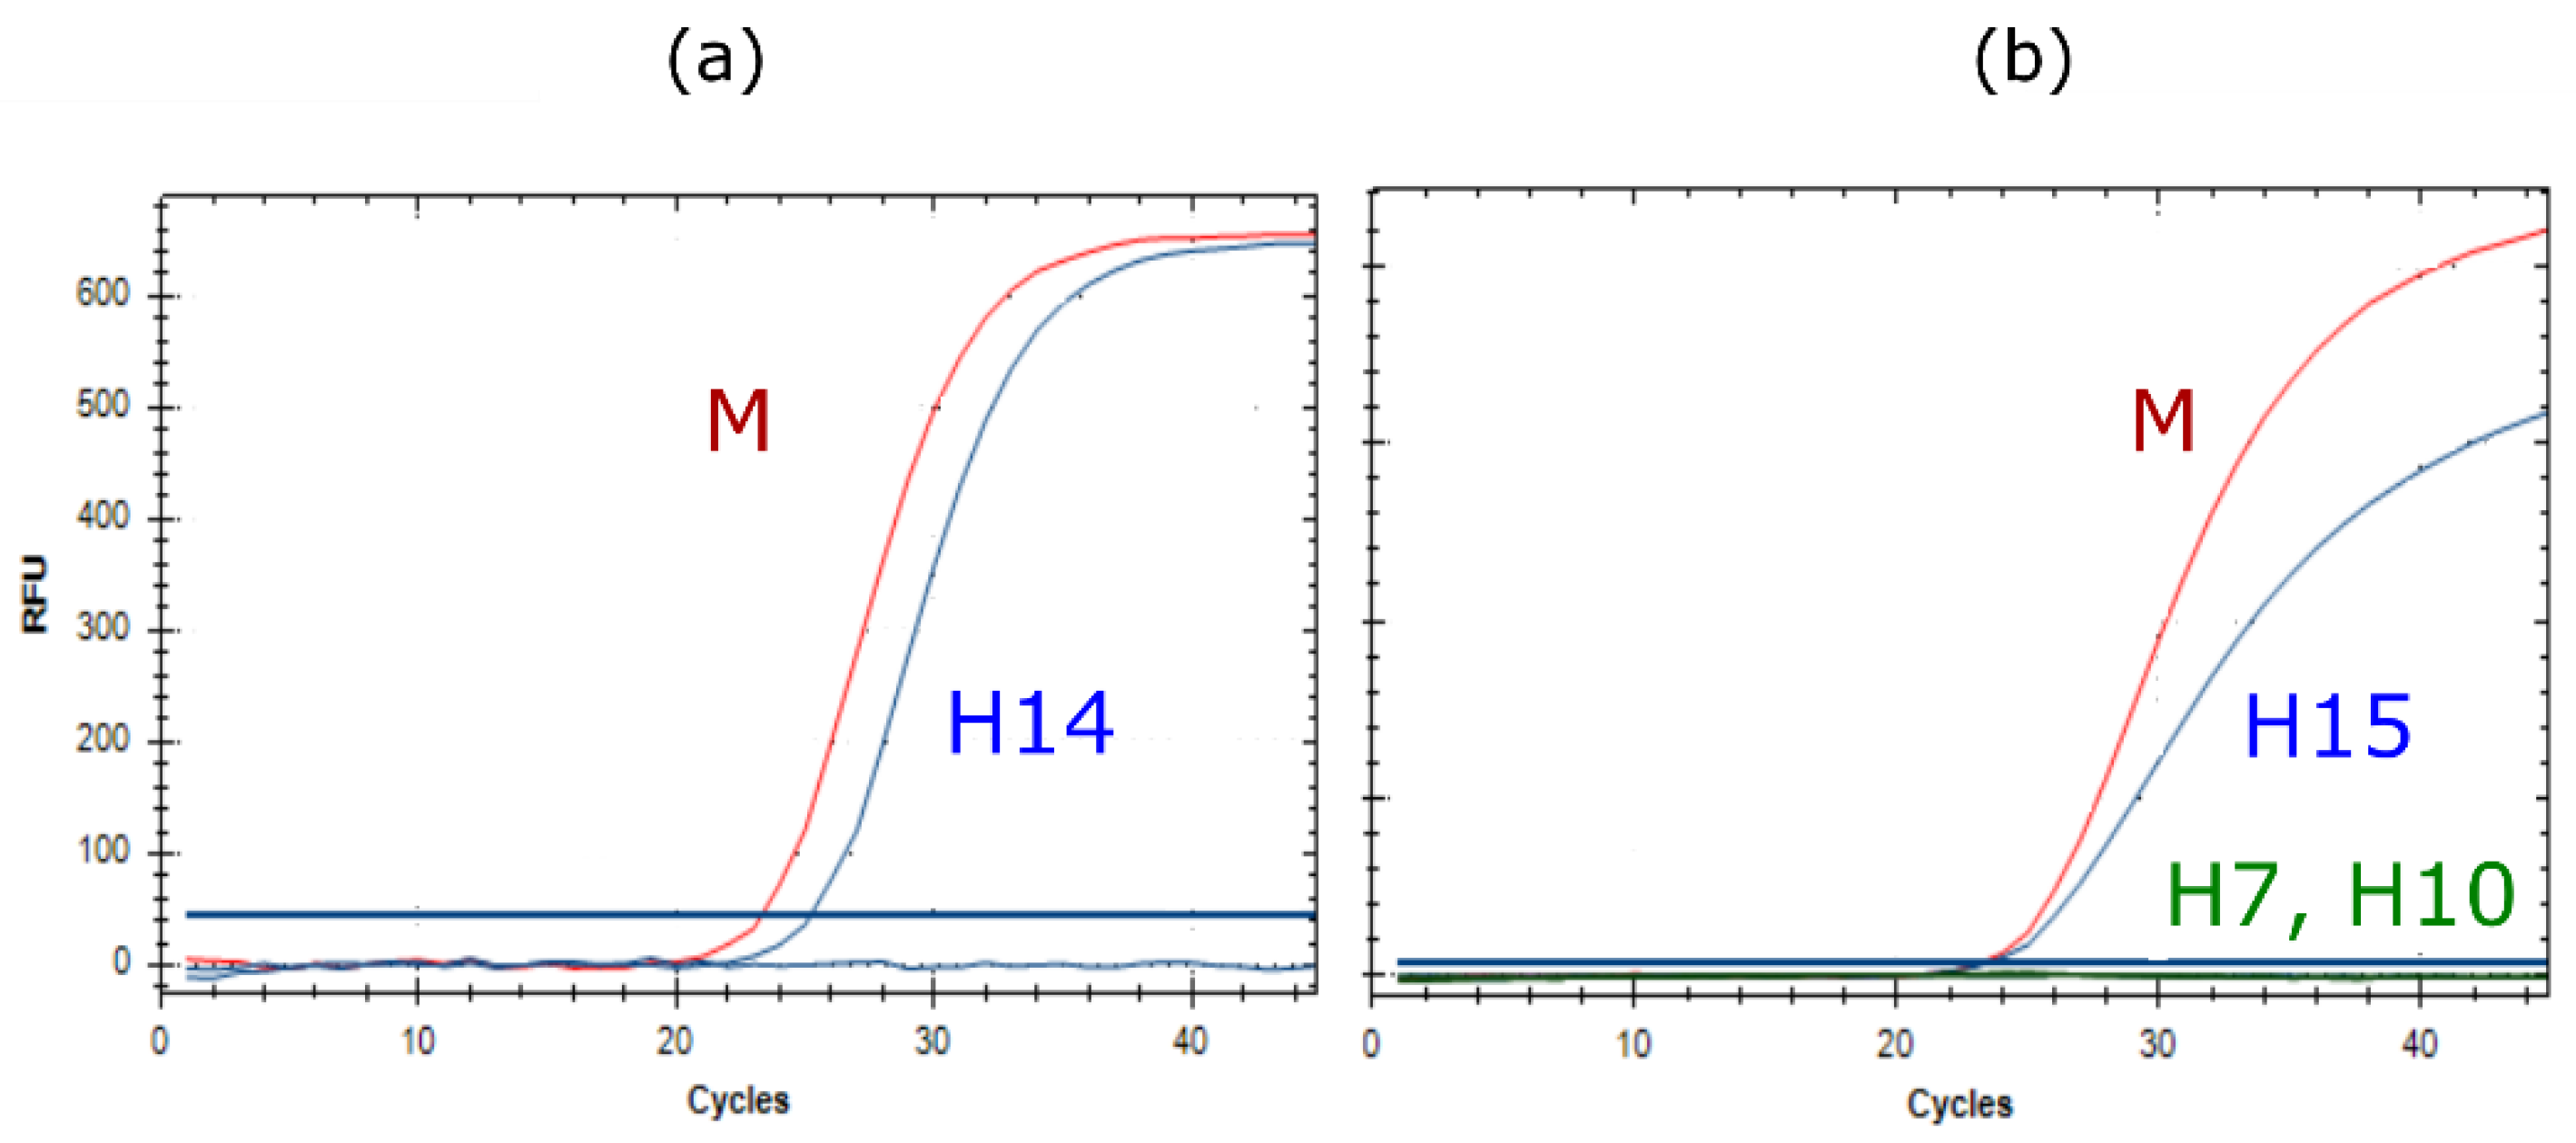
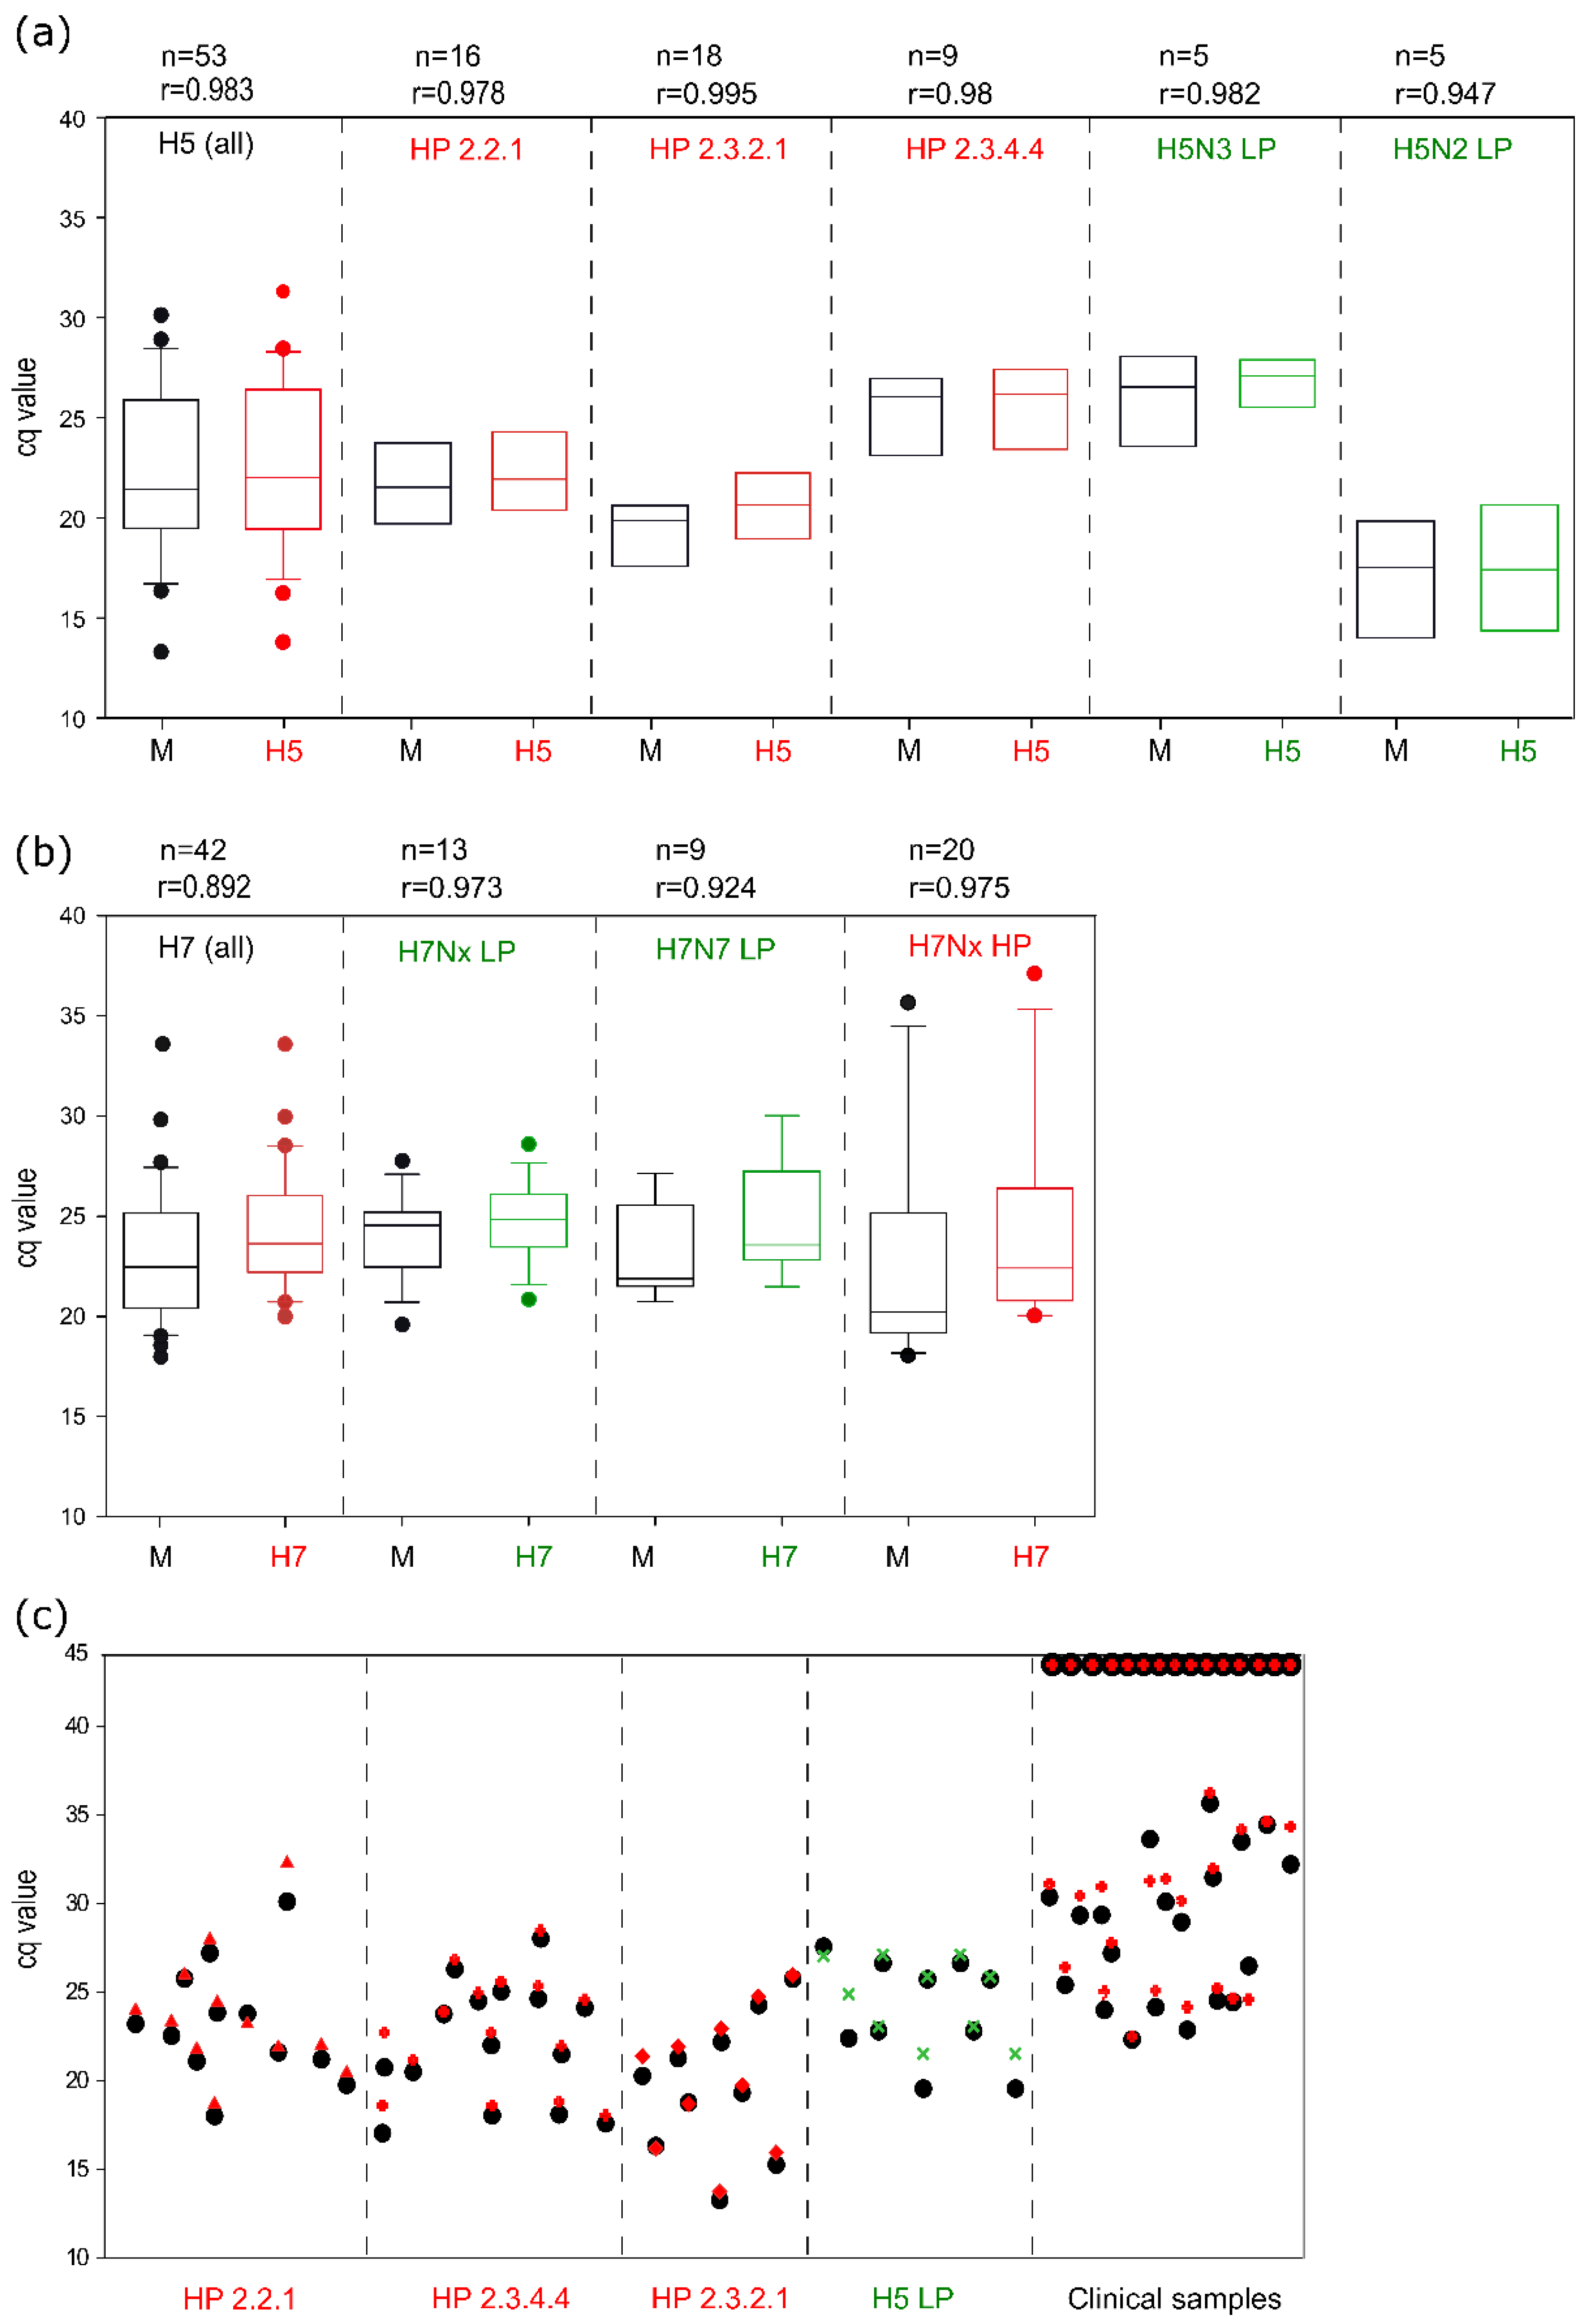
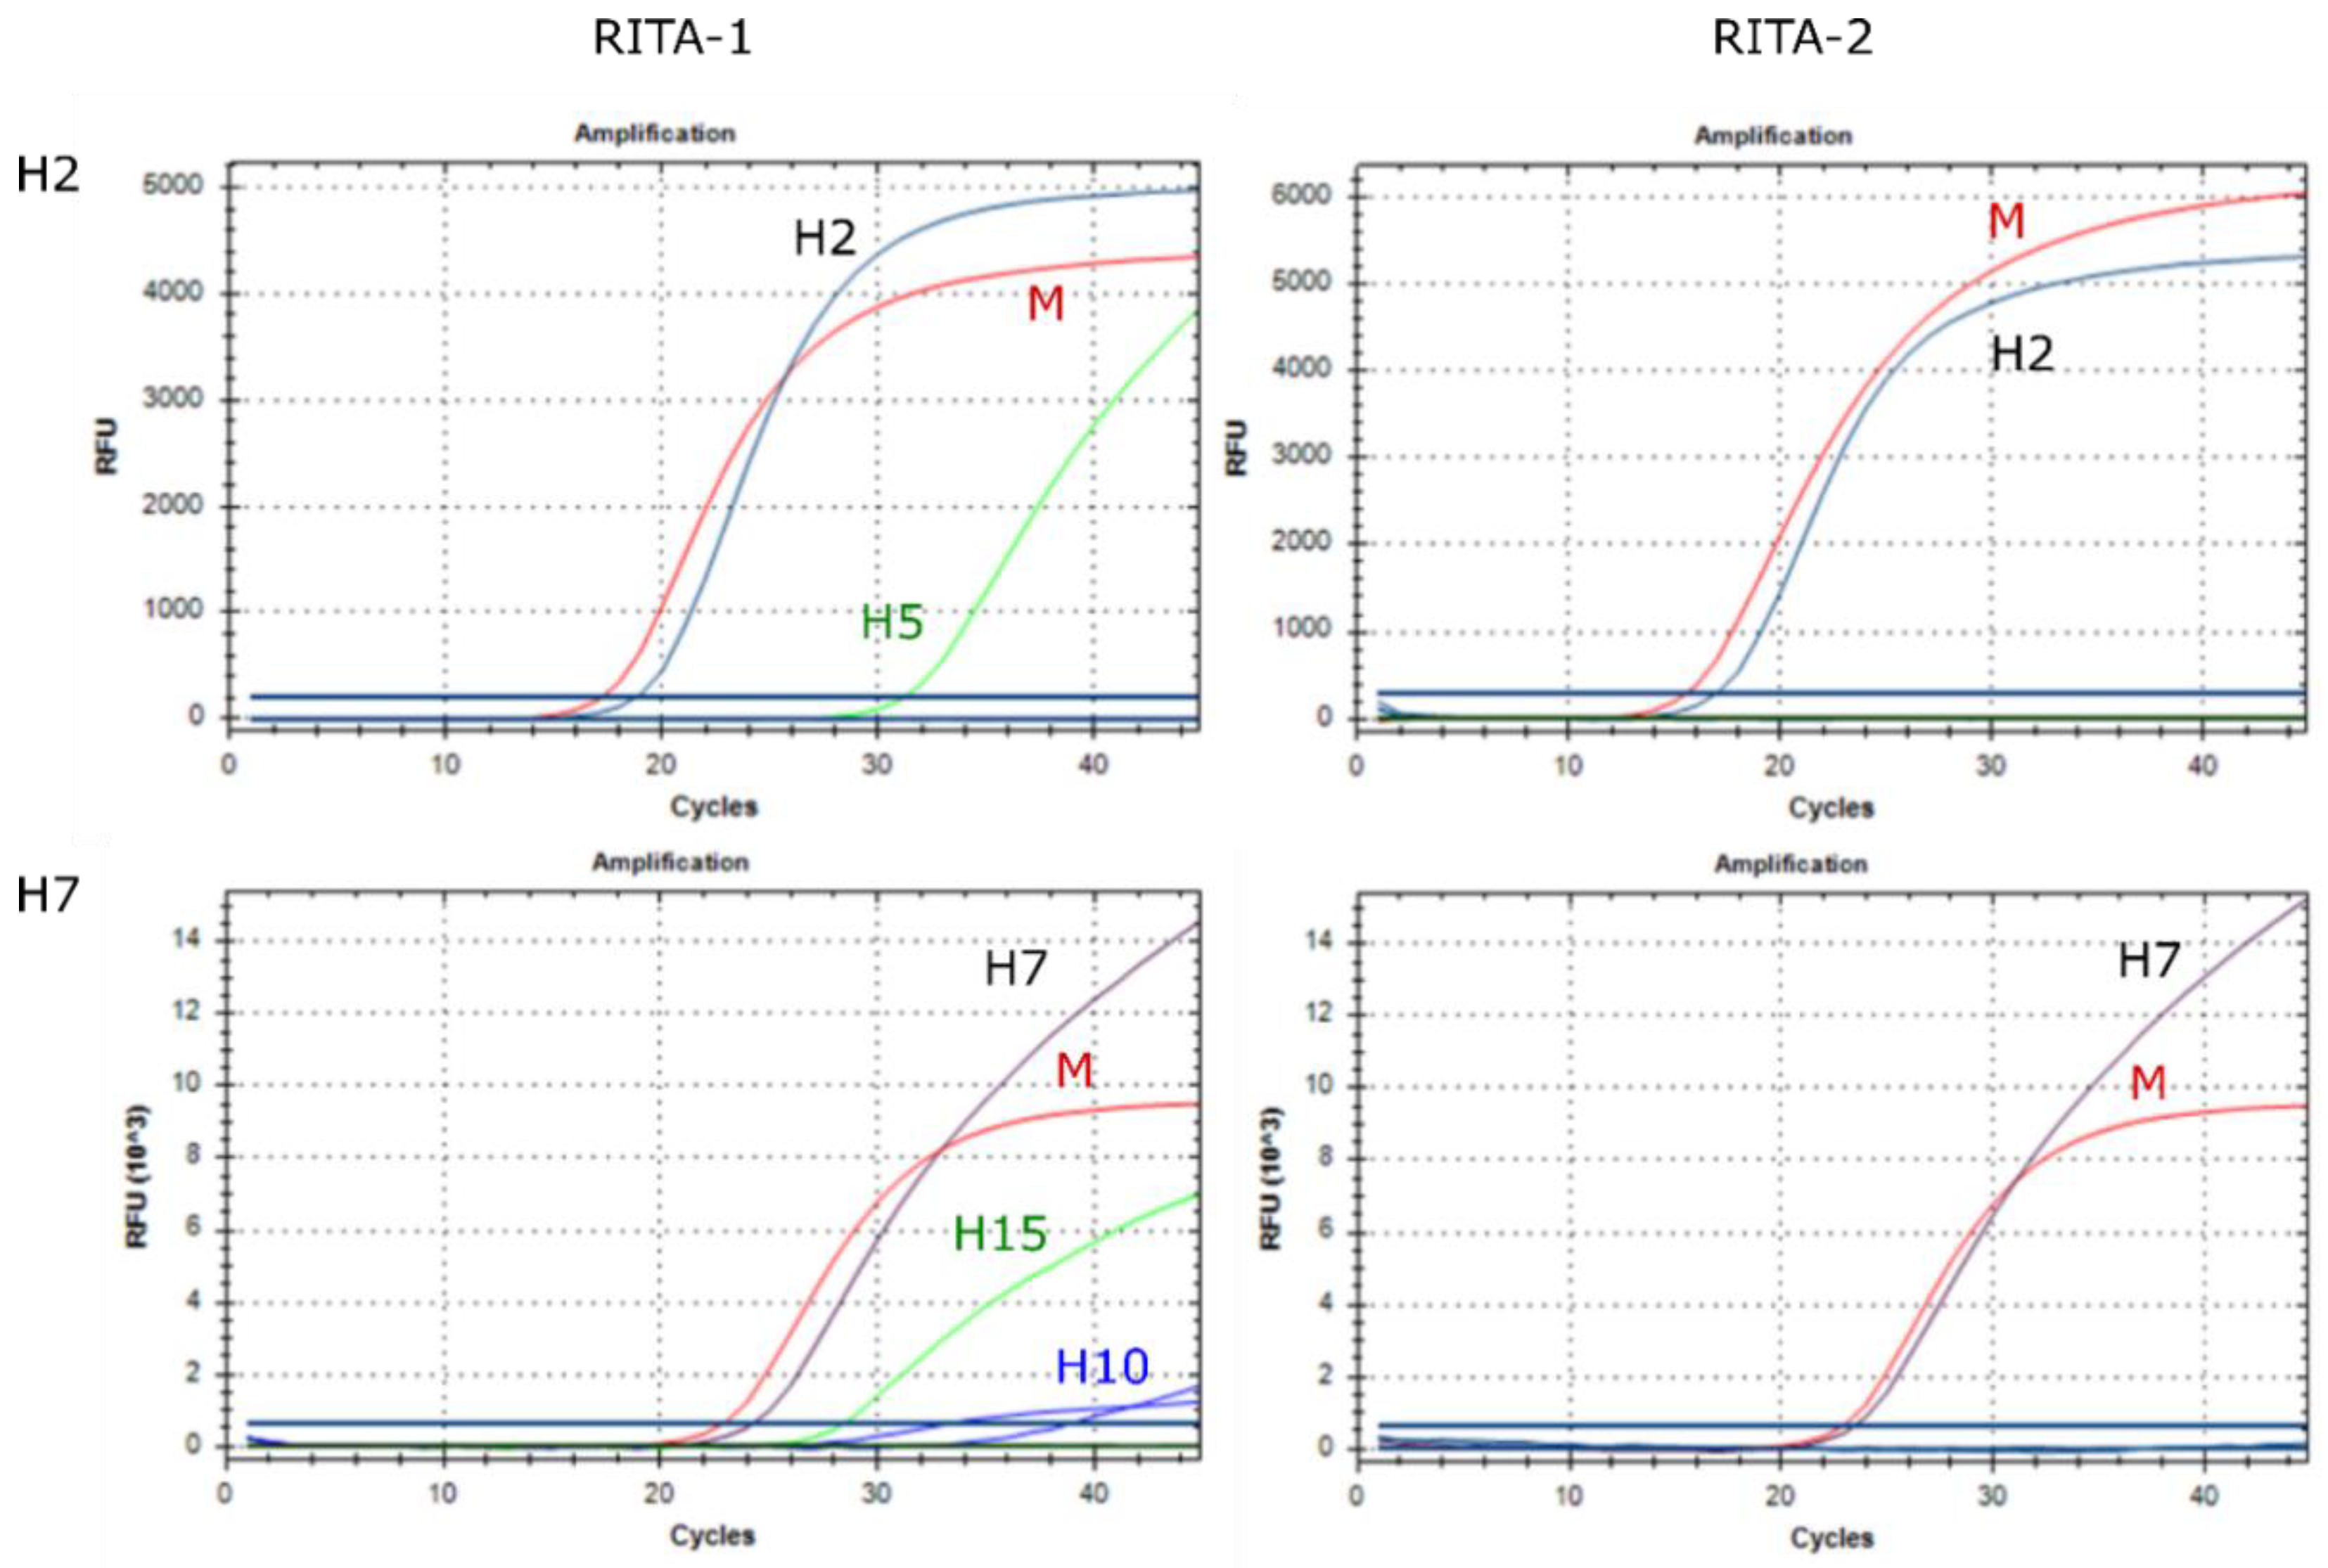
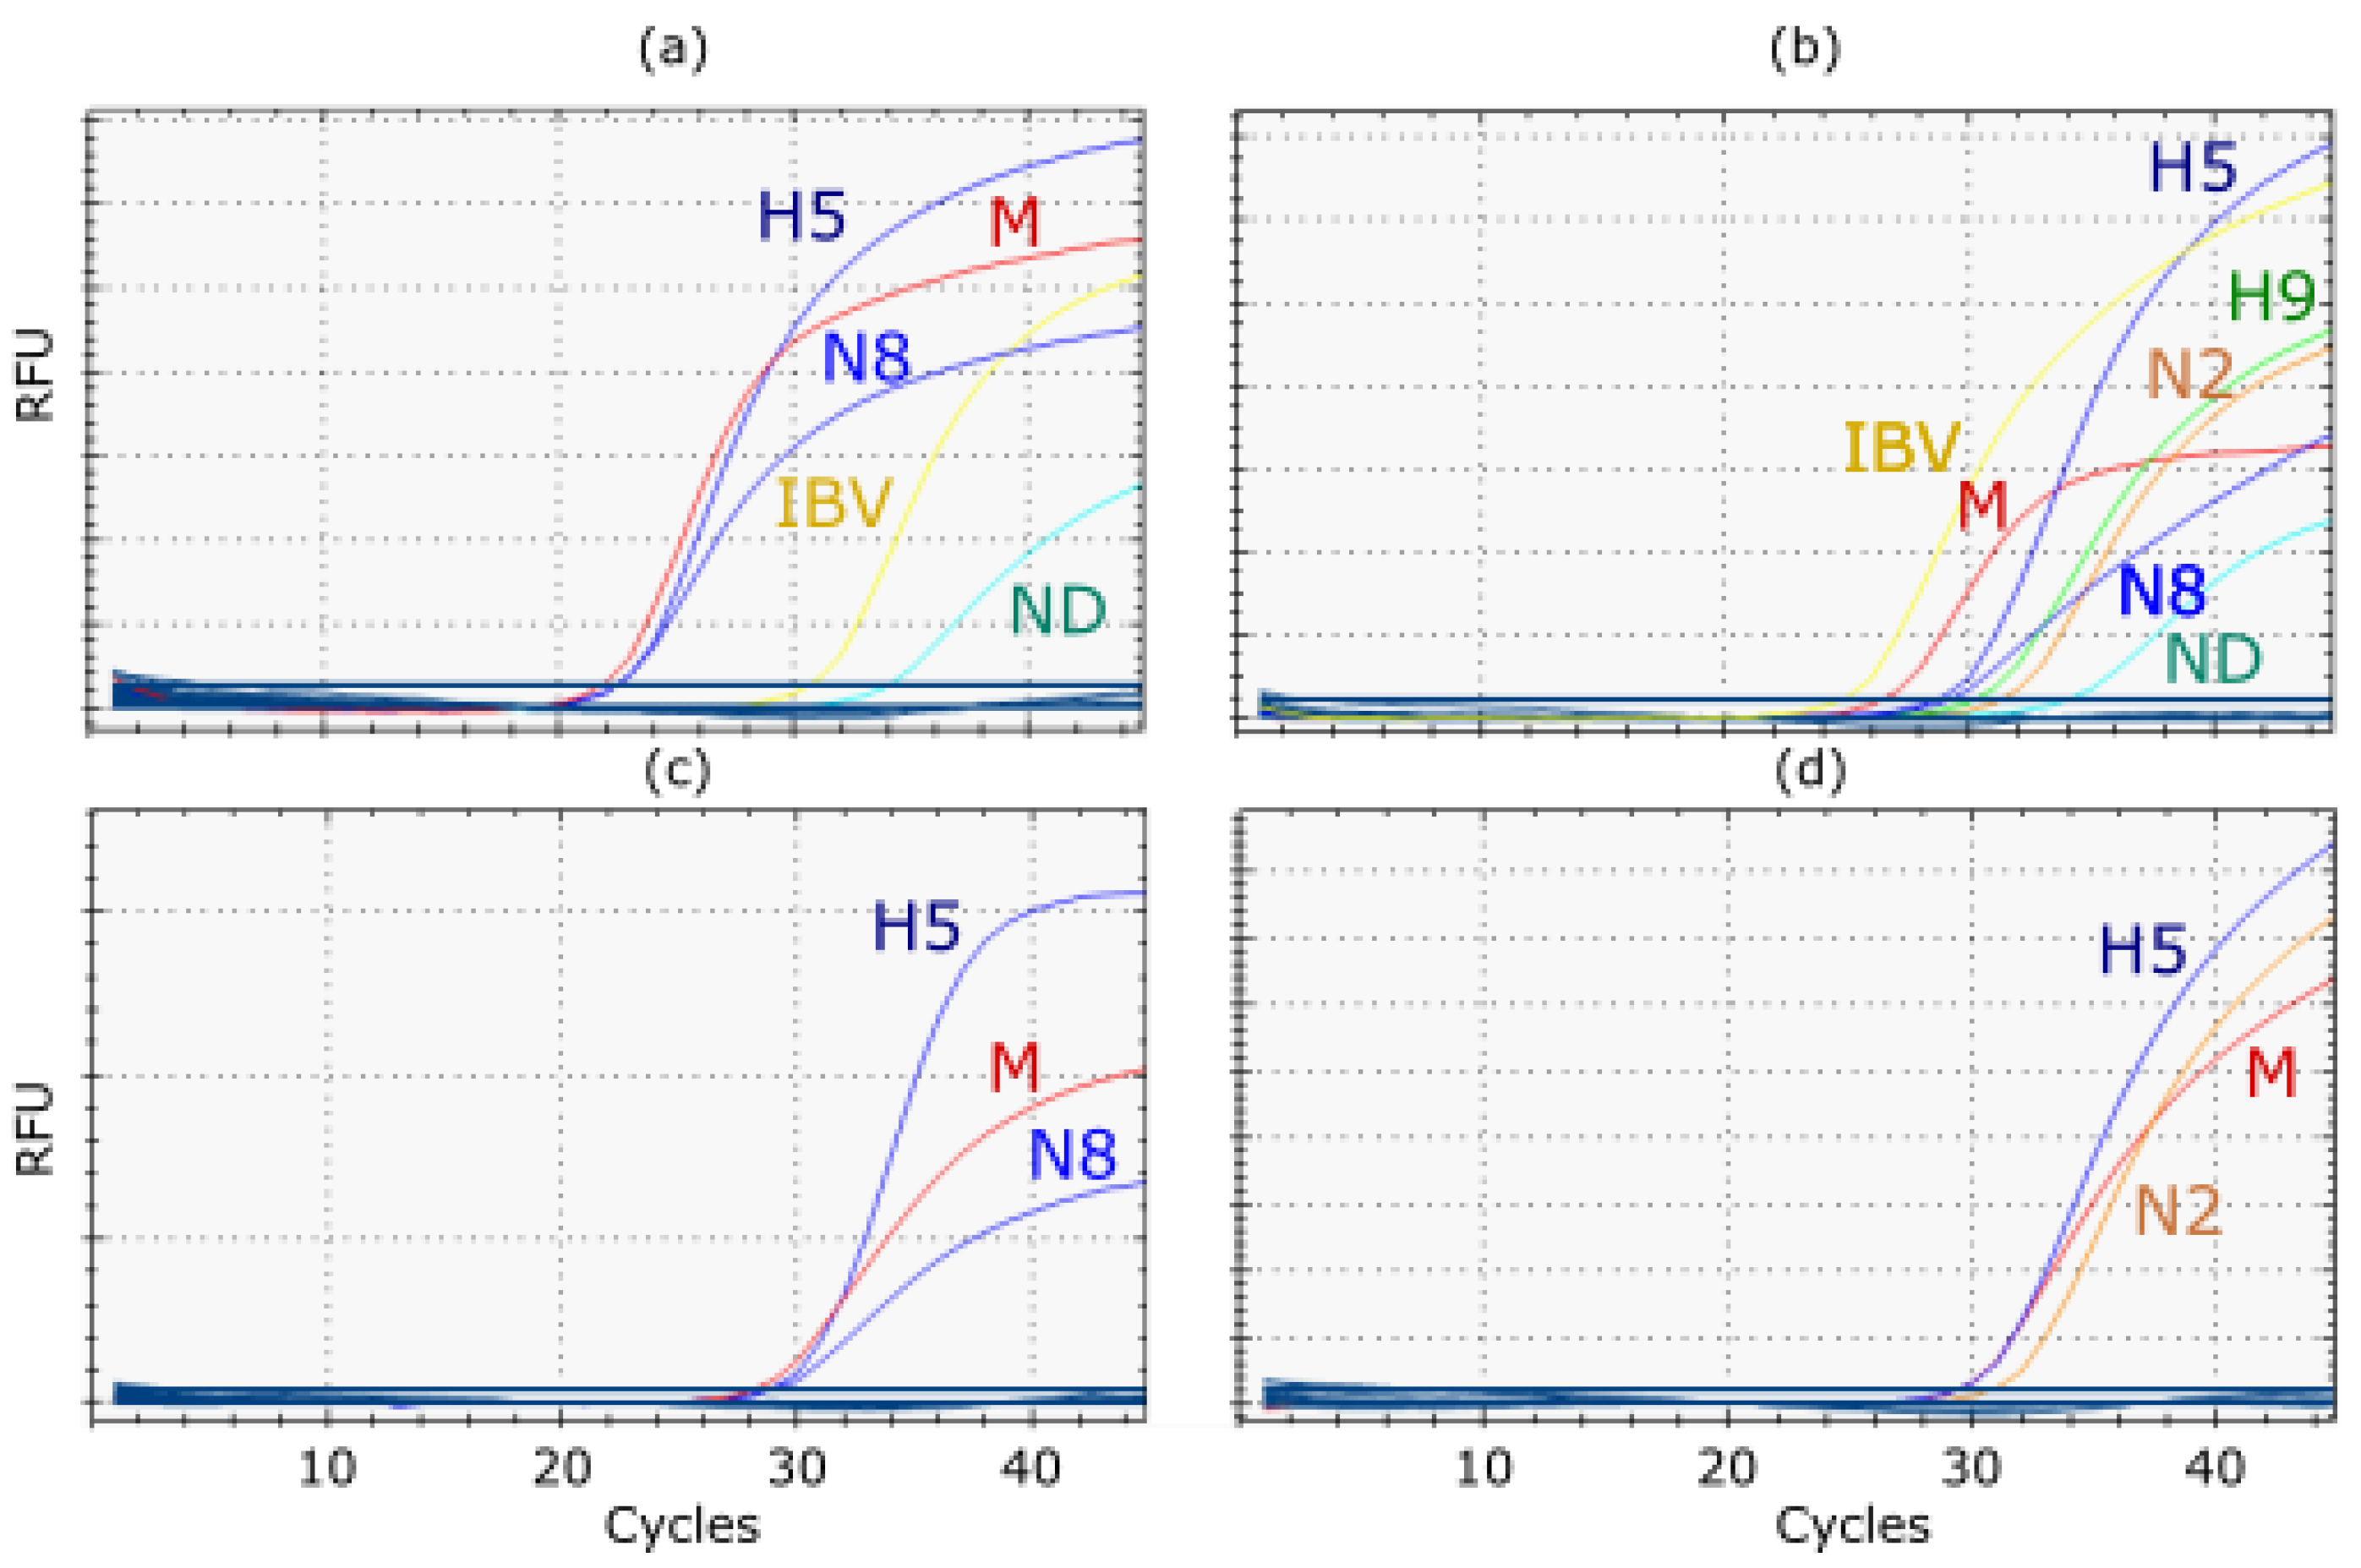
3.2. Extended Target Spectrum of RITA-2
3.3. Analytical Sensitivity
3.4. Analytical Specificity
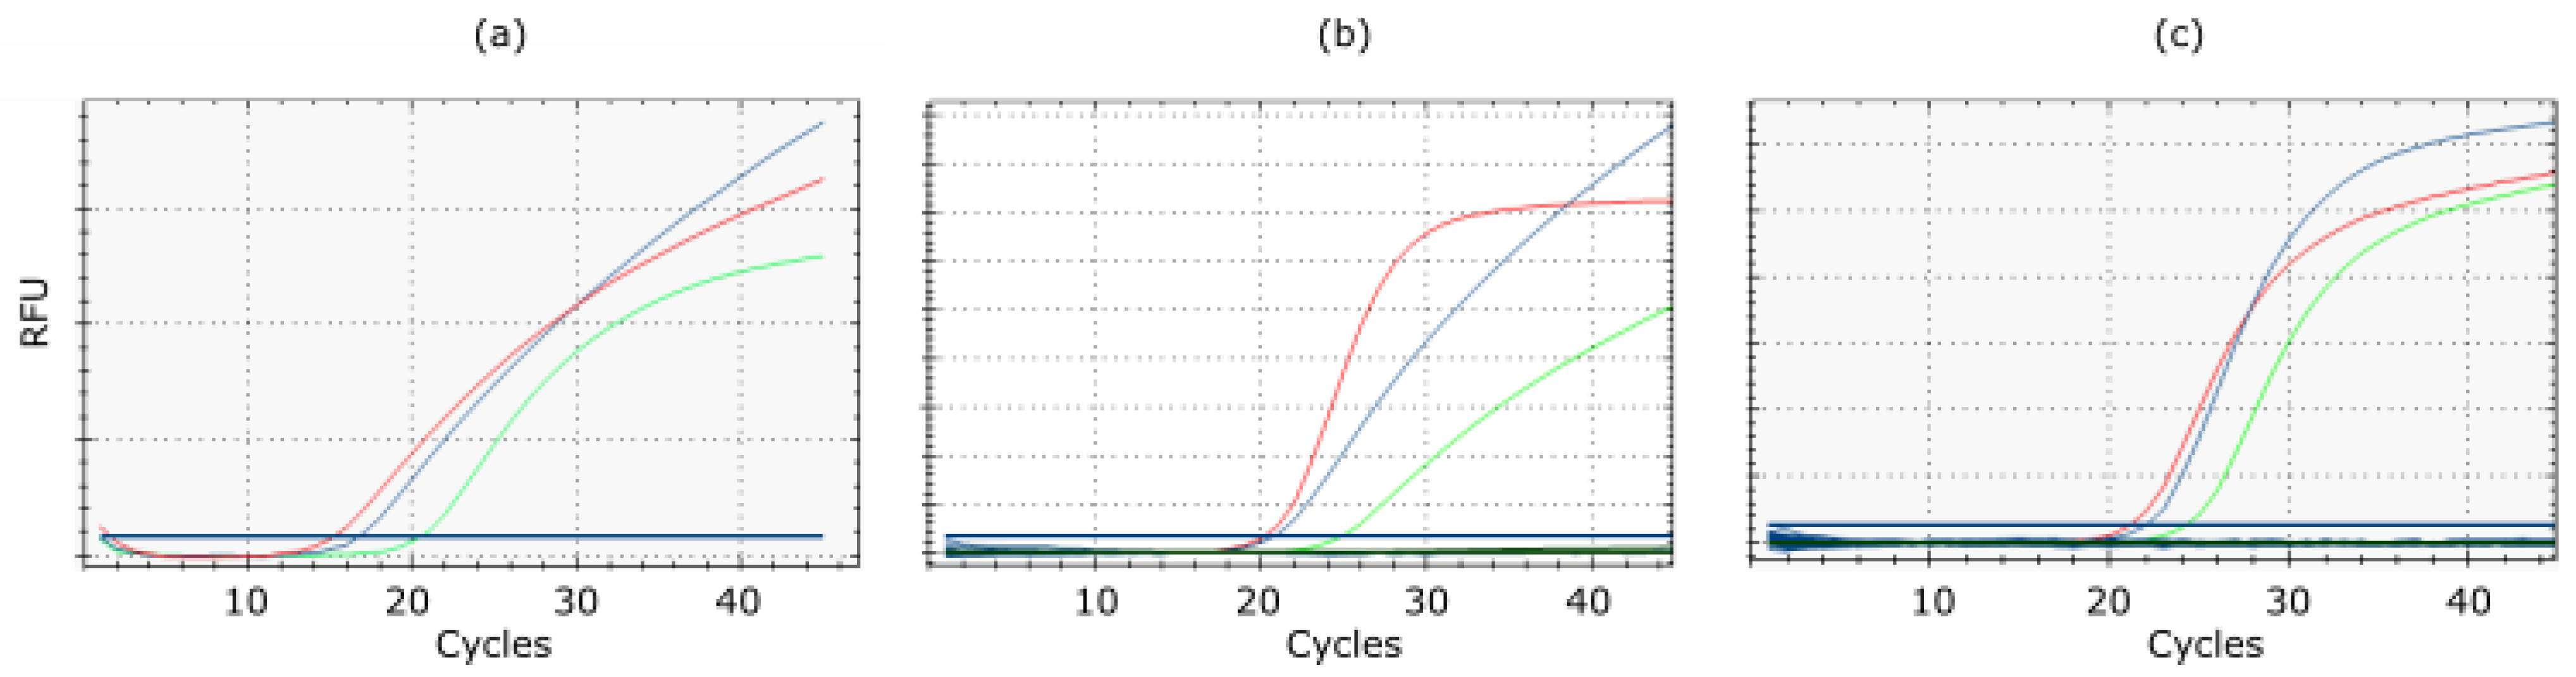
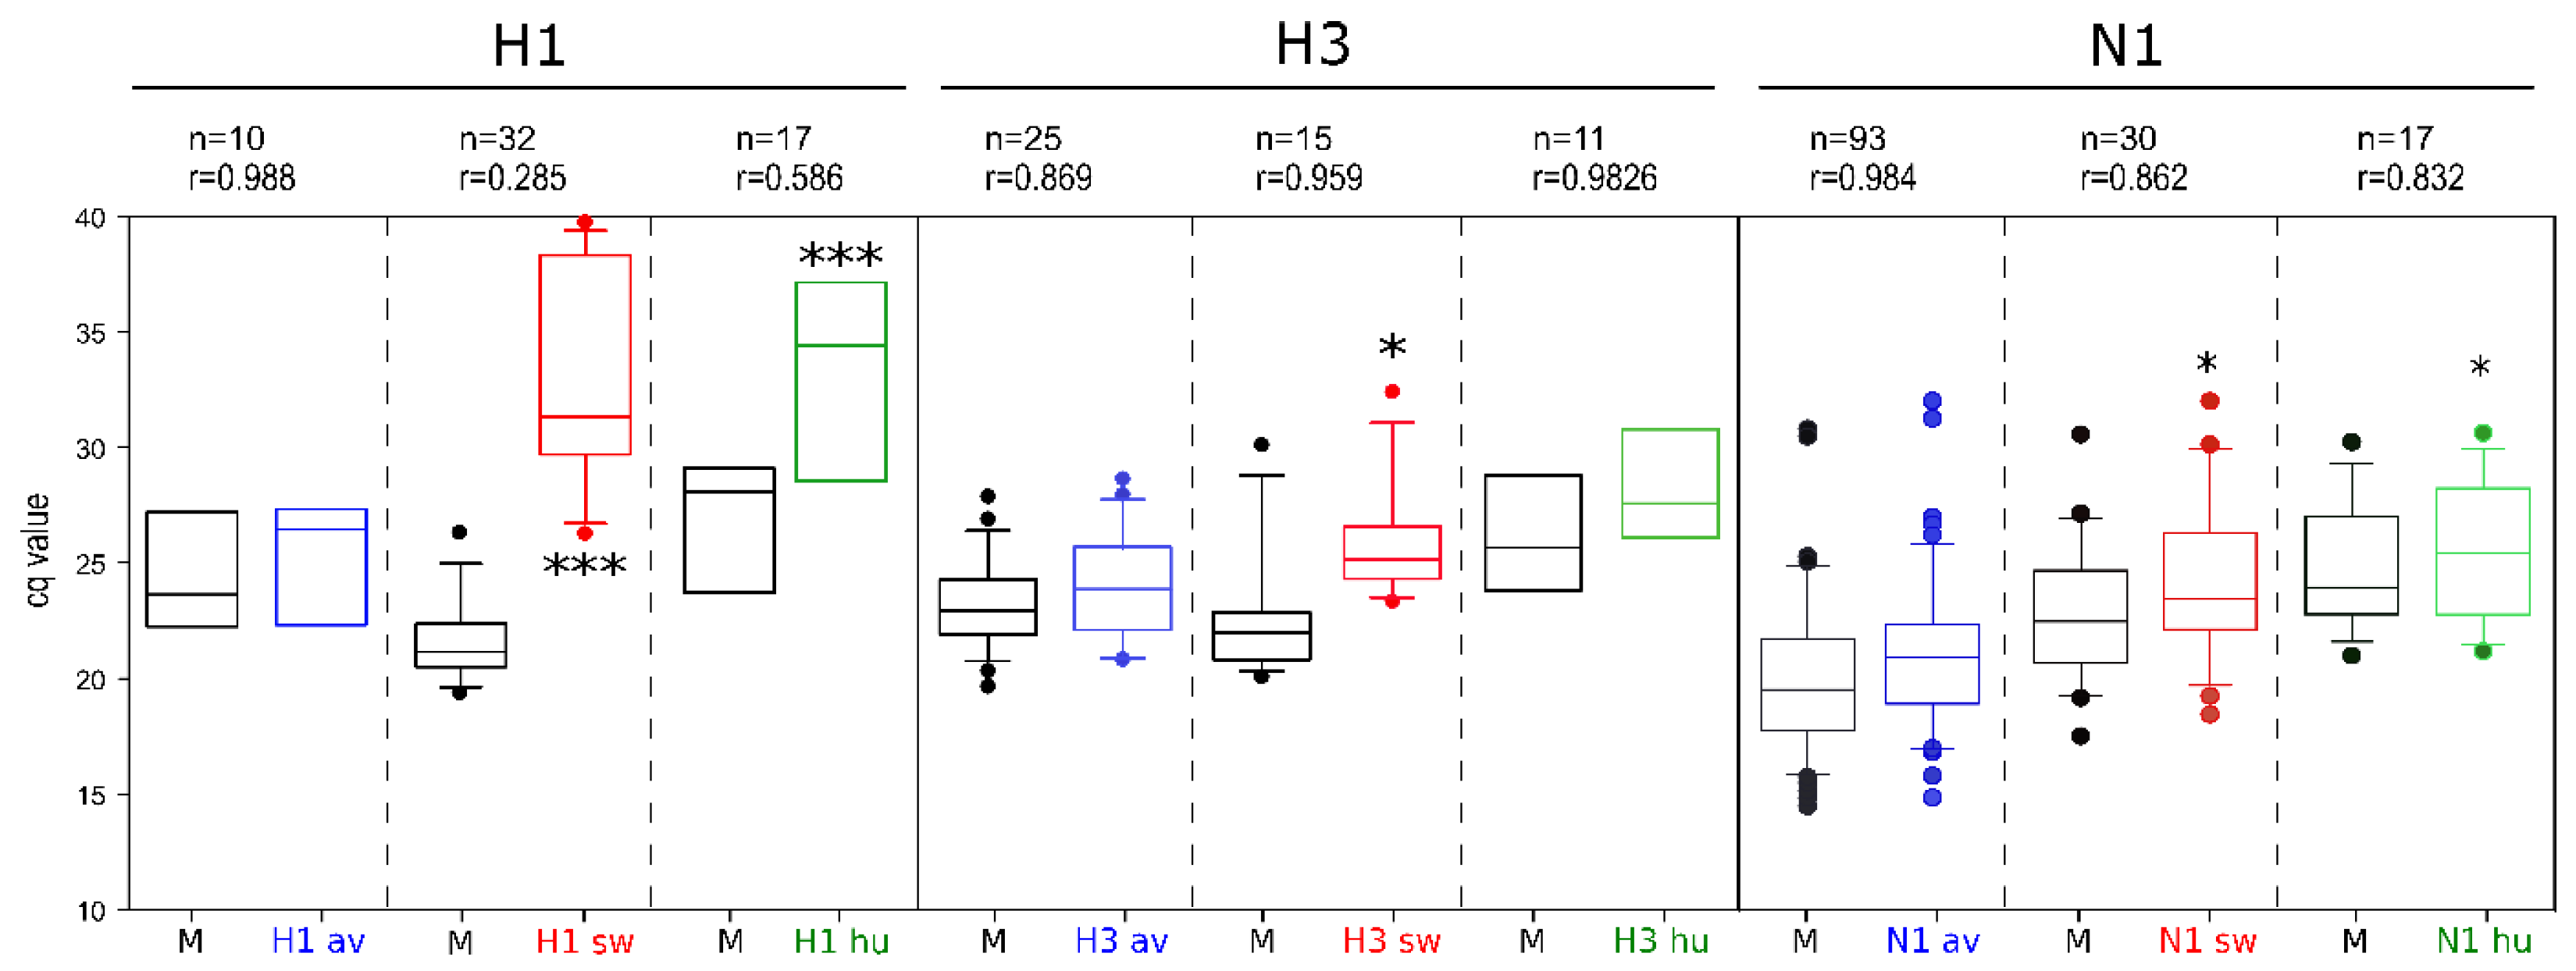
3.5. Assay Robustness
3.6. Performance Characteristics with Clinical Samples
4. Discussion
5. Conclusions
Supplementary Materials
Author Contributions
Funding
Institutional Review Board Statement
Data Availability Statement
Acknowledgments
Conflicts of Interest
References
- Webster, R.; Govorkova, E. Continuing challenges in influenza. Ann. N. Y. Acad. Sci. 2014, 1323, 115–139. [Google Scholar] [CrossRef]
- Ma, W.; Gramer, M.; Rossow, K.; Yoon, K.-J. Isolation and genetic characterization of new reassortant H3N1 swine influenza virus from pigs in the midwestern United States. J. Virol. 2006, 80, 5092–5096. [Google Scholar] [CrossRef] [Green Version]
- Fouchier, R.A.M.; Munster, V.; Wallensten, A.; Bestebroer, T.M.; Herfst, S.; Smith, D.; Rimmelzwaan, G.F.; Olsen, B.; Osterhaus, A.D.M.E. Characterization of a novel influenza A virus hemagglutinin subtype (H16) obtained from black-headed gulls. J. Virol. 2005, 79, 2814–2822. [Google Scholar] [CrossRef] [Green Version]
- Spackman, E.A. Brief Introduction to Avian Influenza Virus. Methods Mol. Biol. 2020, 2123, 83–92. [Google Scholar]
- Horimoto, T.; Kawaoka, Y. Influenza: Lessons from past pandemics, warnings from current incidents. Nat. Rev. Microbiol. 2005, 3, 591–600. [Google Scholar] [CrossRef]
- Poovorawan, Y.; Pyungporn, S.; Prachayangprecha, S.; Makkoch, J. Global alert to avian influenza virus infection: From H5N1 to H7N9. Pathog. Glob. Health 2013, 107, 217–223. [Google Scholar] [CrossRef] [Green Version]
- Machalaba, C.C.; Elwood, S.E.; Forcella, S.; Smith, K.M.; Hamilton, K.; Jebara, K.B.; Swayne, D.E.; Webby, R.J.; Mumford, E.; Mazet, J.A.K.; et al. Global avian influenza surveillance in wild birds: A strategy to capture viral diversity. Emerg. Infect. Dis. 2015, 21, e1–e7. [Google Scholar] [CrossRef] [Green Version]
- Chan, K.H.; Lam, S.Y.; Puthavathana, P.; Nguyen, T.D.; Long, H.T.; Pang, C.M.; Chan, K.M.; Cheung, C.Y.; Set, W.H.; Peiris, J.S. Comparative analytical sensitivities of six rapid influenza A antigen detection test kits for detection of influenza A subtypes H1N1, H3N2 and H5N1. J. Clin. Virol. 2007, 38, 169–171. [Google Scholar] [CrossRef]
- Marché, S.; van den Berg, T. Evaluation of rapid antigen detection kits for the diagnosis of highly pathogenic avian influenza H5N1 infection. Avian Dis. 2010, 54, 650–654. [Google Scholar] [CrossRef]
- Chua, T.H.; Ellis, T.M.; Wong, C.W.; Guan, Y.; Ge, S.X.; Peng, G.; Lamichhane, C.; Maliadis, C.; Tan, S.W.; Selleck, P.; et al. Performance evaluation of five detection tests for avian influenza antigen with various avian samples. Avian Dis. 2007, 51, 96–105. [Google Scholar] [CrossRef]
- Hassan, K.E.; King, J.; El-Kady, M.; Afifi, M.; Abozeid, H.H.; Pohlmann, A.; Beer, M.T.H. Novel Reassortant Highly Pathogenic Avian Influenza A(H5N2) Virus in Broiler Chickens, Egypt. Emerg. Infect. Dis. 2020, 26, 129–133. [Google Scholar] [CrossRef]
- Brown, I. Advances in molecular diagnostics for avian influenza. Dev. Biol. 2006, 124, 93–97. [Google Scholar]
- Suarez, D.L.; Das, A.; Ellis, E. Review of rapid molecular diagnostic tools for avian influenza virus. Avian Dis. 2007, 51, 201–208. [Google Scholar] [CrossRef]
- Kalthoff, D.; Bogs, J.; Harder, T.; Grund, C.; Pohlmann, A.; Beer, M.; Hoffmann, B. Nucleic acid-based detection of influenza A virus subtypes H7 and N9 with a special emphasis on the avian H7N9 virus. Euro Surveill. 2014, 19, 20731. [Google Scholar] [CrossRef] [Green Version]
- Hoffmann, B.; Harder, T.; Lange, E.; Kalthoff, D.; Reimann, I.; Grund, C.; Oehme, R.; Vahlenkamp, T.W.; Beer, M. New real-time reverse transcriptase polymerase chain reactions facilitate detection and differentiation of novel A/H1N1 influenza virus in porcine and human samples. Berl. Munch. Tierarztl. Wochenschr. 2010, 123, 286–292. [Google Scholar]
- Hoffmann, B.; Hoffmann, D.; Henritzi, D.; Beer, M.; Harder, T.C. Riems influenza a typing array (RITA): An RT-qPCR-based low density array for subtyping avian and mammalian influenza a viruses. Sci. Rep. 2016, 6, 27211. [Google Scholar] [CrossRef] [Green Version]
- Naguib, M.; Graaf, A.; Fortin, A.; Luttermann, C.; Wernery, U.; Amarin, N.; Hussein, A.H.; Sultan, H.; Al Adhadh, B.; Hassan, M.K.; et al. Novel real-time PCR-based patho- and phylotyping of potentially zoonotic avian influenza A subtype H5 viruses at risk of incursion into Europe in 2017. Euro Surveill. 2017, 22, 30435. [Google Scholar] [CrossRef] [Green Version]
- Graaf, A.; Beer, M.; Harder, T.C. Real-time reverse transcription PCR-based sequencing-independent pathotyping of Eurasian avian influenza A viruses of subtype H7. Virol. J. 2017, 14, 137. [Google Scholar] [CrossRef]
- Kearse, M.; Moir, R.; Wilson, A.; Stones-Havas, S.; Cheung, M.; Sturrock, S.; Buxton, S.; Cooper, A.; Markowitz, S.; Duran, C.; et al. Geneious Basic: An integrated and extendable desktop software platform for the organization and analysis of sequence data. Bioinformatics 2012, 28, 1647–1649. [Google Scholar] [CrossRef]
- Katoh, K.; Standley, D.M. MAFFT multiple sequence alignment software version 7: Improvements in performance and usability. Mol. Biol. Evol. 2013, 30, 772–780. [Google Scholar] [CrossRef] [Green Version]
- Larsson, A. AliView: A fast and lightweight alignment viewer and editor for large datasets. Bioinformatics 2014, 30, 3276–3278. [Google Scholar] [CrossRef]
- Kibbe, W. OligoCalc: An online oligonucleotide properties calculator. Nucleic Acids Res. 2007, 35, W43–W46. [Google Scholar] [CrossRef]
- Hassan, K.E.; El-Kady, M.F.; El-Sawah, A.A.A.; Luttermann, C.; Parvin, R.; Shany, S.; Beer, M.; Harder, T.C. Respiratory disease due to mixed viral infections in poultry flocks in Egypt between 2017 and 2018: Upsurge of highly pathogenic avian influenza virus subtype H5N8 since 2018. Transbound. Emerg. Dis. 2021, 68, 21–36. [Google Scholar] [CrossRef]
- Naguib, M.M.; El-Kady, M.F.; Lüschow, D.; Hassan, K.E.; Arafa, A.-S.; El-Zanaty, A.; Hassan, M.K.; Hafez, H.M.; Grund, C.; Harder, T.C. New real time and conventional RT-PCRs for updated molecular diagnosis of infectious bronchitis virus infection (IBV) in chickens in Egypt associated with frequent co-infections with avian influenza and Newcastle Disease viruses. J. Virol. Methods 2017, 245, 19–27. [Google Scholar] [CrossRef]
- Hoffmann, B.; Depner, K.; Schirrmeier, H.; Beer, M. A universal heterologous internal control system for duplex real-time RT-PCR assays used in a detection system for pestiviruses. J. Virol. Methods 2006, 136, 200–209. [Google Scholar] [CrossRef]
- Abdelwhab, E.M.; Lüschow, D.; Harder, T.C.; Hafez, H.M. The use of FTA® filter papers for diagnosis of avian influenza virus. J. Virol. Methods 2011, 174, 120–122. [Google Scholar] [CrossRef]
- Hassan, K.E.; Ali, A.; Dahshan, A.-H.M.; El-Sawah, A.A.; Shany, S.A.S.; El-Kady, M.F. Prevalence of avian respiratory viruses in broiler flocks in Egypt. Poult. Sci. 2016, 95, 1271–1280. [Google Scholar] [CrossRef]
- Samy, A.; Naguib, M.M. Avian Respiratory Coinfection and Impact on Avian Influenza Pathogenicity in Domestic Poultry: Field and Experimental Findings. Vet. Sci. 2018, 5, 23. [Google Scholar] [CrossRef] [Green Version]
- Shehata, A.A.; Sedeik, M.E.; Elbestawy, A.R.; Zain El-Abideen, M.A.; Kilany, W.H.; Ibrahim, H.H.; Ali, A. Co-infections, genetic, and antigenic relatedness of avian influenza H5N8 and H5N1 viruses in domestic and wild birds in Egypt. Poult. Sci. 2019, 98, 2371–2379. [Google Scholar] [CrossRef]
- Liu, S.; Ji, K.; Chen, J.; Tai, D.; Jiang, W.; Hou, G.; Chen, J.; Li, J.; Huang, B. Panorama Phylogenetic Diversity and Distribution of Type A Influenza Virus. PLoS ONE 2009, 4, e5022. [Google Scholar] [CrossRef]
- Zhuang, Q.; Wang, S.; Liu, S.; Hou, G.; Li, J.; Jiang, W.; Wang, K.; Peng, C.; Liu, D.; Guo, A.; et al. Diversity and distribution of type A influenza viruses: An updated panorama analysis based on protein sequences. Virol. J. 2019, 16, 85. [Google Scholar] [CrossRef] [Green Version]
- Monne, I.; Ormelli, S.; Salviato, A.; De Battisti, C.; Bettini, F.; Salomoni, A.; Drago, A.; Zecchin, B.; Capua, I.; Cattoli, G. Development and validation of a one-step real-time PCR assay for simultaneous detection of subtype H5, H7, and H9 avian influenza viruses. J. Clin. Microbiol. 2008, 46, 1769–1773. [Google Scholar] [CrossRef] [Green Version]
- Harfoot, R.; Webby, R. H5 influenza, a global update. J. Microbiol. 2017, 55, 196–203. [Google Scholar] [CrossRef]
- King, J.; Harder, T.; Conraths, F.J.; Beer, M.; Pohlmann, A. The genetics of highly pathogenic avian influenza viruses of subtype H5 in Germany, 2006–2020. Transbound. Emerg. Dis. 2021, 68, 1136–1150. [Google Scholar] [CrossRef]
- European Food Safety Authority; Adlhoch, C.; Fusaro, A.; Gonzales, J.; Kuiken, T.; Marangon, S.; Niqueux, E.; Staubach, C.; Terregino, C.; Aznar, I.; et al. Avian influenza overview February–May 2021. EFSA J. 2021, 19, 6951. [Google Scholar]
- Parvin, R.; Begum, J.A.; Chowdhury, E.H.; Islam, M.R.; Beer, M.; Harder, T.C. Co-subsistence of avian influenza virus subtypes of low and high pathogenicity in Bangladesh: Challenges for diagnosis, risk assessment and control. Sci. Rep. 2019, 9, 8306. [Google Scholar] [CrossRef] [Green Version]
- Henritzi, D.; Zhao, N.; Starick, E.; Simon, G.; Krog, J.S.; Larsen, L.E.; Reid, S.M.; Brown, I.H.; Chiapponi, C.; Foni, E.; et al. Rapid detection and subtyping of European swine influenza viruses in porcine clinical samples by haemagglutinin- and neuraminidase-specific tetra- and triplex real-time RT-PCRs. Influenza Respir. Viruses 2016, 10, 504–517. [Google Scholar] [CrossRef] [Green Version]


| Subtype | Number of Samples | Host | ||||
|---|---|---|---|---|---|---|
| Avian | Human | Porcine | Equine | Unknown | ||
| H1 | 63 | 10 | 17 | 32 | 4 | |
| H2 | 20 | 19 | 1 | |||
| H3 | 52 | 25 | 11 | 15 | 1 | |
| H4 | 20 | 20 | ||||
| H5 | 53 | 53 | ||||
| H6 | 67 | 67 | ||||
| H7 | 42 | 40 | 1 | 1 | ||
| H8 | 5 | 5 | ||||
| H9 | 43 | 29 | 14 | |||
| H10 | 32 | 30 | 2 | |||
| H11 | 14 | 12 | 1 | 1 | ||
| H12 | 1 | 1 | ||||
| H13 | 10 | 10 | ||||
| H14 | 1 | 1 | ||||
| H15 | 1 | 1 | ||||
| H16 | 4 | 4 | ||||
| HA, total | 428 | 327 | 29 | 49 | 3 | 20 |
| N1 | 144 | 93 | 17 | 30 | 4 | |
| N2 | 125 | 88 | 11 | 12 | 14 | |
| N3 | 29 | 29 | ||||
| N4 | 10 | 10 | ||||
| N5 | 6 | 5 | 1 | |||
| N6 | 28 | 23 | 4 | 1 | ||
| N7 | 38 | 34 | 3 | 1 | ||
| N8 | 37 | 36 | 1 | |||
| N9 | 11 | 9 | 1 | 1 | ||
| NA, total | 428 | 327 | 29 | 49 | 3 | 20 |
| RNA/Mastermix AgPath-ID™ One-Step RT-PCR | Single Reaction | 24 Reactions (1 Sample) | 96 Reactions (4 Samples) |
|---|---|---|---|
| 1× | 26× | 100× | |
| RNase free water | 2.25 µL | 58.5 µL | 225 µL |
| 2× RT-PCR Buffer | 6.25 µL | 162.5 µL | 625 µL |
| RT-PCR Enzyme Mix | 0.5 µL | 13 µL | 50 µL |
| Primer-Probe mix 1 | 1 µL | 26 µL | 100 µL |
| Sample RNA | 2.5 µL | 65 µL | 2.5 µL/well |
| Total volume | 12.5 µL | 299 µL | 1000 µL |
| Template | 2.5 µL/well | 2.5 µL/well | 2.5 µL/well |
| Positive Control | Subtype | Strain | Cq Value/Reaction |
|---|---|---|---|
| PTC-1 | H1N1 | A/Mallard/Germany/R193/09 | 23–25 |
| H5N6 | A/White stork/Germany/AR251/2018 | 21–23 | |
| H9N2 | A/Chicken/Egypt/AR538/2017 | 22–25 | |
| H13N8 | A/Larus ridibundus/Germany/R2064/2006 | 24–26 | |
| IBV-1 | AI20298/2019 | 23–25 | |
| PTC-2 | H2N3 | A/Mallard/Germany/Wv677/04 | 23.65–25 |
| H6N2 | A/Turkey/Mass/3740/65 | 22–24 | |
| H10N7 | A/Mallard/Germany/1490/09 | 22–24 | |
| H14N5 | A/Mallard/Gurjev/263/82 | 26–27 | |
| IBV | AI20298/2019 | 23–25 | |
| PTC-3 | H3N8 | A/Mallard/Germany/R1648/07 | 23–25 |
| H7N7 | A/Greylag goose/Germany/AR942/2015 | 22–24 | |
| H11N9 | A/Mallard/Föhr/Wv1499-1503/03 | 22–24 | |
| H15N9 | A/Shearwater/West Australia/2576/79 | 22–24 | |
| NDV-1 | ND/Lentogenic/713/2016 | 22–24 | |
| PTC-4 | H4N6 | A/Mallard/Germany/R485/3/08 | 21–23 |
| H8N4 | A/Anas latyrhynchos/Germany/R2167/2009 | 22–24 | |
| H12N5 | A/Duck/Alberta/60/76 | 21–23 | |
| H16N3 | A/Herring gull/Germany/R2788/06 | 23–25 | |
| NDV-2 | ND/Velogenic | 22–24 |
| Country | Species | No. of Farms | RITA-2 | Subtyping/ Other PCRs | Sequencing |
|---|---|---|---|---|---|
| Egypt | Chicken | 2 | H5, N8 | H5, N8 | H5 HP, N8 [22] |
| Egypt | Turkey | 2 | H5, N8 | H5, N8 | H5 HP, N8 [22] |
| Egypt | Ducks | 1 | H5, N8 | H5, N8 | H5 HP, N8 |
| Egypt | Ducks | 7 | H5, N8 | H5, N8 | H5 HP |
| Egypt | Chicken | 3 | H9, N2 | H9, N2 | H9, N2 [22] |
| Egypt | Chicken | 2 | H5, N1 | H5, N1 | H5, N1 [22] |
| Egypt | Duck | 5 | H5, N8 | H5, N8 | H5 HP |
| Egypt | Chicken | 5 | H5, H9, N8, N2 | H5, H9, N2 | H5 HP [22] |
| Egypt | Chicken | 3 | H5, N2 | H5, N2 | H5 HP, N2 [22] |
| Egypt | Chicken | 2 | H5, H9, N8, N2 | H5, H9, N8, N2 | H5, H9, N8, N2 [10] |
| Egypt | Chicken | 1 | H5, H9, N8, N2, IBV, NDV | H5, H9, N8, N2, IBV, NDV | H5, H9, N8, N2, IBV [10] |
| Egypt | Chicken | 1 | H5, N8, IBV, NDV | H5, N8, IBV, NDV | H5, N8, IBV [10] |
| Bangladesh | Duck | 13 | H4, N6 | H4, N6 | H4, N6 [23] |
Publisher’s Note: MDPI stays neutral with regard to jurisdictional claims in published maps and institutional affiliations. |
© 2022 by the authors. Licensee MDPI, Basel, Switzerland. This article is an open access article distributed under the terms and conditions of the Creative Commons Attribution (CC BY) license (https://creativecommons.org/licenses/by/4.0/).
Share and Cite
Hassan, K.E.; Ahrens, A.K.; Ali, A.; El-Kady, M.F.; Hafez, H.M.; Mettenleiter, T.C.; Beer, M.; Harder, T. Improved Subtyping of Avian Influenza Viruses Using an RT-qPCR-Based Low Density Array: ‘Riems Influenza a Typing Array’, Version 2 (RITA-2). Viruses 2022, 14, 415. https://doi.org/10.3390/v14020415
Hassan KE, Ahrens AK, Ali A, El-Kady MF, Hafez HM, Mettenleiter TC, Beer M, Harder T. Improved Subtyping of Avian Influenza Viruses Using an RT-qPCR-Based Low Density Array: ‘Riems Influenza a Typing Array’, Version 2 (RITA-2). Viruses. 2022; 14(2):415. https://doi.org/10.3390/v14020415
Chicago/Turabian StyleHassan, Kareem E., Ann Kathrin Ahrens, Ahmed Ali, Magdy F. El-Kady, Hafez M. Hafez, Thomas C. Mettenleiter, Martin Beer, and Timm Harder. 2022. "Improved Subtyping of Avian Influenza Viruses Using an RT-qPCR-Based Low Density Array: ‘Riems Influenza a Typing Array’, Version 2 (RITA-2)" Viruses 14, no. 2: 415. https://doi.org/10.3390/v14020415