1. Introduction
Mycoplasma bovis is an important pathogen of cattle which has been associated with a number of clinical conditions in calves and has increasingly been recognised as a contributor to respiratory disease in older cattle and bison, identifying it as an emerging bovine pathogen [
1,
2,
3,
4,
5].
Serological methods such as enzyme linked immunosorbent assays (ELISA) and Western blotting enable the retrospective detection of pathogen specific antibodies in a host serum sample following exposure. A critical element in the development of these methods is the identification of an antigen(s) specific for the organism of interest to which the host generates specific and detectable immune responses. The antigen must be highly conserved among different isolates and strains if the assay is to have broad utility. The identification of suitable antigens for
M. bovis serological studies has proven problematic due to antigenic variation among different isolates. Western blotting studies have identified the variable surface proteins (Vsps) as the immunodominant antigens recognised by the host humoral response during
M. bovis infections [
6,
7,
8]. In addition, it has been demonstrated that the antibody reactivity of three Vsps (VspA, VspB and VspC) was independent of the clinical manifestation, the geographical origin of the
M. bovis isolate, the mode of infection, and the animal history [
8]. The Vsps, or at least some members of the Vsp family, appear to be persistently expressed by
M. bovis during infection and the immunodominant domains are highly conserved among strains and isolates [
8]. However, the genes encoding the major immunological determinants have been shown to be subject to high frequency phase and antigenic variation [
9]. This variation has the potential to adversely affect the reliability of diagnostic assays that utilise Vsp antigens [
10]. Despite these concerns, it is possible that selected motifs of the Vsps could be useful for the development of
M. bovis sero-diagnostic assays for epidemiological studies.
Approximately 80% of the VspA amino acid sequence is composed of two domains of repeated sequence, separated from each other by 22 amino acid blocks. The first block, localised at the N-terminal region, is composed of two distinct motifs, designated R
A1 and R
A2, while the second block, localised at the C-terminal region, contains three repeated motifs, R
A3, R
A4.1, and R
A4.2 [
8]. Homologues of the
vsp gene were detected in 250 field isolates of
M. bovis from France, Germany, Italy, Spain, and Switzerland, and all isolates were reported to contain multiple copies of the sequence encoding the R
A1 motif [
11]. These findings supported the conclusions of a previous study [
8] and provided further evidence that the conserved domains within the Vsp family of proteins of isolates and/or strains could be used to improve
M. bovis serological assays. The 106-amino acid R
A1 motif within VspA contains PGENKT repeat elements and has been shown to be detected by antibodies induced following infection of cattle with
M. bovis [
6,
8,
12,
13], suggesting the motif may be a useful candidate for inclusion in immunological assays. The immunodominant Vsp antigens of
M. bovis can vary greatly both between and within strains and isolates and also exhibit high frequency phase variable expression [
11]. Despite this, the R
A1 motif of VspA has the potential to be a useful antigen for Western blot comparisons as it has been shown to be highly conserved and to elicit antibody responses detectable in the sera of cattle involved in outbreaks of
M. bovis associated disease from geographically diverse regions [
8,
11].
Several studies have reported the use of non-commercial ELISAs to evaluate serological responses of cattle and related species in exposure trials [
14,
15,
16,
17,
18,
19,
20]. Many of these assays used whole cell
M. bovis antigen preparations, which can make comparisons of studies problematic. The potential variability in antigen expression by
M. bovis isolates could adversely affect assay reproducibility and repeatability when antigens are prepared from whole cells [
9].
Consequently, recent studies have attempted to identify antigens that could be over-expressed using recombinant DNA technology [
21,
22,
23,
24]. Of these antigens, only the assay using the MilA antigen [
22] has been evaluated in a large number of field samples and had sensitivity (
Se) and specificity (
Sp) estimates reported [
25]. Commercially available ELISAs with standardised production methods and standardised controls offer a potential solution to the variability between serological assays as all laboratories can access the same technology platform. However, these assays are still dependent on the test antigen(s) being universally expressed by the pathogen of interest. Typically, the details on the antigen(s) used in commercial ELISA are held as proprietary information. Users of these assays must accept the assumption that the population of interest was exposed to a
M. bovis strain(s) that expresses the antigen(s) used in the ELISA.
Currently, there are few commercially available serological assays for the detection of antibodies against
M. bovis. Several studies have reported serological data with respect to
M. bovis using various non-commercial assays, making it difficult to compare studies [
21,
22,
23,
24]. For this reason, the current study has focused on commercially available assays, the BIO K302 and BIO K260, where standardisation of production and quality control processes, combined with general availability, could enable researchers to generate more comparable datasets. Two previous studies have estimated the
Se and
Sp of the BIO K302 assay, with one study also including the BIO K260 assay [
25,
26].
The aim of the current study was to estimate the Se and Sp of two commercially available M. bovis ELISA kits in parallel with Western blotting using panels of bovine reference sera from M. bovis experimental exposure studies from three countries. The capacity of the ELISA kits and Western blotting to detect seroconversion to M. bovis was also evaluated.
2. Materials and Methods
2.1. Mycoplasma Culture and DNA Isolation
The M. bovis type strain PG45 in frozen modified Frey’s broth (MFB) was thawed on ice, streaked onto a modified Frey’s agar plate, and incubated at 37 °C in a 5% CO2 atmosphere for three to five days. A well isolated colony with typical Mycoplasma morphology was excised from the plate and used to inoculate 3 mL of MFB and the broth incubated for 48 h at 37 °C. The cells were recovered by centrifugation at 5500× g for 1 h at room temperature. The supernatant was aspirated, and the cell pellet washed twice with phosphate buffered saline (PBS). Genomic DNA was extracted from the cell pellet using the DNeasy Blood and Tissue Kit (QIAGEN, Hilden, Germany) according to the manufacturer’s instructions, quantified using a Nanodrop® ND-1000 spectrophotometer (Thermo Fisher Scientific, Waltham, MA, USA) and stored at −20 °C until required.
2.2. Amplification and Cloning of the VspA RA1 Motif
The
vspA gene fragment encoding the R
A1 motif [
8] was amplified from
M. bovis genomic DNA. The PCR reaction contained 20 mM Tris-HCl (pH 8.4), 50 mM KCl, 1.5 mM MgCl
2, 0.2 mM dNTPs, 4 μg bovine serum albumin, 1 U Platinum
® Taq DNA polymerase (ThermoFisher Scientific), 8 pmol of each of the oligonucleotide primers
vspA-F1 (5′-GTA GCA GCT AAA TGT GGT GAG ACC-3′) and
vspA-R2 (5′-GTC ATC ATG CGG AAT TCT TGG-3′), and 25 ng of genomic DNA. The PCR cycling conditions utilised were: 94 °C for 3 min; 94 °C for 10 s, 54 °C for 15 s, and 72 °C for 30 s, 35 cycles; 72 °C for 2 min. The PCR amplicons were analysed by agarose gel electrophoresis through 1% (
w/
v) agarose gel at 7 V cm
−1 for 1 h in 1 × TAE buffer (40 mM Tris-HCl pH 7.6, 20 mM acetic acid and 1 mM EDTA) and visualised by GelRed
TM staining and ultraviolet transillumination. The
vspA amplicon was cloned into the pET SUMO™ plasmid vector using the Champion
TM pET-SUMO Protein Expression System (Thermo Fisher Scientific) as described by the manufacturer. The sequence and orientation of the
vspA_R
A1 amplicon in the pET-SUMO vector was confirmed using Big Dye Terminator v3.1 (Thermo Fisher Scientific, Waltham, MA, USA) sequencing according to the manufacturer’s instructions. The sequencing data were analysed using the DNASTAR™ suite of programs (
DNASTAR, Madison, WI, USA).
2.3. Expression of Recombinant Polypeptides
The SUMO vspA_RA1 fusion polypeptide (S-vspA_RA1) and control polypeptide SUMO-CAT were expressed using the plasmids pES_vspA_RA1-9 and pET SUMO/CAT (Thermo Fisher Scientific), respectively. The plasmids were used to transform chemically competent Escherichia coli One Shot® BL21 (DE3) cells (Thermo Fisher Scientific) and express the polypeptide of interest following the manufacturer’s instructions. The bacterial cells were harvested by centrifugation at 5500× g for 10 min at 4 °C. The supernatant was carefully removed and discarded. The cell pellet was stored at −20 °C until required.
The frozen cell pellet was thawed on ice and suspended in 5 mL of cold E. coli Lysis Buffer® (50 mM KH2PO4, pH 7.8, 400 mM NaCl, 100 mM KCl, 10% glycerol, 0.5% Triton X-100, 10 mM imidazole) with gentle agitation. Lysozyme was added to a final concentration of 250 μg mL−1 and benzonase nuclease to a final concentration of 5 U mL−1, and the mixture incubated at room temperature for 30 min with vigorous shaking. Following three freeze/thaw cycles, extracts were clarified at 5500× g for 10 min at 4 °C. The supernatant was carefully aspirated, and the polypeptide of interest purified using the Ni-NTA Spin-Kit (QIAGEN) according to the manufacturer’s instructions and stored at −20 °C until required.
2.4. SDS-PAGE and Western Blotting
Protein samples of interest were prepared for SDS-PAGE analysis by mixing with an equal volume of sample reducing buffer (62.5 mM Tris-HCl pH 6.8, 10% glycerol, 2% (w/v) SDS, 6 mM dithiothreitol, 0.05% (w/v) bromophenol blue). The sample was gently vortexed, heated at 95 °C for 5 min, and then briefly centrifuged before being loaded onto the SDS-polyacrylamide gel. Electrophoresis was performed using a 0.75 mm thick 4% polyacrylamide stacking/10% polyacrylamide resolving gel in a Mini-PROTEAN™ Tetra Cell Electrophoresis Module (Bio-Rad Laboratories, Hercules, CA, USA) according to the manufacturer’s instructions. Following electrophoresis, the resolved polypeptides were transferred onto a nitrocellulose membrane for Western blot analyses using a mini-blot transfer apparatus (Bio-Rad Laboratories) according to the manufacturer’s instructions. The nitrocellulose membranes were blocked for 1 h at room temperature whilst shaking in blocking TBST buffer (20 mM Tris, 150 mM NaCl, 0.1% v/v Tween 20) containing 5% (w/v) skimmed milk powder (TBST-B). Primary antibodies were diluted in TBST-B and incubated overnight, with gentle agitation, at 4 °C, and the membranes washed three times in cold TBST for 5 min. Membranes were then incubated for 1 h at room temperature with shaking in the secondary antibody in TBST-B. The membranes were subsequently washed three times with cold TBST for 5 min. Antibody binding was detected using chemiluminescence (Pierce ECL Plus Western Blotting Substrate, Thermo Fisher Scientific) and radiographic film using a 10 min exposure time.
2.5. Antibodies and Bovine Sera Used in This Study
2.5.1. Monoclonal Antibodies:
The reactivity of the expressed S-vspA_R
A1 was assessed with monoclonal antibodies that were known to bind to various
M. bovis Vsp proteins (
Supplemental file Table S1).
2.5.2. Canadian Cattle Sera
Bovine sera from Canada were included in the study. These sera were sourced from six to eight month old beef calves (
n = 10) from a farm in southern Saskatchewan as part of a
M. bovis experimental exposure study [
17]. The immunoreactivity of the Canadian serum samples has previously been reported as negative or positive (further classified as having low or high reactivity) for the
M. bovis antibody using a whole cell ELISA (
Table 1) [
17]. Samples were collected immediately prior to
M. bovis exposure (Day 0) and 68 days after exposure (Day 68). Nine Day 68 samples were available for the
Se analyses and five Day 0 samples for the
Sp analyses. Paired serum samples from four animals were used to evaluate seroconversion with the two commercial ELISAs and the Western blot assay.
2.5.3. English Cattle Sera
Bovine serum samples from the Animal and Plant Health Agency (APHA) in England were also included in this study. The sera were collected from calves (
n = 5) sourced from a farm reported to be free from pathogens commonly associated with bovine respiratory disease, including mycoplasmas. The calves were a dairy-cross breed and were five to seven weeks of age. The calves were challenged with a known pathogenic strain of
M. bovis. Most of the samples included in the current study were from two animals experimentally exposed to
M. bovis and one animal that remained unexposed. Blood samples were collected from the calves prior to exposure (Day 0) and on Day 7, Day 14, Day 21, and Day 28 after exposure. Prior to the current study, the Day 0 and Day 28 samples had been tested using an in-house whole cell ELISA (
Table 2) [
27]. In addition, serum samples from two other calves were included in the current analyses: a ‘positive control’ and a ‘cut-off control’ used by the APHA for the interpretation of the in-house whole cell
M. bovis ELISA. The Day 28 samples from the two exposed calves, positive control, and cut-off control samples (used to define the minimum reactivity of a positive sample) were included in the
Se analyses of the two commercial ELISAs and the Western blot assay (
n = 4). The Day 0 samples from the exposed and unexposed calves and the Day 28 sample from the unexposed calf were used for the
Sp analyses (
n = 4). The sequentially collected samples from the exposed and unexposed animals were used to evaluate the timing of seroconversion to
M. bovis in the Western blot assay, while the Day 0 and Day 28 paired samples from the two exposed animals were used in the seroconversion analysis of the three tests compared in this study.
2.5.4. Australian Cattle Sera
Paired serum samples from 35 Australian calves collected during an
M. bovis exposure trial (five unexposed and 30 exposed) [
22], were used in the current study. The sera were obtained from male Friesian-cross calves which were free of
M. bovis prior to experimental infection, as determined by culture and quantitative real-time PCR of nasal and conjunctival swabs [
28]. The serum samples were collected on the day of
M. bovis exposure (Day 0) and 24 days after exposure (Day 24) [
22]. After collection, the serum samples were analysed for
M. bovis-specific antibodies using the MilA-based ELISA and designated as either positive or negative (
Table 3) [
22]. The Day 24 sera from the 30 exposed calves were used for the
Se analyses of the two commercial ELISAs and the Western blot assay. All 35 Day 0 sera and the Day 24 sera from the five unexposed calves were used for the
Sp analyses (
n = 40). The paired sera from the 30 exposed calves were used in the seroconversion analyses of the three tests compared in this study.
2.5.5. Control Sera from Commercial Serological ELISA Assays
A total of 18 bovine control sera from commercially available M. bovis serological ELISA kits (BIO K302 and BIO K260) and the pentavalent bovine respiratory pathogen serological ELISA kit (BIO K284) were used in this study (Bio-X Diagnostics, Jemelle, Belgium). Positive and negative control sera were available from three batches of the BIO K302 assay (Batch numbers: MYC14C04, MYC13K26, MYC13J16), and four batches of the BIO K260 assay (Batch numbers: SMYC14C04, SMYC13K26, SMYC13J16, SMYC09I28). Positive control sera were available for four batches of the BIO K284 assay (Batch numbers: IBRPM12F04, IBRPM12K08, IBRPM12F28, IBRPM09L01).
2.6. Commercial ELISA Assays
The bovine serum samples used in this study were tested using the BIO K302 and BIO K260 ELISAs according to the manufacturer’s instructions (Bio-X Diagnostics). The ELISA validation and interpretation were performed as recommended by the manufacturer. Briefly, the BIO K302 ELISA was used to classify samples as either negative or positive for antibodies specific for an M. bovis recombinant antigen, while the BIO K260 ELISA was used to categorise samples semi-quantitatively (0, +, ++, +++, ++++, or +++++) with respect to the concentration of antibodies specific for an M. bovis recombinant antigen. In the current study, the B260 ELISA results are reported as 0, 1, 2, 3, 4, and 5, which correspond to the 0, +, ++, +++, ++++, and +++++ categories, respectively. In some analyses, the results from the BIO K260 were dichotomised, with “0” deemed negative, and samples categorised as “1” or higher deemed positive. The identity of the antigen(s) used in these indirect ELISAs is held as propriety knowledge, but the manufacturer discloses that it is a recombinant antigen expressed in E. coli.
2.7. Western Blot Analyses with the S-vspA_RA1 Polypeptide
The S-vspA_RA1 polypeptide was transferred onto a nitrocellulose membrane and blocked as described above. The membrane was cut into 3 mm strips. Each strip was probed, washed, and developed with the bovine serum sample of interest diluted 1:100 and the secondary anti-bovine IgG-HRP antibody diluted 1:20,000, as described above. Samples which had no observable reactivity on the Western blot were deemed negative. Samples with detectable reactivity on the Western blot were deemed positive.
2.8. Detection of Seroconversion to M. bovis
To assess the capacity of each assay to detect a change in serological status with respect to M. bovis, the following criteria were applied. Only animals with a negative test result for their Day 0 sample were included in the analyses for each assay. For the BIO K302 assay, if the post-exposure sample was deemed to be positive according to the manufacturer’s instructions, the animal was considered to have seroconverted. For the BIO K260 assay, if the post-exposure sample was categorised as “++” or higher according to the manufacturer’s instructions, the animal was considered to have seroconverted. If the post-exposure sample generated an observable reaction, it was deemed to be positive and the animal was considered to have seroconverted.
2.9. Onset of Detectable Antibodies to M. bovis Post-Exposure
The S-vsp_RA1 Western blot assay was used to evaluate the onset of a detectable serum antibody response using the sera from the English cattle. The samples collected from each animal on Day 0, Day 7, Day 14, Day 21, and Day 28 after exposure to M. bovis were used in this analysis. The samples were deemed negative or positive as described above.
2.10. Statistical Methods
All data were managed using the statistical package Stata/SE 12.1® (Statacorp, College Station, TX, USA). Test Se and Sp and associated 95% confidence intervals (CI) were estimated, adjusting for clustering by source (Canada, England and Australia). As the control samples were sourced from the commercial ELISA kits, how they were generated is unknown, and it was hypothesised that inclusion of these samples was likely to bias the Se and Sp estimates. Therefore, the Se and Sp estimates were calculated following the removal of the Bio-X Diagnostics control samples from the datasets. The proportions of animals that were initially seronegative, and that were exposed and then seroconverted using the BIO K302 ELISA, BIO K260 ELISA, and the Western blot assay were estimated, again adjusting for clustering by source (Canada, England, and Australia).
4. Discussion
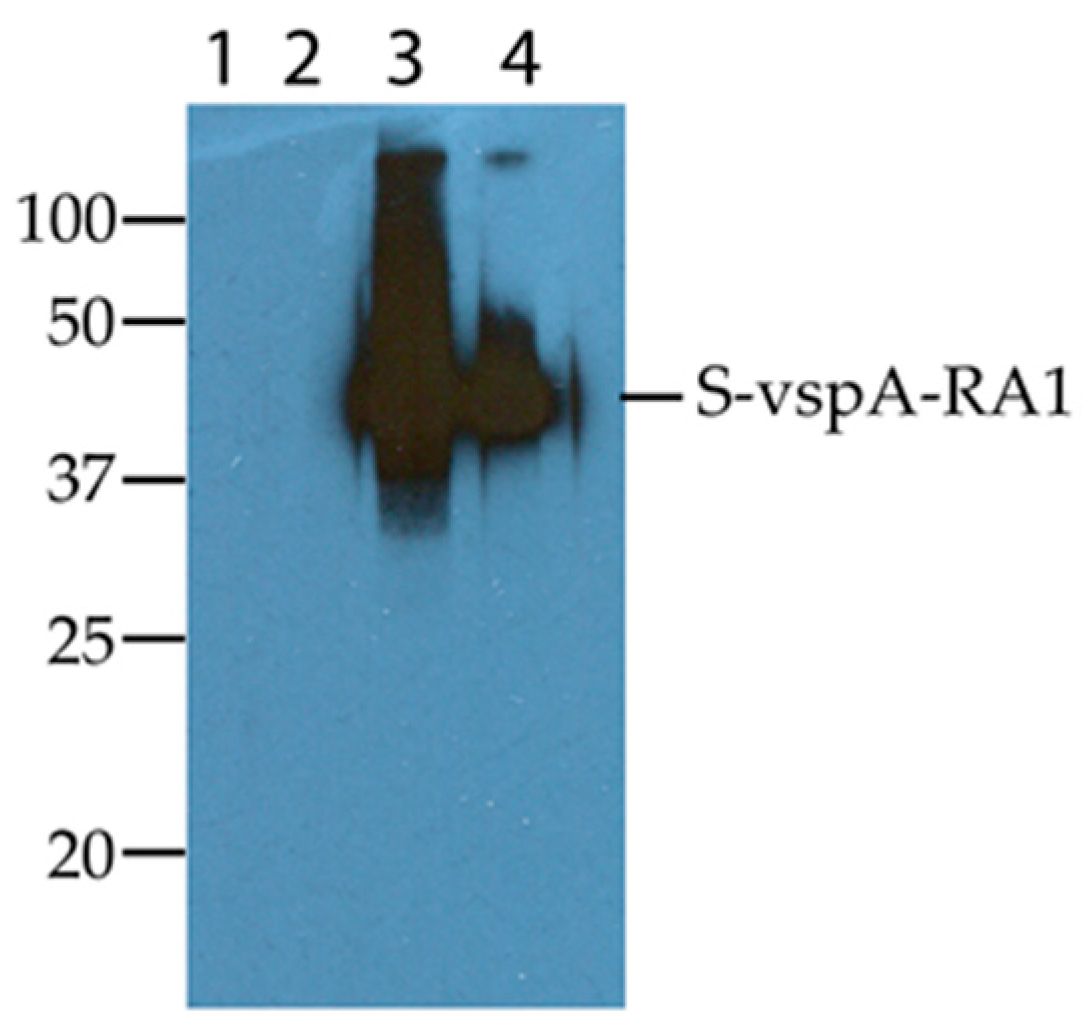
The S-vspA_R
A1 polypeptide expressed in this study migrated with an estimated molecular mass of 35 kDa in SDS-PAGE, even though it had a predicted molecular mass of 25 kDa. It has been reported that the Vsp antigens exhibit abnormal migration in SDS-PAGE gels [
9]. The presence of a hexahistidine tag and repetitive amino acid motifs are likely to have resulted in the aberrant migration of the S-vspA_R
A1 polypeptide using SDS-PAGE [
31]. Importantly, the S-vspA_R
A1 polypeptide was reactive with monoclonal antibodies specific for VspA, confirming that the presence of the SUMO fusion partner did not affect the antigenicity of the motif (
Figure 1).
One potential source of non-specific reactivity in the Western blot assay described in this study was retention of the SUMO fusion partner in the S-vspA_R
A1 polypeptide. To address this issue, the removal of the SUMO fusion partner was evaluated; however, this resulted in unworkable yields of the vspA_R
A1 polypeptide (data not shown). Consequently, selected samples were analysed by Western blotting using the SUMO-CAT (
Figure S1,
Table 3 and
Table 4). The observed reactivity of the samples was considered to be against the vspA_R
A1 and CAT polypeptides and not the SUMO fusion partner for two reasons. Firstly, the sample reactivities (positive/negative) were not identical as would be expected if the antibodies were binding to the SUMO fusion partner, which was the common element in each assay. Secondly, analysis of the purified SUMO-CAT by Western blotting with an anti-hexa-histidine monoclonal antibody (
Figure S1j, Lane 1), suggested that the polypeptide preparation contained a second smaller polypeptide considered to be unfused SUMO. While the proportion of the free SUMO was low, none of the reactive cattle serum or control samples had any detectable reactivity to this polypeptide (
Figure S1). These results suggest that the observed reactivities of the cattle sera were not with the SUMO fusion partner and supported the use of S-vspA_R
A1 as the antigen in the Western blot assay to evaluate
M. bovis exposure status.
Of the sera collected from animals after exposure to
M. bovis, all the Canadian and English sera were reactive with S-vspA_R
A1 in Western blot assays (
Table 1 and
Table 2). In contrast, the post-exposure sera from the Australian cattle were less frequently reactive in the Western blot assay, with 60% (
n = 18) testing positive (
Table 3). There are several possible reasons why the post-infection sera sourced from Australia showed reduced reactivity with the S-vspA_R
A1 compared to those sourced from England and Canada.
The choice of
M. bovis strains used in the three exposure studies may underlie the observed differences in these results. The panels of sera were generated in three geographically separate countries with different strains of
M. bovis. There is currently limited information available about the immunogenicity of the
M. bovis strain 3683 used in the Australian study [
22], although a previous study has demonstrated it has the capacity to infect and cause disease in exposed calves [
28]. Recently, the genomes of 82 Australian strains of
M. bovis were analysed [
32]. The genomic diversity between
M. bovis strains was reported to be low and the strains examined had fewer
vsp genes, including
vspA, compared to the PG45
M. bovis reference strain [
32]. However, as
M. bovis strain 3683 was not included in the study, the frequency of the
vsp genes in this strain remains to be determined. The Western blot results of the current study strongly suggest the 3683 strain encodes and expresses VspA or a related polypeptide which includes the R
A1 motif. If the
M. bovis strain 3683 strain expresses the R
A1 motif at low levels or lacks VspG, VspH, and VspO, all of which can contain multiple repeats of the PGENKT amino acid domain [
9], or expresses these antigens at reduced levels, then antibodies that react with the R
A1 motif could be less abundant in the sera of exposed cattle or take longer to develop, thus explaining why fewer of the Australian animals were seropositive after exposure (
Table 3).
The complexity of
M. bovis serology is exemplified by the Australian animals APCAH7, APCAH8, and APCAH18, as the Day 0 samples for these animals tested negative in all three assays (
Table 3). In the MilA and the BIO K260 ELISAs, the Day 24 samples were also negative (
Table 3). However, the Day 24 samples for these animals were all positive by Western blotting and APCAH8 was also positive using the BIO K302 ELISA (
Table 3). These results suggest that the likelihood of an animal testing positive after
M. bovis exposure may be influenced by the timing of the immune response to some antigens. Of the three groups of animals analysed in this study, the 24 day interval between exposure and the final sample collection for the Australian group was the shortest, compared to 28 days and 68 days for the English and Canadian samples, respectively.
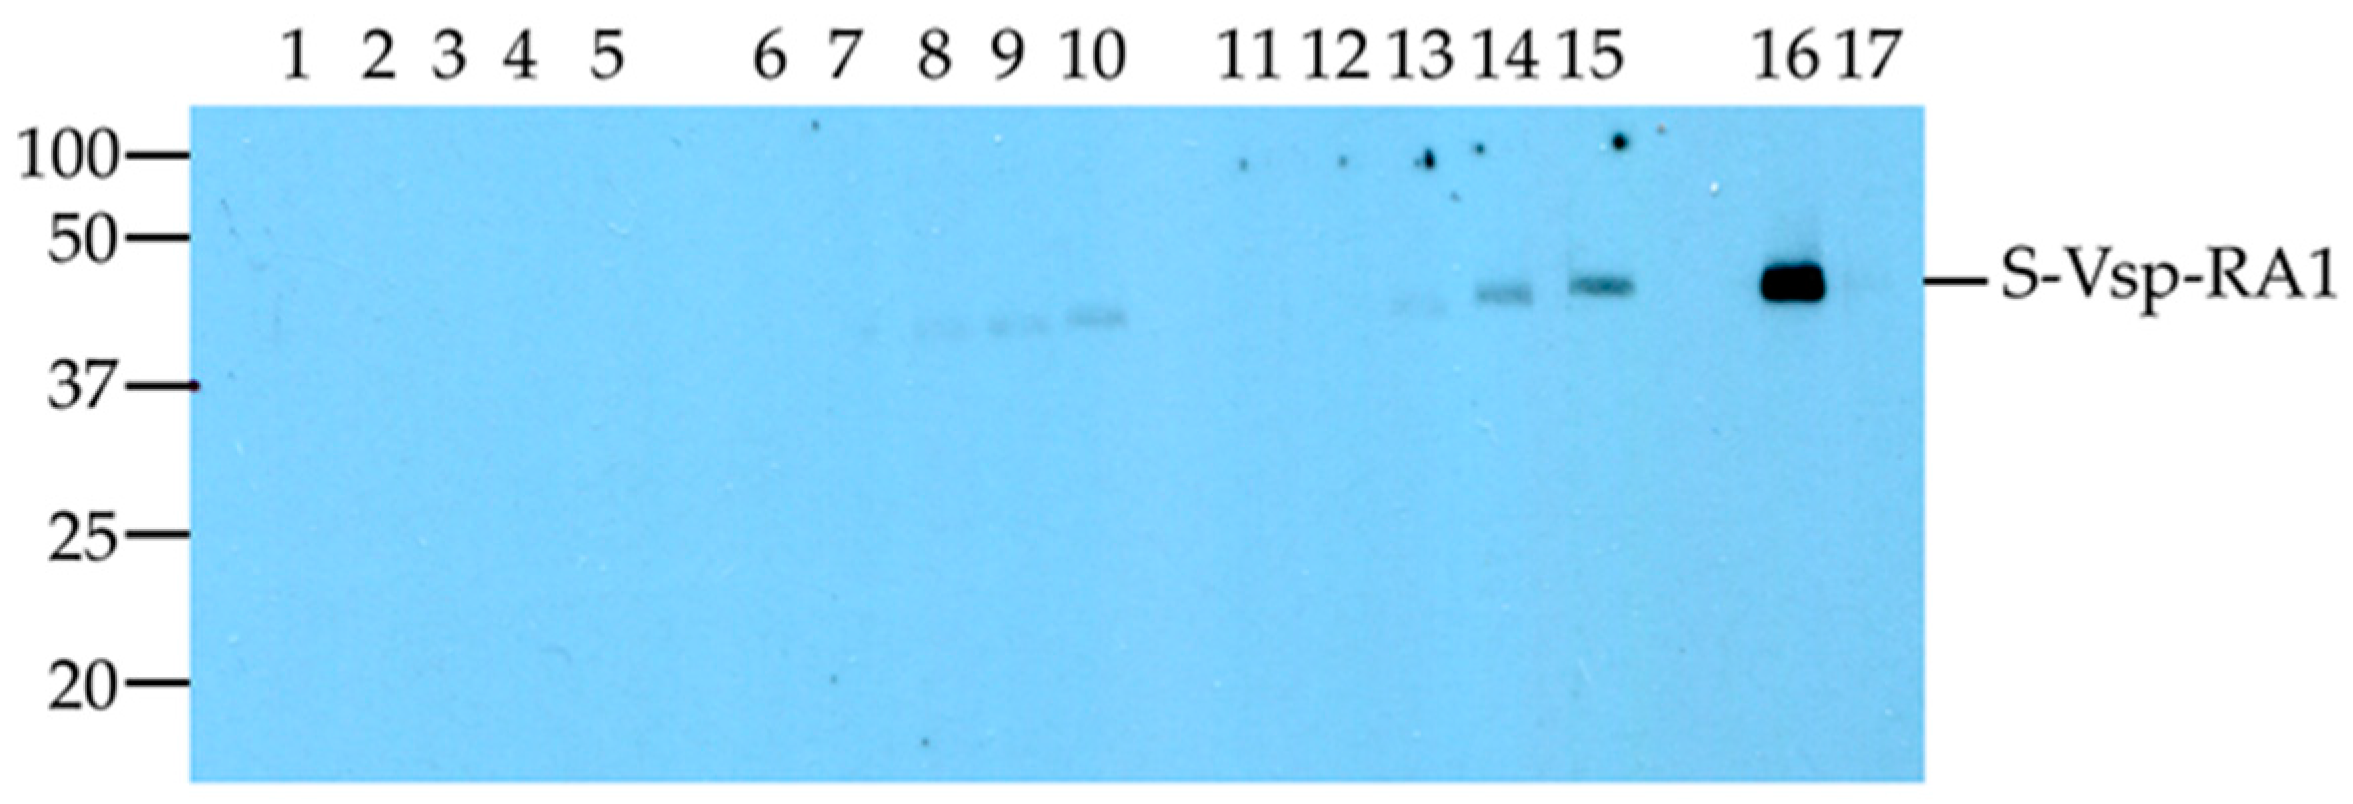
However, in the current study, specific antibodies to the R
A1 motif were detected as early as Day 14 post exposure using the Western blot assay probed with the samples from the English cattle (
Figure 2). Importantly, in both animals exposed to
M. bovis, the level of antibody increased over time, suggesting that the reaction detected by the Western blot was specific to the R
A1 motif. The detection of
M. bovis-specific IgG at Day 14 is consistent with a previous study which detected IgG 10 to 14 days after experimental exposure [
33]. Other reports have suggested that specific antibody responses can be detected 14 to 28 days after an invasive infection [
21,
34]. Animal factors, such as genetic background and age, may also have influenced when the calves used in these exposure studies developed detectable antibodies to the antigens used in each assay.
In the current study, the
Se estimates for the two commercial serological assays were poor (
Table 5). A previous report also estimated the
Se and
Sp of the BIO K302 (32%, 95% CI: 22–54% and 95%, 95% CI: 83–99%) and BIO K260 (13%, 95% CI: 51–30% and 100% CI: 77–96%) assays [
25]. These estimates generally agree with the crude
Se and
Sp estimates for the Australian samples in the current study, a finding that was not unexpected as there is some overlap between the samples used (
Table 5). The combined
Se estimates for the three populations in the current study were very imprecise, when adjusted for clustering, as evidenced by the wide 95% CI (
Table 5), and the different performances in each population (
Table 5). However, the small number of samples from Canada and England prevented further investigation of this observation. Evaluation of the assays with a larger number of samples from these and other geographic regions will be required to fully understand this aspect of the performance of these tests.
Another study estimated the median
Se and
Sp of the BIO K302 ELISA to be 60% (38–96 95% Posterior Credibility Interval) and 97% (94–100 95% PCI), respectively, using the manufacturer’s recommended cut-off point [
26]. These results suggest the commercial ELISA kits have good
Sp and are unlikely to yield false positives. The authors of the study suggested increasing the manufacturer’s recommended cut-off point for the BIO K302 ELISA to reduce the likelihood of false positives [
26]. The influence of this suggestion on the
Se and
Sp estimates in the current study was not investigated because of the smaller sample size.
Test
Se was low for all three methods assessed in this study. Several post-exposure sera from Australia yielded negative results across all three methods, with 63% (
n = 19), 87% (
n = 26), and 40% (
n = 12) of samples yielding ‘false negative’ results in the BIO K302 ELISA, the BIO K260 ELISA, and the Western blot assay, respectively (
Table 3). In addition, two of the four English post-exposure sera and the cut-off control yielded ‘false negative’ results in the BIO K302 and BIO K260 ELISAs (
Table 2), while ‘false negative’ results were also seen with the Canadian post-exposure samples using the BIO K302 (
n = 2) and BIO K260 (
n = 3) ELISAs (
Table 1). The Canadian post-exposure sera that yielded negative ELISA results were classified as low sero-converters to
M. bovis using an in-house ELISA [
17].
The usefulness of the BIO K302, BIO K260, and Western blot assays for the detection of seroconversion using paired sera samples from animals was also assessed (
Table 6). In the current study, sero-conversion was detected in 35% and 8% of paired animal sera using the BIO K302 and BIO K260 ELISAs, respectively (
Table 6). These low levels of seroconversion were unexpected, as the BIO K260 ELISA is specifically marketed to detect seroconversion. Similarly, although the BIO K302 is not marketed to detect seroconversion, it would be expected that a sample collected from an animal following experimental exposure to
M. bovis would yield a positive result in this assay. The low level of seroconversion detected in the current study was largely a result of a high proportion of Australian post-exposure samples failing to exceed the cut-offs assigned by the manufacturer of the BIO K302 and BIO K260 ELISAs (
Table 3). However, only 50% of the samples from the Canadian (
n = 4) and English (
n = 2) animals from which paired sera were available were considered to have seroconverted post-exposure, so the source of samples and strain used for infection would not appear to be the sole explanation for these results. The Western blot assay performed considerably better for the detection of seroconversion, with 61% of exposed animals deemed to have seroconverted. As with the other assays, this result was strongly influenced by the Australian samples. The Western blot would not be suitable for testing large numbers of samples, but could be useful for testing a low number of samples such as in experimental trials or testing high value animals such as breeding bulls to establish or maintain
M. bovis-free herds.
The results of this study highlight the difficulty of developing a serological assay that can be generally applied in all geographic regions for
M. bovis serology. It has been proposed that a novel ELISA assay using the recently identified
M. bovis antigen, MilA, could address this issue [
22]. In the context of a recent study [
32], which reported a reduction in the number of
vsp genes in some Australian isolates examined, the next stage in the development of the MilA ELISA will be testing sera from cattle exposed to
M. bovis strains sourced from different geographical regions. Similarly, the pyruvate dehydrogenase E1 component beta subunit has been identified as a promising
M. bovis ELISA antigen, that when used in an ELISA, detected a higher number of positive serum samples compared to a commercial ELISA (
Mycoplasma bovis Antibody Test Kit, BioVet, Saint-Hyacinthe, Canada) [
24]. The panel of bovine sera used to compare the assays was from field samples and while some animals were reported to be clinically affected by
M. bovis, the lack of knowledge of the true exposure status to the pathogen makes it difficult to assess the true performance of this assay [
24]. The development of a competitive ELISA for
M. bovis serology, based on the P48 lipoprotein, has also been reported [
23]. The P48 ELISA detected higher numbers of serologically positive cattle compared to two commercially available ELISAs, the BioVet assay and an undisclosed Bio-X Diagnostics assay. As the relative performance of the assays was evaluated using the number of positives detected in field samples rather than
Se and
Sp estimations, true assay performance is difficult to assess. In light of these studies, the application of any serological test for
M. bovis is likely to require some knowledge of antigen genomics to support the use of a specific antigen in any assay. Information on the
M. bovis antigenic repertoire for the region of interest could also be used to modify assay components, including multiple recombinant antigens, to match the circulating
M. bovis strains and improve assay performance.
As the manufacturer of the commercial ELISAs evaluated in this study holds the identity of the recombinant antigen as proprietary knowledge, it is not possible to specifically evaluate the utility of this antigen in a geographically diverse range of M. bovis strains. The reactivity of the Canadian and English samples suggests some utility in their application, but this is less evident when the Australian samples are also included. If the manufacturers of M. bovis serological assays wish to hold the assay components as proprietary knowledge, then they should also consider providing some additional support to potential users of these assays. This could include providing reagents or services to examine the levels of expression of the target antigen in M. bovis isolates from the region of interest to ensure some degree of confidence in the applicability of the assay and the validity of results. In the absence of this type of supporting information, potential users should carefully consider how the assay is used.
A recognised limitation of the current study is that samples collected from experimentally exposed animals are unsuitable for estimating
Se and
Sp of diagnostic assays due to a lack of independence of observations and variation in the immunological responses of experimentally infected animals compared to naturally infected animals [
35]. The higher doses of
M. bovis that calves may be exposed to in experimental infection may inflate the
Se estimate over what might be seen in the field, and the absence of infection with related commensal mycoplasma species in experimental animals may inflate the
Sp estimate. While the current study technically violates these ideal conditions, it has utilised samples from experimentally exposed animals from independent exposure experiments with several differing parameters (
M. bovis strain, cattle age, and interval of sample collection), albeit in low numbers in two experiments. Consequently, the panel of sera may provide a more representative assessment of assay performance compared to sera sourced from a single exposure study. Despite this, the next stage in the assessment of these serological assays would be to estimate the
Se and
Sp using a panel of serum samples from validated field cases of
M. bovis infection, when such a panel becomes available.

 ,
, 


