Risk Assessment of China’s Water-Saving Contract Projects
by
 , , ,
, , ,
Qian Li
1,2, 
Ziheng Shangguan
3,*,
Mark Yaolin Wang
4,5,
Dengcai Yan
3,
Ruizhi Zhai
6 and
Chuanhao Wen
1,7,* 1
Research Center for Economy of Upper Reaches of the Yangtze River, Chongqing Technology and Business University, Chongqing 400067, China
2
School of Water Conservancy, North China University of Water Resources and Electric Power, Zhengzhou 450011, China
3
School of Public Administration, Hohai University, Nanjing 211100, China
4
School of Geography, The University of Melbourne, Melbourne, VIC 3010, Australia
5
Asia Institute, The University of Melbourne, Melbourne, VIC 3010, Australia
6
School of Mechanics and Materials, Hohai University, Nanjing 211100, China
7
School of Economics, Yunnan University, Kunming 650091, China
*
Authors to whom correspondence should be addressed.
Water 2020, 12(10), 2689; https://doi.org/10.3390/w12102689
Submission received: 31 August 2020
/
Revised: 22 September 2020
/
Accepted: 24 September 2020
/
Published: 25 September 2020
(This article belongs to the Special Issue Water Resources Management Models for Policy Assessment)
Abstract
:In order to alleviate the problem of water shortage, the Ministry of Water Resources of China proposed a Water-Saving Contract (WSC) project management model in 2014, which is similar to the Energy Performance Contract (EPC). In this context, this research aims to explore the applicability of China’s WSC projects by risk assessment, and to help promote WSC projects in China. Different from traditional risk assessment, this paper takes into account the uncertainty of the EPC project’s risks, and adopts the multielement connection degree set pair analysis to evaluate both the level and trend of the risks. The results show: (1) the overall risk of China’s WSC projects is low, so WSC projects are very suitable for promotion in China. However, the overall risk shows a trend of decelerated ascent, which shows that there are some potential high-risk factors in China’s WSC projects; (2) among the many risks of the WSC projects, audit risk, financing risk, and payment risk are at a high-risk level; market competition risk is at a medium-risk level; the remaining risks are at a low-risk level; (3) among the medium and high risks, audit risk, financing risk, and market competition risk have a trend of accelerated ascent, while payment risk has a trend of decelerated decline; in low risks, inflation risk has a trend of decelerated ascent, while the remaining risks have a trend of accelerated decline.
1. Introduction
Since the reform and opening up, China’s population has continued to grow. The process of industrialization and urbanization has accelerated, which has led to a gradual increase in water consumption. With global warming and the pollution of water resources caused by industrial development, the problem of insufficient regional water supply in China has become increasingly prominent. Insufficient water resource carrying capacity has become the main constraint in China’s sustainable development [1]. Normally, the way to solve water shortage can be divided into the increasing water supply and saving water. For a long time, China has been relying on the construction of a transbasin water diversion project to solve the problem of insufficient water supply in the north, which is a typical supply-oriented solution while throttling has been relatively ignored [2]. Therefore, in order to achieve the purpose of saving water, the Ministry of Water Resources of China (MWRC) began to vigorously implement Water-Saving Contract (WSC) projects in 2016 [3]. At present, China’s WSC project is still in the initial stage, and it faces many uncertain risks. In order to promote the development of the WSC projects in China, it is of great significance to assess the risks of the projects and formulate relevant policies to reduce them.
1.1. Profit Model of the WSC Project and Its Stakeholders
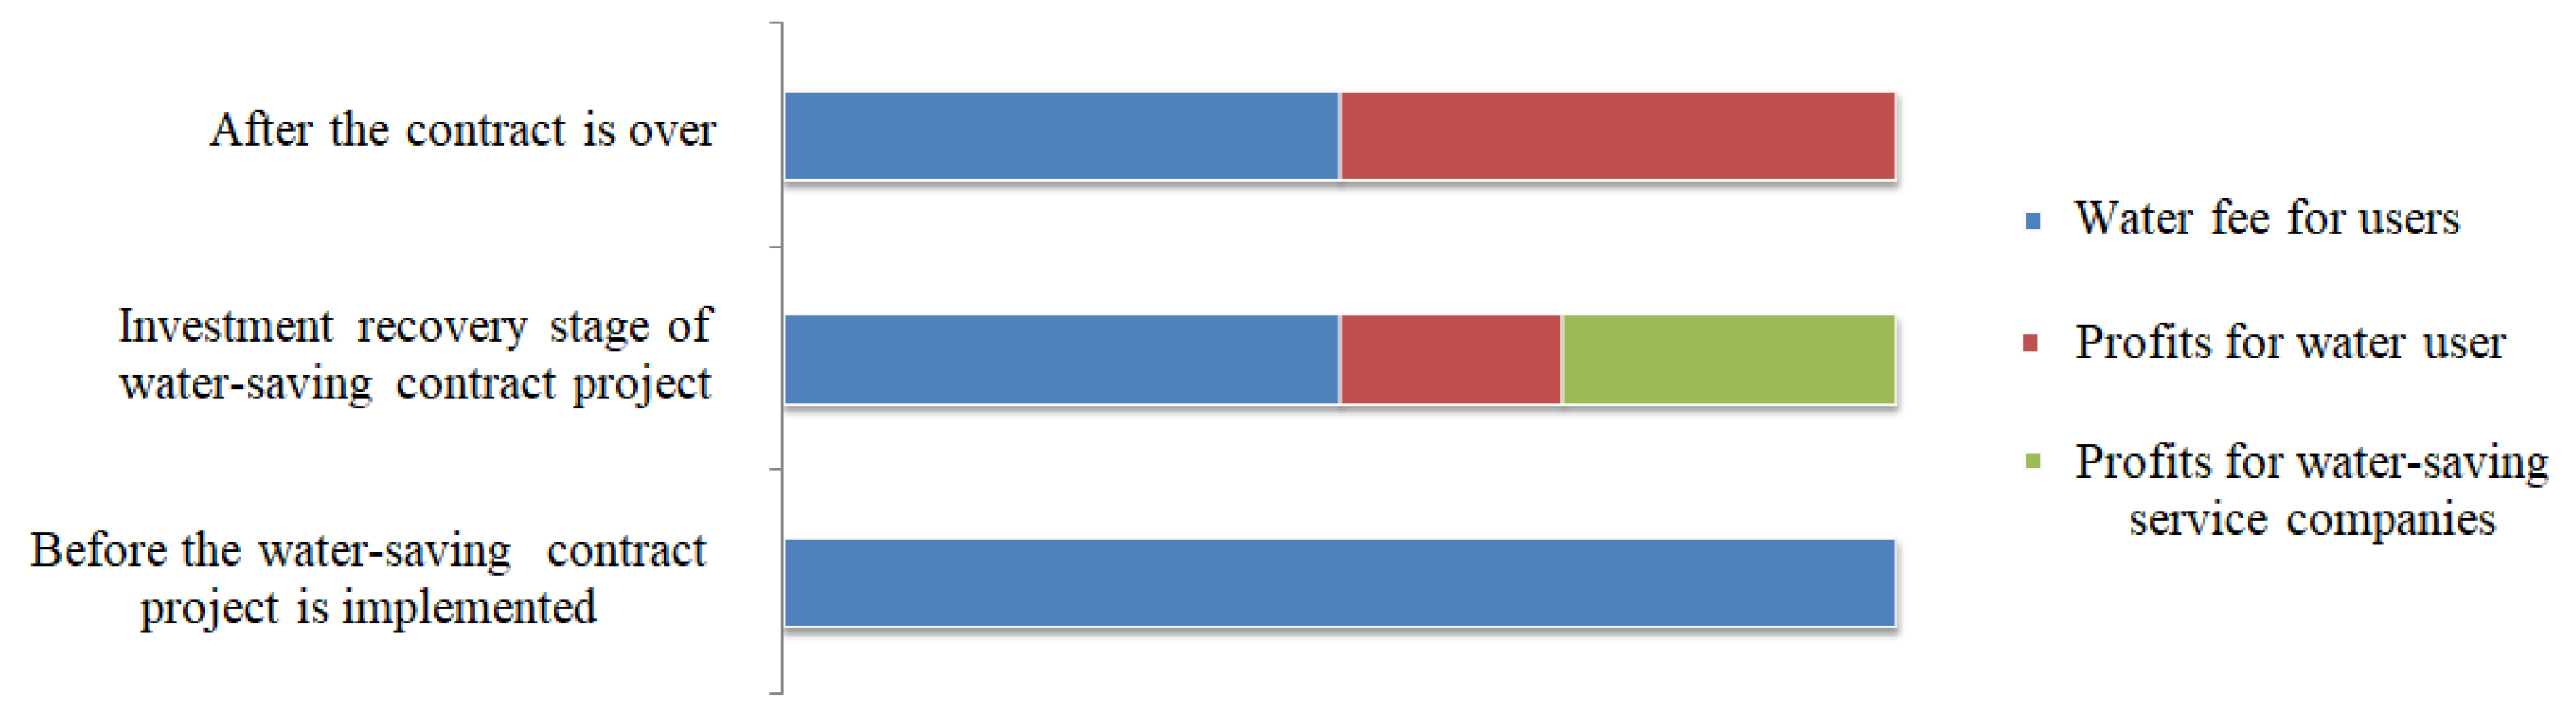
The WSC contains a specific water-saving target which is beneficial to the water user. By providing advanced and applicable water-saving technologies, the water-saving service operators carry out a technological transformation, establish long-term management mechanisms, and eventually pay the full cost by water-saving benefits, while water users can also share the benefits. This is a market-based water-saving management model [4]. The profit model is shown in Figure 1. The project involves three subjects, namely: the government, water-saving service operators, and water users. The government mainly assumes the role of policy guidance. Water-saving service operators provide services to water users through technological innovation to alleviate the pressure on water consumption. Water users are the ultimate beneficiaries. Here, we mainly discuss the risks encountered by water-saving service operators.
1.2. Enlightenment of the Energy Performance Contract’s (EPC) Risk Assessment to WSC
At present, there are few studies on the risk assessment of the WSC project, and there is no uniform analytical framework and research method for systematically assessing the risks. However, in essence, the WSC proposed by the MWRC is similar to the Energy Performance Contract (EPC); therefore, when analyzing the risks of China’s WSC projects, the research results of EPC projects can be used for reference.
In the research of the EPC project, Mills et al. identified the inherent risks of EPC projects and divided them into five categories, namely, economic risks, environmental risks, technical risks, operational risks, and measurement and verification (M&V) risks [5]. On the basis of Mills et al.’s research, Lee et al. added financial risk, project design risk, and installation risk to the research of risk assessment in the EPC project, and identified the key risks of EPC projects through questionnaires. They believe that the key risks to energy service companies are possible payment defaults of hosts after installation, the uncertainty of baseline measurement, and the increase in installation costs in EPC projects [6]. Hu and Zhou further refined the risks of the EPC project in China. They considered that EPC project risks include political and legal risks, market risks, technical risks, management risks, financial risks, project quality risks, and customer risks [7]. Duan et al. constructed a life cycle analysis framework of EPC projects containing four stages, namely the contract signing stage, investment stage, implementation stage, and benefit-sharing stage [8]. Based on the framework proposed by Duan, Wu et al. used an improved analytic hierarchy process (AHP) to determine the weight of various risk indicators of the EPC project in China, and established a risk evaluation model using a fuzzy comprehensive evaluation method [9]; Huang et al. combined AHP and gray evaluation theory to construct a gray multilayer evaluation model of the EPC project’s risks, and analyzed the high-risk factors of China’s EPC project [10]. Garbuzova-Schlifter and Madlener systematically studied the common risk factors and causes of risk associated with EPC projects executed in three Russian sectors: (1) industrial; (2) housing and communal services; (3) public. They also conducted a quantitative assessment of risks based on an AHP approach, and proposed a widely applicable risk management framework for Russian EPC projects [11]. Valipour et al. divided EPC project risks in Iran into six categories: design risk, market risk, political risk, environmental risk, construction risk, and political risk, and assessed the level and occurrence probability of the EPC project’s risks using Analytic Network Process (ANP) method. Their results indicate that political risk and design risk are the most significant types of risk in Iran’s EPC projects [12].
1.3. The Risk Characteristics of the WSC Project and the Determination of Its Research Methods
The study of EPC projects provides effective analysis frameworks and research methods for the risk assessment of the WSC projects However, unlike EPC projects, WSC projects have the characteristics of the long project cycle, relatively low return on investment, and weak liquidity. These characteristics may cause the risk level of the WSC projects to change significantly during the whole life cycle of the project [4]. In addition, as WSC projects are still in their infancy in China, the level of the risk is prone to change under the influence of national development strategy, overall economic level, management technique, and market resource allocation [13]. Therefore, simply analyzing the level of risk can no longer meet the needs of risk assessment in the WSC project, and the trend of risk should also be analyzed.
In the previous studies on EPC projects, the trend of risk was hardly considered, and its uncertainty makes it difficult to assess. Set pair analysis (SPA) has strong adaptability in dealing with the interaction between certainty and uncertainty in the system [14]. Cui et al. built an evaluation model to quantitatively evaluate and diagnose the carrying capacity of regional water resources under uncertain conditions by applying set pair analysis [15]. Gao et al. put forward a model based on set pair analysis about information risk evaluation. This model can not only divide the extent of the information risk, but it describes the trend of the information risk. It could describe the information risk from static and dynamic [16]. Zheng et al. used the set pair analysis method to analyze the safety of the tailing pond. Through set pair analysis, the development trend of the safety status of the tailings pond can be judged [17].
Based on the studies above, this article intends to use a literature analytic method to determine the risks existing in the WSC project’s life cycle which was proposed by Duan [8], and uses multielement connection number set pair analysis to evaluate the level and trend of the risks. Finally, suggestions are made based on the characteristics of various risks to control and reduce them.
2. Materials and Methods
2.1. Risk Identification in Water-Saving Contract Projects
This article divides the life cycle of the WSC project into four stages according to Duan et al. [8]. The four stages are the contract signing stage, investment stage, implementation stage, and benefit-sharing stage. Then, the risks in each stage of the WSC project were sorted out through a literature review, as shown in Table 1.
- (1)
- Contract signing stage
The contract signing stage includes the process of water audit, feasibility study, and contract signing. In the process of water consumption audit, if the water-saving service operator cannot accurately obtain the actual water consumption of the water user, the payback period will be lengthened [18]. The focus of the feasibility study is to evaluate and demonstrate the water-saving technique. If the technique obtained by water-saving service operators fails to reach the target, it will cause economic losses and waste of resources [19]. Li et al. consider that WSC projects have not yet formed a mature market-based management mechanism in China, which can easily cause malicious competition in the industry [20]. As a result, this article determines the risk evaluation indicators of the contract signing stage, such as: information risk, technical risk, and market competition risk.
- (2)
- Investment stage
Sustainable funding is an important guarantee for the implementation of the project. In the investment stage, water-saving service operators need to finance to ensure the progress of the project, and its financing channel mainly comes from commercial banks [21]. At the same time, due to the long payback period of investment in water-saving contract projects, the bank’s interest rate may increase during the project, which will also affect the company’s financing costs and reduce the final profit of water-saving service operators [7]. Therefore, this article determines the risk indicators of the investment stage, such as: financing risk and interest rate risk.
- (3)
- Implementation stage
The implementation stage includes engineering construction, equipment procurement, installation, and commissioning [26]. In this stage, construction safety directly affects the process and construction cycle of the WSC projects [22]. In addition, some external factors also increase the risk of the implementation stage, such as: policy changes [20], force majeure [23], and inflation [24]. Policy changes may directly affect the enthusiasm of water-saving service operators, so as to affect the final quality of the project; the risk of force majeure will directly lead to the termination of the project; the impact of inflation is the same as the increase in bank interest rates, which will reduce the final profit of the project. In summary, this article determines the risk indicators of the implementation stage as: construction risk, policy risk, force majeure risk, and inflation risk.
- (4)
- Benefit-sharing stage
After the implementation stage is over, it enters the benefit-sharing stage. At this stage, water-saving service operators are responsible for project operation and equipment maintenance. At the same time, it recovers investment costs and obtains reasonable profits by sharing water-saving benefits. Li et al. pointed out that the depreciation rate of the equipment would greatly affect the operating costs, so they suggested strict maintenance of the equipment [20]. The payment default of the water user is also one of the important risks in the benefit-sharing stage. If water users have weak credit awareness or cannot reach the predetermined water consumption due to their own economic problems, the investment of the WSC projects will not be recovered [6]. The fluctuation of water prices will affect the payback period of the WSC projects [25]. As mentioned above, this article determines the risk indicators in the benefit-sharing stage as: facility depreciation risk, payment risk, and water price change risk.
2.2. Multielement Connection Degree Set Pair Analysis
2.2.1. Basic Theory of Set Pair Analysis
The set pair analysis (SPA), proposed by Zhao in 1989, is a modified uncertainty theory considering both certainties and uncertainties as an integrated certain–uncertain system and depicting the certainty and uncertainty systematically from three aspects as identity, discrepancy, and contrary [27]. In set pair analysis, the connection degree is usually expressed as follows:
where is the identity degree, the discrepancy degree, the contradictory degree, and ; is the 3-element connection degree; is the uncertainty coefficient of discrepancy, which has different values in [−1, 1]; is the uncertainty coefficient of contradiction, which has value of −1.
2.2.2. Multielement Connection Degree and Partial Connection Degree
In Equation (1), is the measurement between identity degree and contradictory degree with uncertainty. This item could be often expanded in actual applications. The expanded equation is as follows [28]:
where in Equation (2) is the n-element connection degree;;;.
Similar to the concept of derivatives, the partial connection degree could be used to describe the development tendency of the connection degree. The first-order and second-order partial connection degree of the multielement connection degree could be described as follows [29]:
First-order partial connection degree:
where , , , …, . This equation describes the development trend from to . Its essence is the n − 1-element connection degree, which could be used to describe the development trend of Equation (2).
Second-order partial connection degree:
Similar to Equation (3), Equation (4) is the n − 2-element connection degree which could use to describe the development trend of Equation (3), where , , , …, .
In practical applications, system risks are often divided into five levels, namely: low, relatively low, medium, relatively high, and high risks. Therefore, the five-element connection degree is often used to analyze the level and trend of risk. Its expression is:
If is taken as the reference set and define it as low risk, then represents relatively low risk, medium risk, relatively high risk, and high risk.
2.2.3. Set Pair Potential
When , the ratio is the set pair potential [30], which is expressed as:
When, is at the same potential, which means that the risk is on the low side. When , is at the equal potential, which means the risk is at a medium size. When , is at opposite potential, which means that the risk is on the high side.
When using the five-element connection degree for risk analysis, the ratio can show the situation of risk, but it fails to classify the level of risk that needs to be determined by the size of b, c, and d. According to the size of b, c, and d, the risks in the situation of the same potential and opposite potential can be divided into 65 levels (as shown in Appendix A). When is at the same potential, the higher the level (Level 1 is the highest level), the lower the risk; when is at the opposite potential, the higher the level, the higher the risk.
The concept of set pair potential can also be applied to first-order and second-order partial connection degree, which is expressed as:
where is the set pair potential of first-order partial connection degree, and is the set pair potential of second-order partial connection degree. and can be used to describe the trend of the risk, as shown in Appendix B.
2.3. Risk Assessment Process of Water-Saving Contract Project Based on Five-Element Connection Degree
- (1)
- Calculate the index weight by entropy method
In order to eliminate the subjectivity of experts in evaluating each risk, this article uses the entropy method to calculate the weight of risk indicators. The calculation steps are as follows:
- Build the judgment matrix B, namely:
In Equation (9), is the number of risk assessment indicators, and is the number of experts.
- Calculate the entropy of the indicator :
- Calculate the weight of the indicator :where and .
- (2)
- Risk assessment based on the five-element connection degree
After determining the index weight , the calculation equation of the five-element connection degree can be obtained using Equation (13).
where is the occurrence probability matrix of the risk; is the coefficient matrix of the five-element connection degree; ( = 1, 2, ⋯, n; = 1, 2, ⋯, 5; means low risk, means relatively low risk, means medium risk, means relatively high risk, means high risk). Among them, is the number of experts who determine the risk indicator as risk level , and N is the total number of experts. Finally, we can figure out , , , and .
In the actual analysis, it is usually difficult to encounter equal potential. Therefore, this article ranks the risk level into 5 levels according to the five-element degree of the similar potential and the inverse potential, namely: high-risk level (Levels 1–26 of inverse potential), relatively high-risk level (Levels 27–52 of inverse potential), medium-risk level (Levels 53–65 of inverse potential, Levels 53–65 of the same potential), relatively low-risk level (Levels 27–52 of the same potential), and low-risk level (Levels 1–26 of the same potential). At the same time, use the set pair potential of the first-order partial connection degree and the second-order partial connection degree to analyze the trend of risk, which can be divided into 6 types: accelerated decline, decelerated decline, decelerated ascent, accelerated ascent, uniform decline, and uniform ascent.
2.4. Data Collection
This article adopts the entropy method to determine the weight of the risk indicator. In order to obtain in Equation (9), the evaluation of the expert on the risk indicator , this article adopts the interval classification method and requires 5 experts to score it. The scoring table is shown in Table 2. Five experts are from Hebei University of Engineering, North China University of Water Resources and Electric Power, Hohai University, Beijing Guotai Water-Saving Development Co., Ltd., and the Yellow River Conservancy Commission of the Ministry of Water Resources. Among them, Hebei University of Engineering and Beijing Guotai Water-Saving Development Co., Ltd. are the participants in China’s first water-saving contract project; North China University of Water Resources and Electric Power and Hohai University are specialized universities for China’s water conservancy and hydropower research; the Yellow River Conservancy Commission of the Ministry of Water Resources belongs to MWRC.
In order to obtain the risk occurrence probability of in Equation (13), this article uses the Likert five-point scale method to design the questionnaire. In the Likert five-point scale, 1 means low risk, 2 means relatively low risk, 3 means medium risk, 4 means relatively high risk, 5 means high risk. In this article, 300 questionnaires were distributed to staff members of water-saving service operators (including the technical manager, financial manager, procurement manager, and project manager) from 13 water-saving contract pilot projects, and 276 valid questionnaires were finally obtained. The descriptive statistics results are shown in Table 3
In this paper, Cronbach’s Alpha is used for the reliability test. The results show that Cronbach’s Alpha of the questionnaire is 0.912 (>0.9), indicating that the questionnaire has good reliability. The results are shown in Table 4
3. Results
The weight of each risk and their five- element connection degree are shown in Table 5.
As shown in Table 5, , . It is at Level 47 of the opposite potential, which means the risk in the contract signing stage is relatively high. In this stage, the audit risk is at Level 9 of the opposite potential, which is at a high-risk level; technical risk is at Level 25 of the same potential, which is at a low-risk level; the market competition risk is at Level 61 of the opposite potential, which is at a medium-risk level.
, . It is at Level 3 of the same potential, which means the risk of this stage is low. In this stage, financing risk is at Level 25 of the opposite potential, which is at a high-risk level; technical risk is at Level 25 of the same potential, which is at a low-risk level.
, . It is at Level 25 of the same potential, which means the risk of this stage is low. In this stage, construction risk, policy risk, force majeure risk, and inflation risk are at Levels 7, 21, 19, and 25 of the same potential, respectively, which means they are all at low-risk levels.
, . It is at Level 21 of the same potential, which means the risk of this stage is low. In this stage, facility depreciation risk and water price change risk are at Levels 21 and 19 of the same potential, respectively, which means they are at a low-risk level; payment risk is at Level 9 of the opposite potential, which is at a high-risk level.
, . It is at Level 19 of the same potential, which means the overall risk of the WSC project is low. Therefore, WSC projects are suitable for development in China.
In each stage of the WSC project, the contract signing stage is at a relatively high level of risk; the investment stage, implementation stage, and benefit-sharing stage are at a low-risk level. Therefore, the contract signing stage is the focus of risk control in the WSC project. From the perspective of each risk, audit risk, financing risk, and payment risk are at a high-risk level, they are the primary concern in risk control; market competition risk is at a medium-risk level, it is the secondary concern in risk control; the remaining risks are at a low-risk level, but it does not mean that these risks can be ignored, because the risk level may be easily affected by factors such as national development strategy, overall economic level, management technology, and market resource allocation as the WSC project is still in its infancy in China. Therefore, it is necessary to analyze and of each risk, as shown in Table 6.
As shown in Table 6, is at the opposite potential while is at the same potential, which means the risk of contract signing stage has a trend of decelerated ascent according to Appendix B. In this stage, audit risk and market competition risk have a trend of accelerated ascent, and technical risk has a trend of accelerated decline.
is at the same potential while is at the opposite potential, which means the risk of investment stage has a trend of decelerated decline. In this stage, financing risk has a trend of accelerated ascent, and interest rate risk has a trend of accelerated decline.
and are both at the same potential, which means the risk of implementation stage has a trend of accelerated decline. In this stage, construction risk, policy risk, and force majeure risk have a trend of accelerated decline, and inflation risk has a trend of decelerated ascent.
and are both at the same potential, which means the risk of the benefit-sharing stage has a trend of accelerated decline. In this stage, facility depreciation risk and water price change risk have a trend of accelerated decline, and payment risk has a trend of decelerated decline.
is at the opposite potential while is at the same potential, which means the overall risk of the WSC project has a trend of decelerated ascent. Although the overall risk of the WSC project is low as we concluded before, it shows a trend of decelerated ascent. This indicates that there are some potential high risks in WSC projects. From the perspective of each risk, audit risk and financing risk are not only at a high-risk level but also show a trend of accelerated ascent, so they are at the highest risk. Although the market competition risk is at a medium-risk level, it shows a trend of accelerated ascent, so it should also be considered as high risk. Payment risk is at a high-risk level, it shows a trend of decelerated decline; while inflation risk is at a low-risk level, it shows a trend of decelerated ascent. For these two risks, based on conservative principles, the former should still be treated as high risk, while the latter should be treated as medium risk. The remaining risks are all at a low-risk level and show a trend of accelerated decline, so their impact can be ignored under normal circumstances.
4. Discussion
In this section, we focus on discussing the risk level and risk trend of the WSC projects, and then put forward some policy recommendations for the high risks.
4.1. Audit Risk
Audit risk is not only at a high-risk level but also shows a trend of accelerated ascent. After interviewing the managers of water-saving service operators, it is concluded that the audit risk is at a high-risk level for the following two reasons: (1) For urban permanent residents, water-saving transformation can save costs in the long run. Therefore, these water users will deliberately over-report their water consumption in order to allow water-saving service operators to transform their water supply facilities, which will result in a longer payback period for water-saving service operators; (2) For rural water users who need agricultural irrigation, it is difficult to accurately assess their water consumption due to the influence of climate, environment and market demand, which leads to the uncertainty of investment payback period of water-saving service operators. Obviously, the payback period is the main factor that affects audit risk. The long payback period will increase the debt burden of the water-saving service operators [18]. Moreover, it will also increase the probability of other risks, resulting in some secondary risks. Therefore, audit risk shows a trend of accelerated ascent.
4.2. Financing Risk
As same as audit risk, financing risk is also at a high-risk level with a trend of accelerated ascent. In terms of financing risks, credit, mortgage, and loan mechanisms have not been established for WSC projects in the bank’s financial system, which is the main reason for the high financing risk [31]. First of all, WSC projects are still in their infancy in China, and water-saving service operators have not yet obtained good credit ratings from the credit evaluation departments of financial institutions. Second, assets formed by WSC projects, such as equipment and contract receivables, can only be evaluated at the implementation stage and benefit-sharing stage. Banks and other financial institutions often do not recognize such assets or accept them as credit collateral during the investment stage. Thirdly, the technique and risk of the WSC projects are not well known by commercial banks, which greatly increases the cost of loan examination. According to the above reasons, the loan review of commercial banks will inevitably be stricter, and the requirements for loan guarantees will inevitably increase, making it more difficult for water-saving service operators to obtain financing. Li et al. pointed out that the water-saving service operators in China are generally small- and medium-sized enterprises. Unlike state-owned enterprises, these enterprises have difficulty obtaining financing as the market economy is not developed at a high level and the preferential policies are not strong enough [20]. In addition, commercial banks tend to lend to projects with short cycles and high returns [32]. Therefore, the majority of water-saving service operators will fall into a vicious circle of difficulty in obtaining loans, which leads financing risk to show a trend of accelerated ascent.
4.3. Market Competition Risk
Market competition risk is at a medium-risk level, but it has a trend of accelerated ascent, so it should also be regarded as a high-risk level. The high market competition risk of China’s WSC projects is mainly due to the monopoly of local water-saving service operators and state-owned enterprises. First of all, no clear industry access standard has been established for WSC projects in China, and there is a lack of authoritative evaluation standard for water-saving efficiency and service level, which has led to irregular operation and market monopoly by some local water-saving service operators [33]. Second, state-owned enterprises have monopolized almost all large-scale WSC projects with their unique resource endowments (https://wsmc-china.com/home/main.html), these resource endowments include advanced technology, standardized management, high reliability, and state subsidies [34]. Local monopolies can be eliminated by regulating the market, but the monopoly of state-owned enterprises is difficult to change in China. As the current trend of “guojingmingtui” (the retreat of the private sector and advancement of state-owned enterprises) in China becomes more and more intense [35], the market competition risk caused by the monopoly of state-owned enterprises has a trend of accelerated ascent.
4.4. Payment Risk
Payment risk is at a high-risk level, it shows a trend of decelerated decline. Based on conservative principles, it should be treated as high risk. After interviewing the managers of water-saving service operators, it is concluded that the reasons for the high payment risk are customer default and business problems. There are two main cases of customer default: (1) Water users do not pay the water-saving benefits belonging to water-saving service operators; (2) As other water-saving operators gave more favorable terms, the water user breached the contract and resigned the contract with other water-saving service operators. The business problem refers to the customer’s inability to reach the expected water consumption due to economic and demand pressures. In the final analysis, customer defaults are caused by customers’ low moral standards and creditworthiness, and customer’s business problems are caused by inaccurate assessments of customers’ economic level and water consumption. Wang et al. believe that the application of blockchain and big data can help companies obtain more customer information, so that they can conduct a comprehensive evaluation of customers [36]. At present, blockchain and big data have begun to be applied in China in terms of information sharing, so the payment risk will be reduced in the long run [37].
4.5. Inflation Risk
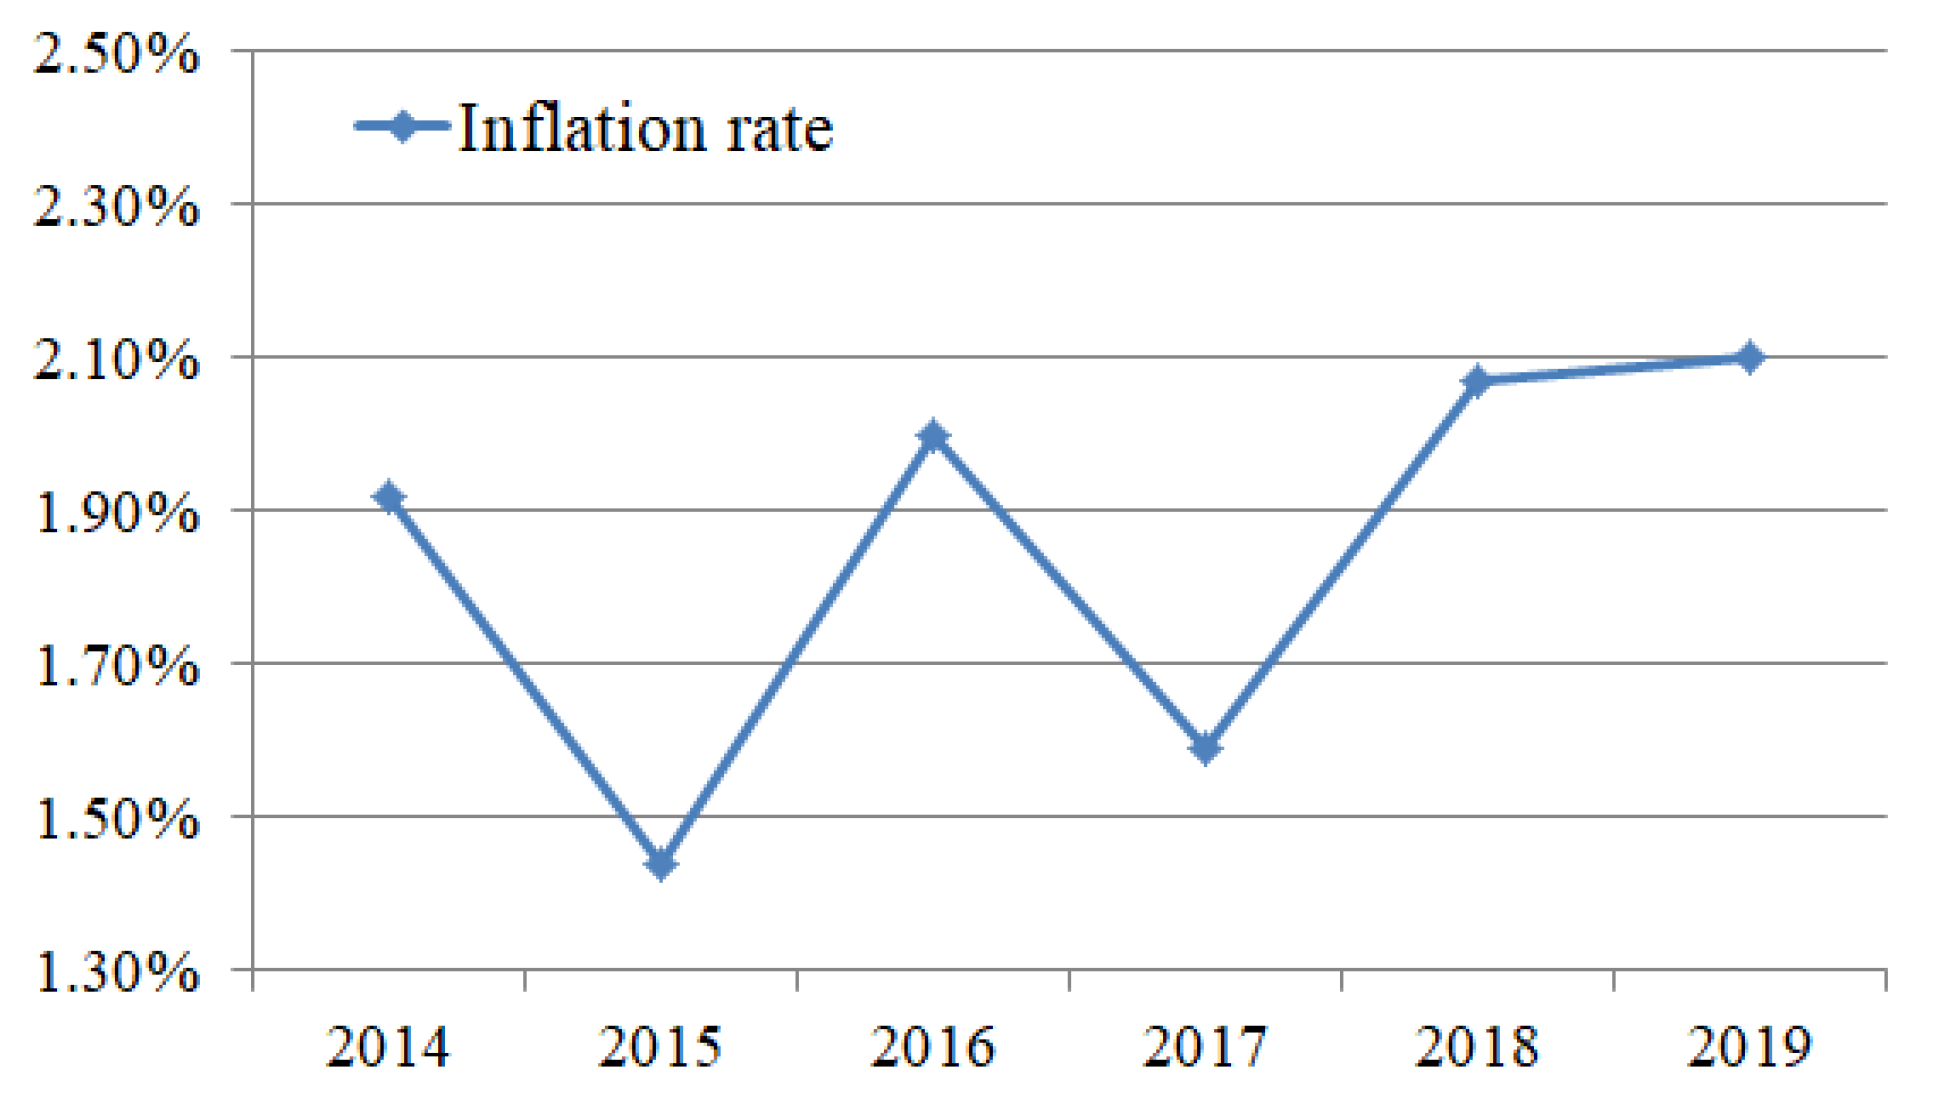
Inflation risk is at a low-risk level, but it shows a trend of decelerated ascent, so it should be regarded as a medium level risk. Yadav et al. compared the inflation rates of China, the United States, and India. Their research shows that the inflation rates of China and the United States are basically the same and are at a relatively low level, while the inflation rate of India is much higher than that of China and the United States [38]. However, although the risk of inflation is very low in China, it has a steady upward trend, which is related to China’s currency oversupply in recent years [39], and China’s inflation rate in recent years has also proved this trend (as shown in Figure 2).
4.6. Other Risks
The remaining risks are all at a low-risk level and show a trend of accelerated decline. Among these risks, technical risks, construction risks, and facility depreciation risks are technical and management risks. Such risks can be reduced significantly by the accumulation of project experience and the rapid development of technologies, so the risks show an accelerated decline.
Interest rate risk, policy risk, force majeure risk, and water price change risk are risks outside of technology and management, which are greatly affected by the fluctuations of the external environment.
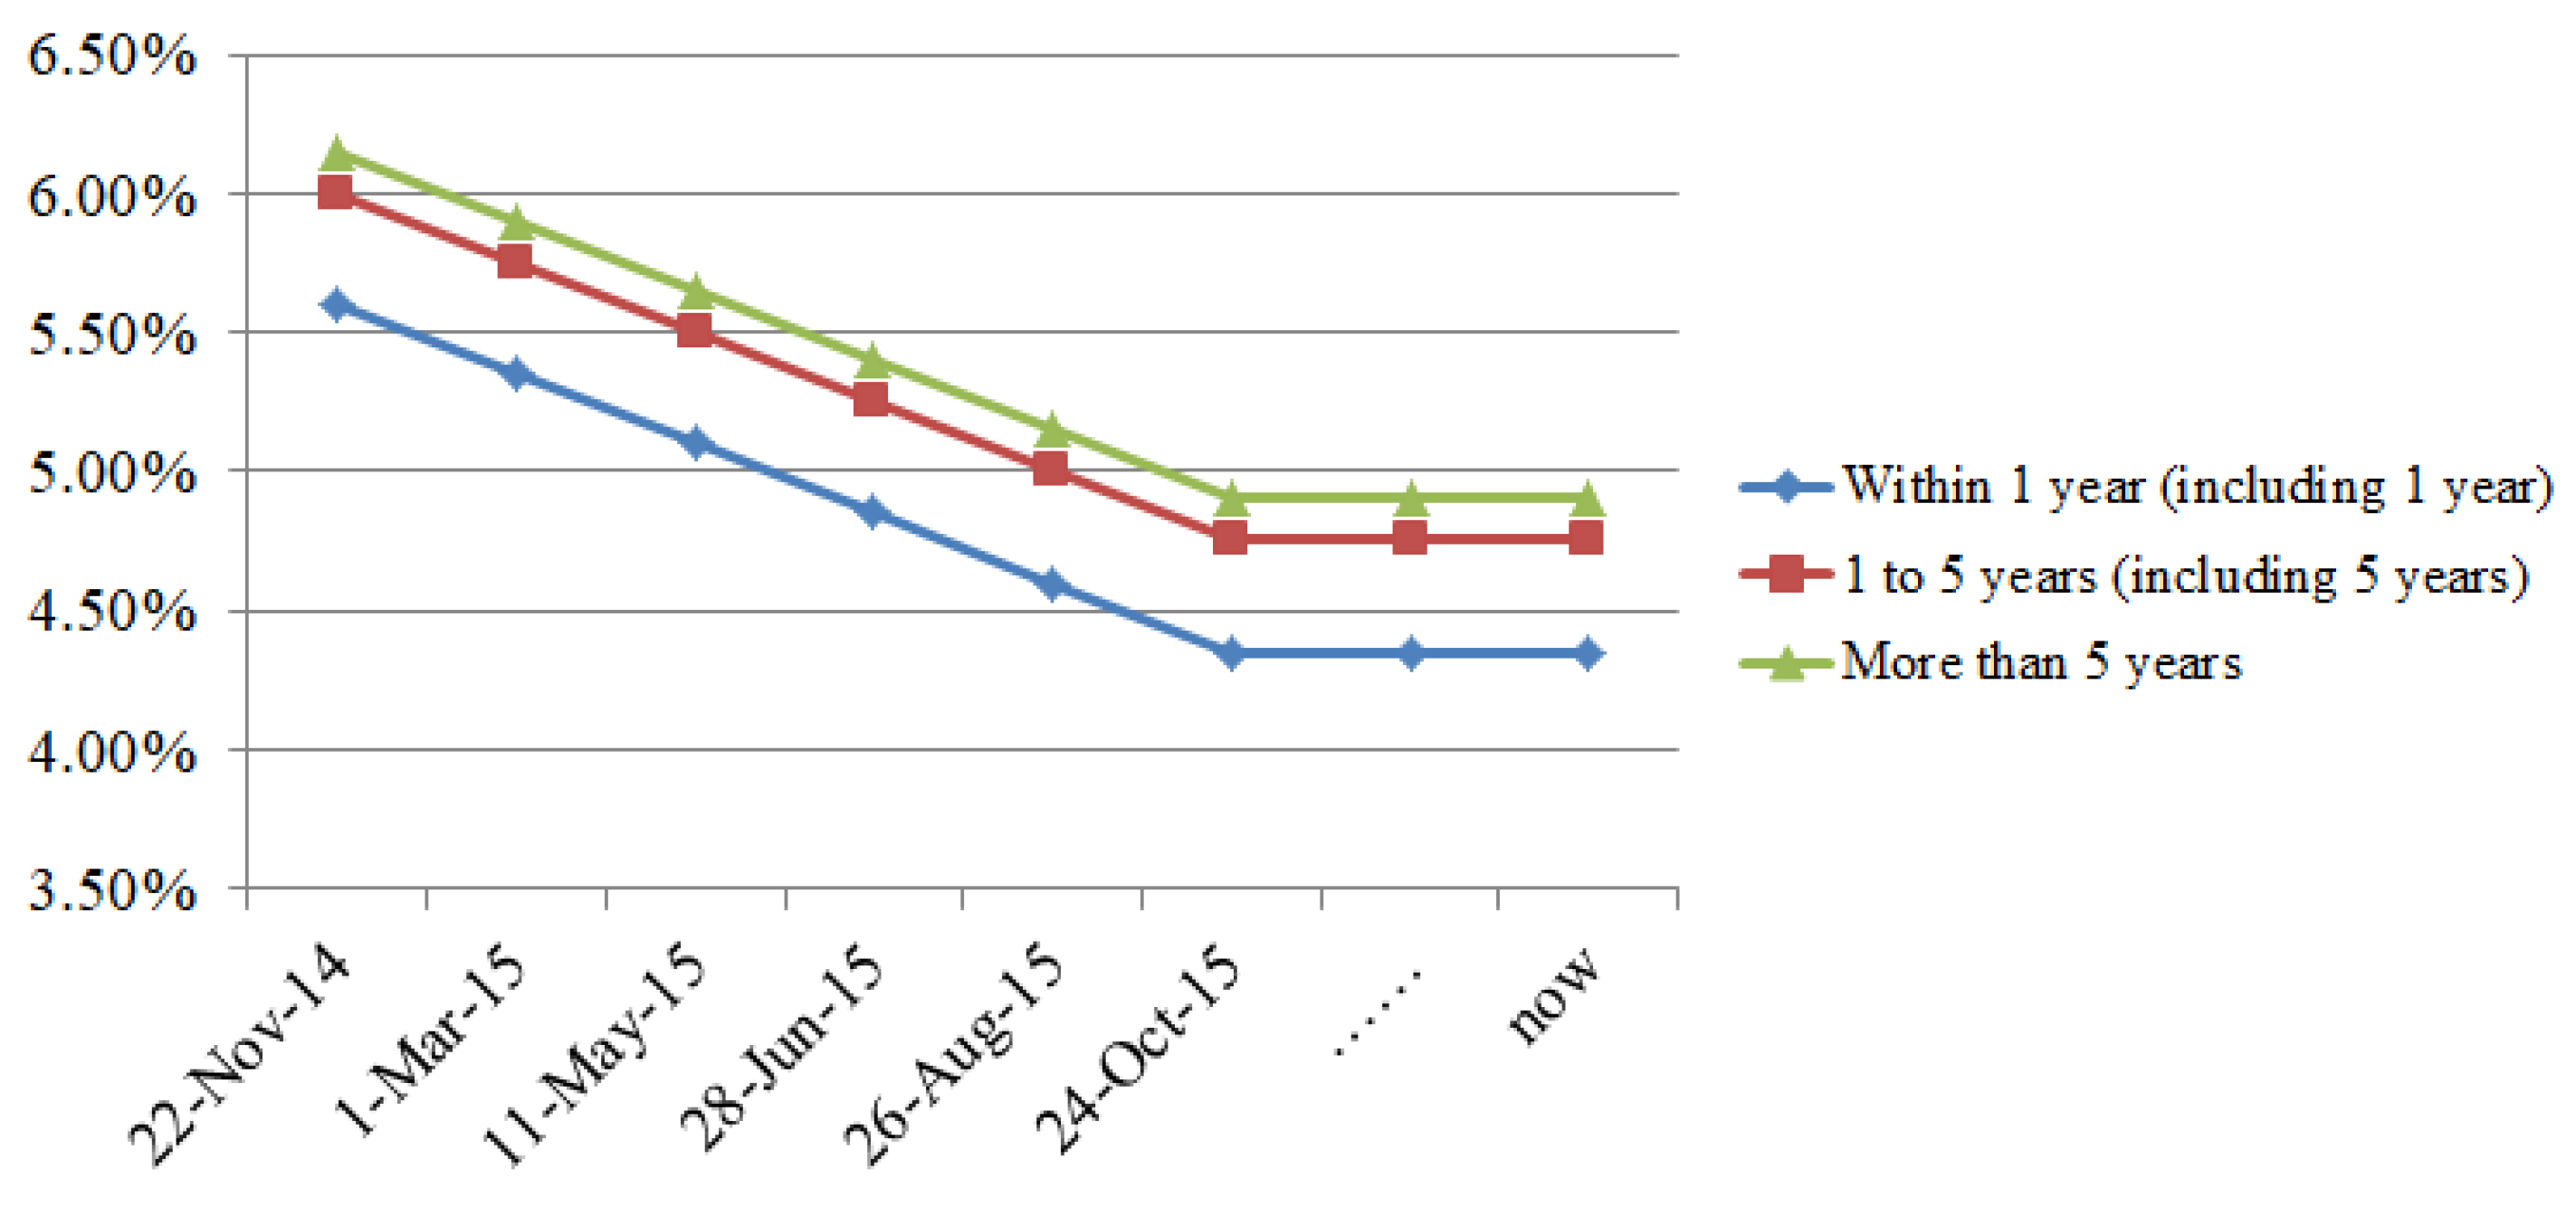
In recent years, in order to promote economic development, China has continuously cut interest rates. The benchmark lending rate of China’s central bank showed a continuous and large-scale decline (by 1.25%) from 22 November 2014 to 24 October 2015, and remained stable after 24 October 2015 [40], as shown in Figure 3. Therefore, the interest rate risk has a trend of accelerated decline.
For the policy risk, although the preferential policies for water-saving contract projects are not enough at present [20], related policies are still being introduced [41]. Therefore, policy risk has a trend of accelerated decline.
We have counted the force majeure events encountered in 13 water-saving contract pilots, and the results showed that none of the projects were affected by force majeure. Therefore, it can be seen that the force majeure risk is low. In water-saving contract projects, except for the core technologies of water-saving, infrastructure construction takes up the majority of the projects. With the continuous accumulation of experience in China’s infrastructure construction, the impact of force majeure on it has become smaller and smaller [42]. Therefore, Force majeure risk has a trend of accelerated decline.
China’s water price has been at a low level due to the government’s macrocontrol [43], and the overall water price in China has shown a downward trend since 2014 (http://www.h2o-china.com/price/). Therefore, the risk of water price changes has a trend of accelerated decline.
5. Conclusions
This paper uses the literature analysis method to determine the risks in the life cycle of the WSC project, and uses the multielement connection degree set pair analysis to evaluate the level and trend of the risks. The results show:
- (1)
- The overall risk of China’s WSC projects is low, so water-saving contract projects are very suitable for promotion in China. However, the overall risk shows a trend of decelerated ascent, which shows that there are some potential high-risk factors in China’s WSC projects.
- (2)
- Among the many risks of the WSC projects, audit risk, financing risk, and payment risk are at a high-risk level; market competition risk is at a medium-risk level; technical risk, interest rate risk, construction risk, policy risk, inflation risk, facility depreciation risk, and water price change risk are at low-risk level.
- (3)
- Among the medium and high risks, audit risk, financing risk, and market competition risk have a trend of accelerated ascent, while payment risk has a trend of decelerated decline; in low risks, inflation risk has a trend of decelerated ascent, while the remaining risks have a trend of accelerated decline.
In summary, audit risk, financing risk, market competition risk, payment risk, and inflation risk are the risks that should be focused on in water-saving contract projects. Since inflation risk can only be avoided through financial analysis, and is not controllable, this article proposes the following recommendations for audit risk, financing risk, market competition risk, and payment risk:
- (1)
- Audit risk and payment risk
Audit risk and payment risk can be reduced through effective third-party management mechanisms. Therefore, it is necessary to cultivate a group of qualified third-party management institutions for WSC projects. These institutions not only supervise the performance of contracts by water users and water-saving service operators, but also coordinate and arbitrate contradictions between both parties.
- (2)
- Market competition risk
China has not yet formed a standard market competition environment. In today’s economic globalization, China should increase international cooperation, learn from the mature experience and models accumulated by other countries in EPC projects, and actively create a good market-oriented competition environment, so as to ensure the high quality and sustainable development of the WSC projects.
- (3)
- Financing risk
The financing difficulty of small- and medium-sized enterprises is a universal problem, which does not only exist in WSC projects. In order to help water-saving service operators obtain financing, special funds for WSC projects in the banking system could be considered; Secondly, in order to solve the loan guarantee problem, water-saving service operators should be allowed to use the improved technology as collateral. Finally, insurance mechanisms can be introduced into ESC projects, that is, taking insurance premiums as a means of financing.
Author Contributions
Conceptualization, Q.L. and M.Y.W.; data curation, Z.S., D.Y., and R.Z.; investigation, Z.S. and R.Z.; methodology, Q.L. and Z.S.; software, Z.S.; supervision, M.Y.W., D.Y., and C.W.; writing—original draft preparation, Q.L. and Z.S.; writing—review and editing, M.Y.W. and C.W. All authors have read and agreed to the published version of the manuscript.
Funding
Australian Research Council: DP170104138; National Social Science Fund: 18BGL006; the Major Projects of the Key Research Base of Humanities and Social Sciences of the Ministry of Education: 18JJD790018.
Conflicts of Interest
The authors declare no conflict of interest.
Appendix A

Table A1.
The rank of five-element connection degree of similar potential.
| 1 | 23 | 45 | |||
| 2 | 24 | 46 | |||
| 3 | 25 | 47 | |||
| 4 | 26 | 48 | |||
| 5 | 27 | 49 | |||
| 6 | 28 | 50 | |||
| 7 | 29 | 51 | |||
| 8 | 30 | 52 | |||
| 9 | 31 | 53 | |||
| 10 | 32 | 54 | |||
| 11 | 33 | 55 | |||
| 12 | 34 | 56 | |||
| 13 | 35 | 57 | |||
| 14 | 36 | 58 | |||
| 15 | 37 | 59 | |||
| 16 | 38 | 60 | |||
| 17 | 39 | 61 | |||
| 18 | 40 | 62 | |||
| 19 | 41 | 63 | |||
| 20 | 42 | 64 | |||
| 21 | 43 | 65 | |||
| 22 | 44 | ||||
Table A2.
The rank of five-element connection degree of inverse potential.
| 1 | 23 | - | |||
| 2 | 24 | 46 | |||
| 3 | 25 | 47 | |||
| 4 | 26 | 48 | |||
| 5 | 27 | 49 | |||
| 6 | 28 | 50 | |||
| 7 | 29 | 51 | |||
| 8 | 30 | 52 | |||
| 9 | 31 | 53 | |||
| 10 | 32 | 54 | |||
| 11 | 33 | 55 | |||
| 12 | 34 | 56 | |||
| 13 | 35 | 57 | |||
| 14 | 36 | 58 | |||
| 15 | 37 | 59 | |||
| 16 | 38 | 60 | |||
| 17 | 39 | 61 | |||
| 18 | 40 | 62 | |||
| 19 | 41 | 63 | |||
| 20 | 42 | 64 | |||
| 21 | 43 | 65 | |||
| 22 | 44 | ||||
Appendix B
Table A3.
Trend curve of the risk.
| Same potential | Same potential | Opposite potential | |
| Same potential | Opposite potential | Same potential | |
| Change type | accelerated decline | decelerated decline | decelerated ascent |
| Change curve |  |  |  |
| Opposite potential | Same potential | Opposite potential | |
| Opposite potential | Equal potential | Equal potential | |
| Change type | Accelerated ascent | Uniform decline | Uniform ascent |
| Change curve |  |  |  |
References
- Su, X.; Kang, S. Research advances and key topics on optimal allocation of water resources based on ecosystem in the arid areas. Trans. Chin. Soc. Agric. Eng. 2005, 21, 167–172. [Google Scholar]
- Rogers, S.; Chen, D.; Jiang, H.; Rutherfurd, I.; Wang, M.; Webber, M.; Crow-Miller, B.; Barnett, J.; Finlayson, B.; Jiang, M.; et al. An integrated assessment of China’s South—North Water Transfer Project. Geogr. Res. 2020, 58, 49–63. [Google Scholar] [CrossRef]
- Guo, H.; Chen, X.; Dong, Z.; Zhang, H. Construction method of water right trading based on water-saving management contract. Water Resour. Prot. 2019, 35, 33–38. [Google Scholar]
- Guo, H.; Chen, X.; Liu, J.; Zhang, H.; Svensson, J. Joint analysis of water rights trading and water-saving management contracts in China. Int. J. Water Resour. Dev. 2020, 36, 716–737. [Google Scholar] [CrossRef]
- Mills, E.; Kromer, S.; Weiss, G.; Mathew, P.A. From volatility to value: Analysing and managing financial and performance risk in energy savings projects. Energy Policy 2006, 34, 188–199. [Google Scholar] [CrossRef]
- Lee, P.; Lam, P.T.I.; Lee, W.L. Risks in energy performance contracting (EPC) projects. Energy Build. 2015, 92, 116–127. [Google Scholar] [CrossRef]
- Jinrong, H.; Enyi, Z. Engineering risk management planning in energy performance contracting in China. Syst. Eng. Procedia 2011, 1, 195–205. [Google Scholar] [CrossRef] [Green Version]
- Duan, X.; Chen, F. Research on the Financing Risk of Contract Energy Management Project Based on the Whole Life Cycle. Sci. Technol. Manag. Res. 2018, 38, 235–243. [Google Scholar]
- Wu, Z.; Dong, X.; Pi, G. Risk evaluation of China’s petrochemical Energy Performance Contracting (EPC) projects: Taking the Ningxia Petrochemical Company as an example. Nat. Gas Ind. 2017, 37, 112–119. [Google Scholar]
- Huang, Z.Y.; Zhang, Y.S.; Han, Y. Risk Identification and Comprehensive Evaluation in Energy Performance Contracting Projects in China. J. Eng. Manag. 2013, 27, 48–52. [Google Scholar]
- Garbuzova-Schlifter, M.; Madlener, R. AHP-based risk analysis of energy performance contracting projects in Russia. Energy Policy 2016, 97, 559–581. [Google Scholar] [CrossRef]
- RezaValipour, A.; HadiSarvari, N.; Noor, N.M.; Rashid, A.S.A. Analytic network process (ANP) to risk assessment of gas refinery EPC projects in Iran. J. Appl. Sci. Res. 2013, 9, 1359–1365. [Google Scholar]
- Guo, L. Current situation and prospect analysis of contracted water-saving management in China. China Water Resour. 2016, 15, 18–21. [Google Scholar]
- Zhao, K.Q. Set Pair Analysis and its Preliminary Application; Zhejiang Science and Technology Press: Hangzhou, China, 2000; pp. 1–200. [Google Scholar]
- Cui, Y.; Feng, P.; Jin, J.; Liu, L. Water resources carrying capacity evaluation and diagnosis based on set pair analysis and improved the entropy weight method. Entropy 2018, 20, 359. [Google Scholar] [CrossRef] [Green Version]
- Gao, H. Information Risk Evaluation and Application: Based on the Set Pair Analysis. In Proceedings of the Fifth International Forum on Decision Sciences; Springer: Singapore, 2018; pp. 285–294. [Google Scholar]
- Zheng, X.; Xu, K.; Li, Q. A set pair analysis approach for dynamic risk assessment of tailings dam failure. In Proceedings of the 11th International Mine Ventilation Congress; Springer: Singapore, 2019; pp. 1024–1035. [Google Scholar]
- Changshun, L.; Xian, C.; Jianhua, Q. Revelation of foreign water audit to building water-saving society in China. China Water Kesources 2005, 13, 128–130. [Google Scholar]
- Sorrell, S. The economics of energy service contracts. Energy Policy 2007, 35, 507–521. [Google Scholar] [CrossRef]
- Li, R.; Leng, J. Risk of contract Water-saving management projects. Water Sav. Irrig. 2016, 11, 88–90. [Google Scholar]
- Zhu, J.; Chen, L.; Zhao, Y.; Xie, J. Analysis of cooperative game of benefit distribution of contract for water saving in college based on modified Shapley value method. In IOP Conference Series: Earth and Environmental Science, Proceedings of the 5th International Conference on Water Resource and Environment (WRE 2019), Macao, China, 16–19 July 2019; IOP Publishing: Bristol, UK, 2019. [Google Scholar]
- Seckler, D.; Sampath, R.K.; Raheja, S.K. An index for measuring the performance of irrigation management systems with an application. JAWRA J. Am. Water Resour. Assoc. 1988, 24, 855–860. [Google Scholar] [CrossRef]
- Da-li, G. Energy service companies to improve energy efficiency in China: Barriers and removal measures. Procedia Earth Planet. Sci. 2009, 1, 1695–1704. [Google Scholar] [CrossRef] [Green Version]
- Mizrachi, K. Force majeure in project finance: A comparative and practical analysis of risk allocation. J. Struct. Financ. 2006, 12, 76–97. [Google Scholar] [CrossRef]
- Ellis, J. Energy Service Companies (ESCOs) in Developing Countries; International Institute for Sustainable Development: Winnipeg, MB, Canada, 2010. [Google Scholar]
- Liu, D.; Yin, Q. Research on benefit distribution of contract water saving management based on modified Shapley model. J. Econ. Water Resour. 2016, 34, 53–58. [Google Scholar]
- Aili, Z.K.X. Set Pair Theory–A New Theory Method of Non-Define and Its Applications. Syst. Eng. 1996, 1, 3. [Google Scholar]
- Luan, W.; Lu, L.; Li, X.; Ma, C. Integrating Extended Fourier Amplitude Sensitivity Test and Set Pair Analysis for Sustainable Development Evaluation from the View of Uncertainty Analysis. Sustainability 2018, 10, 2435. [Google Scholar] [CrossRef] [Green Version]
- Yang, G.; Gao, H. Uncertain risk assessment of knowledge management: Based on set pair analysis. Sci. Program. 2016. [Google Scholar] [CrossRef] [Green Version]
- Feng, D.; Xu, Y.; Jia, C. A Risk Assessment of PPP Projects Based on Five-element Connection Number. J. Eng. Manag. 2017, 31, 77–82. [Google Scholar]
- Zeng, M.; Chen, C.; Duan, K.; Li, N.; OuYang, S. Life Cycle Risk Assessment for Energy Management Contract Project. East China Electr. Power 2012, 40, 1666–1670. [Google Scholar]
- Guo, L.; Liu, L. Investment modes of water-saving management contract. J. Econ. Water Resour. 2017, 35, 45–48. [Google Scholar]
- Yang, Z.; Zhao, J.; Wang, S. The development and problems of contract energy management in China. Energy Conserv. Environ. Prot. 2004, 12, 19–21. [Google Scholar]
- Brødsgaard, K.E. Moving Ahead in China: State-Owned Enterprises and Elite Circulation. China Int. J. 2020, 18, 107–122. [Google Scholar]
- Gu, T. The behavior of private entrepreneurs in an imperfect financial market. Econ. Bull. 2020, 40, 349–358. [Google Scholar]
- Wang, Q.; Su, M.; Li, R. Is China the world’s blockchain leader? Evidence, evolution and outlook of China’s blockchain research. J. Clean. Prod. 2020, 264, 121742. [Google Scholar] [CrossRef]
- Hayrutdinov, S.; Saeed, M.S.; Rajapov, A. Coordination of Supply Chain under Blockchain System-Based Product Lifecycle Information Sharing Effort. J. Adv. Transp. 2020. [Google Scholar] [CrossRef]
- Yadav, D.K.; Jameel, S. Pattern of GDP Growth Rate, Inflation, Interest Rate in Post Reform Period: A Comparative Analysis of India China and USA. Available online: https://papers.ssrn.com/sol3/papers.cfm?abstract_id=3643799 (accessed on 5 July 2020).
- Zheng, Y. A Study on the Relationship between the Independence of the Central Bank and China’s Inflation. Open J. Soc. Sci. 2020, 8, 263. [Google Scholar] [CrossRef] [Green Version]
- Fang, J.; Lau, C.K.M.; Lu, Z.; Tan, Y.; Zhang, H. Bank performance in China: A Perspective from Bank efficiency, risk-taking and market competition. Pac. Basin Financ. J. 2019, 56, 290–309. [Google Scholar] [CrossRef]
- Tang, Z. Refinement and strengthening of contract water-saving management fiscal and tax incentive policies. Environ. Econ. 2017, 22, 58–61. [Google Scholar]
- Zhong, A.C.; Hu, B.R.; Wang, C.M.; Xue, D.W.; He, E.L. The Impact of Urbanization on urban agriculture: Evidence from China. J. Clean. Prod. 2020, 276, 122686. [Google Scholar] [CrossRef]
- Li, J.; Lei, X.; Qiao, Y.; Kang, A.; Yan, P. The Water Status in China and an Adaptive Governance Frame for Water Management. Int. J. Environ. Res. Public Health 2020, 17, 2085. [Google Scholar] [CrossRef] [Green Version]
Figure 1.
Profit model of water-saving contract projects.

Figure 2.
China’s inflation rate (2014–2019).

Figure 3.
The benchmark lending rate of the People’s Bank of China (2014–2020).

Table 1.
Risk index system of WSC project.
| Stage | Indicator | Risk Consequences |
|---|---|---|
| Contract signing stage (CSS) | Audit risk (AR) [18] | Lengthen the payback period |
| Technical risk (TR) [19] | The actual water-saving amount cannot meet the requirements of the contract | |
| Market competition risk (MCR) [20] | Unfair competitive practice | |
| Investment stage (INS) | Financing risk (FR) [21] | Affect the progress of the project |
| Interest rate risk (IRR) [7] | Reduce the final profit of the project | |
| Implementation stage (IMS) | Construction risk (CR) [22] | Affects the process and construction cycle |
| Policy risk (PR) [20] | Affect the enthusiasm of water-saving service operators | |
| Force majeure risk (FMR) [23] | Lead to the termination of the project | |
| Inflation risk (IR) [24] | Reduce the final profit of the project | |
| Benefit-sharing stage (BSS) | Facility depreciation risk (FDR) [20] | Increase operating costs |
| Payment risk (PMR) [6] | Investment in water-saving projects will not be recovered | |
| Water price change risk (PCR) [25] | Affect the payback period |
Table 2.
The interval classification of the impact degree of the risk indicator.
| Influence Level | Scoring Interval | Influence Degree |
|---|---|---|
| I | [0,0.2] | Low |
| II | [0.2,0.4] | Relatively low |
| III | [0.4,0.6] | Medium |
| IV | [0.6,0.8] | Relatively high |
| V | [0.8,1] | High |
Table 3.
Descriptive statistical results of the questionnaire.
| Stage | Indicator | Mean | Std. Deviation | Skewness | Kurtosis |
|---|---|---|---|---|---|
| CSS | AR | 3.036 | 1.416 | −0.010 | −1.318 |
| TR | 2.587 | 1.423 | 0.284 | −1.305 | |
| MCR | 3.337 | 1.078 | −0.055 | −0.858 | |
| INS | FR | 3.007 | 1.404 | 0.154 | −1.289 |
| IRR | 2.638 | 1.506 | 0.222 | −1.467 | |
| IMS | CR | 2.815 | 1.467 | 0.170 | −1.385 |
| PR | 2.822 | 1.455 | 0.141 | −1.331 | |
| FMR | 2.884 | 1.386 | 0.061 | −1.214 | |
| IR | 2.449 | 1.370 | 0.363 | −1.256 | |
| BSS | FDR | 2.909 | 1.451 | 0.080 | −1.290 |
| PMR | 3.167 | 1.524 | −0.110 | −1.486 | |
| PCR | 2.786 | 1.394 | 0.063 | −1.278 |
Note: Source: calculated by SPSS 19.
Table 4.
Reliability Analysis of questionnaire on the risk level.
| N | % | ||
|---|---|---|---|
| Cases | Valid | 276 | 100.0 |
| Excluded | 0 | 0.0 | |
| Total | 276 | 100.0 | |
| Cronbach’s Alpha | N of items | ||
| 0.912 | 12 | ||
Note: Source: calculated by SPSS 19.
Table 5.
Calculation table of the five-element connection degree.
| Stage | Weight | Indicator | Weight | Five-Element Connection Degree | Situation | Level |
|---|---|---|---|---|---|---|
| CSS | 0.3876 | AR | 0.415 | 0.1848 + 0.2174i + 0.1848j + 0.2029k + 0.2101l | − | 9 |
| TR | 0.241 | 0.3406 + 0.1630i + 0.1812j + 0.1993k + 0.1123l | + | 25 | ||
| MCR | 0.344 | 0.0290 + 0.2174i + 0.3043j + 0.2862k + 0.1630l | − | 61 | ||
| Total | 1 | 0.1686 + 0.2042i + 0.2250j + 0.2306k + 0.1703l | − | 47 | ||
| INS | 0.2155 | FR | 0.616 | 0.1558 + 0.2790i + 0.1993j + 0.1341k + 0.2319l | − | 25 |
| IRR | 0.384 | 0.3732 + 0.1159i + 0.1522j + 0.2174k + 0.1377l | + | 25 | ||
| Total | 1 | 0.2393 + 0.2164i + 0.1812j + 0.1661k + 0.1957l | + | 3 | ||
| IMS | 0.2754 | CR | 0.248 | 0.2609 + 0.2174i + 0.1486j + 0.1920k + 0.1812l | + | 7 |
| PR | 0.237 | 0.2681 + 0.1739i + 0.2065j + 0.1703k + 0.1812l | + | 21 | ||
| FMR | 0.205 | 0.2283 + 0.1739i + 0.2464j + 0.1884k + 0.1630l | + | 19 | ||
| IR | 0.310 | 0.3732 + 0.1667i + 0.1739j + 0.2101k + 0.0761l | + | 25 | ||
| Total | 1 | 0.2907 + 0.1824i + 0.1902j + 0.1917k + 0.1449l | + | 25 | ||
| BSS | 0.1215 | FDR | 0.306 | 0.2464 + 0.1522i + 0.2536j + 0.1413k + 0.2065l | + | 21 |
| PMR | 0.404 | 0.1957 + 0.2029i + 0.1377j + 0.1667k + 0.2971l | − | 9 | ||
| PCR | 0.290 | 0.2754 + 0.1413i + 0.2355j + 0.2174k + 0.1304l | + | 19 | ||
| Total | 1 | 0.2343 + 0.1695i + 0.2015j + 0.1736k + 0.2210l | + | 21 | ||
| Total | 0.2265 + 0.1982i + 0.2027j + 0.1931k + 0.1839l | + | 19 | |||
Note: “+” means same potential, “−” means opposite potential.
Table 6.
Calculation of partial connection degree and trend analysis.
| Stage | Indicator | First-Order Partial Connection Degree | Situation | Second-Order Partial Connection Degree | Situation |
|---|---|---|---|---|---|
| CSS | AR | 0.4595 + 0.5405i + 0.4767j + 0.4913k | − | 0.4595 + 0.5314i + 0.4924j | − |
| TR | 0.6763 + 0.4736i + 0.4762j + 0.6396k | + | 0.5882 + 0.4986i + 0.4268j | + | |
| MCR | 0.1177 + 0.4167i + 0.5153j + 0.6371k | − | 0.2202 + 0.4471i + 0.4472j | - | |
| Total | 0.4522 + 0.4759i + 0.4938j + 0.5752k | − | 0.4872 + 0.4907i + 0.4619j | + | |
| INS | FR | 0.3583 + 0.5833i + 0.5978j + 0.3664k | − | 0.3805 + 0.4939i + 0.6200j | − |
| IRR | 0.7630 + 0.4323i + 0.4118j + 0.6122k | + | 0.6383 + 0.5121i + 0.4021j | + | |
| Total | 0.5230 + 0.5513i + 0.5333j + 0.4444k | + | 0.4868 + 0.5083i + 0.5454j | − | |
| IMS | CR | 0.5455 + 0.5940i + 0.4363j + 0.5145k | + | 0.4787 + 0.5765i + 0.4589j | + |
| PR | 0.6066 + 0.4572i + 0.5480j + 0.4845k | + | 0.5702 + 0.4548i + 0.5308j | + | |
| FMR | 0.5676 + 0.4138i + 0.5667j + 0.5361k | + | 0.5784 + 0.4220i + 0.5139j | + | |
| IR | 0.6912 + 0.4894i + 0.4529j + 0.7341k | − | 0.5855 + 0.5194i + 0.3815j | + | |
| Total | 0.6144 + 0.4896i + 0.4980j + 0.5696k | + | 0.5565 + 0.4958i + 0.4665j | + | |
| BSS | FDR | 0.6182 + 0.3751i + 0.6422j + 0.4063k | + | 0.6224 + 0.3687i + 0.6125j | + |
| PMR | 0.4910 + 0.5957i + 0.4524j + 0.3594k | + | 0.4518 +0.5684i + 0.5572j | − | |
| PCR | 0.6609 + 0.3750i + 0.5200j + 0.6251k | + | 0.6380 + 0.4190i + 0.4541j | + | |
| Total | 0.5802 + 0.4569i + 0.5372j + 0.4399k | + | 0.5595 + 0.4596i + 0.4541j | + | |
| Total | 0.5281 + 0.4920i + 0.5062j + 0.5321k | − | 0.5159 + 0.4926i + 0.4889j | + | |
Note: “+” means same potential, “−” means opposite potential.
© 2020 by the authors. Licensee MDPI, Basel, Switzerland. This article is an open access article distributed under the terms and conditions of the Creative Commons Attribution (CC BY) license (http://creativecommons.org/licenses/by/4.0/).
Share and Cite
MDPI and ACS Style
Li, Q.; Shangguan, Z.; Wang, M.Y.; Yan, D.; Zhai, R.; Wen, C. Risk Assessment of China’s Water-Saving Contract Projects. Water 2020, 12, 2689. https://doi.org/10.3390/w12102689
AMA Style
Li Q, Shangguan Z, Wang MY, Yan D, Zhai R, Wen C. Risk Assessment of China’s Water-Saving Contract Projects. Water. 2020; 12(10):2689. https://doi.org/10.3390/w12102689
Chicago/Turabian StyleLi, Qian, Ziheng Shangguan, Mark Yaolin Wang, Dengcai Yan, Ruizhi Zhai, and Chuanhao Wen. 2020. "Risk Assessment of China’s Water-Saving Contract Projects" Water 12, no. 10: 2689. https://doi.org/10.3390/w12102689
Note that from the first issue of 2016, this journal uses article numbers instead of page numbers. See further details here.